

Periodontal Disease and Other Adverse Health Outcomes Share Risk Factors, including Dietary Factors and Vitamin D Status


Abstract
1. Introduction
- Review the history of associations between periodontitis or PD and other adverse health outcomes and determine whether PD is a causal risk factor for those adverse health outcomes, such as CVD, diabetes, and respiratory diseases;
- Review the role of dietary risk factors for PD and other adverse health outcomes;
- Review the evidence that vitamin D reduces the risk of PD as well as other adverse health outcomes;
- Make recommendations regarding changes in dietary patterns and food groups and in serum 25-hydroxyvitamin D [25(OH)D] concentrations for reducing the risks of PD and other adverse health outcomes.
2. Associations between Periodontal Disease and Other Adverse Health Outcomes
3. Dietary Risk Factors for Periodontitis/Periodontal Disease and Other Adverse Health Outcomes

| Disease | Variable | Population | Approach | Finding | Ref. |
|---|---|---|---|---|---|
| T2DM | Processed meat | 184 countries | Comparative risk-assessment model to estimate the effect of 11 dietary factors, separately and jointly, on absolute and proportional burdens of new T2DM cases among adults globally and by age, sex, education, urbanicity, world region, and nation, in 1990 and 2018. | Attributable burden 20.3% (95% CI, 18.3–23.5%) | [68] |
| T2DM | Red meat | 184 countries | Cross-sectional study | Attributable burden 20.1% (95% CI, 19.0–21.2%) | [68] |
| CHD, incident | Meat, sausages | Germany, 200 cases, 255 controls | Risk per 100 g/d | HR = 2.55 (95% CI, 1.14–5.68) | [118] |
| IHD incident | Meat, 50 g/day; | Meta-analysis of 12 of 13 prospective studies, N = 1,427,989; cases, 32,630. Studies were conducted in Asia (n = 3), the US (n = 4), Australia (n = 1), Europe (n = 4), and for one multicountry cohort in the Americas, Asia, Africa, and Europe. | HR = 1.09 (95% CI, 1.06–1.22) | [119] | |
| IHD incident | Processed meat, 50 g/day | Meta-analysis of 10 of 13 prospective studies, N = 1,427,989; cases, 32,630 | HR = 1.18 (95% CI, 1.12–1.25) | [119] |
| Disease | Population | Approach | Finding | Ref. |
|---|---|---|---|---|
| Periodontitis | Harvard Health Professionals Follow-up Study 34,160 males aged 40–75, 2197 developed periodontitis | Prospective study, 1986–1998; Q1, 0.3 s/d; Q3, 1.3 s/d; Q5, 3.4 s/d | For Q5, mRR = 0.77 (95% CI, 0.66–0.89, ptrend < 0.001 | [71] |
4. Vitamin D Status Modifies Risk of Periodontitis/Periodontal Disease and Other Adverse Health Outcomes
- Measuring serum 25(OH)D concentrations for all prospective participants;
- Enrolling those with concentrations associated with increased risk for the expected outcome;
- Supplementing with vitamin D doses high enough to raise serum 25(OH)D concentration to maximize the effect of vitamin D;
- Normalizing all participants for potentially outcome-affecting variables not directly related to vitamin D, such as diet and vitamin A intake; and
- Measuring and analyzing results with respect to achieved 25(OH)D concentrations.
5. Discussion
6. Summary and Conclusions
Author Contributions
Funding
Institutional Review Board Statement
Informed Consent Statement
Data Availability Statement
Conflicts of Interest
References
- Moutsopoulos, N.M.; Madianos, P.N. Low-grade inflammation in chronic infectious diseases: Paradigm of periodontal infections. Ann. N. Y. Acad. Sci. 2006, 1088, 251–264. [Google Scholar] [CrossRef] [PubMed]
- Chapple, I.L.C.; Mealey, B.L.; Van Dyke, T.E.; Bartold, P.M.; Dommisch, H.; Eickholz, P.; Geisinger, M.L.; Genco, R.J.; Glogauer, M.; Goldstein, M.; et al. Periodontal health and gingival diseases and conditions on an intact and a reduced periodontium: Consensus report of workgroup 1 of the 2017 World Workshop on the Classification of Periodontal and Peri-Implant Diseases and Conditions. J. Periodontol. 2018, 89 (Suppl. S1), S74–S84. [Google Scholar] [CrossRef] [PubMed]
- Radaic, A.; Kapila, Y.L. The oralome and its dysbiosis: New insights into oral microbiome-host interactions. Comput. Struct. Biotechnol. J. 2021, 19, 1335–1360. [Google Scholar] [CrossRef] [PubMed]
- Abdulkareem, A.A.; Al-Taweel, F.B.; Al-Sharqi, A.J.B.; Gul, S.S.; Sha, A.; Chapple, I.L.C. Current concepts in the pathogenesis of periodontitis: From symbiosis to dysbiosis. J. Oral Microbiol. 2023, 15, 2197779. [Google Scholar] [CrossRef]
- Papapanou, P.N.; Sanz, M.; Buduneli, N.; Dietrich, T.; Feres, M.; Fine, D.H.; Flemmig, T.F.; Garcia, R.; Giannobile, W.V.; Graziani, F.; et al. Periodontitis: Consensus report of workgroup 2 of the 2017 World Workshop on the Classification of Periodontal and Peri-Implant Diseases and Conditions. J. Clin. Periodontol. 2018, 45 (Suppl. S20), S162–S170. [Google Scholar] [CrossRef]
- Kononen, E.; Gursoy, M.; Gursoy, U.K. Periodontitis: A Multifaceted Disease of Tooth-Supporting Tissues. J. Clin. Med. 2019, 8, 1135. [Google Scholar] [CrossRef]
- Najeeb, S.; Zafar, M.S.; Khurshid, Z.; Zohaib, S.; Almas, K. The Role of Nutrition in Periodontal Health: An Update. Nutrients 2016, 8, 530. [Google Scholar] [CrossRef]
- Takahashi, N.; Sulijaya, B.; Yamada-Hara, M.; Tsuzuno, T.; Tabeta, K.; Yamazaki, K. Gingival epithelial barrier: Regulation by beneficial and harmful microbes. Tissue Barriers 2019, 7, e1651158. [Google Scholar] [CrossRef]
- Park, D.Y.; Park, J.Y.; Lee, D.; Hwang, I.; Kim, H.S. Leaky Gum: The Revisited Origin of Systemic Diseases. Cells 2022, 11, 1079. [Google Scholar] [CrossRef]
- Vitkov, L.; Singh, J.; Schauer, C.; Minnich, B.; Krunic, J.; Oberthaler, H.; Gamsjaeger, S.; Herrmann, M.; Knopf, J.; Hannig, M. Breaking the Gingival Barrier in Periodontitis. Int. J. Mol. Sci. 2023, 24, 4544. [Google Scholar] [CrossRef]
- Cecoro, G.; Annunziata, M.; Iuorio, M.T.; Nastri, L.; Guida, L. Periodontitis, Low-Grade Inflammation and Systemic Health: A Scoping Review. Medicina 2020, 56, 272. [Google Scholar] [CrossRef] [PubMed]
- Nazir, M.; Al-Ansari, A.; Al-Khalifa, K.; Alhareky, M.; Gaffar, B.; Almas, K. Global Prevalence of Periodontal Disease and Lack of Its Surveillance. Sci. World J. 2020, 2020, 2146160. [Google Scholar] [CrossRef]
- Eke, P.I.; Borgnakke, W.S.; Genco, R.J. Recent epidemiologic trends in periodontitis in the USA. Periodontology 2020, 82, 257–267. [Google Scholar] [CrossRef] [PubMed]
- Grant, W.B.; Garland, C.F. The association of solar ultraviolet B (UVB) with reducing risk of cancer: Multifactorial ecologic analysis of geographic variation in age-adjusted cancer mortality rates. Anticancer Res. 2006, 26, 2687–2699. [Google Scholar]
- Kinane, D.F.; Chestnutt, I.G. Smoking and periodontal disease. Crit. Rev. Oral Biol. Med. 2000, 11, 356–365. [Google Scholar] [CrossRef]
- Hujoel, P.P.; Lingstrom, P. Nutrition, dental caries and periodontal disease: A narrative review. J. Clin. Periodontol. 2017, 44 (Suppl. S18), S79–S84. [Google Scholar] [CrossRef] [PubMed]
- Chaffee, B.W.; Weston, S.J. Association between chronic periodontal disease and obesity: A systematic review and meta-analysis. J. Periodontol. 2010, 81, 1708–1724. [Google Scholar] [CrossRef] [PubMed]
- Sanz, M.; Ceriello, A.; Buysschaert, M.; Chapple, I.; Demmer, R.T.; Graziani, F.; Herrera, D.; Jepsen, S.; Lione, L.; Madianos, P.; et al. Scientific evidence on the links between periodontal diseases and diabetes: Consensus report and guidelines of the joint workshop on periodontal diseases and diabetes by the International Diabetes Federation and the European Federation of Periodontology. J. Clin. Periodontol. 2018, 45, 138–149. [Google Scholar] [CrossRef]
- Polak, D.; Sanui, T.; Nishimura, F.; Shapira, L. Diabetes as a risk factor for periodontal disease-plausible mechanisms. Periodontology 2020, 83, 46–58. [Google Scholar] [CrossRef]
- Ezzati, M.; Lopez, A.D. Regional, disease specific patterns of smoking-attributable mortality in 2000. Tob. Control 2004, 13, 388–395. [Google Scholar] [CrossRef]
- Jiang, C.; Chen, Q.; Xie, M. Smoking increases the risk of infectious diseases: A narrative review. Tob. Induc. Dis. 2020, 18, 60. [Google Scholar] [CrossRef] [PubMed]
- Wang, P.; Song, M.; Eliassen, A.H.; Wang, M.; Fung, T.T.; Clinton, S.K.; Rimm, E.B.; Hu, F.B.; Willett, W.C.; Tabung, F.K.; et al. Optimal dietary patterns for prevention of chronic disease. Nat. Med. 2023, 29, 719–728. [Google Scholar] [CrossRef] [PubMed]
- Nigro, E.; Scudiero, O.; Monaco, M.L.; Palmieri, A.; Mazzarella, G.; Costagliola, C.; Bianco, A.; Daniele, A. New insight into adiponectin role in obesity and obesity-related diseases. Biomed. Res. Int. 2014, 2014, 658913. [Google Scholar] [CrossRef] [PubMed]
- Wlodarczyk, M.; Nowicka, G. Obesity, DNA Damage, and Development of Obesity-Related Diseases. Int. J. Mol. Sci. 2019, 20, 1146. [Google Scholar] [CrossRef]
- Shah, B.R.; Hux, J.E. Quantifying the risk of infectious diseases for people with diabetes. Diabetes Care 2003, 26, 510–513. [Google Scholar] [CrossRef]
- Giovannucci, E.; Harlan, D.M.; Archer, M.C.; Bergenstal, R.M.; Gapstur, S.M.; Habel, L.A.; Pollak, M.; Regensteiner, J.G.; Yee, D. Diabetes and cancer: A consensus report. CA Cancer J. Clin. 2010, 60, 207–221. [Google Scholar] [CrossRef]
- Habib, S.L.; Rojna, M. Diabetes and risk of cancer. ISRN Oncol. 2013, 2013, 583786. [Google Scholar] [CrossRef]
- Matheus, A.S.; Tannus, L.R.; Cobas, R.A.; Palma, C.C.; Negrato, C.A.; Gomes, M.B. Impact of diabetes on cardiovascular disease: An update. Int. J. Hypertens. 2013, 2013, 653789. [Google Scholar] [CrossRef]
- Ferreira, R.O.; Correa, M.G.; Magno, M.B.; Almeida, A.; Fagundes, N.C.F.; Rosing, C.K.; Maia, L.C.; Lima, R.R. Physical Activity Reduces the Prevalence of Periodontal Disease: Systematic Review and Meta-Analysis. Front. Physiol. 2019, 10, 234. [Google Scholar] [CrossRef]
- Manouchehr-Pour, M.; Bissada, N.F. Periodontal disease in juvenile and adult diabetic patients: A review of the literature. J. Am. Dent. Assoc. 1983, 107, 766–770. [Google Scholar] [CrossRef]
- Williams, J.B. Diabetic periodontoclasia. JADA 1928, 15, 523–529. [Google Scholar]
- Stahl, S.S.; Wisan, J.M.; Miller, S.C. The influence of systemic diseases on alveolar bone. J. Am. Dent. Assoc. 1952, 45, 277–283. [Google Scholar] [CrossRef]
- Loesche, W.J. Periodontal disease as a risk factor for heart disease. Compendium 1994, 15, 976. [Google Scholar]
- Beck, J.; Garcia, R.; Heiss, G.; Vokonas, P.S.; Offenbacher, S. Periodontal Disease and Cardiovascular Disease. J. Periodontol. 1996, 67 (Suppl. S10), 1123–1137. [Google Scholar] [CrossRef]
- Hujoel, P.P. Does chronic periodontitis cause coronary heart disease? A review of the literature. J. Am. Dent. Assoc. 2002, 133 (Suppl. S1), 31S–36S. [Google Scholar] [CrossRef] [PubMed]
- Pihlstrom, B.L.; Michalowicz, B.S.; Johnson, N.W. Periodontal diseases. Lancet 2005, 366, 1809–1820. [Google Scholar] [CrossRef] [PubMed]
- Hujoel, P. Dietary carbohydrates and dental-systemic diseases. J. Dent. Res. 2009, 88, 490–502. [Google Scholar] [CrossRef] [PubMed]
- Cleave, T.L.; Campbell, G.D. Diet and diverticulitis. Br. Med. J. 1966, 2, 50–51. [Google Scholar] [CrossRef]
- Yudkin, J. Pure, White and Deadly: The Problem of Sugar; Davis-Pointer, Ltd.: Loondon, UK, 1972. [Google Scholar]
- Monsarrat, P.; Blaizot, A.; Kemoun, P.; Ravaud, P.; Nabet, C.; Sixou, M.; Vergnes, J.N. Clinical research activity in periodontal medicine: A systematic mapping of trial registers. J. Clin. Periodontol. 2016, 43, 390–400. [Google Scholar] [CrossRef]
- Kumar, P.S. From focal sepsis to periodontal medicine: A century of exploring the role of the oral microbiome in systemic disease. J. Physiol. 2017, 595, 465–476. [Google Scholar] [CrossRef]
- Slots, J. Periodontitis: Facts, fallacies and the future. Periodontology 2017, 75, 7–23. [Google Scholar] [CrossRef]
- Pihlstrom, B.L.; Hodges, J.S.; Michalowicz, B.; Wohlfahrt, J.C.; Garcia, R.I. Promoting oral health care because of its possible effect on systemic disease is premature and may be misleading. J. Am. Dent. Assoc. 2018, 149, 401–403. [Google Scholar] [CrossRef] [PubMed]
- Beck, J.D.; Papapanou, P.N.; Philips, K.H.; Offenbacher, S. Periodontal Medicine: 100 Years of Progress. J. Dent. Res. 2019, 98, 1053–1062. [Google Scholar] [CrossRef]
- Bui, F.Q.; Almeida-da-Silva, C.L.C.; Huynh, B.; Trinh, A.; Liu, J.; Woodward, J.; Asadi, H.; Ojcius, D.M. Association between periodontal pathogens and systemic disease. Biomed. J. 2019, 42, 27–35. [Google Scholar] [CrossRef]
- Taylor, H.L.; Rahurkar, S.; Treat, T.J.; Thyvalikakath, T.P.; Schleyer, T.K. Does Nonsurgical Periodontal Treatment Improve Systemic Health? J. Dent. Res. 2021, 100, 253–260. [Google Scholar] [CrossRef]
- Hill, A.B. The Environment and Disease: Association or Causation? Proc. R. Soc. Med. 1965, 58, 295–300. [Google Scholar] [CrossRef] [PubMed]
- Potischman, N.; Weed, D.L. Causal criteria in nutritional epidemiology. Am. J. Clin. Nutr. 1999, 69, 1309S–1314S. [Google Scholar] [CrossRef] [PubMed]
- Lavigne, S.E.; Forrest, J.L. An umbrella review of systematic reviews of the evidence of a causal relationship between periodontal disease and cardiovascular diseases: Position paper from the Canadian Dental Hygienists Association. Can. J. Dent. Hyg. 2020, 54, 32–41. [Google Scholar]
- Li, C.; Lv, Z.; Shi, Z.; Zhu, Y.; Wu, Y.; Li, L.; Iheozor-Ejiofor, Z. Periodontal therapy for the management of cardiovascular disease in patients with chronic periodontitis. Cochrane Database Syst. Rev. 2017, 11, CD009197. [Google Scholar] [CrossRef]
- Lavigne, S.E.; Forrest, J.L. An umbrella review of systematic reviews examining the relationship between type 2 diabetes and periodontitis: Position paper from the Canadian Dental Hygienists Association. Can. J. Dent. Hyg. 2021, 55, 57–67. [Google Scholar]
- Lavigne, S.E.; Forrest, J.L. An umbrella review of systematic reviews of the evidence of a causal relationship between periodontal disease and adverse pregnancy outcomes: A position paper from the Canadian Dental Hygienists Association. Can. J. Dent. Hyg. 2020, 54, 92–100. [Google Scholar]
- Lavigne, S.E.; Forrest, J.L. An umbrella review of systematic reviews of the evidence of a causal relationship between periodontal microbes and respiratory diseases: Position paper from the Canadian Dental Hygienists Association. Can. J. Dent. Hyg. 2020, 54, 144–155. [Google Scholar]
- Lavigne, S.E. Evolving evidence for relationships between periodontitis and systemic diseases: Position paper from the Canadian Dental Hygienists Association. Can. J. Dent. Hyg. 2022, 56, 155–171. [Google Scholar] [PubMed]
- Veazie, S.; Vela, K.; Parr, N.J. Evidence Brief: Detection and Treatment of Dental Problems on Chronic Disease Outcomes; Department of Veterans Affairs (US): Washington, DC, USA, 2021.
- Sanz, M.; del Castillo, A.M.; Jepsen, S.; Gonzalez-Juanatey, J.R.; D’Aiuto, F.; Bouchard, P.; Chapple, I.; Dietrich, T.; Gotsman, I.; Graziani, F.; et al. Periodontitis and cardiovascular diseases: Consensus report. J. Clin. Periodontol. 2020, 47, 268–288. [Google Scholar] [CrossRef]
- Herrera, D.; Sanz, M.; Shapira, L.; Brotons, C.; Chapple, I.; Frese, T.; Graziani, F.; Hobbs, F.D.R.; Huck, O.; Hummers, E.; et al. Association between periodontal diseases and cardiovascular diseases, diabetes and respiratory diseases: Consensus report of the Joint Workshop by the European Federation of Periodontology (EFP) and the European arm of the World Organization of Family Doctors (WONCA Europe). J. Clin. Periodontol. 2023, 50, 819–841. [Google Scholar] [CrossRef] [PubMed]
- Esposito, K.; Ciotola, M.; Carleo, D.; Schisano, B.; Sardelli, L.; Di Tommaso, D.; Misso, L.; Saccomanno, F.; Ceriello, A.; Giugliano, D. Post-meal glucose peaks at home associate with carotid intima-media thickness in type 2 diabetes. J. Clin. Endocrinol. Metab. 2008, 93, 1345–1350. [Google Scholar] [CrossRef] [PubMed]
- Ceriello, A.; Esposito, K.; Piconi, L.; Ihnat, M.A.; Thorpe, J.E.; Testa, R.; Boemi, M.; Giugliano, D. Oscillating glucose is more deleterious to endothelial function and oxidative stress than mean glucose in normal and type 2 diabetic patients. Diabetes 2008, 57, 1349–1354. [Google Scholar] [CrossRef] [PubMed]
- Engebretson, S.P.; Vossughi, F.; Hey-Hadavi, J.; Emingil, G.; Grbic, J.T. The influence of diabetes on gingival crevicular fluid beta-glucuronidase and interleukin-8. J. Clin. Periodontol. 2006, 33, 784–790. [Google Scholar] [CrossRef]
- Duarte, P.M.; Santos, V.R.; dos Santos, F.A.; de Lima Pereira, S.A.; Rodrigues, D.B.; Napimoga, M.H. Role of smoking and type 2 diabetes in the immunobalance of advanced chronic periodontitis. J. Periodontol. 2011, 82, 429–438. [Google Scholar] [CrossRef]
- Taylor, J.J.; Preshaw, P.M.; Lalla, E. A review of the evidence for pathogenic mechanisms that may link periodontitis and diabetes. J. Clin. Periodontol. 2013, 40 (Suppl. S14), S113–S134. [Google Scholar] [CrossRef]
- Emrich, L.J.; Shlossman, M.; Genco, R.J. Periodontal disease in non-insulin-dependent diabetes mellitus. J. Periodontol. 1991, 62, 123–131. [Google Scholar] [CrossRef] [PubMed]
- Oliver, R.C.; Tervonen, T. Diabetes-A Risk Factor for Periodontitis in Adults? J. Periodontol. 1994, 65 (Suppl. S5), 530–538. [Google Scholar] [CrossRef]
- Taylor, G.W.; Burt, B.A.; Becker, M.P.; Genco, R.J.; Shlossman, M.; Knowler, W.C.; Pettitt, D.J. Severe periodontitis and risk for poor glycemic control in patients with non-insulin-dependent diabetes mellitus. J. Periodontol. 1996, 67, 1085–1093. [Google Scholar] [CrossRef]
- Preshaw, P.M.; Alba, A.L.; Herrera, D.; Jepsen, S.; Konstantinidis, A.; Makrilakis, K.; Taylor, R. Periodontitis and diabetes: A two-way relationship. Diabetologia 2012, 55, 21–31. [Google Scholar] [CrossRef] [PubMed]
- Schwingshackl, L.; Hoffmann, G.; Lampousi, A.M.; Knuppel, S.; Iqbal, K.; Schwedhelm, C.; Bechthold, A.; Schlesinger, S.; Boeing, H. Food groups and risk of type 2 diabetes mellitus: A systematic review and meta-analysis of prospective studies. Eur. J. Epidemiol. 2017, 32, 363–375. [Google Scholar] [CrossRef]
- O’Hearn, M.; Lara-Castor, L.; Cudhea, F.; Miller, V.; Reedy, J.; Shi, P.; Zhang, J.; Wong, J.B.; Economos, C.D.; Micha, R.; et al. Incident type 2 diabetes attributable to suboptimal diet in 184 countries. Nat. Med. 2023, 29, 982–995. [Google Scholar] [CrossRef] [PubMed]
- Nishida, M.; Grossi, S.G.; Dunford, R.G.; Ho, A.W.; Trevisan, M.; Genco, R.J. Calcium and the risk for periodontal disease. J. Periodontol. 2000, 71, 1057–1066. [Google Scholar] [CrossRef]
- Petersen, P.E.; Ogawa, H. Strengthening the prevention of periodontal disease: The WHO approach. J. Periodontol. 2005, 76, 2187–2193. [Google Scholar] [CrossRef]
- Merchant, A.T.; Pitiphat, W.; Franz, M.; Joshipura, K.J. Whole-grain and fiber intakes and periodontitis risk in men. Am. J. Clin. Nutr. 2006, 83, 1395–1400. [Google Scholar] [CrossRef]
- Al-Zahrani, M.S. Increased intake of dairy products is related to lower periodontitis prevalence. J. Periodontol. 2006, 77, 289–294. [Google Scholar] [CrossRef]
- Morillo, J.M.; Bullon, P.; Ramirez-Tortosa, M.C.; Quiles, J.L.; Newman, H.N.; Bertoli, E.; Battino, M. Nutrition-linked chronic disease and periodontitis: Are they the two faces of the same coin? Mediterr. J. Nutr. Metab. 2009, 2, 103–109. [Google Scholar] [CrossRef]
- Yoshihara, A.; Watanabe, R.; Hanada, N.; Miyazaki, H. A longitudinal study of the relationship between diet intake and dental caries and periodontal disease in elderly Japanese subjects. Gerodontology 2009, 26, 130–136. [Google Scholar] [CrossRef]
- Iwasaki, M.; Yoshihara, A.; Moynihan, P.; Watanabe, R.; Taylor, G.W.; Miyazaki, H. Longitudinal relationship between dietary omega-3 fatty acids and periodontal disease. Nutrition 2010, 26, 1105–1109. [Google Scholar] [CrossRef]
- Staufenbiel, I.; Weinspach, K.; Forster, G.; Geurtsen, W.; Gunay, H. Periodontal conditions in vegetarians: A clinical study. Eur. J. Clin. Nutr. 2013, 67, 836–840. [Google Scholar] [CrossRef] [PubMed]
- Song, I.S.; Han, K.; Park, Y.M.; Ji, S.; Jun, S.H.; Ryu, J.J.; Park, J.B. Severe Periodontitis Is Associated with Insulin Resistance in Non-abdominal Obese Adults. J. Clin. Endocrinol. Metab. 2016, 101, 4251–4259. [Google Scholar] [CrossRef] [PubMed]
- Salazar, C.R.; Laniado, N.; Mossavar-Rahmani, Y.; Borrell, L.N.; Qi, Q.; Sotres-Alvarez, D.; Morse, D.E.; Singer, R.H.; Kaplan, R.C.; Badner, V.; et al. Better-quality diet is associated with lower odds of severe periodontitis in US Hispanics/Latinos. J. Clin. Periodontol. 2018, 45, 780–790. [Google Scholar] [CrossRef] [PubMed]
- Chiuve, S.E.; Fung, T.T.; Rimm, E.B.; Hu, F.B.; McCullough, M.L.; Wang, M.; Stampfer, M.J.; Willett, W.C. Alternative dietary indices both strongly predict risk of chronic disease. J. Nutr. 2012, 142, 1009–1018. [Google Scholar] [CrossRef]
- Atarbashi-Moghadam, F.; Moallemi-Pour, S.; Atarbashi-Moghadam, S.; Sijanivandi, S.; Baghban, A.A. Effects of raw vegan diet on periodontal and dental parameters. Tzu Chi Med. J. 2020, 32, 357–361. [Google Scholar] [CrossRef]
- Jauhiainen, L.M.; Ylostalo, P.V.; Knuuttila, M.; Mannisto, S.; Kanerva, N.; Suominen, A.L. Poor diet predicts periodontal disease development in 11-year follow-up study. Community Dent. Oral Epidemiol. 2020, 48, 143–151. [Google Scholar] [CrossRef]
- Alhassani, A.A.; Hu, F.B.; Rimm, E.B.; Li, Y.; Rosner, B.A.; Willett, W.C.; Joshipura, K.J. Dietary flavonoid intake and risk of periodontitis. J. Periodontol. 2020, 91, 1057–1066. [Google Scholar] [CrossRef]
- Barbaresko, J.; Koch, M.; Schulze, M.B.; Nothlings, U. Dietary pattern analysis and biomarkers of low-grade inflammation: A systematic literature review. Nutr. Rev. 2013, 71, 511–527. [Google Scholar] [CrossRef] [PubMed]
- Koh-Banerjee, P.; Wang, Y.; Hu, F.B.; Spiegelman, D.; Willett, W.C.; Rimm, E.B. Changes in body weight and body fat distribution as risk factors for clinical diabetes in US men. Am. J. Epidemiol. 2004, 159, 1150–1159. [Google Scholar] [CrossRef] [PubMed]
- Esmaillzadeh, A.; Kimiagar, M.; Mehrabi, Y.; Azadbakht, L.; Hu, F.B.; Willett, W.C. Dietary patterns, insulin resistance, and prevalence of the metabolic syndrome in women. Am. J. Clin. Nutr. 2007, 85, 910–918. [Google Scholar] [CrossRef]
- Martinon, P.; Fraticelli, L.; Giboreau, A.; Dussart, C.; Bourgeois, D.; Carrouel, F. Nutrition as a Key Modifiable Factor for Periodontitis and Main Chronic Diseases. J. Clin. Med. 2021, 10, 197. [Google Scholar] [CrossRef] [PubMed]
- Shivappa, N.; Steck, S.E.; Hurley, T.G.; Hussey, J.R.; Hebert, J.R. Designing and developing a literature-derived, population-based dietary inflammatory index. Public Health Nutr. 2014, 17, 1689–1696. [Google Scholar] [CrossRef]
- Machado, V.; Botelho, J.; Viana, J.; Pereira, P.; Lopes, L.B.; Proenca, L.; Delgado, A.S.; Mendes, J.J. Association between Dietary Inflammatory Index and Periodontitis: A Cross-Sectional and Mediation Analysis. Nutrients 2021, 13, 1194. [Google Scholar] [CrossRef]
- Choi, S.W.; Sreeja, S.R.; Le, T.D.; Shivappa, N.; Hebert, J.R.; Kim, M.K. Association between inflammatory potential of diet and periodontitis disease risks: Results from a Korean population-based cohort study. J. Clin. Periodontol. 2023, 50, 952–963. [Google Scholar] [CrossRef]
- Alhassani, A.A.; Hu, F.B.; Rosner, B.A.; Tabung, F.K.; Willett, W.C.; Joshipura, K.J. The relationship between inflammatory dietary pattern and incidence of periodontitis. Br. J. Nutr. 2021, 126, 1698–1708. [Google Scholar] [CrossRef]
- Sáenz-Ravello, G.; Matamala, L.; dos Santos, N.C.; Cisternas, P.; Gamonal, J.; Fernandez, A.; Bello-Escamilla, N.; Hernandez, M.; Baeza, M. Healthy Dietary Patterns on Clinical Periodontal Parameters: A GRADE Compliant Systematic Review and Meta-analysis. Curr. Oral Health Rep. 2022, 9, 32–55. [Google Scholar] [CrossRef]
- Li, A.; Qiu, B.; Goettsch, M.; Chen, Y.; Ge, S.; Xu, S.; Tjakkes, G.E. Association between the quality of plant-based diets and periodontitis in the U.S. general population. J. Clin. Periodontol. 2023, 50, 591–603. [Google Scholar] [CrossRef]
- Rhee, J.J.; Mattei, J.; Hughes, M.D.; Hu, F.B.; Willett, W.C. Dietary diabetes risk reduction score, race and ethnicity, and risk of type 2 diabetes in women. Diabetes Care 2015, 38, 596–603. [Google Scholar] [CrossRef]
- Asensi, M.T.; Napoletano, A.; Sofi, F.; Diun, M. Low-Grade Inflammation and Ultra-Processed Foods Consumption: A Review. Nutrients 2023, 15, 1546. [Google Scholar] [CrossRef]
- Askari, M.; Heshmati, J.; Shahinfar, H.; Tripathi, N.; Daneshzad, E. Ultra-processed food and the risk of overweight and obesity: A systematic review and meta-analysis of observational studies. Int. J. Obes. 2020, 44, 2080–2091. [Google Scholar] [CrossRef]
- Calder, P.C.; Ahluwalia, N.; Brouns, F.; Buetler, T.; Clement, K.; Cunningham, K.; Esposito, K.; Jonsson, L.S.; Kolb, H.; Lansink, M.; et al. Dietary factors and low-grade inflammation in relation to overweight and obesity. Br. J. Nutr. 2011, 106 (Suppl. S3), S5–S78. [Google Scholar] [CrossRef]
- Donat-Vargas, C.; Sandoval-Insausti, H.; Rey-Garcia, J.; Moreno-Franco, B.; Akesson, A.; Banegas, J.R.; Rodriguez-Artalejo, F.; Guallar-Castillon, P. High Consumption of Ultra-Processed Food is Associated with Incident Dyslipidemia: A Prospective Study of Older Adults. J. Nutr. 2021, 151, 2390–2398. [Google Scholar] [CrossRef]
- Mazidi, M.; Valdes, A.M.; Ordovas, J.M.; Hall, W.L.; Pujol, J.C.; Wolf, J.; Hadjigeorgiou, G.; Segata, N.; Sattar, N.; Koivula, R.; et al. Meal-induced inflammation: Postprandial insights from the Personalised REsponses to DIetary Composition Trial (PREDICT) study in 1000 participants. Am. J. Clin. Nutr. 2021, 114, 1028–1038. [Google Scholar] [CrossRef]
- Ultra-Processed Foods: A Global Threat to Public Health; UNC Global Food Research Program, University of North Carolina at Chappel Hill: Chapple Hill, NC, USA, 2021; p. 10.
- Llavero-Valero, M.; Escalada-San Martin, J.; Martinez-Gonzalez, M.A.; Basterra-Gortari, F.J.; de la Fuente-Arrillaga, C.; Bes-Rastrollo, M. Ultra-processed foods and type-2 diabetes risk in the SUN project: A prospective cohort study. Clin. Nutr. 2021, 40, 2817–2824. [Google Scholar] [CrossRef]
- Cassiano, L.S.; Peres, M.A.; Motta, J.V.S.; Demarco, F.F.; Horta, B.L.; Ribeiro, C.C.; Nascimento, G.G. Periodontitis Is Associated with Consumption of Processed and Ultra-Processed Foods: Findings from a Population-Based Study. Nutrients 2022, 14, 3735. [Google Scholar] [CrossRef] [PubMed]
- Mendonca, R.D.; Pimenta, A.M.; Gea, A.; de la Fuente-Arrillaga, C.; Martinez-Gonzalez, M.A.; Lopes, A.C.; Bes-Rastrollo, M. Ultraprocessed food consumption and risk of overweight and obesity: The University of Navarra Follow-Up (SUN) cohort study. Am. J. Clin. Nutr. 2016, 104, 1433–1440. [Google Scholar] [CrossRef] [PubMed]
- Canhada, S.L.; Luft, V.C.; Giatti, L.; Duncan, B.B.; Chor, D.; Fonseca, M.; Matos, S.M.A.; Molina, M.; Barreto, S.M.; Levy, R.B.; et al. Ultra-processed foods, incident overweight and obesity, and longitudinal changes in weight and waist circumference: The Brazilian Longitudinal Study of Adult Health (ELSA-Brasil). Public Health Nutr. 2020, 23, 1076–1086. [Google Scholar] [CrossRef] [PubMed]
- Pagliai, G.; Dinu, M.; Madarena, M.P.; Bonaccio, M.; Iacoviello, L.; Sofi, F. Consumption of ultra-processed foods and health status: A systematic review and meta-analysis. Br. J. Nutr. 2021, 125, 308–318. [Google Scholar] [CrossRef]
- Bonaccio, M.; di Castelnuovo, A.; Costanzo, S.; de Curtis, A.; Persichillo, M.; Sofi, F.; Cerletti, C.; Donati, M.B.; de Gaetano, G.; Iacoviello, L. Ultra-processed food consumption is associated with increased risk of all-cause and cardiovascular mortality in the Moli-sani Study. Am. J. Clin. Nutr. 2021, 113, 446–455. [Google Scholar] [CrossRef]
- Fiolet, T.; Srour, B.; Sellem, L.; Kesse-Guyot, E.; Alles, B.; Mejean, C.; Deschasaux, M.; Fassier, P.; Latino-Martel, P.; Beslay, M.; et al. Consumption of ultra-processed foods and cancer risk: Results from NutriNet-Sante prospective cohort. BMJ 2018, 360, k322. [Google Scholar] [CrossRef]
- Yang, J.J.; Shu, X.O.; Herrington, D.M.; Moore, S.C.; Meyer, K.A.; Ose, J.; Menni, C.; Palmer, N.D.; Eliassen, H.; Harada, S.; et al. Circulating trimethylamine N-oxide in association with diet and cardiometabolic biomarkers: An international pooled analysis. Am. J. Clin. Nutr. 2021, 113, 1145–1156. [Google Scholar] [CrossRef]
- Zhou, J.; Chen, S.; Ren, J.; Zou, H.; Liu, Y.; Chen, Y.; Qiu, Y.; Zhuang, W.; Tao, J.; Yang, J. Association of enhanced circulating trimethylamine N-oxide with vascular endothelial dysfunction in periodontitis patients. J. Periodontol. 2022, 93, 770–779. [Google Scholar] [CrossRef]
- Wang, Q.; Sun, Y.; Zhou, T.; Jiang, C.; A, L.; Xu, W. Gut microbiota-dependent trimethylamine n-oxide pathway contributes to the bidirectional relationship between intestinal inflammation and periodontitis. Front. Cell. Infect. Microbiol. 2022, 12, 1125463. [Google Scholar] [CrossRef] [PubMed]
- Gao, Q.; Wang, Y.; Wang, X.; Fu, S.; Zhang, X.; Wang, R.T.; Zhang, X. Decreased levels of circulating trimethylamine N-oxide alleviate cognitive and pathological deterioration in transgenic mice: A potential therapeutic approach for Alzheimer’s disease. Aging 2019, 11, 8642–8663. [Google Scholar] [CrossRef] [PubMed]
- Buawangpong, N.; Pinyopornpanish, K.; Siri-Angkul, N.; Chattipakorn, N.; Chattipakorn, S.C. The role of trimethylamine-N-Oxide in the development of Alzheimer’s disease. J. Cell. Physiol. 2022, 237, 1661–1685. [Google Scholar] [CrossRef]
- Arrona Cardoza, P.; Spillane, M.B.; Morales Marroquin, E. Alzheimer’s disease and gut microbiota: Does trimethylamine N-oxide (TMAO) play a role? Nutr. Rev. 2022, 80, 271–281. [Google Scholar] [CrossRef]
- Croyal, M.; Saulnier, P.J.; Aguesse, A.; Gand, E.; Ragot, S.; Roussel, R.; Halimi, J.M.; Ducrocq, G.; Cariou, B.; Montaigne, D.; et al. Plasma Trimethylamine N-Oxide and Risk of Cardiovascular Events in Patients with Type 2 Diabetes. J. Clin. Endocrinol. Metab. 2020, 105, 2371–2380. [Google Scholar] [CrossRef] [PubMed]
- Thomas, M.S.; Fernandez, M.L. Trimethylamine N-Oxide (TMAO), Diet and Cardiovascular Disease. Curr. Atheroscler. Rep. 2021, 23, 12. [Google Scholar] [CrossRef] [PubMed]
- Grinberga, S.; Dambrova, M.; Latkovskis, G.; Strele, I.; Konrade, I.; Hartmane, D.; Sevostjanovs, E.; Liepinsh, E.; Pugovics, O. Determination of trimethylamine-N-oxide in combination with L-carnitine and gamma-butyrobetaine in human plasma by UPLC/MS/MS. Biomed. Chromatogr. 2015, 29, 1670–1674. [Google Scholar] [CrossRef] [PubMed]
- Shao, J.; Wu, L.; Leng, W.D.; Fang, C.; Zhu, Y.J.; Jin, Y.H.; Zeng, X.T. Periodontal Disease and Breast Cancer: A Meta-Analysis of 173,162 Participants. Front. Oncol. 2018, 8, 601. [Google Scholar] [CrossRef] [PubMed]
- Constantino-Jonapa, L.A.; Espinoza-Palacios, Y.; Escalona-Montano, A.R.; Hernandez-Ruiz, P.; Amezcua-Guerra, L.M.; Amedei, A.; Aguirre-Garcia, M.M. Contribution of Trimethylamine N-Oxide (TMAO) to Chronic Inflammatory and Degenerative Diseases. Biomedicines 2023, 11, 431. [Google Scholar] [CrossRef] [PubMed]
- Zyriax, B.C.; Boeing, H.; Windler, E. Nutrition is a powerful independent risk factor for coronary heart disease in women—The CORA study: A population-based case-control study. Eur. J. Clin. Nutr. 2005, 59, 1201–1207. [Google Scholar] [CrossRef] [PubMed]
- Papier, K.; Knuppel, A.; Syam, N.; Jebb, S.A.; Key, T.J. Meat consumption and risk of ischemic heart disease: A systematic review and meta-analysis. Crit. Rev. Food Sci. Nutr. 2023, 63, 426–437. [Google Scholar] [CrossRef]
- Anderson, J.W.; Ward, K. High-carbohydrate, high-fiber diets for insulin-treated men with diabetes mellitus. Am. J. Clin. Nutr. 1979, 32, 2312–2321. [Google Scholar] [CrossRef]
- Barnard, N.D.; Cohen, J.; Jenkins, D.J.; Turner-McGrievy, G.; Gloede, L.; Jaster, B.; Seidl, K.; Green, A.A.; Talpers, S. A low-fat vegan diet improves glycemic control and cardiovascular risk factors in a randomized clinical trial in individuals with type 2 diabetes. Diabetes Care 2006, 29, 1777–1783. [Google Scholar] [CrossRef]
- American Dietetic Association; Dietitians of Canada. Position of the American Dietetic Association and Dietitians of Canada: Vegetarian diets. J. Am. Diet. Assoc. 2003, 103, 748–765. [Google Scholar] [CrossRef]
- Kwon, Y.J.; Lee, H.S.; Park, J.Y.; Lee, J.W. Associating Intake Proportion of Carbohydrate, Fat, and Protein with All-Cause Mortality in Korean Adults. Nutrients 2020, 12, 3208. [Google Scholar] [CrossRef]
- Tonstad, S.; Butler, T.; Yan, R.; Fraser, G.E. Type of vegetarian diet, body weight, and prevalence of type 2 diabetes. Diabetes Care 2009, 32, 791–796. [Google Scholar] [CrossRef]
- Satija, A.; Bhupathiraju, S.N.; Rimm, E.B.; Spiegelman, D.; Chiuve, S.E.; Borgi, L.; Willett, W.C.; Manson, J.E.; Sun, Q.; Hu, F.B. Plant-Based Dietary Patterns and Incidence of Type 2 Diabetes in US Men and Women: Results from Three Prospective Cohort Studies. PLoS Med. 2016, 13, e1002039. [Google Scholar] [CrossRef]
- McMacken, M.; Shah, S. A plant-based diet for the prevention and treatment of type 2 diabetes. J. Geriatr. Cardiol. 2017, 14, 342–354. [Google Scholar] [CrossRef]
- Kelly, J.; Karlsen, M.; Steinke, G. Type 2 Diabetes Remission and Lifestyle Medicine: A Position Statement From the American College of Lifestyle Medicine. Am. J. Lifestyle Med. 2020, 14, 406–419. [Google Scholar] [CrossRef]
- Jardine, M.A.; Kahleova, H.; Levin, S.M.; Ali, Z.; Trapp, C.B.; Barnard, N.D. Perspective: Plant-Based Eating Pattern for Type 2 Diabetes Prevention and Treatment: Efficacy, Mechanisms, and Practical Considerations. Adv. Nutr. 2021, 12, 2045–2055. [Google Scholar] [CrossRef]
- Chen, Z.; Drouin-Chartier, J.P.; Li, Y.; Baden, M.Y.; Manson, J.E.; Willett, W.C.; Voortman, T.; Hu, F.B.; Bhupathiraju, S.N. Changes in Plant-Based Diet Indices and Subsequent Risk of Type 2 Diabetes in Women and Men: Three U.S. Prospective Cohorts. Diabetes Care 2021, 44, 663–671. [Google Scholar] [CrossRef] [PubMed]
- Lagana, A.S.; Vitale, S.G.; Ban Frangez, H.; Vrtacnik-Bokal, E.; D’Anna, R. Vitamin D in human reproduction: The more, the better? An evidence-based critical appraisal. Eur. Rev. Med. Pharmacol. Sci. 2017, 21, 4243–4251. [Google Scholar]
- Zehnder, D.; Bland, R.; Williams, M.C.; McNinch, R.W.; Howie, A.J.; Stewart, P.M.; Hewison, M. Extrarenal expression of 25-hydroxyvitamin d(3)-1 alpha-hydroxylase. J. Clin. Endocrinol. Metab. 2001, 86, 888–894. [Google Scholar] [CrossRef]
- Shirvani, A.; Kalajian, T.A.; Song, A.; Holick, M.F. Disassociation of Vitamin D’s Calcemic Activity and Non-calcemic Genomic Activity and Individual Responsiveness: A Randomized Controlled Double-Blind Clinical Trial. Sci. Rep. 2019, 9, 17685. [Google Scholar] [CrossRef]
- Holick, M.F. Vitamin D: A d-lightful solution for health. J. Investig. Med. 2011, 59, 872–880. [Google Scholar] [CrossRef] [PubMed]
- McCullough, P.J.; Lehrer, D.S.; Amend, J. Daily oral dosing of vitamin D3 using 5000 TO 50,000 international units a day in long-term hospitalized patients: Insights from a seven year experience. J. Steroid Biochem. Mol. Biol. 2019, 189, 228–239. [Google Scholar] [CrossRef]
- Tebben, P.J.; Singh, R.J.; Kumar, R. Vitamin D-Mediated Hypercalcemia: Mechanisms, Diagnosis, and Treatment. Endocr. Rev. 2016, 37, 521–547. [Google Scholar] [CrossRef]
- Araki, T.; Holick, M.F.; Alfonso, B.D.; Charlap, E.; Romero, C.M.; Rizk, D.; Newman, L.G. Vitamin D intoxication with severe hypercalcemia due to manufacturing and labeling errors of two dietary supplements made in the United States. J. Clin. Endocrinol. Metab. 2011, 96, 3603–3608. [Google Scholar] [CrossRef]
- Charoenngam, N.; Shirvani, A.; Holick, M.F. Vitamin D for skeletal and non-skeletal health: What we should know. J. Clin. Orthop. Trauma 2019, 10, 1082–1093. [Google Scholar] [CrossRef]
- Charoenngam, N.; Holick, M.F. Immunologic Effects of Vitamin D on Human Health and Disease. Nutrients 2020, 12, 2097. [Google Scholar] [CrossRef]
- Athanassiou, L.; Kostoglou-Athanassiou, I.; Koutsilieris, M.; Shoenfeld, Y. Vitamin D and Autoimmune Rheumatic Diseases. Biomolecules 2023, 13, 709. [Google Scholar] [CrossRef]
- Muñoz, A.; Grant, W.B. Vitamin D and Cancer: An Historical Overview of the Epidemiology and Mechanisms. Nutrients 2022, 14, 1448. [Google Scholar] [CrossRef]
- de la Guia-Galipienso, F.; Martinez-Ferran, M.; Vallecillo, N.; Lavie, C.J.; Sanchis-Gomar, F.; Pareja-Galeano, H. Vitamin D and cardiovascular health. Clin. Nutr. 2021, 40, 2946–2957. [Google Scholar] [CrossRef]
- Gombart, A.F. The vitamin D-antimicrobial peptide pathway and its role in protection against infection. Future Microbiol. 2009, 4, 1151–1165. [Google Scholar] [CrossRef] [PubMed]
- Mailhot, G.; White, J.H. Vitamin D and Immunity in Infants and Children. Nutrients 2020, 12, 1233. [Google Scholar] [CrossRef] [PubMed]
- Ahmed, F. A Network-Based Analysis Reveals the Mechanism Underlying Vitamin D in Suppressing Cytokine Storm and Virus in SARS-CoV-2 Infection. Front. Immunol. 2020, 11, 590459. [Google Scholar] [CrossRef]
- Guillot, X.; Semerano, L.; Saidenberg-Kermanac’h, N.; Falgarone, G.; Boissier, M.C. Vitamin D and inflammation. Jt. Bone Spine 2010, 77, 552–557. [Google Scholar] [CrossRef]
- Szymczak-Pajor, I.; Drzewoski, J.; Sliwinska, A. The Molecular Mechanisms by Which Vitamin D Prevents Insulin Resistance and Associated Disorders. Int. J. Mol. Sci. 2020, 21, 6644. [Google Scholar] [CrossRef]
- Dzik, K.P.; Kaczor, J.J. Mechanisms of vitamin D on skeletal muscle function: Oxidative stress, energy metabolism and anabolic state. Eur. J. Appl. Physiol. 2019, 119, 825–839. [Google Scholar] [CrossRef]
- Karras, S.N.; Wagner, C.L.; Castracane, V.D. Understanding vitamin D metabolism in pregnancy: From physiology to pathophysiology and clinical outcomes. Metabolism 2018, 86, 112–123. [Google Scholar] [CrossRef]
- Hypponen, E.; Power, C. Hypovitaminosis D in British adults at age 45 y: Nationwide cohort study of dietary and lifestyle predictors. Am. J. Clin. Nutr. 2007, 85, 860–868. [Google Scholar] [CrossRef]
- Kroll, M.H.; Bi, C.; Garber, C.C.; Kaufman, H.W.; Liu, D.; Caston-Balderrama, A.; Zhang, K.; Clarke, N.; Xie, M.; Reitz, R.E.; et al. Temporal relationship between vitamin D status and parathyroid hormone in the United States. PLoS ONE 2015, 10, e0118108. [Google Scholar] [CrossRef]
- Engelsen, O. The relationship between ultraviolet radiation exposure and vitamin D status. Nutrients 2010, 2, 482–495. [Google Scholar] [CrossRef] [PubMed]
- Webb, A.R.; Kline, L.; Holick, M.F. Influence of season and latitude on the cutaneous synthesis of vitamin D3: Exposure to winter sunlight in Boston and Edmonton will not promote vitamin D3 synthesis in human skin. J. Clin. Endocrinol. Metab. 1988, 67, 373–378. [Google Scholar] [CrossRef] [PubMed]
- Mason, R.S.; Rybchyn, M.S.; Abboud, M.; Brennan-Speranza, T.C.; Fraser, D.R. The Role of Skeletal Muscle in Maintaining Vitamin D Status in Winter. Curr. Dev. Nutr. 2019, 3, nzz087. [Google Scholar] [CrossRef] [PubMed]
- Rybchyn, M.S.; Abboud, M.; Puglisi, D.A.; Gordon-Thomson, C.; Brennan-Speranza, T.C.; Mason, R.S.; Fraser, D.R. Skeletal Muscle and the Maintenance of Vitamin D Status. Nutrients 2020, 12, 3270. [Google Scholar] [CrossRef]
- Martinaityte, I.; Kamycheva, E.; Didriksen, A.; Jakobsen, J.; Jorde, R. Vitamin D Stored in Fat Tissue During a 5-Year Intervention Affects Serum 25-Hydroxyvitamin D Levels the Following Year. J. Clin. Endocrinol. Metab. 2017, 102, 3731–3738. [Google Scholar] [CrossRef]
- Crowe, F.L.; Steur, M.; Allen, N.E.; Appleby, P.N.; Travis, R.C.; Key, T.J. Plasma concentrations of 25-hydroxyvitamin D in meat eaters, fish eaters, vegetarians and vegans: Results from the EPIC-Oxford study. Public Health Nutr. 2011, 14, 340–346. [Google Scholar] [CrossRef] [PubMed]
- Chalcraft, J.R.; Cardinal, L.M.; Wechsler, P.J.; Hollis, B.W.; Gerow, K.G.; Alexander, B.M.; Keith, J.F.; Larson-Meyer, D.E. Vitamin D Synthesis Following a Single Bout of Sun Exposure in Older and Younger Men and Women. Nutrients 2020, 12, 2237. [Google Scholar] [CrossRef] [PubMed]
- Li, W.; Zheng, Q.; Xu, M.; Zeng, C.; Deng, X. Association between circulating 25-hydroxyvitamin D metabolites and periodontitis: Results from the NHANES 2009-2012 and Mendelian randomization study. J. Clin. Periodontol. 2023, 50, 252–264. [Google Scholar] [CrossRef] [PubMed]
- Peric, M.; Maiter, D.; Cavalier, E.; Lasserre, J.F.; Toma, S. The Effects of 6-Month Vitamin D Supplementation during the Non-Surgical Treatment of Periodontitis in Vitamin-D-Deficient Patients: A Randomized Double-Blind Placebo-Controlled Study. Nutrients 2020, 12, 2940. [Google Scholar] [CrossRef]
- Bashutski, J.D.; Eber, R.M.; Kinney, J.S.; Benavides, E.; Maitra, S.; Braun, T.M.; Giannobile, W.V.; McCauley, L.K. The impact of vitamin D status on periodontal surgery outcomes. J. Dent. Res. 2011, 90, 1007–1012. [Google Scholar] [CrossRef]
- Hiremath, V.P.; Rao, C.B.; Naik, V.; Prasad, K.V. Anti-inflammatory effect of vitamin D on gingivitis: A dose-response randomised control trial. Oral Health Prev. Dent. 2013, 11, 61–69. [Google Scholar] [CrossRef]
- Assaf, M.; Aboelsaad, N. The Effectiveness of Vitamin D Supplementation in Chronic Periodontitis Patients: A Randomized Controlled Clinical Trial. Egypt. Dent. J. 2019, 65, 1311–1321. [Google Scholar]
- Gao, W.; Tang, H.; Wang, D.; Zhou, X.; Song, Y.; Wang, Z. Effect of short-term vitamin D supplementation after nonsurgical periodontal treatment: A randomized, double-masked, placebo-controlled clinical trial. J. Periodontal Res. 2020, 55, 354–362. [Google Scholar] [CrossRef]
- Nesterova, O.; Krasilnikova, V.; Margaryan, E.; Lazareva, Y.; Nemtyreva, L. Treatment of chronic generalized periodontitis in patients with underlying hypovitaminosis D: Randomized comparative clinical trial. J. Appl. Oral Sci. 2022, 30, e20220335. [Google Scholar] [CrossRef]
- Bayirli, B.A.; Ozturk, A.; Avci, B. Serum vitamin D concentration is associated with antimicrobial peptide level in periodontal diseases. Arch. Oral Biol. 2020, 117, 104827. [Google Scholar] [CrossRef]
- Botelho, J.; Machado, V.; Proenca, L.; Delgado, A.S.; Mendes, J.J. Vitamin D Deficiency and Oral Health: A Comprehensive Review. Nutrients 2020, 12, 1471. [Google Scholar] [CrossRef]
- Nilsson, B.O. Mechanisms involved in regulation of periodontal ligament cell production of pro-inflammatory cytokines: Implications in periodontitis. J. Periodontal Res. 2021, 56, 249–255. [Google Scholar] [CrossRef]
- Lu, E.M. The role of vitamin D in periodontal health and disease. J. Periodontal Res. 2022, 58, 213–224. [Google Scholar] [CrossRef]
- Ustianowski, L.; Ustianowska, K.; Gurazda, K.; Rusinski, M.; Ostrowski, P.; Pawlik, A. The Role of Vitamin C and Vitamin D in the Pathogenesis and Therapy of Periodontitis-Narrative Review. Int. J. Mol. Sci. 2023, 24, 6774. [Google Scholar] [CrossRef]
- Foster, B.L.; Nociti, F.H., Jr.; Somerman, M.J. The rachitic tooth. Endocr. Rev. 2014, 35, 1–34. [Google Scholar] [CrossRef]
- Feng, Z.; Weinberg, A. Role of bacteria in health and disease of periodontal tissues. Periodontology 2006, 40, 50–76. [Google Scholar] [CrossRef]
- Liu, P.T.; Stenger, S.; Li, H.; Wenzel, L.; Tan, B.H.; Krutzik, S.R.; Ochoa, M.T.; Schauber, J.; Wu, K.; Meinken, C.; et al. Toll-like receptor triggering of a vitamin D-mediated human antimicrobial response. Science 2006, 311, 1770–1773. [Google Scholar] [CrossRef]
- Bikle, D.D. Vitamin D and the immune system: Role in protection against bacterial infection. Curr. Opin. Nephrol. Hypertens. 2008, 17, 348–352. [Google Scholar] [CrossRef]
- Costantini, E.; Sinjari, B.; Piscopo, F.; Porreca, A.; Reale, M.; Caputi, S.; Murmura, G. Evaluation of Salivary Cytokines and Vitamin D Levels in Periodontopathic Patients. Int. J. Mol. Sci. 2020, 21, 2669. [Google Scholar] [CrossRef]
- Bonnet, C.; Rabbani, R.; Moffatt, M.E.K.; Kelekis-Cholakis, A.; Schroth, R.J. The Relation Between Periodontal Disease and Vitamin D. J. Can. Dent. Assoc. 2019, 84, j4. [Google Scholar]
- Khammissa, R.A.G.; Ballyram, R.; Jadwat, Y.; Fourie, J.; Lemmer, J.; Feller, L. Vitamin D Deficiency as It Relates to Oral Immunity and Chronic Periodontitis. Int. J. Dent. 2018, 2018, 7315797. [Google Scholar] [CrossRef]
- Batool, H.; Nadeem, A.; Kashif, M.; Shahzad, F.; Tahir, R.; Afzal, N. Salivary Levels of IL-6 and IL-17 Could Be an Indicator of Disease Severity in Patients with Calculus Associated Chronic Periodontitis. Biomed. Res. Int. 2018, 2018, 8531961. [Google Scholar] [CrossRef]
- Jing, L.; Kim, S.; Sun, L.; Wang, L.; Mildner, E.; Divaris, K.; Jiao, Y.; Offenbacher, S. IL-37- and IL-35/IL-37-Producing Plasma Cells in Chronic Periodontitis. J. Dent. Res. 2019, 98, 813–821. [Google Scholar] [CrossRef]
- Luchian, I.; Goriuc, A.; Sandu, D.; Covasa, M. The Role of Matrix Metalloproteinases (MMP-8, MMP-9, MMP-13) in Periodontal and Peri-Implant Pathological Processes. Int. J. Mol. Sci. 2022, 23, 1806. [Google Scholar] [CrossRef]
- Timms, P.M.; Mannan, N.; Hitman, G.A.; Noonan, K.; Mills, P.G.; Syndercombe-Court, D.; Aganna, E.; Price, C.P.; Boucher, B.J. Circulating MMP9, vitamin D and variation in the TIMP-1 response with VDR genotype: Mechanisms for inflammatory damage in chronic disorders? QJM 2002, 95, 787–796. [Google Scholar] [CrossRef]
- Sorsa, T.; Alassiri, S.; Grigoriadis, A.; Raisanen, I.T.; Parnanen, P.; Nwhator, S.O.; Gieselmann, D.R.; Sakellari, D. Active MMP-8 (aMMP-8) as a Grading and Staging Biomarker in the Periodontitis Classification. Diagnostics 2020, 10, 61. [Google Scholar] [CrossRef]
- Machado, V.; Lobo, S.; Proenca, L.; Mendes, J.J.; Botelho, J. Vitamin D and Periodontitis: A Systematic Review and Meta-Analysis. Nutrients 2020, 12, 2177. [Google Scholar] [CrossRef]
- Hans, M.; Malik, P.K.; Hans, V.M.; Chug, A.; Kumar, M. Serum levels of various vitamins in periodontal health and disease—A cross sectional study. J. Oral Biol. Craniofacial Res. 2023, 13, 471–475. [Google Scholar] [CrossRef]
- Isola, G.; Alibrandi, A.; Rapisarda, E.; Matarese, G.; Williams, R.C.; Leonardi, R. Association of vitamin D in patients with periodontitis: A cross-sectional study. J. Periodontal Res. 2020, 55, 602–612. [Google Scholar] [CrossRef]
- Ketharanathan, V.; Torgersen, G.R.; Petrovski, B.E.; Preus, H.R. Radiographic alveolar bone level and levels of serum 25-OH-Vitamin D(3) in ethnic Norwegian and Tamil periodontitis patients and their periodontally healthy controls. BMC Oral Health 2019, 19, 83. [Google Scholar] [CrossRef]
- Anbarcioglu, E.; Kirtiloglu, T.; Ozturk, A.; Kolbakir, F.; Acikgoz, G.; Colak, R. Vitamin D deficiency in patients with aggressive periodontitis. Oral Dis. 2019, 25, 242–249. [Google Scholar] [CrossRef]
- Ebersole, J.L.; Lambert, J.; Bush, H.; Huja, P.E.; Basu, A. Serum Nutrient Levels and Aging Effects on Periodontitis. Nutrients 2018, 10, 1986. [Google Scholar] [CrossRef]
- Abreu, O.J.; Tatakis, D.N.; Elias-Boneta, A.R.; del Valle, L.L.; Hernandez, R.; Pousa, M.S.; Palacios, C. Low vitamin D status strongly associated with periodontitis in Puerto Rican adults. BMC Oral Health 2016, 16, 89. [Google Scholar] [CrossRef]
- Balci Yuce, H.; Gokturk, O.; Aydemir Turkal, H.; Inanir, A.; Benli, I.; Demir, O. Assessment of local and systemic 25-hydroxy-vitamin D, RANKL, OPG, and TNF levels in patients with rheumatoid arthritis and periodontitis. J. Oral Sci. 2017, 59, 397–404. [Google Scholar] [CrossRef]
- Eshghi, R.; Maybodi, F.R.; Khabazian, A.; Shahhosseini, S. Association between serum levels of vitamin D and chronic periodontitis in premenopausal women in Yazd. Casp. J. Dent. Res. 2016, 5, 47–51. [Google Scholar]
- Joseph, R.; Nagrale, A.V.; Joseraj, M.G.; Pradeep Kumar, K.M.; Kaziyarakath, J.A.; Chandini, R. Low levels of serum Vitamin D in chronic periodontitis patients with type 2 diabetes mellitus: A hospital-based cross-sectional clinical study. J. Indian Soc. Periodontol. 2015, 19, 501–506. [Google Scholar] [CrossRef] [PubMed]
- Heaney, R.P. Guidelines for optimizing design and analysis of clinical studies of nutrient effects. Nutr. Rev. 2014, 72, 48–54. [Google Scholar] [CrossRef]
- Pilz, S.; Trummer, C.; Theiler-Schwetz, V.; Grubler, M.R.; Verheyen, N.D.; Odler, B.; Karras, S.N.; Zittermann, A.; Marz, W. Critical Appraisal of Large Vitamin D Randomized Controlled Trials. Nutrients 2022, 14, 303. [Google Scholar] [CrossRef]
- Grant, W.B.; Boucher, B.J.; al Anouti, F.; Pilz, S. Comparing the Evidence from Observational Studies and Randomized Controlled Trials for Nonskeletal Health Effects of Vitamin D. Nutrients 2022, 14, 3811. [Google Scholar] [CrossRef]
- Manson, J.E.; Cook, N.R.; Lee, I.M.; Christen, W.; Bassuk, S.S.; Mora, S.; Gibson, H.; Gordon, D.; Copeland, T.; D’Agostino, D.; et al. Vitamin D Supplements and Prevention of Cancer and Cardiovascular Disease. N. Engl. J. Med. 2019, 380, 33–44. [Google Scholar] [CrossRef]
- Anderson, J.L.; May, H.T.; Horne, B.D.; Bair, T.L.; Hall, N.L.; Carlquist, J.F.; Lappe, D.L.; Muhlestein, J.B.; Intermountain Heart Collaborative (IHC) Study Group. Relation of vitamin D deficiency to cardiovascular risk factors, disease status, and incident events in a general healthcare population. Am. J. Cardiol. 2010, 106, 963–968. [Google Scholar] [CrossRef] [PubMed]
- Sun, H.; Long, S.R.; Li, X.; Ge, H.; Liu, X.; Wang, T.; Yu, F.; Wang, Y.; Xue, Y.; Li, W. Serum vitamin D deficiency and vitamin D receptor gene polymorphism are associated with increased risk of cardiovascular disease in a Chinese rural population. Nutr. Res. 2019, 61, 13–21. [Google Scholar] [CrossRef]
- Zhou, A.; Selvanayagam, J.B.; Hypponen, E. Non-linear Mendelian randomization analyses support a role for vitamin D deficiency in cardiovascular disease risk. Eur. Heart J. 2022, 43, 1731–1739. [Google Scholar] [CrossRef]
- Grant, W.B.; Bhattoa, H.P.; Boucher, B.J. Seasonal variations of U.S. mortality rates: Roles of solar ultraviolet-B doses, vitamin D, gene expression, and infections. J. Steroid Biochem. Mol. Biol. 2017, 173, 5–12. [Google Scholar] [CrossRef]
- Grant, W.B.; Boucher, B.J. An Exploration of How Solar Radiation Affects the Seasonal Variation of Human Mortality Rates and the Seasonal Variation in Some Other Common Disorders. Nutrients 2022, 14, 2519. [Google Scholar] [CrossRef]
- Grant, W.B. Vitamin D Acceptance Delayed by Big Pharma Following the Disinformation Playbook. Available online: http://www.orthomolecular.org/resources/omns/v14n22.shtml (accessed on 30 March 2022).
- Wang, M.; Liu, M.; Wang, C.; Xiao, Y.; An, T.; Zou, M.; Cheng, G. Association between vitamin D status and asthma control: A meta-analysis of randomized trials. Respir. Med. 2019, 150, 85–94. [Google Scholar] [CrossRef]
- Hahn, J.; Cook, N.R.; Alexander, E.K.; Friedman, S.; Walter, J.; Bubes, V.; Kotler, G.; Lee, I.M.; Manson, J.E.; Costenbader, K.H. Vitamin D and marine omega 3 fatty acid supplementation and incident autoimmune disease: VITAL randomized controlled trial. BMJ 2022, 376, e066452. [Google Scholar] [CrossRef]
- Keum, N.; Lee, D.H.; Greenwood, D.C.; Manson, J.E.; Giovannucci, E. Vitamin D supplementation and total cancer incidence and mortality: A meta-analysis of randomized controlled trials. Ann. Oncol. 2019, 30, 733–743. [Google Scholar] [CrossRef]
- Vaughan-Shaw, P.G.; Buijs, L.F.; Blackmur, J.P.; Theodoratou, E.; Zgaga, L.; Din, F.V.N.; Farrington, S.M.; Dunlop, M.G. The effect of vitamin D supplementation on survival in patients with colorectal cancer: Systematic review and meta-analysis of randomised controlled trials. Br. J. Cancer 2020, 123, 1705–1712. [Google Scholar] [CrossRef]
- Hujoel, P.P. Vitamin D and dental caries in controlled clinical trials: Systematic review and meta-analysis. Nutr. Rev. 2013, 71, 88–97. [Google Scholar] [CrossRef]
- Lips, P.; van Schoor, N.M. The effect of vitamin D on bone and osteoporosis. Best. Pract. Res. Clin. Endocrinol. Metab. 2011, 25, 585–591. [Google Scholar] [CrossRef]
- Martineau, A.R.; Jolliffe, D.A.; Hooper, R.L.; Greenberg, L.; Aloia, J.F.; Bergman, P.; Dubnov-Raz, G.; Esposito, S.; Ganmaa, D.; Ginde, A.A.; et al. Vitamin D supplementation to prevent acute respiratory tract infections: Systematic review and meta-analysis of individual participant data. BMJ 2017, 356, i6583. [Google Scholar] [CrossRef]
- Weller, R.B.; Wang, Y.; He, J.; Maddux, F.W.; Usvyat, L.; Zhang, H.; Feelisch, M.; Kotanko, P. Does Incident Solar Ultraviolet Radiation Lower Blood Pressure? J. Am. Heart Assoc. 2020, 9, e013837. [Google Scholar] [CrossRef]
- Cherrie, M.; Clemens, T.; Colandrea, C.; Feng, Z.; Webb, D.J.; Weller, R.B.; Dibben, C. Ultraviolet A radiation and COVID-19 deaths in the USA with replication studies in England and Italy. Br. J. Dermatol. 2021, 185, 363–370. [Google Scholar] [CrossRef]
- Austin, P.C. An Introduction to Propensity Score Methods for Reducing the Effects of Confounding in Observational Studies. Multivar. Behav. Res. 2011, 46, 399–424. [Google Scholar] [CrossRef]
- Vargas Buonfiglio, L.G.; Vanegas Calderon, O.G.; Cano, M.; Simmering, J.E.; Polgreen, P.M.; Zabner, J.; Gerke, A.K.; Comellas, A.P. Seasonal Antimicrobial Activity of the Airway: Post-Hoc Analysis of a Randomized Placebo-Controlled Double-Blind Trial. Nutrients 2020, 12, 2602. [Google Scholar] [CrossRef]
- Oristrell, J.; Oliva, J.C.; Casado, E.; Subirana, I.; Dominguez, D.; Toloba, A.; Balado, A.; Grau, M. Vitamin D supplementation and COVID-19 risk: A population-based, cohort study. J. Endocrinol. Investig. 2022, 45, 167–179. [Google Scholar] [CrossRef]
- Gibbons, J.B.; Norton, E.C.; McCullough, J.S.; Meltzer, D.O.; Lavigne, J.; Fiedler, V.C.; Gibbons, R.D. Association between vitamin D supplementation and COVID-19 infection and mortality. Sci. Rep. 2022, 12, 19397. [Google Scholar] [CrossRef]
- Ghahremani, M.; Smith, E.E.; Chen, H.Y.; Creese, B.; Goodarzi, Z.; Ismail, Z. Vitamin D supplementation and incident dementia: Effects of sex, APOE, and baseline cognitive status. Alzheimers Dement. 2023, 15, e12404. [Google Scholar] [CrossRef]
- Pittas, A.G.; Kawahara, T.; Jorde, R.; Dawson-Hughes, B.; Vickery, E.M.; Angellotti, E.; Nelson, J.; Trikalinos, T.A.; Balk, E.M. Vitamin D and Risk for Type 2 Diabetes in People With Prediabetes: A Systematic Review and Meta-analysis of Individual Participant Data From 3 Randomized Clinical Trials. Ann. Intern. Med. 2023, 176, 355–363. [Google Scholar] [CrossRef]
- Mirhosseini, N.; Vatanparast, H.; Kimball, S.M. The Association between Serum 25(OH)D Status and Blood Pressure in Participants of a Community-Based Program Taking Vitamin D Supplements. Nutrients 2017, 9, 1244. [Google Scholar] [CrossRef]
- Acharya, P.; Dalia, T.; Ranka, S.; Sethi, P.; Oni, O.A.; Safarova, M.S.; Parashara, D.; Gupta, K.; Barua, R.S. The Effects of Vitamin D Supplementation and 25-Hydroxyvitamin D Levels on the Risk of Myocardial Infarction and Mortality. J. Endocr. Soc. 2021, 5, bvab124. [Google Scholar] [CrossRef]
- McDonnell, S.L.; Baggerly, K.A.; Baggerly, C.A.; Aliano, J.L.; French, C.B.; Baggerly, L.L.; Ebeling, M.D.; Rittenberg, C.S.; Goodier, C.G.; Mateus Nino, J.F.; et al. Maternal 25(OH)D concentrations >/=40 ng/mL associated with 60% lower preterm birth risk among general obstetrical patients at an urban medical center. PLoS ONE 2017, 12, e0180483. [Google Scholar] [CrossRef]
- Rostami, M.; Tehrani, F.R.; Simbar, M.; Bidhendi Yarandi, R.; Minooee, S.; Hollis, B.W.; Hosseinpanah, F. Effectiveness of Prenatal Vitamin D Deficiency Screening and Treatment Program: A Stratified Randomized Field Trial. J. Clin. Endocrinol. Metab. 2018, 103, 2936–2948. [Google Scholar] [CrossRef]
- Hypponen, E.; Vimaleswaran, K.S.; Zhou, A. Genetic Determinants of 25-Hydroxyvitamin D Concentrations and Their Relevance to Public Health. Nutrients 2022, 14, 4408. [Google Scholar] [CrossRef]
- Davies, N.M.; Holmes, M.V.; Davey Smith, G. Reading Mendelian randomisation studies: A guide, glossary, and checklist for clinicians. BMJ 2018, 362, k601. [Google Scholar] [CrossRef]
- Bouillon, R.; Carmeliet, G. Vitamin D insufficiency: Definition, diagnosis and management. Best Pract. Res. Clin. Endocrinol. Metab. 2018, 32, 669–684. [Google Scholar] [CrossRef]
- Liu, D.; Meng, X.; Tian, Q.; Cao, W.; Fan, X.; Wu, L.; Song, M.; Meng, Q.; Wang, W.; Wang, Y. Vitamin D and Multiple Health Outcomes: An Umbrella Review of Observational Studies, Randomized Controlled Trials, and Mendelian Randomization Studies. Adv. Nutr. 2021, 13, 1044–1062. [Google Scholar] [CrossRef]
- Sutherland, J.P.; Zhou, A.; Hypponen, E. Vitamin D Deficiency Increases Mortality Risk in the UK Biobank: A Nonlinear Mendelian Randomization Study. Ann. Intern. Med. 2022, 175, 1552–1559. [Google Scholar] [CrossRef]
- Mokry, L.E.; Ross, S.; Morris, J.A.; Manousaki, D.; Forgetta, V.; Richards, J.B. Genetically decreased vitamin D and risk of Alzheimer disease. Neurology 2016, 87, 2567–2574. [Google Scholar] [CrossRef]
- Wang, L.; Qiao, Y.; Zhang, H.; Zhang, Y.; Hua, J.; Jin, S.; Liu, G. Circulating Vitamin D Levels and Alzheimer’s Disease: A Mendelian Randomization Study in the IGAP and UK Biobank. J. Alzheimers Dis. 2020, 73, 609–618. [Google Scholar] [CrossRef]
- Colak, Y.; Nordestgaard, B.G.; Afzal, S. Low vitamin D and risk of bacterial pneumonias: Mendelian randomisation studies in two population-based cohorts. Thorax 2021, 76, 468–478. [Google Scholar] [CrossRef]
- Afzal, S.; Brondum-Jacobsen, P.; Bojesen, S.E.; Nordestgaard, B.G. Vitamin D concentration, obesity, and risk of diabetes: A mendelian randomisation study. Lancet Diabetes Endocrinol. 2014, 2, 298–306. [Google Scholar] [CrossRef]
- Lu, L.; Bennett, D.A.; Millwood, I.Y.; Parish, S.; McCarthy, M.I.; Mahajan, A.; Lin, X.; Bragg, F.; Guo, Y.; Holmes, M.V.; et al. Association of vitamin D with risk of type 2 diabetes: A Mendelian randomisation study in European and Chinese adults. PLoS Med. 2018, 15, e1002566. [Google Scholar] [CrossRef]
- Wagner, C.L.; Hollis, B.W. The Implications of Vitamin D Status During Pregnancy on Mother and her Developing Child. Front. Endocrinol. 2018, 9, 500. [Google Scholar] [CrossRef]
- Merewood, A.; Mehta, S.D.; Chen, T.C.; Bauchner, H.; Holick, M.F. Association between vitamin D deficiency and primary cesarean section. J. Clin. Endocrinol. Metab. 2009, 94, 940–945. [Google Scholar] [CrossRef]
- Milajerdi, A.; Abbasi, F.; Mousavi, S.M.; Esmaillzadeh, A. Maternal vitamin D status and risk of gestational diabetes mellitus: A systematic review and meta-analysis of prospective cohort studies. Clin. Nutr. 2021, 40, 2576–2586. [Google Scholar] [CrossRef] [PubMed]
- Yuan, Y.; Tai, W.; Xu, P.; Fu, Z.; Wang, X.; Long, W.; Guo, X.; Ji, C.; Zhang, L.; Zhang, Y.; et al. Association of maternal serum 25-hydroxyvitamin D concentrations with risk of preeclampsia: A nested case-control study and meta-analysis. J. Matern. Fetal Neonatal Med. 2021, 34, 1576–1585. [Google Scholar] [CrossRef] [PubMed]
- Souberbielle, J.C.; Body, J.J.; Lappe, J.M.; Plebani, M.; Shoenfeld, Y.; Wang, T.J.; Bischoff-Ferrari, H.A.; Cavalier, E.; Ebeling, P.R.; Fardellone, P.; et al. Vitamin D and musculoskeletal health, cardiovascular disease, autoimmunity and cancer: Recommendations for clinical practice. Autoimmun. Rev. 2010, 9, 709–715. [Google Scholar] [CrossRef]
- Ross, A.C.; Manson, J.E.; Abrams, S.A.; Aloia, J.F.; Brannon, P.M.; Clinton, S.K.; Durazo-Arvizu, R.A.; Gallagher, J.C.; Gallo, R.L.; Jones, G.; et al. The 2011 report on dietary reference intakes for calcium and vitamin D from the Institute of Medicine: What clinicians need to know. J. Clin. Endocrinol. Metab. 2011, 96, 53–58. [Google Scholar] [CrossRef] [PubMed]
- Holick, M.F.; Binkley, N.C.; Bischoff-Ferrari, H.A.; Gordon, C.M.; Hanley, D.A.; Heaney, R.P.; Murad, M.H.; Weaver, C.M.; Endocrine, S. Evaluation, treatment, and prevention of vitamin D deficiency: An Endocrine Society clinical practice guideline. J. Clin. Endocrinol. Metab. 2011, 96, 1911–1930. [Google Scholar] [CrossRef] [PubMed]
- Pludowski, P.; Karczmarewicz, E.; Bayer, M.; Carter, G.; Chlebna-Sokol, D.; Czech-Kowalska, J.; Debski, R.; Decsi, T.; Dobrzanska, A.; Franek, E.; et al. Practical guidelines for the supplementation of vitamin D and the treatment of deficits in Central Europe—Recommended vitamin D intakes in the general population and groups at risk of vitamin D deficiency. Endokrynol. Pol. 2013, 64, 319–327. [Google Scholar] [CrossRef] [PubMed]
- Bouillon, R. Comparative analysis of nutritional guidelines for vitamin D. Nat. Rev. Endocrinol. 2017, 13, 466–479. [Google Scholar] [CrossRef]
- Pludowski, P.; Holick, M.F.; Grant, W.B.; Konstantynowicz, J.; Mascarenhas, M.R.; Haq, A.; Povoroznyuk, V.; Balatska, N.; Barbosa, A.P.; Karonova, T.; et al. Vitamin D supplementation guidelines. J. Steroid Biochem. Mol. Biol. 2018, 175, 125–135. [Google Scholar] [CrossRef]
- Haq, A.; Wimalawansa, S.J.; Pludowski, P.; Anouti, F.A. Clinical practice guidelines for vitamin D in the United Arab Emirates. J. Steroid Biochem. Mol. Biol. 2018, 175, 4–11. [Google Scholar] [CrossRef]
- Lips, P.; Cashman, K.D.; Lamberg-Allardt, C.; Bischoff-Ferrari, H.A.; Obermayer-Pietsch, B.; Bianchi, M.L.; Stepan, J.; El-Hajj Fuleihan, G.; Bouillon, R. Current vitamin D status in European and Middle East countries and strategies to prevent vitamin D deficiency: A position statement of the European Calcified Tissue Society. Eur. J. Endocrinol. 2019, 180, P23–P54. [Google Scholar] [CrossRef]
- Pludowski, P.; Takacs, I.; Boyanov, M.; Belaya, Z.; Diaconu, C.C.; Mokhort, T.; Zherdova, N.; Rasa, I.; Payer, J.; Pilz, S. Clinical Practice in the Prevention, Diagnosis and Treatment of Vitamin D Deficiency: A Central and Eastern European Expert Consensus Statement. Nutrients 2022, 14, 1483. [Google Scholar] [CrossRef]
- Pludowski, P.; Kos-Kudła, B.; Walczak, M.; Fal, A.; Zozulińska-Ziółkiewicz, D.; Sieroszewski, P.; Peregud-Pogorzelski, J.; Lauterbach, R.; Targowski, T.; Lewiński, A.; et al. Guidelines for Preventing and Treating Vitamin D Deficiency: A 2023 Update in Poland. Nutrients 2023, 15, 695. [Google Scholar] [CrossRef]
- Grant, W.B.; al Anouti, F.; Boucher, B.J.; Fakhoury, H.M.; Moukayed, M.; Pilz, S.; Al-Daghri, N.M. Evidence That Increasing Serum 25(OH)D Concentrations to 30 ng/mL in the Kingdom of Saudi Arabia and the United Arab Emirates Could Greatly Improve Health Outcomes. Biomdeicines 2023, 11, 994. [Google Scholar] [CrossRef] [PubMed]
- Drincic, A.T.; Armas, L.A.; van Diest, E.E.; Heaney, R.P. Volumetric dilution, rather than sequestration best explains the low vitamin D status of obesity. Obesity 2012, 20, 1444–1448. [Google Scholar] [CrossRef] [PubMed]
- Furman, D.; Campisi, J.; Verdin, E.; Carrera-Bastos, P.; Targ, S.; Franceschi, C.; Ferrucci, L.; Gilroy, D.W.; Fasano, A.; Miller, G.W.; et al. Chronic inflammation in the etiology of disease across the life span. Nat. Med. 2019, 25, 1822–1832. [Google Scholar] [CrossRef] [PubMed]
- Roizen, J.D.; Long, C.; Casella, A.; O’Lear, L.; Caplan, I.; Lai, M.; Sasson, I.; Singh, R.; Makowski, A.J.; Simmons, R.; et al. Obesity Decreases Hepatic 25-Hydroxylase Activity Causing Low Serum 25-Hydroxyvitamin D. J. Bone Miner. Res. 2019, 34, 1068–1073. [Google Scholar] [CrossRef]
- Palaniswamy, S.; Gill, D.; de Silva, N.M.; Lowry, E.; Jokelainen, J.; Karhu, T.; Mutt, S.J.; Dehghan, A.; Sliz, E.; Chasman, D.I.; et al. Could vitamin D reduce obesity-associated inflammation? Observational and Mendelian randomization study. Am. J. Clin. Nutr. 2020, 111, 1036–1047. [Google Scholar] [CrossRef]
- Ogden, C.L.; Fakhouri, T.H.; Carroll, M.D.; Hales, C.M.; Fryar, C.D.; Li, X.; Freedman, D.S. Prevalence of Obesity Among Adults, by Household Income and Education—United States, 2011–2014. MMWR Morb. Mortal. Wkly. Rep. 2017, 66, 1369–1373. [Google Scholar] [CrossRef]
- Wang, Y.; Beydoun, M.A.; Min, J.; Xue, H.; Kaminsky, L.A.; Cheskin, L.J. Has the prevalence of overweight, obesity and central obesity levelled off in the United States? Trends, patterns, disparities, and future projections for the obesity epidemic. Int. J. Epidemiol. 2020, 49, 810–823. [Google Scholar] [CrossRef]
- Bray, G.A.; Heisel, W.E.; Afshin, A.; Jensen, M.D.; Dietz, W.H.; Long, M.; Kushner, R.F.; Daniels, S.R.; Wadden, T.A.; Tsai, A.G.; et al. The Science of Obesity Management: An Endocrine Society Scientific Statement. Endocr. Rev. 2018, 39, 79–132. [Google Scholar] [CrossRef]
- Cornelius, M.E.; Loretan, C.G.; Jamal, A.; Davis Lynn, B.C.; Mayer, M.; Alcantara, I.C.; Neff, L. Tobacco Product Use Among Adults—United States, 2021. MMWR Morb. Mortal. Wkly. Rep. 2023, 72, 475–483. [Google Scholar] [CrossRef]
- Stoody, E.E. Dietary Guidelines for Americans, 2020–2025; U.S. Department of Agriculrure: Washington, DC, USA, 2020; p. 149.
- Evert, A.B.; Dennison, M.; Gardner, C.D.; Garvey, W.T.; Lau, K.H.K.; MacLeod, J.; Mitri, J.; Pereira, R.F.; Rawlings, K.; Robinson, S.; et al. Nutrition Therapy for Adults With Diabetes or Prediabetes: A Consensus Report. Diabetes Care 2019, 42, 731–754. [Google Scholar] [CrossRef]
- Fassler, J. Inside Big Beef’s Climate Messaging Machine: Confuse, Defend and Downplay. Available online: https://www.theguardian.com/environment/2023/may/03/beef-industry-public-relations-messaging-machine?CMP=share_btn_tw (accessed on 20 May 2023).

| Criterion | Meaning |
|---|---|
| Strength of association | OR or RR between 1 and 2 is considered weak, whereas >2.0 is considered strong. |
| Consistency | Similar findings in different situations. |
| Specificity | A factor influences specifically a particular outcome or population. |
| Temporality | The causal agent should precede the incidence of an expected outcome. |
| Biological gradient | A monotonically changing dose-response relationship. |
| Plausibility | Mechanisms exist to explain the effect. |
| Coherence | The interpretation should not seriously conflict with generally known facts of the natural history and biology of the disease. |
| Experiment | RCTs are generally the strongest type of evidence. They should be for disease outcomes, not merely biological parameters related to diseases. In the absence of RCTs, prospective studies may be used. |
| Analogy | Analogous exposures for demonstrated outcomes. |
| Food Groups | Q1 Intake (Servings/Day) [90] | Q5 Intake (Servings/Day) [90] | rEDIH r [22] | rEDIP r [22] |
|---|---|---|---|---|
| Proinflammatory | ||||
| French fries | −0.39 | −0.14 | ||
| High-energy drinks | 0.20 ± 0.34 | 0.52 ± 0.75 | −0.20 | −0.25 |
| Low-energy drinks | 0.33 ± 0.63 | 0.89 ± 1.54 | −0.21 | −0.17 |
| Processed meats | 0.30 ± 0.32 | 0.55 ± 0.64 | −0.35 | −0.17 |
| Red meat | 0.55 ± 0.40 | 0.81 ± 0.59 | −0.48 | −0.22 |
| Refined grains | 0.96 ± 0.79 | 1.80 ± 1.52 | −0.04 | −0.22 |
| Anti-inflammatory | ||||
| Beer | 0.67 ± 1.13 | 0.11 ± 0.26 | 0.08 | 0.18 |
| Coffee | 3.40 ± 2.14 | 0.94 ± 1.24 | 0.31 | 0.45 |
| Fruit juice | 0.93 ± 1.15 | 0.67 ± 0.70 | 0.11 | 0.09 |
| Leafy green vegetables | 0.95 ± 0.65 | 0.61 ± 0.51 | 0.20 | 0.29 |
| Whole grains | 0.22 | 0.15 | ||
| Wine | 0.65 ± 0.96 | 0.08 ± 0.17 | 0.27 | 0.22 |
| Disease or Outcome | Variable | Population | Approach | Finding | Ref. |
|---|---|---|---|---|---|
| T2DM | Refined rice and wheat | 184 countries | Cross-sectional study | Attributable burden 24.6% (95% CI, 22.3–27.2%) | [68] |
| T2DM | UPFs (Q1, <215 g/d; Q2, 215–323 g/d; Q3, >323 g/d) | Spain, 20,060 adults, 175 new cases | Prospective study, 12-yr follow-up | HR = 1.53 (95% CI, 1.06–2.22) | [100] |
| Periodontitis, moderate/severe | UPFs | Southern Brazil, N = 537, 205 with initial, moderate, and severe periodontitis; results for moderate and severe periodontitis | Prospective study | Standardized coefficient = 0.11, standard error = 0.05, p = 0.02 | [101] |
| Overweight/obesity | UPFs | 8451 middle-aged university graduates in Spain, followed up for a median of 8.9 yrs [102]; 11,872 civil servants in Brazil 35–74 yrs followed up for a mean of 3.9 yrs [103] | Two prospective observational studies | RR = 1.23 (95% CI, 1.11–1.36) | [104] |
| IHD/cerebrovascular disease mortality | UPFs (14.6% vs. <6.6%) | Italy, 22,475 men, mean age 55 ± 12 yrs, 255 deaths | Prospective study, 8.2-yr follow-up | HR = 1.52 (95% CI, 1.10–2.09) | [105] |
| CVD mortality | UPFs (14.6% vs. <6.6%) | Italy, 22,475 men, mean age 55 ± 12 yrs, 439 deaths | Prospective study, 8.2-yr follow-up | HR = 1.58 (95% CI, 1.23–2.03) | [105] |
| CVD incidence/mortality | UPFs | Three prospective observational studies | Meta-analysis | RR = 1.29 (95% CI, 1.12–1.48) | [104] |
| All-cause mortality rate | UPFs (14.6% vs. <6.6%) | Italy, 22,475 men, mean age 55 ± 12 yrs, | Prospective study, 8.2-yr follow-up | HR = 1.26 (95% CI, 1.09–1.46) | [105] |
| All-cancer incidence | UPFs (Q1, 8.5 ± 2.5%; Q2, 14.3 ± 1.4%; Q3, 19.8 ± 1.9%; Q4, 32 ± 9.8%) | France, adults, median age 42.8 yrs, 2228 cases | Prospective study, 2009–2017 | For Q4 vs. Q1, HR = 1.23 (95% CI, 1.08–1.40, ptrend = 0.001) | [106] |
| Outcome | Mechanisms | Ref. |
|---|---|---|
| Autoimmune diseases | Regulates adaptive immunity so that the body does not attack its own tissues | [139] |
| Bone health | Regulates calcium and phosphorus absorption and metabolism | [137] |
| Cancer | Reduces incidence by affecting cellular differentiation, proliferation, and apoptosis; reduces mortality by reducing angiogenesis around tumors and metastasis; many other mechanisms | [140] |
| CVD | Vitamin D deficiency activates renin-angiotensin-aldosterone system; serum 25(OH)D upregulates nitric oxide concentrations, reduces oxidative stress and regulates inflammatory pathways | [141] |
| Infectious diseases | Induces production of antimicrobial peptides such as human cathelicidin; reduces risk of cytokine storm | [142,143] |
| Infectious diseases | Inhibits expression of proinflammatory cytokines through blocking the TNF-induced NF-κB1 signaling pathway; and initiates expression of ISGs for antiviral defense program through activating the IFN-α-induced Jak-STAT signaling pathway | [144] |
| Inflammation | Shifts production of cytokines from Th1 (proinflammatory) to Th2 (anti-inflammatory) | [145] |
| Insulin resistance | Maintains pancreatic β-cell function; increases insulin sensitivity in insulin-responsive tissue; reduces serum concentrations of parathyroid hormone; regulates renin-angiotensin-aldosterone system; exerts positive effects on hepatic lipogenesis and gluconeogenesis; reduces formation of reactive oxygen species | [146] |
| Muscle health | Regulates oxygen consumption rate, maintains mitochondrial function, reduces risk of muscle atrophy | [147] |
| Pregnancy outcomes | Most effects mediated by calcitriol, whose concentrations increase during pregnancy. Calcitriol regulates calcium absorption from the GI tract. Calcitriol produced in the placenta acts as an autocrine/paracrine regulator of immunity at the fetal-maternal interface for acceptance of the fetal allograft; calcitriol regulates estradiol and progesterone secretion in the placenta; calcitriol downregulates FLT1 and vascular endothelial growth factor gene expression, thereby reducing risk of preeclampsia. Calcitriol regulates immune function through effects on cytokine production | [148] |
| Population | Intervention: Vitamin D Dose, Ca Dose | Baseline, Achieved 25(OH)D (ng/mL) | Outcome | Ref. |
|---|---|---|---|---|
| Michigan, USA, 40 patients with severe PD; all received open flap debridement surgery in one segment of the mouth | Half given teriparatide (20 µg) or placebo; all given 800 IU/d and 1000 mg from 3 days before surgery to 6 wks after | Deficient (N = 7): 17 ± 0; 6 wks, 26 ± 4; 6 mo, 20 ± 3 Sufficient (N = 13): 34 ± 3; 6 wks, 41 ± 6; 6 mo, 31 ± 2 | BL to 1 yr deficient vs. sufficient: CAL gain: −0.43 vs. 0.92 mm, p < 0.01 PPD reduction: −0.43 vs. 1.83 mm, p < 0.01 RLBG: not significant For teriparatide treatment, no significant effect of vitamin D on CAL and PPD, but IDR was better for vitamin D sufficient (2.05 mm) than vitamin D deficient (0.87 mm), p < 0.01 | [160] |
| India, 96 adults 18–64, various stages of gingivitis | GpA, 2000 IU/d; GpB, 1000 IU/d; GpC, 500 IU/d; GpD, 0 IU/d | GpA, 22 ± 7; 52 ± 10; GpB, 27 ± 1; 44 ± 9; GpC, 24 ± 5; 37 ± 6; GpD, 28 ± 3; 29 ± 4 | BL to 3 m, GI; % reduction GpA: 2.4 ± 0.5, 62% ** GpB: 2.4 ± 0.6, 53% ** GpC: 2.2 ± 0.6, 38% ** GpD: 2.3 ± 0.6, 0 | [161] |
| Egypt, 28 patients with CP treated with SRP | T: 10,000 IU/d, 5 d/wk, 12 wk | T: 14 ± 8; 38 ± 8 C: 17 ± 6; ? | BL to 3 m, Mean diff T, C GI: −19% * PI: −10% * PPD: −26% * CAL: −13% * | [162] |
| China, 360 moderate-to-severe periodontitis patients | T1: 120, 2000 IU/d T2: 120, 1000 IU/d | T1, 2000 IU/d: 25 ± 2; 58 ± 2 T, 1000 IU/d: 41 ± 2; C: 26 ± 2 | AL (mm): T1, −0.3 ± 0.2; T2, −0.3 ± 0.2; C, −0.2 ± 0.1; p = 0.048 PPD (mm): T1, −0.1 ± 0.2; T2, −0.1 ± 0.2; C, −0.1 ± 0.1; p = 0.043 | [163] |
| India, 27 healthy periodontitis patients | T: 25,000 IU/wk, 6 mo | T (N = 13): 17; 39 C (N = 14): 14; 23 | FMBS, NS; FMPS, NS; PPD, NS | [159] |
| Russia, 110 patients with moderate generalized periodontitis, 40 controls, all given conventional periodontal treatment by day 14 | Gp1 (N = 55): 0 Gp2 (N = 55): 800 IU/d; 500 mg/d, 12 mo Gp3 (N = 40): 0 | Gp1: 15 ± 0; 17 ± 0 Gp2: 15 ± 0; 37 ± 0 Gp3: 44 ± 1; 45 ± 0 | BL, 12 m MI: Gp1, 2.6 ± 0.0; 2.1 ± 0.1 * Gp2: 2.7 ± 0.1; 1.1 ± 0.0 * Gp3: 2.5 ± 0.1; 1.3 ± 0.0 * PeI: Gp1: 5.4 ± 0.1; 4.7 ± 0.1 * Gp2: 5.4 ± 0.1; 3.7 ± 0.1 * Gp3: 5.3 ± 0.1; 3.6 ± 0.1 * PMA: Gp1: 53 ± 0; 33 ± 1 * Gp2: 52 ± 1; 22 ± 0 * Gp3: 53 ± 0; 19 ± 0 * SI: Gp1: 3.1 ± 0.0; 1.8 ± 0.1 * Gp2: 3.2 ± 0.1; 1.4 ± 0.1 * Gp3: 3.0 ± 0.1; 0.9 ± 0.0 * | [164] |
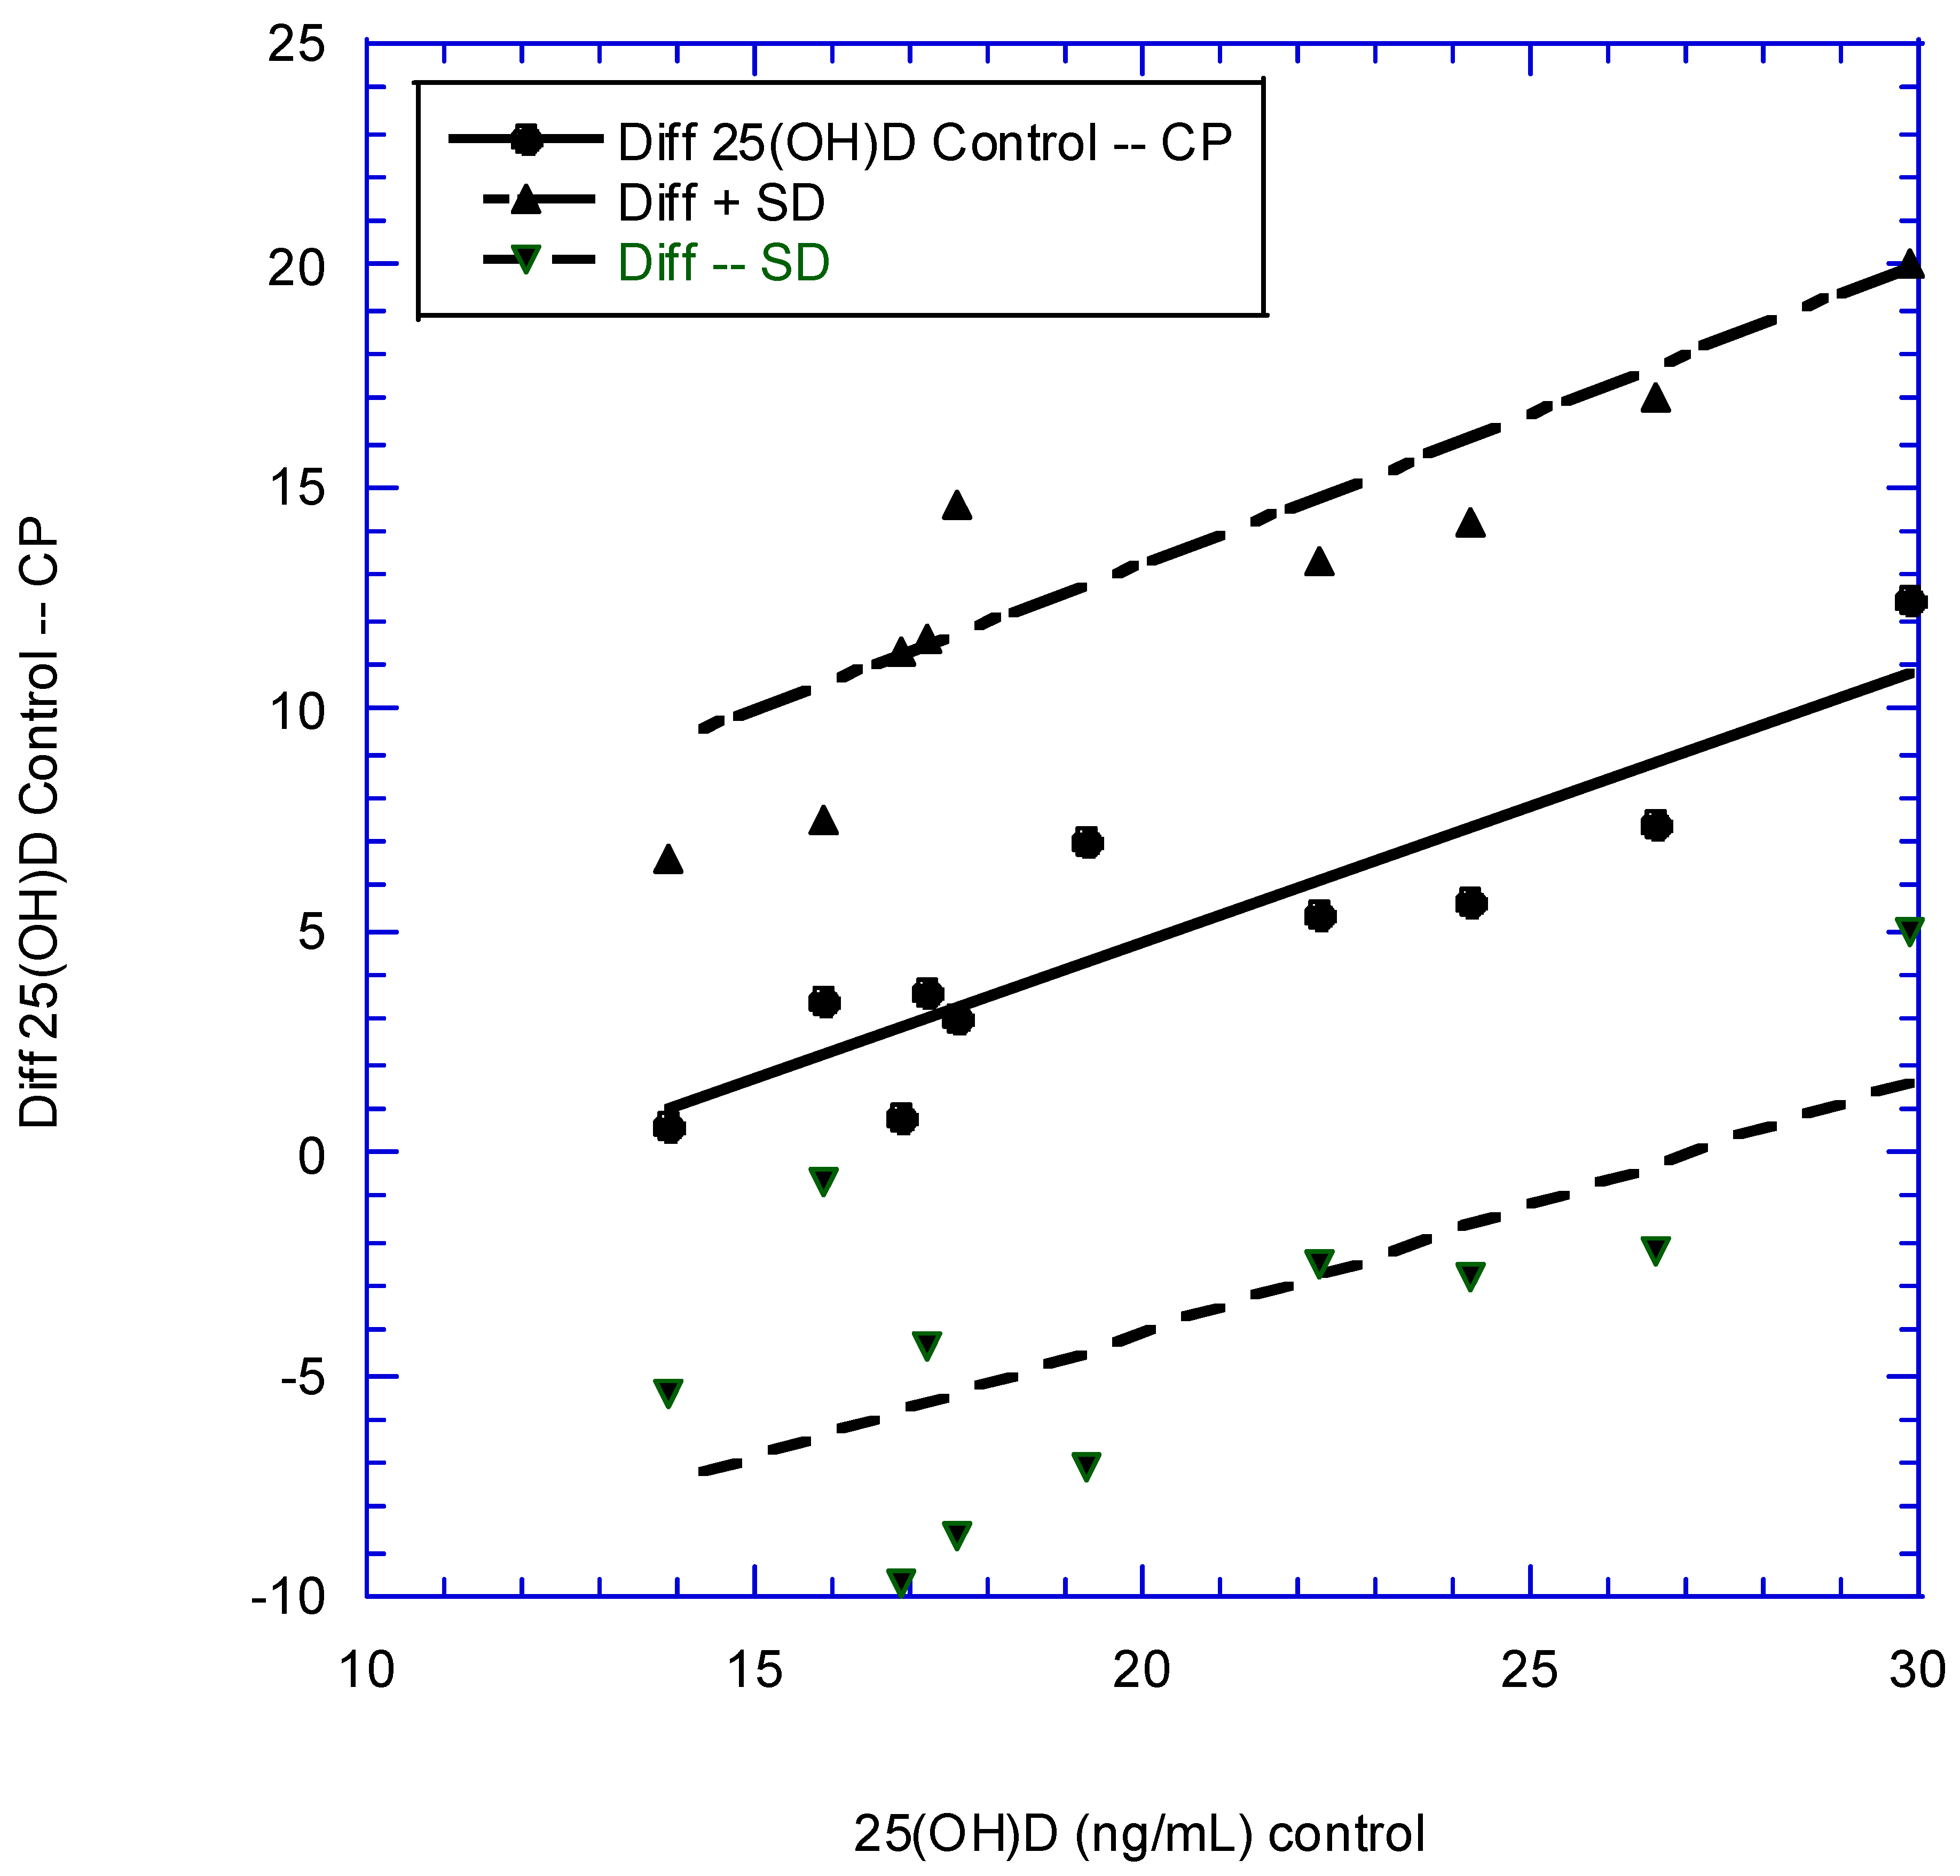
| Country | Year Pub. | Sex | Population CP, N, Age (Mean, Range), Years | 25(OH)D (ng/mL) PD | Population Controls, N, Age (Mean, Range), Years | 25(OH)D (ng/mL) Controls | Ref. |
|---|---|---|---|---|---|---|---|
| India | 2023 | F, M | 50, 33 ± 6 | 13.6 ± 4.7 | 50, 31 ± 6 | 17.2 ± 6.9 | [183] |
| USA | 2021 | F, M | 1437, 69 | 29.1 ± 12.3 | 625, 69 yrs | 33.2 ± 12.2 | [88] |
| Italy | 2020 | F, M | 46, 53 ± 4 | 17.4 ± 5.2 | 43, 54 ± 5 | 29.9 ± 5.4 | [184] |
| Norway (Nor) | 2019 | M | 21, 52 ± 13 | 19.2 ± 6.1 | 23, 50 ± 13 | 26.6 ± 7.4 | [185] |
| Norway (Tam) | 2019 | M | 27 | 13.3 ± 5.0 | 21 | 13.9 ± 3.4 | [185] |
| Turkey | 2018 | F, M | 55, 36 (30–47) | 16.1 ± 8.3 | 27, 39 (21–40) | 16.9 ± 6.4 | [186] |
| USA | 2018 | 388 | 19.4 ± 1.0 | 9308 | 21.8 ± 0.5 | [187] | |
| USA (Puerto Rico) | 2017 | F, M | 19, 48 ± 9 | 18.5 ± 4.6 | 19, 49 ± 8 | 24.2 ± 7.1 | [188] |
| Turkey | 2017 | F, M | 18 | 14.6 ± 6.4 | 18 | 17.6 ± 9.7 | [189] |
| Iran | 2016 | F | 30, 34 | 12.3 ± 8.4 | 30, 34 | 19.3 ± 10.1 | [190] |
| India | 2016 | F, M | 50, 43 | 16.9 ± 5.5 | 48, 44 | 22.3 ± 5.7 | [191] |
| Disease | Population | Intervention | Finding | Ref. |
|---|---|---|---|---|
| Asthma | 7 RCTs with 95 events for 518 participants in treatment arm, 526 controls with 133 events | Vitamin D supplementation | Reduction in rate of asthma exacerbation (RR = 0.73 [95% CI, 0.58–0.92], but only for patients with serum 25(OH)D <30 ng/mL). | [202] |
| Autoimmune disease | 25,871 participants, USA, mean 25(OH)D in treatment group ~31 ng/mL | Half given 2000 IU/d vitamin D3, followed up for 5.3 years | 63 participants who received vitamin D and omega-3 fatty acids (HR = 0.69 [95% CI, 0.49–0.96]), 60 who received only vitamin D (HR = 0.68 [95% CI, 0.48–0.94]). Due mainly to rheumatoid arthritis. | [203] |
| Cancer, all, incidence, mortality rates | 25,871 participants, USA, mean 25(OH)D in treatment group ~31 ng/mL | Half given 2000 IU/d vitamin D3, followed up for 5.3 years | Secondary analysis of an RCT for those with BMI <25 kg/m2: 25(OH)D increased from 33 to 46 ng/mL, HR = 0.76 (95% CI, 0.63–0.90). For all-cancer mortality after omission of the first 2 years of data HR = 0.75 (95% CI, 0.59–0.96). | [195] |
| Cancer, all mortality rate | For total cancer mortality, five trials were included (1591 deaths; 3–10 years of follow-up; 22–54 ng/mL of achieved circulating 25(OH)D in intervention group) | Vitamin D supplementation | RR = 0.87 (95% CI, 0.79–0.96; p = 0.005) | [204] |
| Cancer, colorectal, survival | 7 RCTs with 957 colorectal cancer patients | Vitamin D supplementation | Reduction in adverse outcomes, N = 815, HR = 0.70 (95% CI, 0.48–0.93); progression-free survival, N = 340, HR = 0.65 (95% CI, 0.36–0.94) | [205] |
| Dental caries | 17 trials from 1926 to 1942, 660 participants, mean ages 4–12 yrs | Vitamin D3 supplementation, 300–1400 IU/d (one with 3050 IU/d) | Reduced risk of dental caries, pooled relative rate = 0.51 (95% CI, 0.40–0.65) | [206] |
| Osteoporosis Review | Vitamin D deficiency symptoms are secondary hyperparathyroidism and bone loss, leading to osteoporosis and fractures; mineralization defects, which may lead to osteomalacia in the long term; and muscle weakness, causing falls and fractures. | [207] | ||
| RTIs, acute | 25 eligible RCTs (total 11,321 participants, aged 0–95 years) were identified. IPDs obtained for 10,933 (96.6%) participants. | Vitamin D supplementation reduced risk of acute RTI among all participants (aOR = 0.88 [95% CI, 0.81–0.96]). In subgroup analysis, protective effects were seen in those receiving daily or weekly vitamin D without additional bolus doses (aOR = 0.8 [95% CI, 0.72–0.91]) | [208] |
| Disease or Outcome | Population | Intervention | Finding | Ref. |
|---|---|---|---|---|
| Airway microbial activity | 40 participants in US, aged 18–60 yrs | 20 supplemented with 1000 IU/d of vitamin D3 in summer, 20 in winter, 20 with placebo in each season | Airway surface liquid had high antimicrobial (LL-37) activity in summer without vitamin D supplementation and in winter after vitamin D supplementation | [212] |
| COVID-19 | All people ≥18 years old living in Barcelona-Central Catalonia (n = 4.6 million) | Those supplemented with cholecalciferol or calcifediol from April 2019 to February 2020 were compared with propensity score-matched untreated controls | Patients on cholecalciferol treatment achieving 25(OH)D levels ≥30 ng/mL had lower risk of SARS-CoV-2 infection, lower risk of severe COVID-19, and lower COVID-19 mortality than unsupplemented 25(OH)D-deficient patients (56/9474 [0.6%] vs. 96/7616 [1.3%]; HR = 0.66 (95% CI, 0.46–0.93), p = 0.02) | [213] |
| COVID-19 | VA patients with Veterans Administration Corporate Data Warehouse electronic health records. 199,498 treated, controls | Those with at least one VA service or vitamin D3 prescription and at least one vitamin D lab test between 1 January 2019, and 31 December 2020 | For COVID-19 incidence: HR = 0.72 (95% CI, 0.65–0.79) For COVID-19 mortality: HR = 0.77 (95% CI, 0.55–1.06) | [214] |
| Dementia | US, 12,388 participants National Alzheimer’s Coordinating Center dataset, followed up 1 yr | 1797 had calcium-vitamin D; 1046 had cholecalciferol only; 1283 had ergocalciferol only; and 511 had at least two supplements together, mostly ergocalciferol plus calcium-vitamin D (n = 268) and cholecalciferol plus calcium-vitamin D (n = 233). Age ~72 ± 8 yrs | For incident dementia, HR = 0.60 (95% CI, 0.55–0.65) Limitation: no information on serum 25(OH)D concentration available | [215] |
| Prediabetes to T2DM | 3 RCTs included | Tested cholecalciferol, 20,000 IU (500 μg) weekly; cholecalciferol, 4000 IU (100 μg) daily; or eldecalcitol, 0.75 μg daily, vs. matching placebos | Among participants assigned to vitamin D group who maintained an intratrial mean serum 25(OH)D level of ≥50 ng/mL compared with 20–29 ng/mL during follow-up, cholecalciferol reduced risk for diabetes by 76% (HR = 0.24 [95% CI, 0.16–0.36]), with a 3-yr absolute risk reduction of 18.1% (95% CI, 11.7–24.6%). | [216] |
| Hypertension | Open-label vitamin D supplementation to increase 25(OH)D concn to >40 ng/mL. | For hypertensives, this reduced systolic blood pressure by 18 mmHg and diastolic blood pressure by 12 mmHg and reduced prevalence of hypertension in 71%. | [217] | |
| MI | Patients treated at Veterans Health Administration from 1999 to 2018 | Three groups: 25(OH)D <20 ng/mL; treated with vitamin D, 25(OH)D 20–30 ng/mL; treated with vitamin D, 25(OH)D >30 ng/mL. Among the cohort of 20,025 patients, risk of MI was significantly lower for >30 ng/mL vs. 20–30 ng/mL (HR = 0.65 [95% CI, 0.49–0.85]) and <20 ng/mL (HR = 0.73 [95% CI, 0.55–0.96]). | [218] | |
| Preterm delivery | 1064 pregnant patients aged 18–45 yrs between September 2015 and December 2016 in South Carolina. 46% white, 37% African American, 11% Hispanic. | Serum 25(OH)D concn measured at first prenatal visit. Women counseled on how to achieve 25(OH)D >40 ng/mL and given bottles of 5000-IU vitamin D3 capsules. | Overall preterm birth rate was 13%. For preterm birth, comparing >40 ng/mL vs. <40 ng/mL, OR = 0.38 (95% CI, 0.23–0.62, ptrend = 0.0003). Result largely independent of race/ethnicity. | [219] |
| Pregnancy outcomes: stratified randomized field trial in Iran | Iran, 900 pregnant women at screening site; 900 at nonscreening site. | Subjects with moderate deficiency I1: 50,000 IU of oral vitamin D3/wk for 6 wks I2: 50,000 IU of oral vitamin D3/wk for 6 wks and then maintenance dose of 50,000 IU/mo of vitamin D3 until delivery I3: Single dose of i.m. 300,000 IU of vitamin D3 I4: Single dose of i.m. 300,000 IU of vitamin D3 and then maintenance dose of 50,000 IU/mo of vitamin D3 until delivery Subjects with severe deficiency I5: 50,000 IU of oral vitamin D3/wk for 12 wks I6: 50,000 IU of oral vitamin D3/wk for 12 wks and then maintenance dose of 50,000 IU/mo of vitamin D3 until delivery I7: i.m. 300,000 IU of vitamin D3; 2 doses for 6 wks I8: i.m. 300,000 IU of vitamin D3; 2 doses for 6 wks, followed by maintenance dose of 50,000 IU/mo of vitamin D3 until delivery | After supplementation, only 2% of women in nonscreening (control) site had 25(OH)D >20 ng/mL vs. 53% of women in screening site. Adverse pregnancy outcomes, including preeclampsia, gestational diabetes mellitus, and preterm delivery, were decreased by 60%, 50%, and 40%, respectively, in screening (supplementation) site. | [220] |
| Outcome | Population | Approach | Finding | Ref. |
|---|---|---|---|---|
| All-cause mortality rate | 307,601 unrelated UK Biobank participants of White European ancestry (aged 37–73 yrs at recruitment). 18,700 deaths during 14-yr follow-up. | Genetically predicted 25(OH)D estimated using 35 confirmed variants of 25(OH)D. 100 strata of 25(OH)D used. | Association of genetically predicted 25(OH)D with all-cause mortality was L-shaped (pnonlinear < 0.001), and risk for death decreased steeply with increasing concentrations until 20 ng/mL. Evidence for association also seen in analyses of mortality from cancer, CVD, and respiratory diseases (p ≤ 0.033 for all outcomes). | [225] |
| AD | Data from International Genomics of Alzheimer’s Project (N = 17,008 AD cases and 37,154 controls). | SUNLIGHT Consortium identified 4 SNPs to be genomewide significant for 25(OH)D, which described 2.44% of variance in 25(OH)D in Canadian Multicentre Osteoporosis Study | A 1-SD decrease in natural log–transformed 25(OH)D (~10 ng/mL increased AD OR = 1.25 (95% CI, 1.03–1.51; p = 0.02). | [226] |
| AD | 21,982 cases and 41,944 cognitively healthy controls of European descent from four consortia, including ADGC, CHARGE, EADI, and GERAD/PERADES | 6 loci including GC, NADSYN1/DHCR7, CYP2R1, CYP24A1, SEC23A, and AMDHD1 from a recent GWAS including 79,366 (all European descent) | For meta-analysis of results for each SNP OR = 0.62 (95% CI, 0.46–0.84). | [227] |
| AD | UK Biobank. In this GWAS dataset, a proxy phenotype for AD case-control status was assessed via self-report. Participants asked to report “Has/did your father or mother ever suffer from Alzheimer’s disease/dementia?” Excluded participants whose parents were aged <60 yrs, dead before reaching age 60 yrs, or without age information. | 6 loci including GC, NADSYN1/DHCR7, CYP2R1, CYP24A1, SEC23A, and AMDHD1 from a recent GWAS including 79,366 (all European descent) | For meta-analysis of results for each SNP OR = 0.88 (95% CI, 0.73–1.06; p = 0.19). | [227] |
| CVD | Nonlinear MR analysis conducted in UK Biobank with 44,519 CVD cases and 251,269 controls. Serum 25(OH)D concn instrumented using 35 confirmed genomewide significant variants. | We constructed a weighted genetic score (vitamin D-GS) consisting of 35 SNPs to instrument serum 25(OH)D concn. 100 strata of 25(OH)D used. | L-shaped association between genetically predicted serum 25(OH)D and CVD risk (pnonlinear = 0.007), where CVD risk initially decreased steeply with increasing concentrations and leveled off around 20 ng/mL. | [198] |
| Pneumonia, bacterial | 116,335 randomly chosen white Danes aged 20–100 yrs from the Copenhagen City Heart Study and Copenhagen General Population Study | Plasma 25(OH)D decreasing genetic variants around CYP2R1 (rs117913124, rs12794714, and rs10741657), DHCR7 (rs7944926 and rs11234027), GEMIN2 (rs2277458), and HAL (rs3819817) | In genetic analyses, OR for bacterial pneumonia per 4-ng/mL lower plasma 25(OH)D was 1.12 (95% CI, 1.02–1.23) in Wald’s ratio, 1.12 (95% CI, 1.04–1.20) in inverse variance weighted, 1.63 (95% CI, 0.96–2.78) in MR-Egger, and 1.15 (95% CI, 1.05–1.26) in weighted median instrumental variable analysis. | [228] |
| T2DM | 96,423 white Danes aged 20–100 yrs from 3 studies. 5037 had T2DM | Assessed effects of genetic variation in DHCR7 (related to endogenous production) and CYP2R1 (related to liver conversion) on plasma 25(OH)D concn | OR for T2DM for 8-ng/mL reduction in genetically determined plasma 25(OH)D concn was 1.51 (95% CI, 0.98–2.33). | [229] |
| T2DM | Meta-analysis of 10 MR studies involving 58,312 cases and 370,592 controls | Genetic score using two 25(OH)D synthesis SNPs (DHCR7-rs12785878 and CYP2R1-rs10741657) | For 10-ng/mL increase in genetically determined 25(OH)D OR = 0.86 (95% CI, 0.77–0.97). | [230] |
| Year | Country(ies) or Region | Organization | Target | 25(OH)D Concn (ng/mL) | Vitamin D Dose (IU/d) (40 IU = 1 µg) | Ref. |
|---|---|---|---|---|---|---|
| 2010 | Western developed | Experts | General health | 30–100 | 800 | [235] |
| 2011 | USA | IOM | Bone health | >20 | 600–800 | [236] |
| 2011 | USA | Endocrine Society | Bone health | >30 | 1000–2000 | [237] |
| 2013 | Poland | EVIDAS | General health | 30–50 | Adults: 800–2000; obese adults: 1600–4000 | [238] |
| 2017 | 40 countries | Review | General health | >12 or >20 in most guidelines | Mostly 200–800 | [239] |
| 2018 | Poland | EVIDAS | General health | >30 | 200–2000 | [240] |
| 2018 | UAE and Gulf populations | Experts | General health | 30–50 | 400–2000, depending on age | [241] |
| 2018 | USA | Experts | Pregnancy | >40 | 4000–5000 | [231] |
| 2019 | Europe, Middle Eastern | ECTS | General health | >20 in most guidelines | Not given | [242] |
| 2022 | Central and Eastern Europe | Experts | General health | 30–50 | 800–2000; higher vitamin D doses (e.g., 6000 IU/d) may be used for the first 2–4 weeks | [243] |
| 2023 | Poland | EVIDAS | General health | 30–50 | 400–4000 depending on age | [244] |
| 2023 | KSA and UAE | Experts | General health | >30 | Up to 4000 | [245] |
Disclaimer/Publisher’s Note: The statements, opinions and data contained in all publications are solely those of the individual author(s) and contributor(s) and not of MDPI and/or the editor(s). MDPI and/or the editor(s) disclaim responsibility for any injury to people or property resulting from any ideas, methods, instructions or products referred to in the content. |
© 2023 by the authors. Licensee MDPI, Basel, Switzerland. This article is an open access article distributed under the terms and conditions of the Creative Commons Attribution (CC BY) license (https://creativecommons.org/licenses/by/4.0/).
Share and Cite
Grant, W.B.; van Amerongen, B.M.; Boucher, B.J. Periodontal Disease and Other Adverse Health Outcomes Share Risk Factors, including Dietary Factors and Vitamin D Status. Nutrients 2023, 15, 2787. https://doi.org/10.3390/nu15122787
Grant WB, van Amerongen BM, Boucher BJ. Periodontal Disease and Other Adverse Health Outcomes Share Risk Factors, including Dietary Factors and Vitamin D Status. Nutrients. 2023; 15(12):2787. https://doi.org/10.3390/nu15122787
Chicago/Turabian StyleGrant, William B., Barbara M. van Amerongen, and Barbara J. Boucher. 2023. "Periodontal Disease and Other Adverse Health Outcomes Share Risk Factors, including Dietary Factors and Vitamin D Status" Nutrients 15, no. 12: 2787. https://doi.org/10.3390/nu15122787
APA StyleGrant, W. B., van Amerongen, B. M., & Boucher, B. J. (2023). Periodontal Disease and Other Adverse Health Outcomes Share Risk Factors, including Dietary Factors and Vitamin D Status. Nutrients, 15(12), 2787. https://doi.org/10.3390/nu15122787