
Unrestricted Ketogenic Diet Feeding Enhances Epithelial Ovarian Cancer Growth In Vivo

 , ,
, ,  and
and
Abstract
1. Introduction
2. Materials and Methods
2.1. Cell Lines
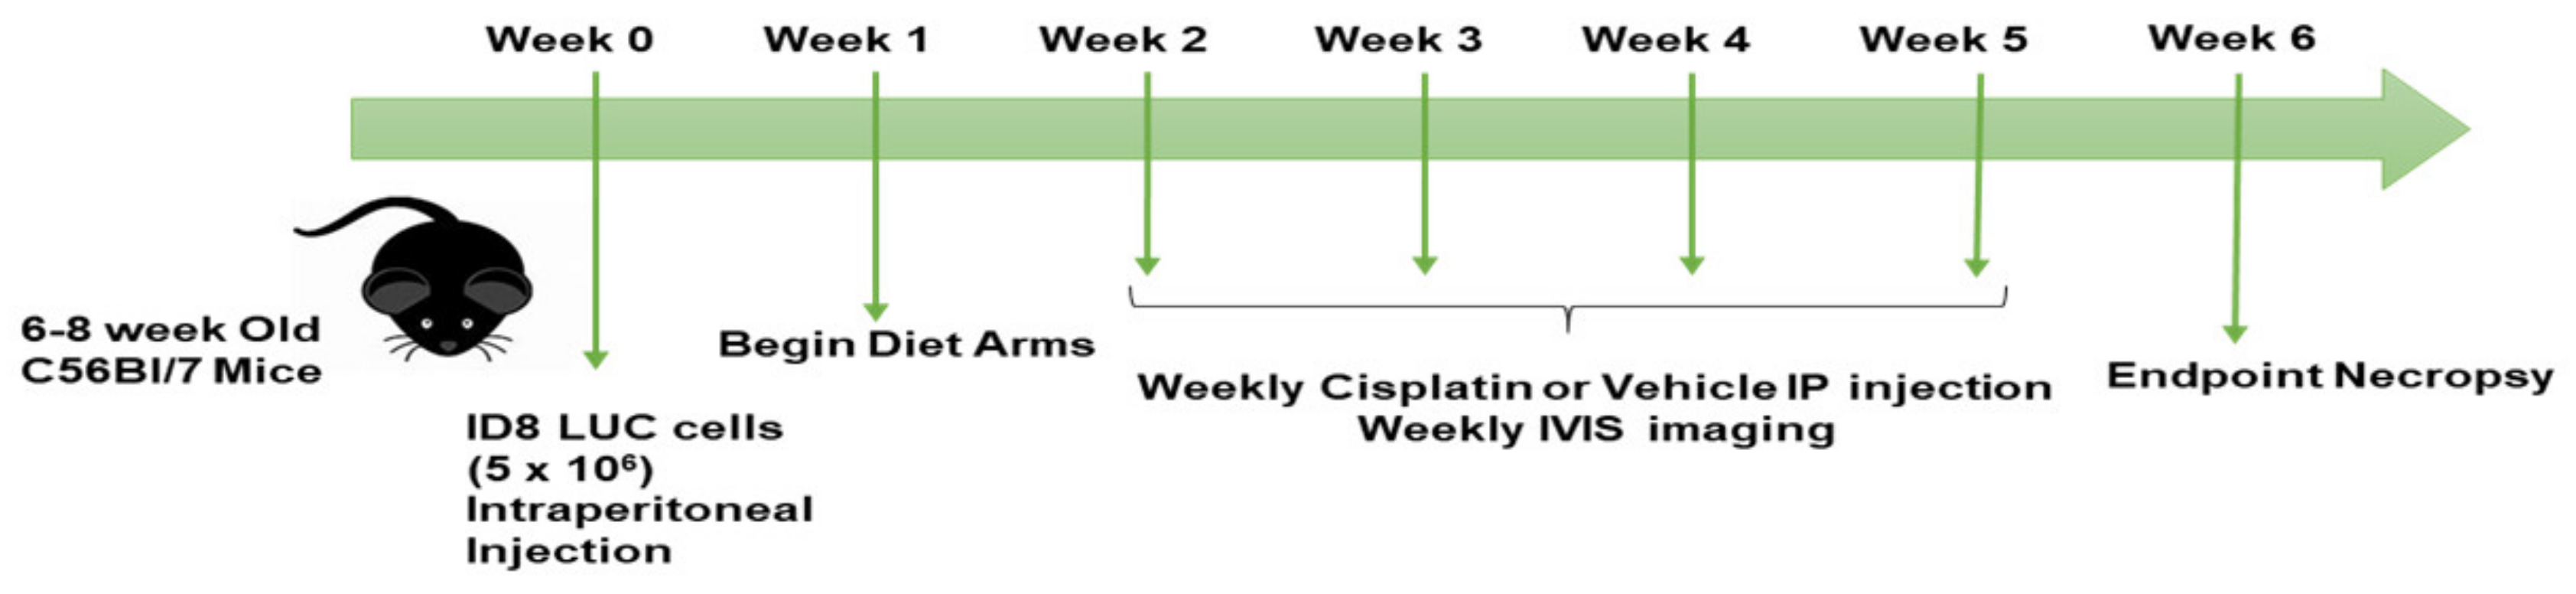
2.2. Animal Studies
2.3. Mouse Body Composition Scoring (BCS)
2.4. Tumor Monitoring via Imaging Using 2D IVIS
2.5. Tumor RNA Sequencing
2.6. Metabolomics
2.7. Statistics
2.8. Animal Study Approvals
3. Results
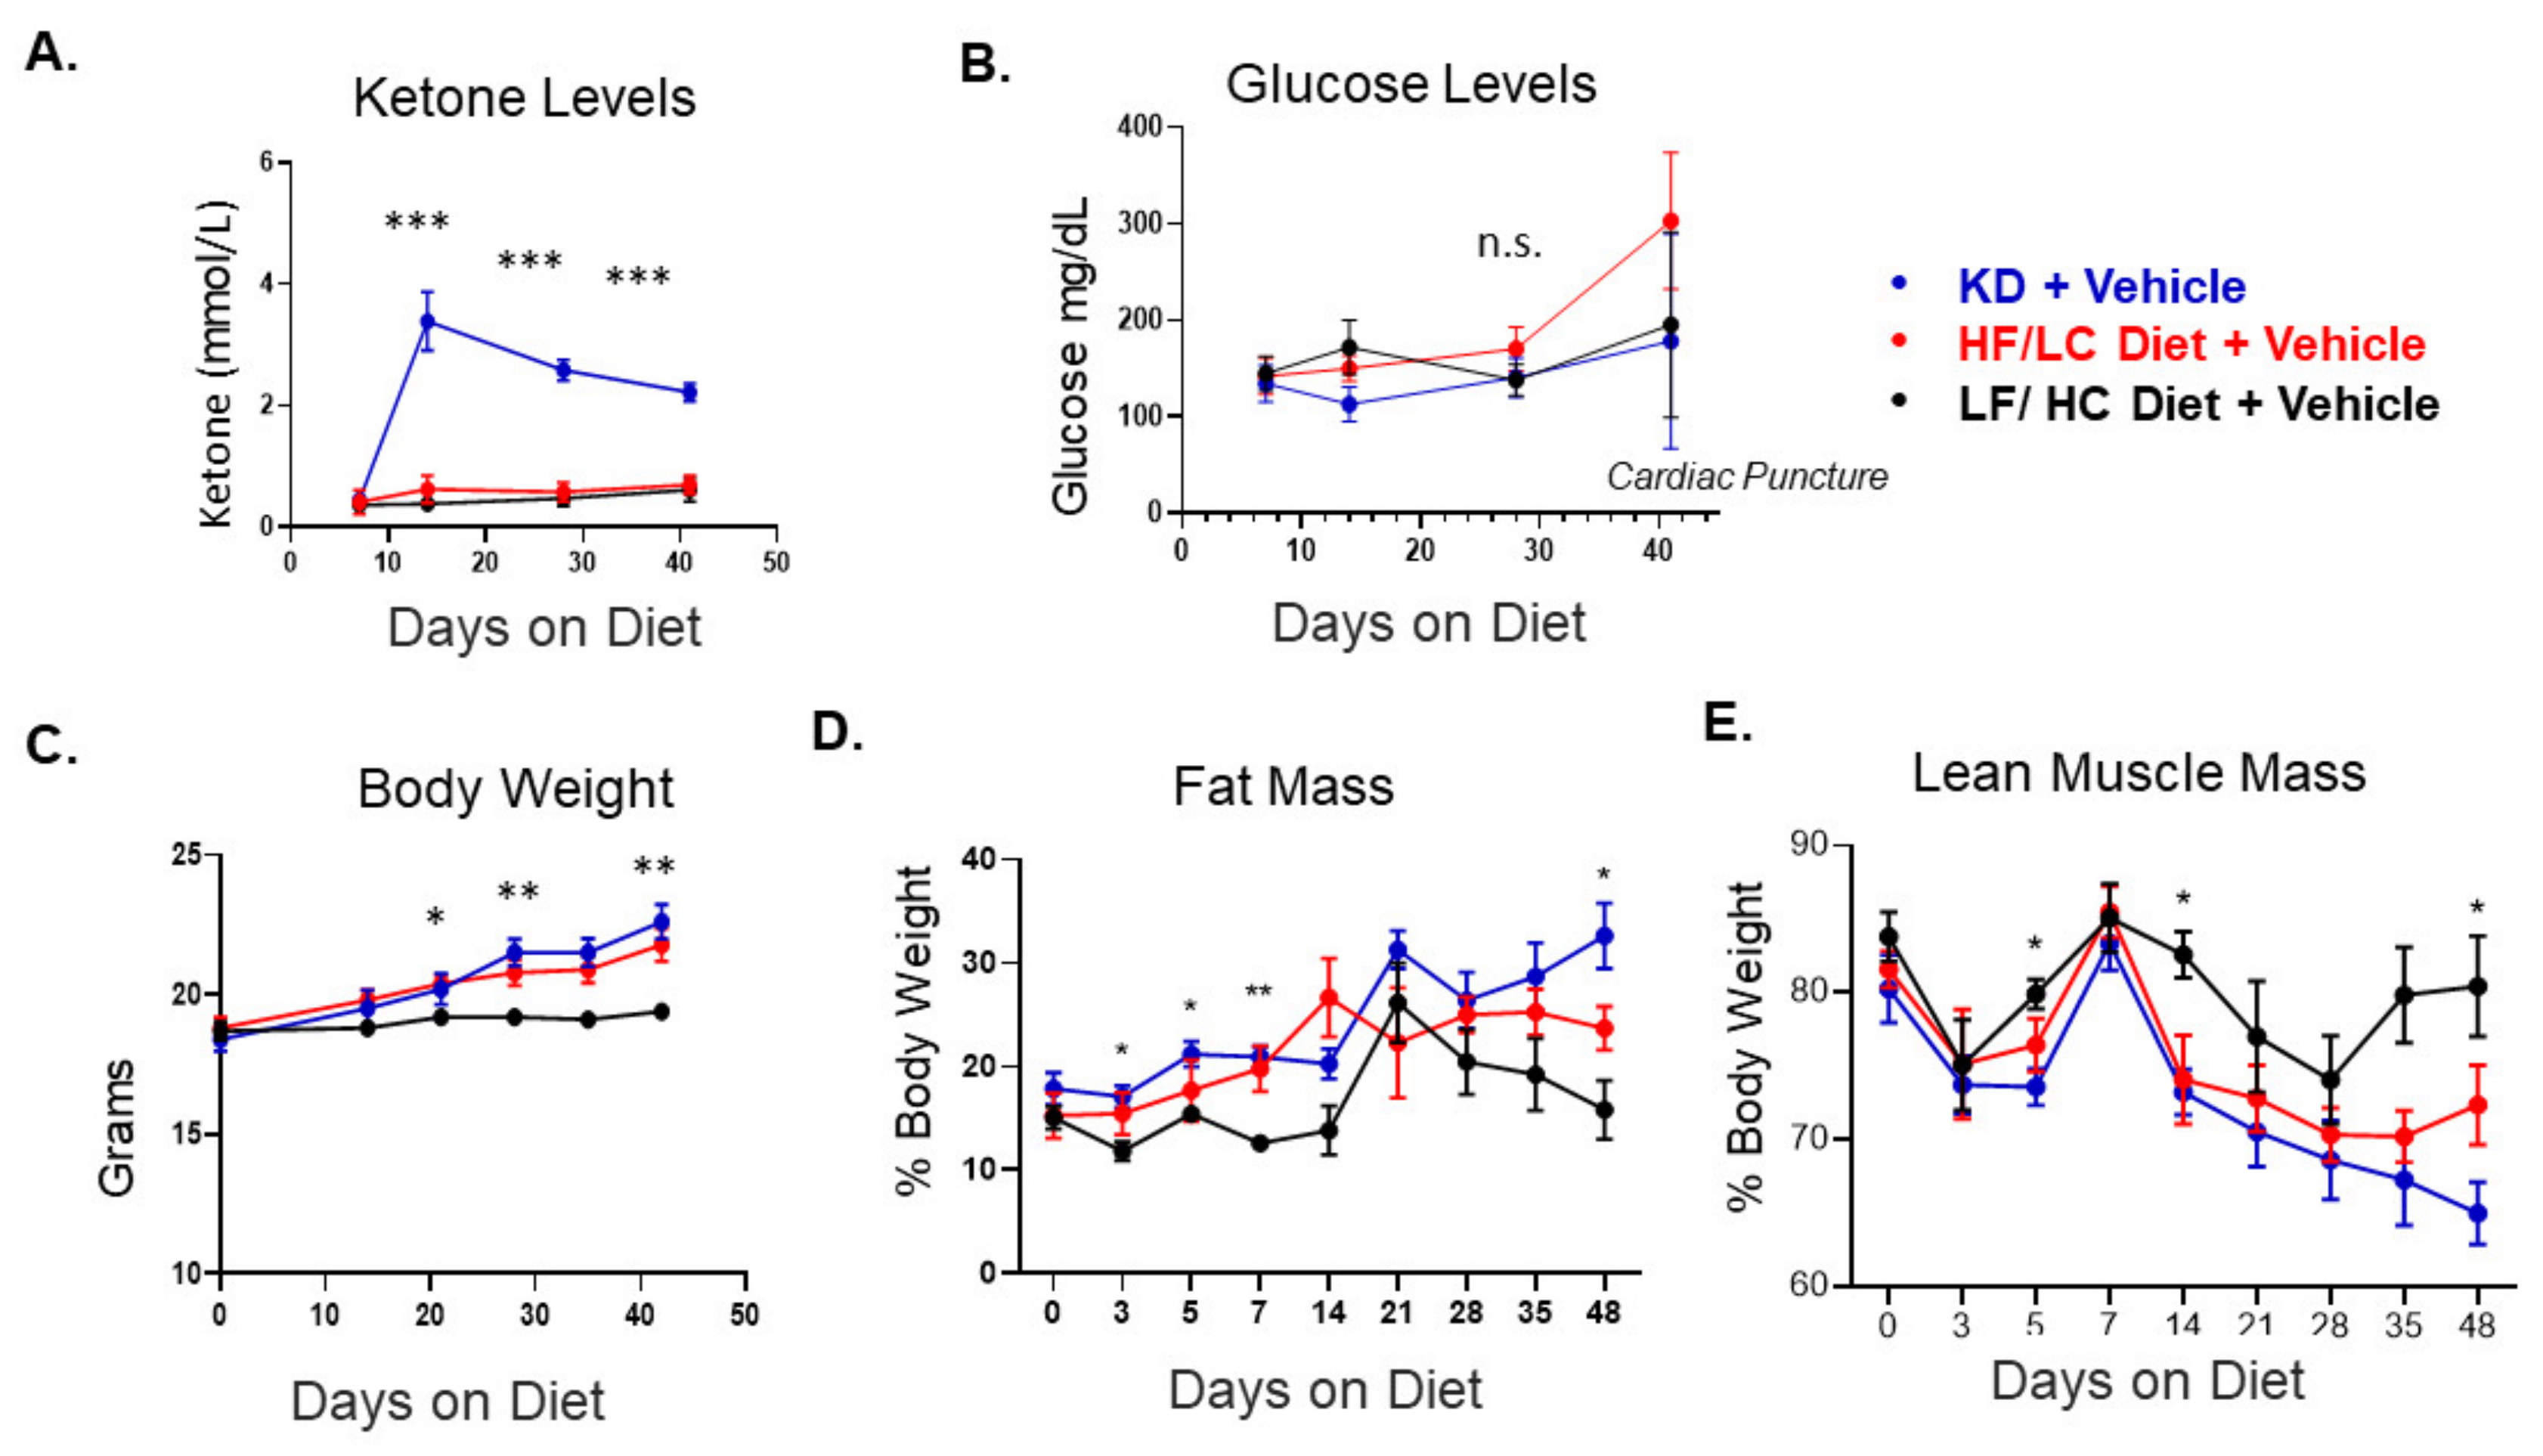
3.1. Ketogenic Diet in C57Bl/6mice Bearing ID8 Tumors Induced Ketosis and Increased Fat Mass
3.2. Ketogenic Diet Accelerated ID8 Ovarian Cancer Tumor Growth and Did Not Augment Response to Cisplatin Compared to Other Diet Groups
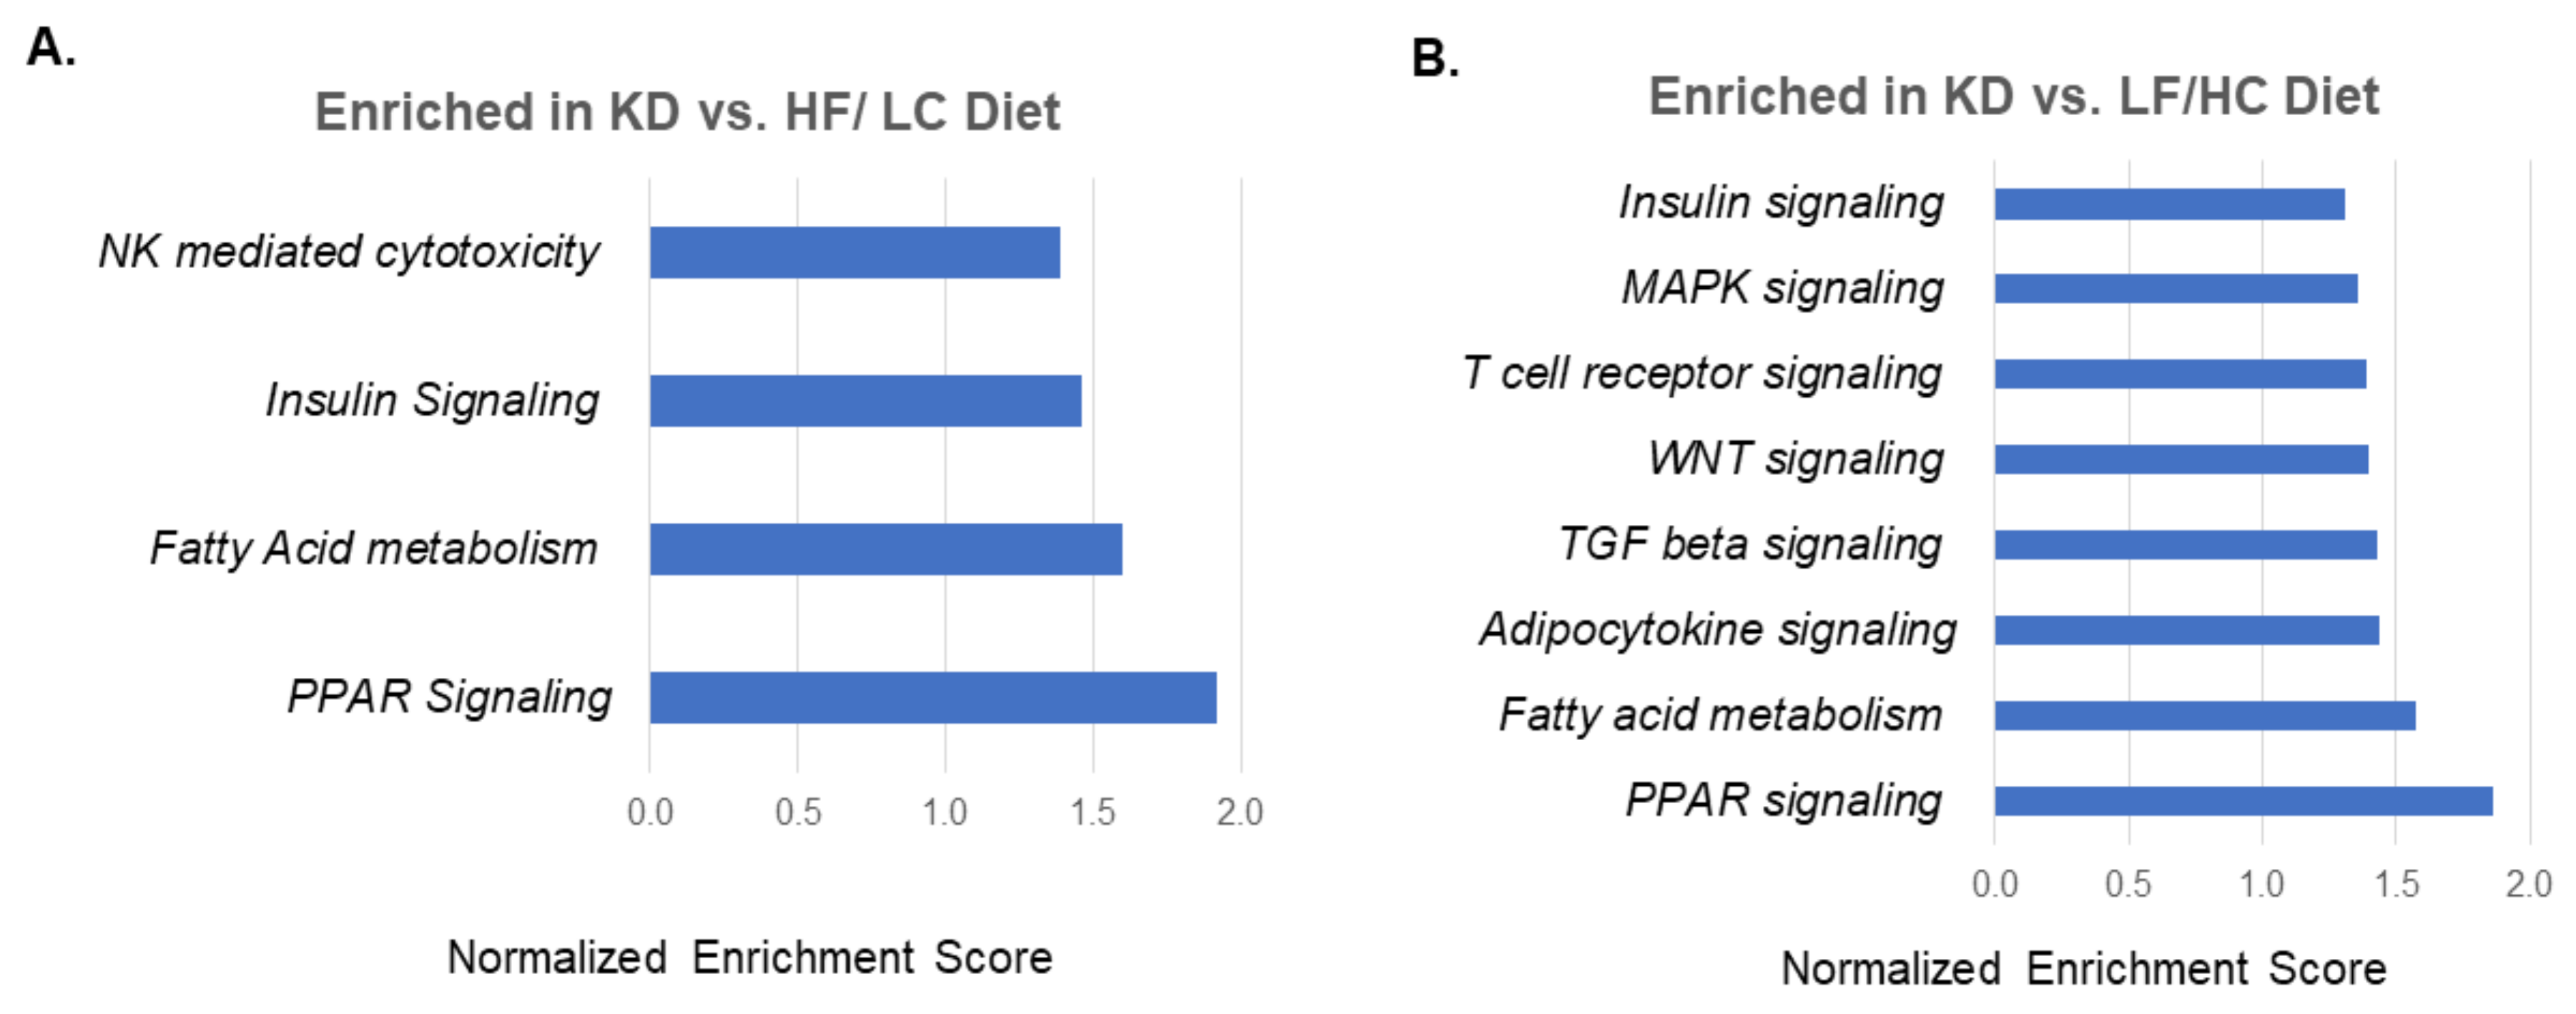
3.3. Ketogenic Diet Was Associated with Enrichment of PPAR Signaling, Fatty Acid Metabolism, and Insulin Signaling
3.4. KetKetogenic Diet Was Associated with Upregulation of Fatty Acid Metabolism Genes and Downregulation of Lipid Synthesis Genes
3.5. GGlutamine/Glutamate and Fatty Acid Metabolite Concentrations Were Altered in the Plasma and Tissue of Mice on KD Compared to HF/LC Diet
4. Discussion
5. Conclusions
Supplementary Materials
Author Contributions
Funding
Institutional Review Board Statement
Informed Consent Statement
Data Availability Statement
Acknowledgments
Conflicts of Interest
Abbreviations
| Acaca | Acetyl-CoA carboxylase |
| Acat2 | Acetyl-CoA acetyltransferase 2 |
| Acly | ATP citrate lyase |
| Agptl4 | Angiopoietin type 4 |
| AMP | Adenosine monophosphate |
| ATP | Adenosine triphosphate |
| BCS | Body composition scoring |
| Bdh1 | 3-hydroxybutyrate dehydrogenase 1 |
| Bdh2 | 3-hydroxybutyrate dehydrogenase 2 |
| BHB | Beta hydroxybutyrate |
| Cpt1 | Carnitine palmitoyltransferase |
| DMEM | Dulbecco’s Modified Eagle Medium |
| EOC | Epithelial ovarian cancer |
| ESI | Electrospray ionization |
| FA | Fatty acid |
| Fad3 | Fatty acid desaturase |
| Fasn | Fatty acid synthetase |
| FBS | Fetal bovine serum |
| Ffar2 | Free fatty acid receptor 2 |
| G6pc2 | Glucose 6 phosphatase catalytic subunit 2 |
| Gls2 | Glutaminase 2 |
| Grid1 | Glutamine receptor delta 1 subunit |
| GSEA | Gene set enrichment analysis |
| HF/LC | High fat/low carbohydrate |
| Hnf1a | Hepatocyte nuclear factor 1 alpha |
| HPLC | High-throughput liquid chromatography |
| IACUC | Institutional Animal Care and Use Committee |
| ID8-luc | ID8 luciferase cells |
| Igf | Insulin growth factor |
| Ins1 | Insulin 1 |
| IP | Intraperitoneal |
| Irs2 | Insulin receptor substrate 2 |
| IVIS | Spectrum in vivo imaging system |
| KD | Ketogenic diet |
| KEGG | Kyoto Encyclopedia of Gene and Genomes |
| LC-MS | Liquid chromatography–mass spectrometry |
| Lep | Leptin |
| LF/HC | Low fat/high carbohydrate |
| Map | Mitogen-activated protein |
| MRM | Multiple Reaction Monitoring |
| NK | Natural killer |
| Oxct1 | 3-Oxoacid CoA-transferase 1 |
| Oxct2 | 3-Oxoacid CoA-transferase 1 |
| PCA | Principal component analysis |
| PCK1 | phosphoenolpyruvate kinase 1 |
| PDK1 | Pyruvate dehydrogenase kinase |
| PPAR | Peroxisome proliferator-activated receptor |
| RNA | Ribonucleic acid |
| SCD | Stearoyl-CoA desaturase |
| STAR | Spliced Transcripts Alignment to a Reference |
| STAT3 | Signal transducer and activator of transcription 3 |
| TGF | Transforming growth factor |
| WNT | Wingless type |
References
- Gupta, S.; Nag, S.; Aggarwal, S.; Rauthan, A.; Warrier, N. Maintenance therapy for recurrent epithelial ovarian cancer: Current therapies and future perspectives—A review. J. Ovarian Res. 2019, 12, 103. [Google Scholar] [CrossRef]
- Wallace, T.C.; Bultman, S.; D’adamo, C.; Daniel, C.R.; Debelius, J.; Ho, E.; Eliassen, H.; Lemanne, D.; Mukherjee, P.; Seyfried, T.N.; et al. Personalized Nutrition in Disrupting Cancer—Proceedings from the 2017 American College of Nutrition Annual Meeting. J. Am. Coll. Nutr. 2019, 38, 1–14. [Google Scholar] [CrossRef]
- Menendez, J.; Joven, J.; Cufí, S.; Corominas-Faja, B.; Oliveras-Ferraros, C.; Cuyàs, E.; Martin-Castillo, B.; López-Bonet, E.; Alarcón, T.; Vazquez-Martin, A. The Warburg effect version 2.0: Metabolic reprogramming of cancer stem cells. Cell Cycle 2013, 12, 1166–1179. [Google Scholar] [CrossRef]
- Vander Heiden, M.G.; Cantley, L.C.; Thompson, C.B. Understanding the Warburg Effect: The Metabolic Requirements of Cell Proliferation. Science 2009, 324, 1029–1033. [Google Scholar] [CrossRef]
- Seyfried, T.N.; Flores, R.; Poff, A.M.; D’Agostino, D.P.; Mukherjee, P. Metabolic therapy: A new paradigm for managing malignant brain cancer. Cancer Lett. 2015, 356 Pt A, 289–300. [Google Scholar] [CrossRef]
- Seyfried, T.N.; Sanderson, T.M.; El-Abbadi, M.M.; McGowan, R.; Mukherjee, P. Role of glucose and ketone bodies in the metabolic control of experimental brain cancer. Br. J. Cancer 2003, 89, 1375–1382. [Google Scholar] [CrossRef]
- Lane, J.; Brown, N.I.; Williams, S.; Plaisance, E.P.; Fontaine, K.R. Ketogenic Diet for Cancer: Critical Assessment and Research Recommendations. Nutrients 2021, 13, 3562. [Google Scholar] [CrossRef]
- Klement, R.J.; Brehm, N.; Sweeney, R.A. Ketogenic diets in medical oncology: A systematic review with focus on clinical outcomes. Med. Oncol. 2020, 37, 14. [Google Scholar] [CrossRef] [PubMed]
- Klement, R.J.; Sweeney, R.A. Impact of a ketogenic diet intervention during radiotherapy on body composition: II. Protocol of a randomised phase I study (KETOCOMP). Clin. Nutr. ESPEN 2016, 12, e1–e6. [Google Scholar] [CrossRef] [PubMed]
- Oliveira, C.L.P.; Mattingly, S.; Schirrmacher, R.; Sawyer, M.B.; Fine, E.J.; Prado, C.M. A Nutritional Perspective of Ketogenic Diet in Cancer: A Narrative Review. J. Acad. Nutr. Diet. 2018, 118, 668–688. [Google Scholar] [CrossRef] [PubMed]
- Branco, A.F.; Ferreira, A.; Simões, R.F.; Magalhães-Novais, S.; Zehowski, C.; Cope, E.; Silva, A.M.; Pereira, D.; Sardao, V.A.; Cunha-Oliveira, T. Ketogenic diets: From cancer to mitochondrial diseases and beyond. Eur. J. Clin. Investig. 2016, 46, 285–298. [Google Scholar] [CrossRef]
- Vidali, S.; Aminzadeh, S.; Lambert, B.; Rutherford, T.; Sperl, W.; Kofler, B.; Feichtinger, R.G. Mitochondria: The ketogenic diet—A metabolism-based therapy. Int. J. Biochem. Cell Biol. 2015, 63, 55–59. [Google Scholar] [CrossRef] [PubMed]
- Ji, C.; Hu, Y.; Cheng, G.; Liang, L.; Gao, B.; Ren, Y.; Liu, J.; Cao, X.; Zheng, M.; Li, S.; et al. A ketogenic diet attenuates proliferation and stemness of glioma stem-like cells by altering metabolism resulting in increased ROS production. Int. J. Oncol. 2019, 56, 606–617. [Google Scholar] [CrossRef] [PubMed]
- Weber, D.D.; Aminzadeh-Gohari, S.; Thapa, M.; Redtenbacher, A.-S.; Catalano, L.; Capelôa, T.; Vazeille, T.; Emberger, M.; Felder, T.K.; Feichtinger, R.G.; et al. Ketogenic diets slow melanoma growth in vivo regardless of tumor genetics and metabolic plasticity. Cancer Metab. 2022, 10, 12. [Google Scholar] [CrossRef] [PubMed]
- Urits, I.; Mukherjee, P.; Meidenbauer, J.; Seyfried, T.N. Dietary restriction promotes vessel maturation in a mouse astrocytoma. J. Oncol. 2012, 2012, 264039. [Google Scholar] [CrossRef]
- Mukherjee, P.; Abate, L.E.; Seyfried, T.N. Antiangiogenic and proapoptotic effects of dietary restriction on experimental mouse and human brain tumors. Clin. Cancer Res. 2004, 10, 5622–5629. [Google Scholar] [CrossRef]
- Bonuccelli, G.; Tsirigos, A.; Whitaker-Menezes, D.; Pavlides, S.; Pestell, R.G.; Chiavarina, B.; Frank, P.G.; Flomenberg, N.; Howell, A.; Martinez-Outschoorn, U.E.; et al. Ketones and lactate “fuel” tumor growth and metastasis. Cell Cycle 2010, 9, 3506–3514. [Google Scholar] [CrossRef]
- Martinez-Outschoorn, U.E.; Lin, Z.; Whitaker-Menezes, D.; Howell, A.; Lisanti, M.P.; Sotgia, F. Ketone bodies and two-compartment tumor metabolism: Stromal ketone production fuels mitochondrial biogenesis in epithelial cancer cells. Cell Cycle 2012, 11, 3956–3963. [Google Scholar] [CrossRef]
- Zhang, J.; Jia, P.-P.; Liu, Q.-L.; Cong, M.-H.; Gao, Y.; Shi, H.-P.; Yu, W.-N.; Miao, M.-Y. Low ketolytic enzyme levels in tumors predict ketogenic diet responses in cancer cell lines in vitro and in vivo. J. Lipid Res. 2018, 59, 625–634. [Google Scholar] [CrossRef]
- Sperry, J.; Condro, M.C.; Guo, L.; Braas, D.; Vanderveer-Harris, N.; Kim, K.K.; Pope, W.B.; Divakaruni, A.S.; Lai, A.; Christofk, H.; et al. Glioblastoma Utilizes Fatty Acids and Ketone Bodies for Growth Allowing Progression during Ketogenic Diet Therapy. iScience 2020, 23, 101453. [Google Scholar] [CrossRef]
- Cohen, C.W.; Fontaine, K.R.; Arend, R.C.; Soleymani, T.; Gower, B.A. Favorable Effects of a Ketogenic Diet on Physical Function, Perceived Energy, and Food Cravings in Women with Ovarian or Endometrial Cancer: A Randomized, Controlled Trial. Nutrients 2018, 10, 1187. [Google Scholar] [CrossRef] [PubMed]
- Cohen, C.W.; Fontaine, K.R.; Arend, R.C.; Gower, B.A. A Ketogenic Diet Is Acceptable in Women with Ovarian and Endometrial Cancer and Has No Adverse Effects on Blood Lipids: A Randomized, Controlled Trial. Nutr. Cancer 2020, 72, 584–594. [Google Scholar] [CrossRef]
- Shah, U.A.; Iyengar, N.M. Plant-Based and Ketogenic Diets As Diverging Paths to Address Cancer: A Review. JAMA Oncol. 2022, 8, 1201–1208. [Google Scholar] [CrossRef] [PubMed]
- Roby, K.F.; Taylor, C.C.; Sweetwood, J.P.; Cheng, Y.; Pace, J.L.; Tawfik, O.; Persons, D.L.; Smith, P.G.; Terranova, P.F. Development of a syngeneic mouse model for events related to ovarian cancer. Carcinogenesis 2000, 21, 585–591. [Google Scholar] [CrossRef] [PubMed]
- Nantasupha, C.; Thonusin, C.; Charoenkwan, K.; Chattipakorn, S.; Chattipakorn, N. Metabolic reprogramming in epithelial ovarian cancer. Am. J. Transl. Res. 2021, 13, 9950–9973. [Google Scholar]
- Chambers, L.M.; Esakov, E.; Braley, C.; AlHilli, M.; Michener, C.; Reizes, O. Use of Transabdominal Ultrasound for the detection of intra-peritoneal tumor engraftment and growth in mouse xenografts of epithelial ovarian cancer. PLoS ONE 2020, 15, e0228511. [Google Scholar] [CrossRef]
- Ullman-Culleré, M.H.; Foltz, C.J. Body condition scoring: A rapid and accurate method for assessing health status in mice. Lab. Anim. Sci. 1999, 49, 319–323. [Google Scholar]
- Martin, M. Cutadapt removes adapter sequences from high-throughput sequencing reads. EMB Net. J. 2011, 17, 10. [Google Scholar] [CrossRef]
- Dobin, A.; Davis, C.A.; Schlesinger, F.; Drenkow, J.; Zaleski, C.; Jha, S.; Batut, P.; Chaisson, M.; Gingeras, T.R. STAR: Ultrafast universal RNA-seq aligner. Bioinformatics 2013, 29, 15–21. [Google Scholar] [CrossRef] [PubMed]
- Love, M.I.; Huber, W.; Anders, S. Moderated estimation of fold change and dispersion for RNA-seq data with DESeq2. Genome Biol. 2014, 15, 550. [Google Scholar] [CrossRef] [PubMed]
- Subramanian, A.; Tamayo, P.; Mootha, V.K.; Mukherjee, S.; Ebert, B.L.; Gillette, M.A.; Paulovich, A.; Pomeroy, S.L.; Golub, T.R.; Lander, E.S.; et al. Gene set enrichment analysis: A knowledge-based approach for interpreting genome-wide expression profiles. Proc. Natl. Acad. Sci. USA 2005, 102, 15545–15550. [Google Scholar] [CrossRef]
- Mootha, V.K.; Lindgren, C.M.; Eriksson, K.-F.; Subramanian, A.; Sihag, S.; Lehar, J.; Puigserver, P.; Carlsson, E.; Ridderstråle, M.; Laurila, E.; et al. PGC-1alpha-responsive genes involved in oxidative phosphorylation are coordinately downregulated in human diabetes. Nat. Genet. 2003, 34, 267–273. [Google Scholar] [CrossRef]
- Antunes, F.; Erustes, A.G.; Costa, A.J.; Nascimento, A.C.; Bincoletto, C.; Ureshino, R.P.; Smaili, S.S. Autophagy and intermittent fasting: The connection for cancer therapy? Clinics 2018, 73 (Suppl. S1), e814s. [Google Scholar] [CrossRef]
- Vernieri, C.; Signorelli, D.; Galli, G.; Ganzinelli, M.; Moro, M.; Fabbri, A.; Tamborini, E.; Marabese, M.; Caiola, E.; Broggini, M.; et al. Exploiting FAsting-mimicking Diet and MEtformin to Improve the Efficacy of Platinum-pemetrexed Chemotherapy in Advanced LKB1-inactivated Lung Adenocarcinoma: The FAME Trial. Clin. Lung Cancer 2019, 20, e413–e417. [Google Scholar] [CrossRef]
- Zahra, A.; Fath, M.A.; Opat, E.; Mapuskar, K.A.; Bhatia, S.K.; Ma, D.C.; Iii, S.N.R.; Snyders, T.P.; Chenard, C.A.; Eichenberger-Gilmore, J.M.; et al. Consuming a Ketogenic Diet while Receiving Radiation and Chemotherapy for Locally Advanced Lung Cancer and Pancreatic Cancer: The University of Iowa Experience of Two Phase 1 Clinical Trials. Radiat. Res. 2017, 187, 743–754. [Google Scholar] [CrossRef]
- Tan, M.J.; Teo, Z.; Sng, M.K.; Zhu, P.; Tan, N.S. Emerging Roles of Angiopoietin-like 4 in Human Cancer. Mol. Cancer Res. 2012, 10, 677–688. [Google Scholar] [CrossRef]
- Wu, Y.; Gao, J.; Liu, X. Deregulation of angiopoietin-like 4 slows ovarian cancer progression through vascular endothelial growth factor receptor 2 phosphorylation. Cancer Cell Int. 2021, 21, 171. [Google Scholar]
- La Paglia, L.; Listì, A.; Caruso, S.; Amodeo, V.; Passiglia, F.; Bazan, V.; Fanale, D. Potential Role of ANGPTL4 in the Cross Talk between Metabolism and Cancer through PPAR Signaling Pathway. PPAR Res. 2017, 2017, 8187235. [Google Scholar] [CrossRef] [PubMed]
- Ray, A.; Fornsaglio, J.; Dogan, S.; Hedau, S.; Naik, D.; De, A. Gynaecological cancers and leptin: A focus on the endometrium and ovary. Facts Views Vis. ObGyn. 2018, 10, 5–18. [Google Scholar] [PubMed]
- Yang, J.; Zaman, M.M.; Vlasakov, I.; Roy, R.; Huang, L.; Martin, C.R.; Freedman, S.D.; Serhan, C.N.; Moses, M.A. Adipocytes promote ovarian cancer chemoresistance. Sci. Rep. 2019, 9, 13316. [Google Scholar] [CrossRef] [PubMed]
- Nieman, K.M.; Romero, I.L.; Van Houten, B.; Lengyel, E. Adipose tissue and adipocytes support tumorigenesis and metastasis. Biochim. Biophys. Acta—Mol. Cell Biol. Lipids 2013, 1831, 1533–1541. [Google Scholar] [CrossRef]
- Ringel, A.E.; Drijvers, J.M.; Baker, G.J.; Catozzi, A.; García-Cañaveras, J.C.; Gassaway, B.M.; Miller, B.C.; Juneja, V.R.; Nguyen, T.H.; Joshi, S.; et al. Obesity Shapes Metabolism in the Tumor Microenvironment to Suppress Anti-Tumor Immunity. Cell 2020, 183, 1848–1866.e26. [Google Scholar] [CrossRef]
- Feng, S.; Wang, H.; Liu, J.; Aa, J.; Zhou, F.; Wang, G. Multi-dimensional roles of ketone bodies in cancer biology: Opportunities for cancer therapy. Pharmacol. Res. 2019, 150, 104500. [Google Scholar] [CrossRef]
- Gouirand, V.; Gicquel, T.; Lien, E.C.; Jaune-Pons, E.; Da Costa, Q.; Finetti, P.; Vasseur, S. Ketogenic HMG-CoA lyase and its product β-hydroxybutyrate promote pancreatic cancer progression. EMBO J. 2022, 41, e110466. [Google Scholar] [CrossRef] [PubMed]
- Rodrigues, L.M.; Uribe-Lewis, S.; Madhu, B.; Honess, D.J.; Stubbs, M.; Griffiths, J.R. The action of β-hydroxybutyrate on the growth, metabolism and global histone H3 acetylation of spontaneous mouse mammary tumours: Evidence of a β-hydroxybutyrate paradox. Cancer Metab. 2017, 5, 4. [Google Scholar] [CrossRef] [PubMed]
- Skinner, R.; Trujillo, A.; Ma, X.; Beierle, E.A. Ketone bodies inhibit the viability of human neuroblastoma cells. J. Pediatr. Surg. 2009, 44, 212–216. [Google Scholar] [CrossRef]
- Qian, L.; Li, Y.; Cao, Y.; Meng, G.; Peng, J.; Li, H.; Wang, Y.; Xu, T.; Zhang, L.; Sun, B.; et al. Pan-Cancer Analysis of Glycolytic and Ketone Bodies Metabolic Genes: Implications for Response to Ketogenic Dietary Therapy. Front. Oncol. 2021, 11, 689068. [Google Scholar] [CrossRef] [PubMed]
- Huang, D.; Li, T.; Wang, L.; Zhang, L.; Yan, R.; Li, K.; Xing, S.; Wu, G.; Hu, L.; Jia, W.; et al. Hepatocellular carcinoma redirects to ketolysis for progression under nutrition deprivation stress. Cell Res. 2016, 26, 1112–1130. [Google Scholar] [CrossRef]
- Matassa, D.S.; Amoroso, M.R.; Lu, H.; Avolio, R.; Arzeni, D.; Procaccini, C.; Faicchia, D.; Maddalena, F.; Simeon, V.; Agliarulo, I.; et al. Oxidative metabolism drives inflammation-induced platinum resistance in human ovarian cancer. Cell Death Differ. 2016, 23, 1542–1554. [Google Scholar] [CrossRef]
- Hudson, C.D.; Savadelis, A.; Nagaraj, A.B.; Joseph, P.; Avril, S.; DiFeo, A.; Avril, N. Altered glutamine metabolism in platinum resistant ovarian cancer. Oncotarget 2016, 7, 41637–41649. [Google Scholar] [CrossRef]
- Yang, L.; Moss, T.; Mangala, L.S.; Marini, J.; Zhao, H.; Wahlig, S.; Armaiz-Pena, G.; Jiang, D.; Achreja, A.; Win, J.; et al. Metabolic shifts toward glutamine regulate tumor growth, invasion and bioenergetics in ovarian cancer. Mol. Syst. Biol. 2014, 10, 728. [Google Scholar] [CrossRef] [PubMed]


| Components | LF/HC (TD.150345) | HF/LC (TD.160239.PWD) | Ketogenic Diet (TD.160153.PWD) |
|---|---|---|---|
| Carbohydrate | 77% | 15% | 0% |
| Fat | 13% | 75% | 90% |
| Protein | 10% | 10% | 10% |
| Fat source (g/kg) | Crisco (25) corn oil (25) | Crisco (314) cocoa butter (107) corn oil (60.7) | Crisco (440) Cocoa butter (150) Corn Oil (85) |
| Calories per gram | 3.7 | 6.7 | 5.7 |
| Vitamin mix Ain-93-VX Thiamin (81%) Vitamin K | 15.0 0.01 0.002 | 24.0 0.016 0.0032 | 27.0 0.018 0.0036 |
| Casein (g/kg) | 100 | 160 | 180 |
| Cellulose (g/g) | 34.9 | 49.3 | 59.2 |
| Mineral mix (g/kg) | 13.39 | 20.9 | 24.1 |
| Other components (g/kg) | Sucrose (100.0) Corn Starch (512.5) Maltodextrin (155.0) Calcium phosphate (9.8) Calcium carbonate (5.25) | Sucrose (30.0) Corn Starch (158.0) Maltodextrin (46.5) Calcium phosphate (15.0) Calcium carbonate (8.1) | Calcium phosphate (17.6) Calcium carbonate (9.54) |
Disclaimer/Publisher’s Note: The statements, opinions and data contained in all publications are solely those of the individual author(s) and contributor(s) and not of MDPI and/or the editor(s). MDPI and/or the editor(s) disclaim responsibility for any injury to people or property resulting from any ideas, methods, instructions or products referred to in the content. |
© 2023 by the authors. Licensee MDPI, Basel, Switzerland. This article is an open access article distributed under the terms and conditions of the Creative Commons Attribution (CC BY) license (https://creativecommons.org/licenses/by/4.0/).
Share and Cite
AlHilli, M.M.; Rhoades, E.E.; Chau, D.; Tewari, S.; Reich, A.; Myers, A.; Lindner, D.J.; Lathia, J.D.; Zhang, R.; Willard, B.; et al. Unrestricted Ketogenic Diet Feeding Enhances Epithelial Ovarian Cancer Growth In Vivo. Nutrients 2023, 15, 2730. https://doi.org/10.3390/nu15122730
AlHilli MM, Rhoades EE, Chau D, Tewari S, Reich A, Myers A, Lindner DJ, Lathia JD, Zhang R, Willard B, et al. Unrestricted Ketogenic Diet Feeding Enhances Epithelial Ovarian Cancer Growth In Vivo. Nutrients. 2023; 15(12):2730. https://doi.org/10.3390/nu15122730
Chicago/Turabian StyleAlHilli, Mariam M., Emily E. Rhoades, Danielle Chau, Surabhi Tewari, Adrian Reich, Alex Myers, Daniel J. Lindner, Justin D. Lathia, Renliang Zhang, Belinda Willard, and et al. 2023. "Unrestricted Ketogenic Diet Feeding Enhances Epithelial Ovarian Cancer Growth In Vivo" Nutrients 15, no. 12: 2730. https://doi.org/10.3390/nu15122730
APA StyleAlHilli, M. M., Rhoades, E. E., Chau, D., Tewari, S., Reich, A., Myers, A., Lindner, D. J., Lathia, J. D., Zhang, R., Willard, B., Cresci, G., Berger, N. A., & Reizes, O. (2023). Unrestricted Ketogenic Diet Feeding Enhances Epithelial Ovarian Cancer Growth In Vivo. Nutrients, 15(12), 2730. https://doi.org/10.3390/nu15122730