Article

The Effect of Probiotic Bacteria on Composition and Metabolite Production of Faecal Microbiota Using In Vitro Batch Cultures

1
School of Psychology and Clinical Language Sciences, University of Reading, Earley Gate, Reading RG6 6BZ, UK
2
Winclove Probiotics, Hulstweg 11, 1032 LB Amsterdam, The Netherlands
3
Department of Food and Nutritional Sciences, University of Reading, Whiteknights, Reading RG6 6AP, UK
*
Author to whom correspondence should be addressed.
Nutrients 2023, 15(11), 2563; https://doi.org/10.3390/nu15112563
Submission received: 3 April 2023 / Revised: 18 May 2023 / Accepted: 29 May 2023 / Published: 30 May 2023
(This article belongs to the Section Prebiotics and Probiotics)

Abstract

:
Probiotic supplements are increasingly being used to target the gut microbiome with a view to improving cognitive and psychological function via the gut-brain axis. One possible mechanism behind the effect of probiotics is through alterations to microbially-derived metabolites including short-chain fatty acids (SCFA) and neurotransmitters. However, research to date has largely been conducted in animal models or under conditions irrelevant to the human gastrointestinal tract (GIT). The aim of the current work was therefore to use anaerobic, pH controlled in vitro batch cultures to (a) assess the production of neuroactive metabolites in human faecal microbiota under conditions relevant to the human GIT, and (b) to explore how several pre-selected probiotic strains may affect bacterial composition and metabolite production. Enumeration of bacteria was assessed using fluorescence in situ hybridisation with flow cytometry, and concentrations of SCFAs and neurotransmitters were measured using gas chromatography and liquid chromatography mass spectroscopy, respectively. GABA, serotonin, tryptophan, and dopamine were successfully detected, suggesting some level of microbial derivation. The addition of Lactococcus lactis W58 and Lactobacillus rhamnosus W198 resulted in a significant increase in lactate after 8 h of fermentation, while no significant effect of probiotics on bacterial composition or neurotransmitter production was found.

1. Introduction

There is now a wealth of evidence to support a complex bidirectional relationship between the gut microbiota and the brain, with several microbiota-gut-brain pathways, including the vagus nerve, microbiota-derived metabolites, immune parameters, and the neuroendocrine system, being identified as key communication routes, largely through animal models [1,2]. Modulating the gut microbiota to increase the diversity and number of beneficial microbes may positively affect neural activity and behaviour through any number of these pathways. As such, the gut microbiome is more frequently being targeted for its potential to improve cognitive and psychological function.
One approach to altering the microbiota is through use of probiotic supplements. Probiotics are defined by the World Health Organisation as live microorganisms that, when administered in adequate amounts, confer a health benefit to the host [3]. The effects of various probiotic bacteria on cognitive and psychological function have now been studied in several human trials, with some promising evidence showing an improvement of cognitive function and mood, particularly in those with relevant clinical disorders such as Alzheimer’s Disease and depression [4,5,6]. However, despite the recent increase in randomised control trials, the mechanisms underlying these effects remain evasive [7].
Intervention studies in both animals and humans have reported associated increases in lumen, serum, and neural concentrations of neurotransmitters and their precursors following chronic probiotic supplementation [8,9,10,11]. As such, there is growing interest in microbiota-derived metabolites and their role in the gut brain axis. It is becoming clear that certain strains of bacteria, including those found enterically, can produce neurotransmitters [12,13]. In silico methods show predicted changes in the abundance of gut-derived neurotransmitters such as γ-aminobutyric acid (GABA) following probiotic supplementation [14]. In addition, genome-based analyses have allowed for the cataloguing of the neuroactive potential of various bacteria strains to synthesise and utilise metabolites relevant to the gut-brain axis [15,16]. This neuroactive potential has also been explored in vitro for several promising strains, with the production of GABA [17,18], dopamine [19], serotonin [19], histamine [20], norepinephrine [21], and acetylcholine [22] from bacteria of various genera, including Lactobacillus, Bifidobacterium, and Lactococcus, being reported. However, in the majority of these studies, probiotic bacteria were cultured in conditions optimised for neurotransmitter synthesis rather than in conditions typically found in the human gastrointestinal tract. While this suggests the strains are capable of producing neurotransmitters, it is less clear to what extent this may occur under physiologically relevant conditions. The presence of several neurotransmitters was recently reported in one in vitro study utilising three-stage continuous gut models to explore the impact of a pre- or probiotic intervention on metabolite production in faecal microbiota from healthy young adults under conditions reflective of anorexia nervosa [23]. Here, relatively low concentrations of GABA, serotonin, dopamine, norepinephrine, and epinephrine were detected following a restricted nutrient phase, and provision of pre- and probiotic supplements modulated metabolite synthesis to resemble that seen during a healthy control feeding phase using standard gut model media.
In addition to neurotransmitters, gut microbes produce short-chain fatty acids (SCFAs) as a result of polysaccharide fermentation [24]. SCFAs such as butyrate, acetate, and propionate regulate the expression of precursors tryptophan 5-hydroxylase and tyrosine hydroxylase, which in turn influence the synthesis of serotonin (5-HT) and biosynthesis of catecholamines dopamine, epinephrine, and norepinephrine, respectively [25]. Further to their role in neurotransmitter synthesis, SCFAs appear to be important in the production of brain-derived neurotropic factor (BDNF), blood-brain-barrier integrity, gut permeability, and regulating neuroinflammation, all of which have a significant effect on cognitive and psychological function [26]. Although largely established through animal research, the introduction of probiotics has been found to modulate the number of SCFA-producing bacteria, and subsequently increased concentrations of SCFAs have been reported in the gut lumen [27]. As such, where probiotic bacteria may not directly produce neurotransmitters under physiologically relevant conditions, production of neuroactive compounds may instead be modulated as a result of increased SCFA synthesis.
In vitro batch culture fermentation provides a means to explore the effect of probiotics on the human faecal bacterial community and to examine metabolite production under anaerobic conditions, allowing for control of nutrient availability, pH, and temperature to mimic the environment of the human colon. As such, this work employed faecal batch culture fermentation with the primary aim of assessing the production of neuroactive metabolites in human faecal microbiota under conditions relevant to the human GIT. In addition, this work aimed to explore how a selection of probiotic strains previously deemed to have high neuroactive potential [15] may affect bacterial composition and the synthesis of both SCFAs and neurotransmitters.

2. Methods

2.1. Preparation of Probiotic Strains

Six probiotic strains (Lactobacillus rhamnosus W198, Lactobacillus reuteri W192, Bacillus subtilis W201, Bacillus coagulans W64, Propionibacterium freudenreichii W200, and Lactococcus lactis W58, supplied by Winclove Probiotics) were selected for inclusion based on previous metagenomic work identifying the neuroactive potential to synthesise relevant neurotransmitters and short-chain fatty acids [15]. Prior to performing the batch cultures, calibration curves in Man Rogosa Sharpe broth (Sigma-Aldrich, Kent, UK) for L. rhamnosus W198, L. reuteri W192, B. coagulans W64, Propionibacterium freudenreichii W200, and L. lactis W58 and General Nutrient Broth (Sigma-Aldrich, Kent, UK) for B. subtilis W201 were conducted in triplicate for each strain in order to identify the correlation between optical density (OD600nm) (Thermo Scientific Orion AquaMate 8000 (Waltham, MA, USA)) and bacterial numbers in colony forming units (CFU).
In preparation for batch cultures, Hungate tubes containing the appropriate anaerobic broth (detailed above) were inoculated with a colony of bacteria. These were incubated overnight at 37 °C, after which cultures were measured for OD, and this was adjusted to yield 5 × 10⁸ CFU/mL per strain for inoculation. Plating of cultures was conducted to confirm inoculation concentration.

2.2. Faecal Sample Preparation

Fresh faecal samples were provided by 3 healthy donors free from GIT disorders (2 male, 1 female), aged 21–24. Donors were not regular users of pre/probiotics or consumers of live yoghurt and had not consumed antibiotics in the 3 months prior to donating. Samples were collected and placed in an anaerobic jar using Thermo Scientific AnaeroGen 2.5 L anaerobic sachets (Oxoid, Basingstoke, UK). Samples were used for inoculation within 2 h of production. To form a 10% faecal slurry (w/v), 15 g of weighed faecal sample was homogenised with 135 mL of anaerobic PBS for 2 min using a stomacher (Stomacher 400, Seward, West Sussex, UK) at 240 paddle beats/min.

2.3. Batch Culture Fermentation

pH controlled, anaerobic, stirred batch cultures were performed in triplicate, with a sample from a different faecal donor used for each experiment. First, 135 mL of standard basal nutrient medium [28] with additional 0.1% tryptone (0.15 g) and 0.2% lactose (0.3 g) for bacteria growth was steamed and aseptically added to autoclaved 300 mL vessels. Vessels were then left to gas overnight using N2 at a rate of 15 mL/min to achieve anaerobic conditions.
Vessels were maintained at a temperature of 37 °C using a circulating water bath. The media were adjusted to pH 5.5 and subsequently maintained between 5.4 and 5.6 using pH controllers (Electrolab, Tewkesbury, UK) connected to 0.5 M solutions of HCL and NaOH. This pH was selected in order to mimic conditions of the proximal colon, under which GABA synthesis has previously been reported [29,30]. Immediately prior to faecal inoculation, overnight probiotic cultures were added to vessels to provide an estimated concentration of 5 × 10⁸ CFU. In addition, each fermentation run included a negative control vessel, to which only the faecal slurry was added, and a positive control vessel, to which inulin (Synergy 1, Beneo, Belgium) (1.5 g) was added as an additional substrate.
All vessels were inoculated with 15 mL of faecal slurry (10% w/v) to give a final concentration of 1% faeces (w/v). Baseline samples were taken immediately post-inoculation, and further samples were collected at 4, 8, 24, and 48 h; a stable pH and anaerobic conditions were maintained throughout.

2.4. Preparation of Samples

For Liquid Chromatography–Mass Spectroscopy (neurotransmitters), Gas Chromatography (short-chain fatty acids), and Fluorescence in situ Hybridisation (enumeration of bacteria), 1 mL, 1.5 mL, and 0.75 mL of sample were aliquoted to Eppendorfs, respectively; 1 mL samples were immediately stored at −20 °C. For GC, samples were centrifuged at 11, 600 g for 10 min before transferring the supernatant and storing the pellet at −20 °C. For FISH, samples were centrifuged at 11, 600 g for 5 min. After removing the supernatant, the pellet was resuspended in 375 μL of PBS before adding 1125 μL of 4% paraformaldehyde. These samples were then stored at 4 °C for 4–8 h before being washed twice with 1 mL of PBS and resuspending the pellet in 150 μL of PBS. Finally, 150 μL of ethanol was added, the samples were vortexed to homogenise, and then stored at −20 °C.

2.4.1. Fluorescence In Situ Hybridisation with Flow Cytometry (Flow-FISH)

Preparation of samples followed the protocol of Grimaldi and colleagues [31]. Briefly, samples were removed from storage at −20 °C and vortexed to redisperse. Then, 75 μL of sample were suspended in 500 μL of PBS before vortexing and centrifuging for 3 min at 11,600× g (consistent for all centrifuging during this process). For permeabilisation of the bacterial cell wall, supernatant was discarded, and the pellet resuspended in TE-FISH containing lysozyme (1 mg/mL) and incubated in the dark for 10 min at room temperature. Samples were then re-centrifuged and washed using 500 μL PBS. For in situ hybridisation, pellets were resuspended in 150 μL of hybridisation buffer (0.9 M NaCl, 0.2 M Tris-HCl (pH 8.0), 0.01% sodium dodecyl sulphate, 30% formamide), centrifuged, and resuspended again in 1 mL. Then, 50 μL of this solution was added to each Eppendorf containing 4 μL of the oligonucleotide probe solutions, which were vortexed and incubated overnight at 35 °C using heating blocks. Following incubation, 125μL of hybridisation buffer was added, and Eppendorfs were vortexed and centrifuged as standard. After discarding the supernatant, pellets were resuspended in 175 μL of washing buffer (0.064 M NaCl, 0.02 M Tris/HCl (pH 8.0), 0.5 M EDTA (pH 8.0), 0.01% sodium dodecyl sulphate), vortexed to homogenise, and then incubated at 37 °C for 30 min in the heating block. The washed pellets were then centrifuged once again, resuspended in 300 μL of PBS, vortexed, and then stored in the dark at 4 °C ready for flow cytometry. Enumeration of bacteria was conducted using the Accuri C6 flow cytometer and analysed using the Accuri CFlow Sampler software.
Ten oligonucleotide probes (Table 1) were selected for inclusion, targeting a range of functionally relevant bacterial populations. Additionally, a mixed 338EUB probe was used to enumerate total bacteria.

2.4.2. Gas Chromatography

Preparation of samples for GC was carried out in line with the method previously described by Richardson and colleagues [42]. Samples were defrosted, vortexed, and 1mL transferred to 100 mm × 16 mm glass vials, in addition to 50 µL internal standard (0.1 M 2-ethylbutyric acid) 0.5 mL concentrated HCl and 2 mL diethyl ether. Vials were vortexed for 1 min and centrifuged for 10 min at 2000 g (Eppendorf 5804 R, Stevenage UK). The upper diethyl ether layer was extracted and transferred to new vials, from which 400 µL were taken and added with 50 µL of MTBSTFA to screwcap HPLC vials. The vials were protected from light and stored at room temperature for 72 h prior to analysis to allow for all SCFAs, including lactate, to derivatise.
Samples were analysed using a 5690 series Gas Chromatograph (Hewlett Packard, London, UK) with HP-5 ms column (L × I.D. 30 m × 0.25 mm, 0.25 μm film thickness) coating of crosslinked (5%-phenyl)-methylpolysiloxane (Agilent, Santa Clara, CA, USA). Then, 1 μL of each sample was injected with a run time of 17.7 min. Injector and detector temperatures were 275 °C and the column temperature programmed from 63 °C to 190 °C at 5 °C per min and held at 190 °C for 30 min. Helium was used as the carrier gas at a flow rate of 1.7 mL/min (head pressure, 133 KPa). The external standard solution included acetic acid (30 mM); propionic acid (20 mM); n-butyric acid (20 mM); n-valeric acid (5 mM); iso-butyric acid (5 mM); iso-valeric acid (5 mM) (all Sigma-Aldrich). Quality control (QC) samples of external standard solution were included between donors to maintain accurate calibration. Peak integration was performed using Agilent Chemstation software (Agilent Technologies, Cheadle, UK), and quantification of each SCFA (mM) was calculated using internal response factors as described previously [43].

2.4.3. Liquid Chromatography–Mass Spectroscopy

Samples were first removed from storage at −20 °C and centrifuged for 5 min at 2000 g. Then, 10 µL of supernatant was added to 9.99 mL of HPLC water to form a 1:1000 dilution, which was then filtered using 0.22 µm syringe filters. Then, 1 mL was added to a screwcap HPLC vial for analysis. In addition, 1 mL of batch culture medium was prepared in the same manor for analysis as a control. Individual stock solutions were prepared using analytical standards powders of dopamine hydrochloride (≥99%, Alfa Aesar (Lancashire, UK)), serotonin (≥98%, Sigma-Aldrich), tryptophan (≥98%, Sigma-Aldrich), GABA (≥99%, Sigma-Aldrich), L(-)-epinephrine (≥99%, Acros Organics (Geel, Belgium)), L-noradrenaline (≥98%, Alfa Aesar), and kynurenic acid (≥98%, Sigma-Aldrich), each at 10,000 ng/mL. A mixed standard solution was then prepared from the individual stock solutions and used to create a 7 level calibration series with the following dilutions: 10, 5, 1, 0.5, 0.25, 0.125, and 0.0625 ng/mL. Additionally, a 1 ng/mL standard was run every 20 samples as a QC.
Samples were analysed by liquid chromatography–mass spectrometry/mass spectrometry (LC–MS/MS) using an Agilent 1200 HPLC system attached to a 6410 triple-quadrupole mass spectrometer with electrospray ion source in positive ion mode. A gradient separation was carried out using a 150 × 2.1 mm Discovery HS F5—3 column, with a 2 × 2.1 mm Discovery C18 Supelguard precolumn (both 3 μm particle size; Supelco, Poole, UK). The column was maintained at 40 °C. Mobile phase A was 0.1% formic acid in water and mobile phase B was 0.1% formic acid in acetonitrile. The column flow rate was maintained at 0.4 mL/min. The timetable was as follows: 0–2 min, 100% A; 5 min, 75% A; 11 min, 65% A; 15–20 min 5% A; 20.1–30 min, 100% A. The injection volume was 25 μL. The eluant from the column was run to waste from 0 to 1 min, and data were collected from 1 to 18 min. Data were acquired in dynamic MRM mode. The transitions studied and voltages used are shown in Table 2. Two transitions were acquired for each compound.

2.5. Statistical Analysis

All statistical analyses were performed using R statistical software [44]. The effect of time (0, 8, and 24 h of fermentation) and vessel (negative control, positive control (inulin), B. coagulans, B. subtilis, L. reuteri, Lc. lactis, L. rhamnosus, P. freudenreichii) on specific bacterial groups, SCFAs, and neurotransmitters was assessed using repeated-measures two-way ANOVAs with post-hoc pairwise comparisons (Bonferroni corrected). As inulin is known to affect SCFA production, particularly acetate and lactate, it was anticipated that change in SCFA concentration over the fermentation period would be greatest in the positive control vessel. Given that inulin was only used as a positive control substrate in this model and that the effect of inulin on metabolite production is not relevant to the aims of this work, statistical analysis of SCFA concentration was run both including and excluding the positive control vessel, in case the larger known effect of inulin on SCFA concentration masked any smaller effects in the probiotic vessels of interest. Statistical significance was set to p < 0.05 and data are presented as mean ± standard error unless otherwise stated.

3. Results

3.1. Enumeration of Bacteria with Flow-FISH

Figure 1 illustrates change in bacterial groups between baseline (T0), 8 h (T8), and 24 h (T24). No significant difference in bacterial numbers was found between vessels at baseline. A significant main effect of time was observed on total bacteria, and most bacterial groups assessed, including Clostridium coccoides–Eubacterium rectale (EREC), Roseburia subcluster (RREC), Faecalibacterium prausnitzii (FPRAU), Desulfovibrio (DSV), and Clostridium histolyticum (CHIS), showed that bacterial numbers steadily declined over the 24-h period across all probiotic and non-probiotic vessels (all p < 0.05) (Figure 1). In comparison, no main effect of time or vessel was observed for numbers of Bacteroides-Prevotella spp. (BAC) (Figure 1D) or Clostridium cluster IX (PROP) (Figure 1H). However, in contrast to other bacteria groups, visual inspection of the data indicates that numbers of Bacteroides-Prevotella spp. increased between T0 and T8 across all probiotic vessels (except P. freudenreichii), but not in the control vessels. Similarly, numbers of Clostridium cluster IX displayed a general increase in the probiotic vessels over the fermentation period when compared to the control vessels, although these changes were non-significant.
With regards to Bifidobacterium spp. (BIF), a time by vessel interaction was observed (F(14,28) = 2.068, p = 0.049). Pairwise comparisons indicate that this was driven by a significant increase from 6.6 to 7.5 log10 cells/mL by T8 in the positive control vessel, following the fermentation of inulin (p = 0.021) (Figure 1B). No significant change in Lactobacillus spp. (LAB) or Atopobium–Coriobacterium spp. (ATO) was found.

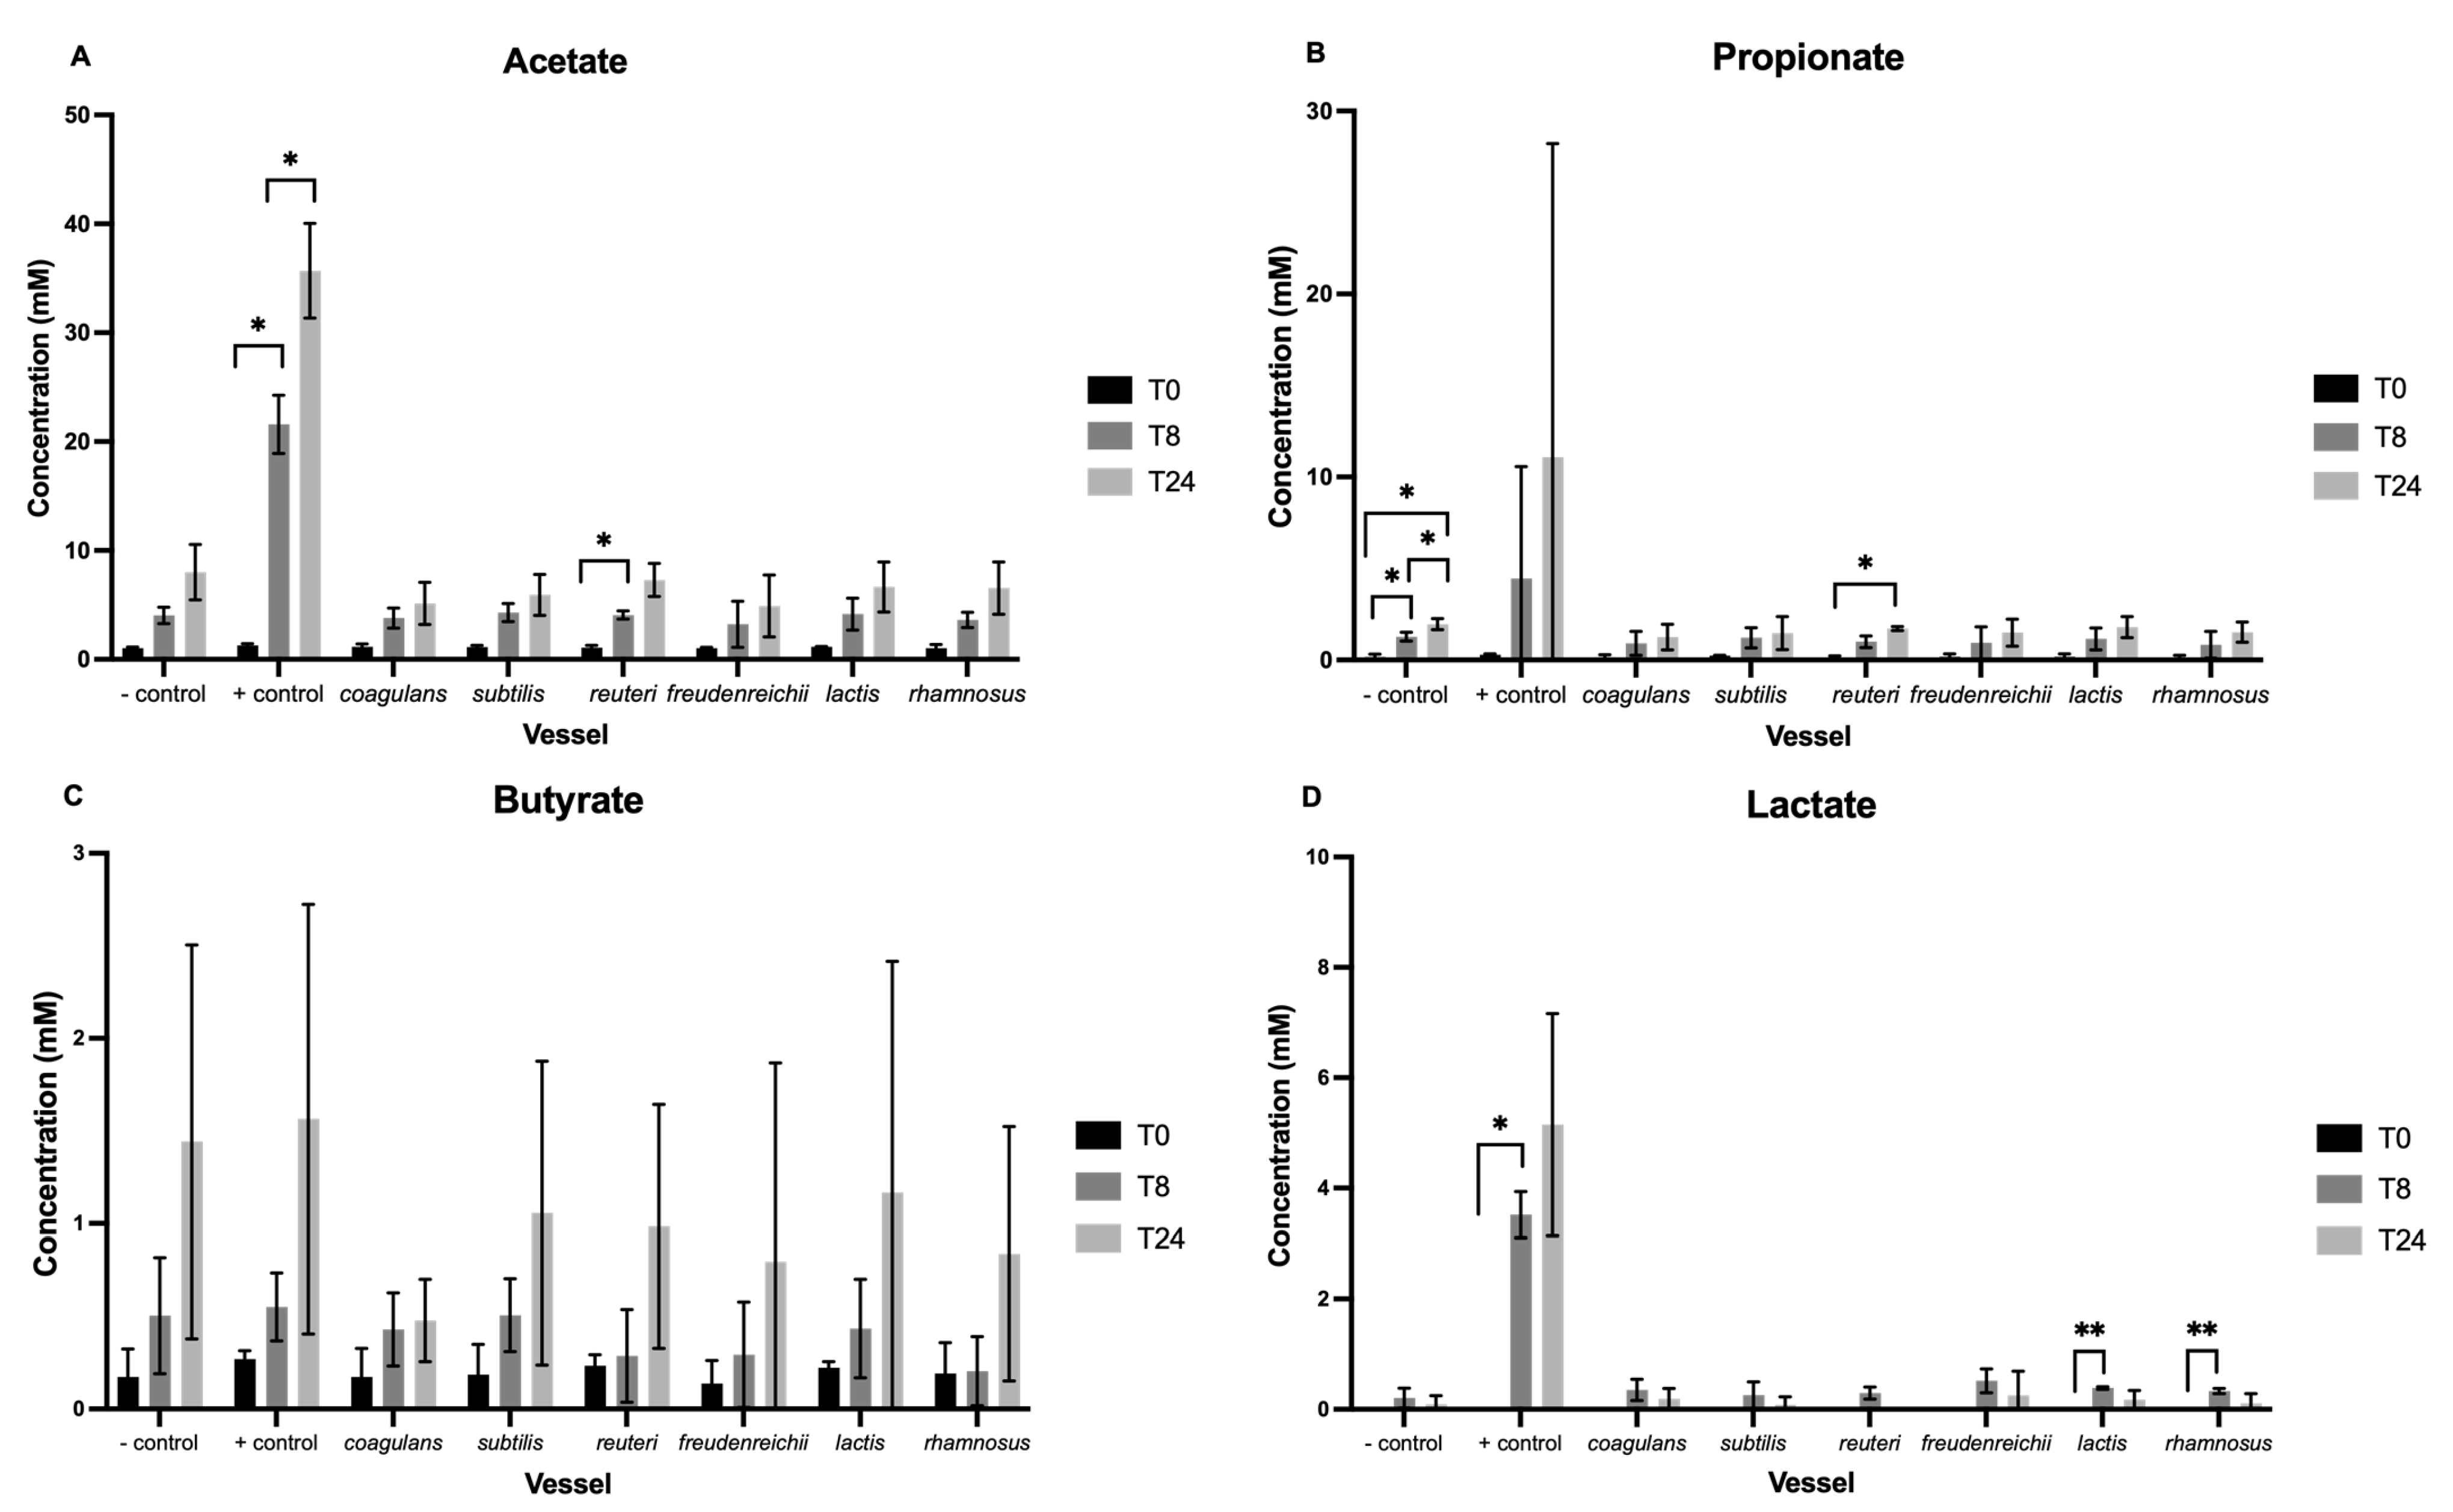
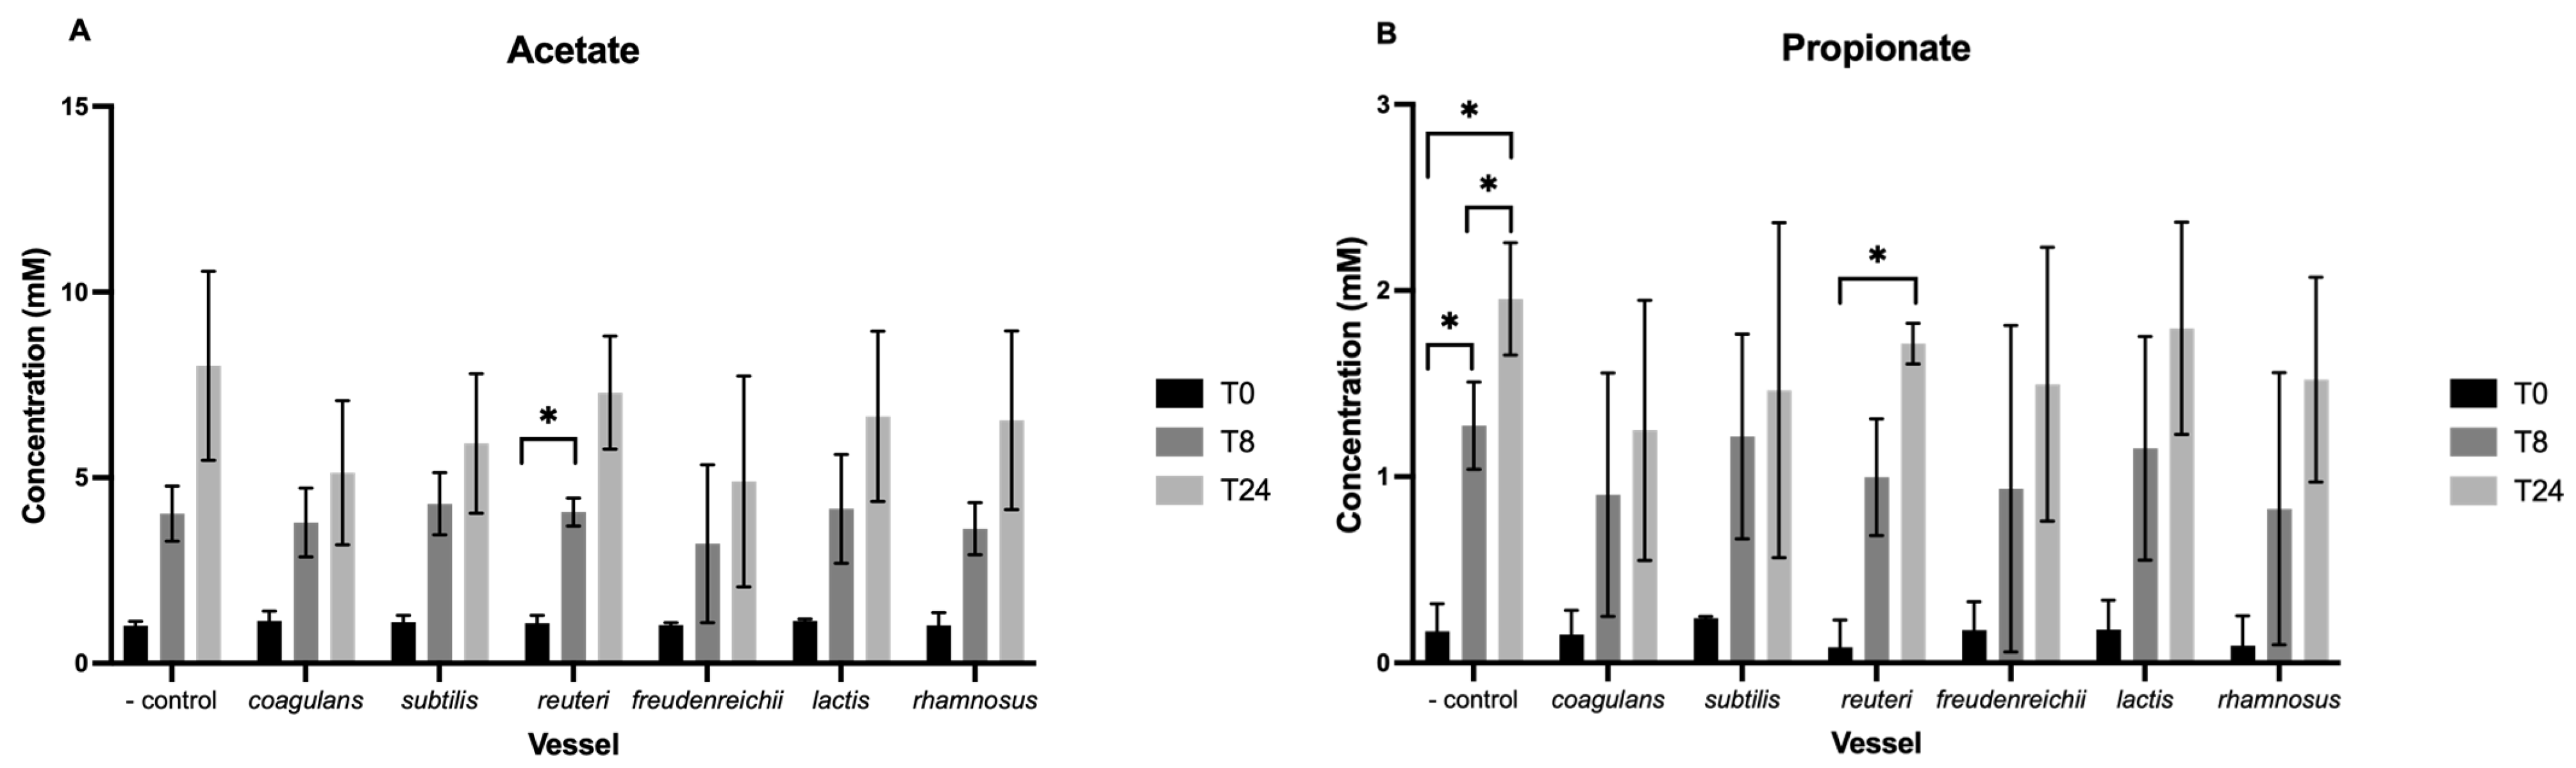
3.2. Short-Chain Fatty Acids

Figure 2 demonstrates changes in SCFA concentration over the course of fermentation. No significant difference between vessels at baseline was found. Levels of valerate, iso-valerate, and iso-butyrate were below that of minimum detection and are therefore not presented.
Looking at acetate (Figure 2A), there was a significant main effect of time (F(1,68) = 24.66, p < 0.001), substrate (F(1,68) = 10.2, p = 0.002), and time by substrate interaction (F(1,68) = 5.94, p = 0.017). Pairwise comparisons highlight a significant increase from T0 to T8 (p < 0.05) and T0 to T24 (p < 0.05) in the positive control vessel, in addition to a significant increase from T0 to T8 following the addition of L. reuteri (p < 0.05). After exclusion of the positive control vessel (Figure 3A), only the main effect of time was maintained, where concentration increases over the 24-h period across all vessels (F(2,42) = 68.36, p < 0.001). No change in pairwise comparisons was observed.
For propionate, a significant main effect of time was observed (F(1,68) = 6.254, p = 0.015) only (Figure 3B). Pairwise comparisons indicate this increase in concentration is significant from T0 to T8 (p < 0.05), T8 to T24 (p < 0.05), and T0 to T24 (p < 0.05) in the negative control vessel. Additionally, concentration significantly increased between T0 and T24 following the addition of L. reuteri (p < 0.05). The main effect of time (F(2,42) = 44.55, p < 0.001) and all post-hoc effects were maintained when excluding the positive control vessel.
Concentration of butyrate increased over the 24-h period across all vessels, reflected as a significant main effect of time (F(1,68) = 32.86, p < 0.001) (Figure 3C). However, no main effect of substrate or interaction was observed.
Concentration of lactate increased across all vessels by T8 and fell by T24 (Figure 2D). Main effects of time (F(1,68) = 5.13 p = 0.027) and substrate (F(1,68) = 6.38, p = 0.014) were significant, while their interaction was bordering on significant (F(1,68) = 3.92, p = 0.052). Pairwise comparisons indicate a significant increase in concentration from T0 to T8 in the positive control vessel (p < 0.05) and following the addition of Lc. lactis (p < 0.01) and L. rhamnosus (p < 0.05). When excluding the positive control vessel, the main effect of time (F(2,42) = 23.22, p < 0.001) and pairwise comparisons remain (Figure 3D).

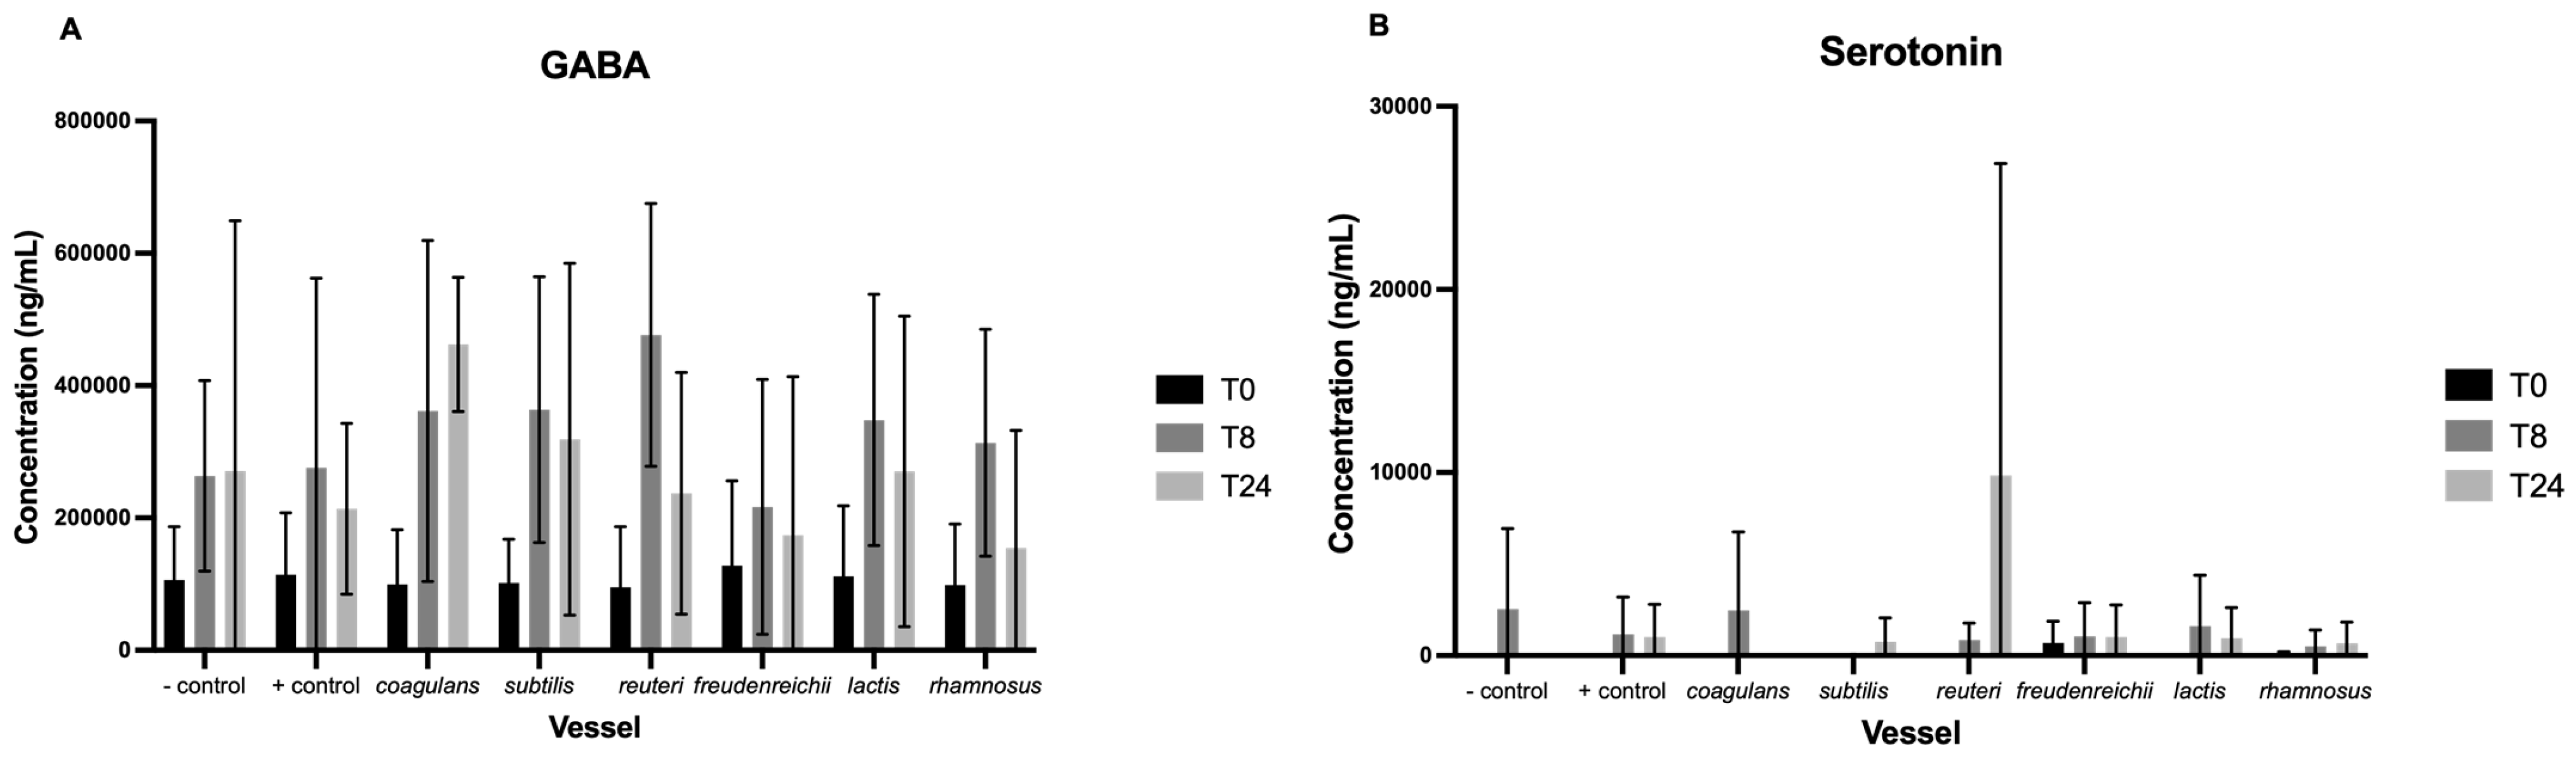
3.3. Neurotransmitters

Changes in neurotransmitter concentrations are illustrated in Figure 4. No significant difference in baseline concentration was detected between vessels for each compound. Levels of epinephrine, norepinephrine, and kynurenic acid were below that of minimum detection and are not presented.
The fermentation process elicited a significant main effect of time on GABA concentration (F(1,68) = 8.63, p = 0.005). Pairwise comparisons reveal that the increase in concentration from T0 to T8 was trending towards significance (p < 0.1) following the addition of L. reuteri, Lc. Lactis, and L. rhamnosus, and from T0 to T24 in the vessel with added B. coagulans (Figure 4A). No other statistically significant changes in neurotransmitter production were observed.

4. Discussion

This work aimed to assess the production of neuroactive metabolites in faecal microbiota under physiologically relevant conditions, and to explore the additional impact of several probiotic bacteria on both the faecal bacterial community and metabolite production using pH controlled, anaerobic in vitro batch culture models. In addition to a negative control vessel, which allowed for comparison of the probiotic vessels to the natural microbiota, inulin was included as a positive control substrate due to its known effects on Bifidobacterium spp. and SCFA production [27,45,46]. As expected, fermentation of inulin resulted in a substantial increase in Bifidobacterium spp., coupled with significantly increased concentrations of acetate and lactate over the 24-h period. These results are in line with previous data describing a bifidogenic effect of inulin, and therefore provide evidence that the batch culture fermentation models functioned as intended.
Batch culture fermentation models allowed the detection of GABA, serotonin, tryptophan, and dopamine under conditions relevant to the human GIT. Whereas previous work has typically employed optimal pH, temperature, and growth mediums when reporting the presence/production of neurotransmitters by isolated bacteria strains [19,47,48], the current work demonstrated neurotransmitter production in human faecal microbiota when under physiologically relevant conditions, using a standard basal media, in the absence of colonic cells. As such, the current data provide strong evidence for the bacterial derivation of these four metabolites under conditions relevant to the human GIT.
This is perhaps unsurprising with regards to GABA. GABA is synthesised through the decarboxylation of L-glutamate by glutamic acid decarboxylase (GAD), a system which has been established in several bacteria strains to provide a protective mechanism against the acidic gut environment; hence, GABA synthesis has been found to be highest at low pH [29]. However, the presence of tryptophan, serotonin, and dopamine under these conditions is more novel, and at present is it unclear how enteric bacteria may mediate and/or produce these neuroactive metabolites. Serotonin synthesised in isolated bacterial cultures has been speculated to occur in the same manner as seen in plants, via the decarboxylation of tryptophan into tryptamine [49]. The gut microbiota also appears to mediate how dietary tryptophan is metabolised into its various derivatives, such as indole, kynurenine, and serotonin [50,51], but microbial production of tryptophan and dopamine is not yet understood. As such, future work to further elucidate the precise mechanism(s) of production is necessary. While the detection of these metabolites in the current fermentation models suggests some level of bacterial derivation under relevant conditions, the concentrations of serotonin, tryptophan, and dopamine were relatively low compared to that of GABA. This implies that while there may be bacteria with the capacity to synthesise these compounds, human intestinal cells are likely required in these production pathways to produce physiologically relevant quantities in the host. For example, gut microbiota may mediate the biosynthesis of serotonin by influencing the expression of tryptophan hydroxylase 1 (TPH1)—a rate limiting step in the synthesis of serotonin—in enterochromaffin cells, where the majority of host serotonin is located and transferred to the periphery [52]. As such, while suitable for exploring levels of microbially derived GABA, batch culture fermentation models may not provide an optimal method for the exploration of other neuroactive compounds, such as serotonin, that likely require the provision of cells. That said, it should be noted that the present batch cultures were purposely maintained at a pH comparable to that of the proximal colon to stimulate GABA production, but this pH may not be optimal for the utilisation and production of other neurotransmitters and more alkaline pH, such as that found in the transverse or distal colon, which may elicit different results. Modelling of the transverse and distal areas of the colon may also be beneficial when exploring neuroactive metabolite production as the vagus nerve is believed to have afferent nerve interactions with both regions, providing a potential gut-brain pathway [53].
In addition to assessing the potential for microbially derived neuroactive metabolites in the GIT, this work explored the effect of additional probiotic bacteria on both microbiota composition and metabolite production. With regards to microbiota composition, the selected probiotic bacteria did not result in a significant shift in log10 cells/mL for any bacteria group assessed, including Lactobacillus spp., over the fermentation period. This is perhaps unsurprising given the abundance of faecal bacteria relative to the quantity of probiotic bacteria added per mL (3.3 × 10⁶ CFU). As batch cultures provide a closed-loop, an anaerobic environment with a limited supply of nutrients, a steady decline in bacterial numbers may be expected due to depletion of nutrients present in the basal medium. Flow FISH results indicate that this was the case for total bacteria and across most bacteria groups assessed. In comparison, numbers of Bacteroides-Prevotella spp. and Clostridium cluster IX were maintained and appear to gradually increase following the addition of B. coagulans, B. subtilis, L. reuteri, Lc. Lactis, and L. rhamnosus over 8 and 24 h, respectively, when compared to the control vessels. While this difference in trajectory suggests these strains may facilitate the maintenance and/or growth of these specific bacteria groups, log10 increases from baseline were not significant within these probiotic vessels, nor statistically different to numbers in the negative control vessel.
Concentrations of acetate, propionate, and butyrate increased over the fermentation period across all vessels, while concentrations of lactate increased by 8 h and fell once again by 24 h. This general increase in SCFA production over the fermentation period is likely due to fermentation of the lactose and tryptone within the basal media present in all vessels. On the other hand, the fall in lactate between 8 and 24 h is likely a reflection of important cross-feeding pathways, where certain bacteria are able to utilise lactate for the production of other SCFAs and metabolites [54]. This fall in concentration would not be expected for other SCFAs present within this closed environment, as they are broken down less readily than lactate. With the exception of the positive control vessel (inulin), synthesis of lactate was greatest in the Lc. lactis and L. rhamnosus vessels, where concentrations significantly increased from baseline after 8 h. Both species are known lactic acid producing bacteria (LAB), and their ability to produce lactic acid has previously been confirmed in vitro [55,56]. The current data not only provide evidence of enhanced lactic acid production under physiologically relevant conditions, but also highlight that probiotic bacterium such as Lc. lactis and L. rhamnosus are able to interact with existing host bacteria to influence metabolite production without necessarily causing a quantitative shift in bacterial composition.
Microbially derived lactic acid has been linked to several health benefits, including lowering cholesterol, anti-inflammatory properties, and increased nutrient absorption from diet [57]. Additionally, as mentioned previously, lactic acid is involved in the production of other SCFAs such as acetate, butyrate, and propionate. For example, lactate can be converted to propionate via the acrylate pathway by select Firmicutes [58] or via the succinate pathway, primarily by Bacteroidetes [53]. Many commensal species have the ability to convert lactate into acetate via acetyl-CoA [59], while select bacteria, such as Eubacterium hallii strains, are able to produce butyrate through the butyryl-CoA:acetate-CoA transferase route [60]. As such, increasing the availability of lactate may subsequently increase synthesis of other beneficial SCFAs. This may be significant in the context of the microbiota-gut-brain axis, as SCFAs play a role in the synthesis of various neuroactive metabolites and neurotransmitters [25,26,61]. In addition, SCFAs support gut barrier function and immune function, which in turn may improve tryptophan availability for serotonin [62]. However, previous work suggests that while pH 5.5 is supportive for the production of lactate by LAB, it does not provide an optimal environment for lactate-utilising bacteria and can led to a detrimental accumulation of lactic acid [11,63]. As the current fermentation models were maintained at pH 5.5, we perhaps would not expect a significant increase in lactate to be reflected as an increase in the concentrations of other SCFAs.
Although there were no statistically significant effects observed of the selected probiotic strains on neurotransmitter production, trends in the data suggest that L. reuteri, Lc. Lactis, L. rhamnosus, and B. coagulans may help to enhance the production of GABA. Production of GABA has typically been associated with LAB bacteria, and previous work has found species including Lc. lactis and B. coagulans to be good candidates for GABA synthesis due to the expression of GAD system genes [64,65]. Additionally, species such as L. rhamnosus are being actively investigated for their potential GABAergic effect on mental and cognitive health disorders, with promising effects in animal models, particularly for depression [65]. However, it is important to note that there is currently no evidence that gut-derived neurotransmitters cross the blood brain barrier, and there is little understanding as to the mechanisms via which gut-derived neurotransmitters may affect the brain.
It is also of importance to highlight limitations to the current work. Batch culture models provide a closed system with an equal amount of carbon and nitrogen for bacteria to grow on within each vessel, and the use of a negative control vessel allows for undigested food sources within the faeces to be ruled out as responsible for changes over the fermentation period. As such, we can be confident that the results are a true reflection of microbial fermentation and that any changes in the active vessels can be attributed to the additional pre- or probiotics. However, the three faecal donors in this study elicited substantial inter-donor variability in both bacterial composition and metabolite production (see Supplementary Materials). As a result, the ability to observe statistically significant change in these parameters may have been compromised, making it more difficult to establish the effects of the select probiotic strains. As such, determining which microbial members are involved in these changes and how different starting consortium of bacteria interact with the effect of probiotics is an important avenue of future work. With that said, in vitro batch cultures performed in triplicate do provide valuable data that matches well with the outcomes of intervention studies, and this is exemplified in the current experiment by the bifidogenic effect seen in the positive control vessel which is supported by the results of in vivo work [66]. In addition, although the abundance of SCFAs matched that as found in vivo with acetate being most abundant, followed by propionate and butyrate in similar quantities, concentration of SCFAs in these models were generally lower than expected compared to previous work [67,68]. It is likely, therefore, that the lactose content in these batch cultures was too low to support greater production.
To conclude, the present work provides evidence for the production of several neurotransmitters in the absence of colonic cells while under physiologically relevant conditions, suggesting bacterial derivation of these neuroactive metabolites. However, relatively low concentrations of tryptophan, serotonin and dopamine, compared to GABA, suggest that bacterial synthesis may not provide a primary production pathway for these metabolites, and instead colonic cells may be required to reach physiologically relevant levels. The addition of probiotic bacteria did not lead to significant shifts in microbiota composition, but trends in the current data suggest they may support the growth of Bacteroides-Prevotella spp. and Clostridium cluster IX and could enhance concentrations of microbially derived GABA. In addition, Lc. lactis W58 and L. rhamnosus W198 led to significantly increased concentrations of lactate after 8 h of fermentation. As such, the trends in the current data warrant further exploration to better understand how these probiotic strains may influence cognitive and psychological behaviour via microbially derived metabolites and the gut-brain axis. Future work may wish to model these effects using more comprehensive gut models [69] that allow for the provision of more nutrients and the ability to assess metabolite production at a range of physiologically relevant pHs mimicking different regions of the human colon.

Supplementary Materials

The following supporting information can be downloaded at: https://www.mdpi.com/article/10.3390/nu15112563/s1, Figure S1. Concentration (mM) of acetate at baseline and following 8 and 24 h of fermentation per donors 1, 2 & 3 (left to right). Figure S2. Concentration (mM) of propionate at baseline and following 8 and 24 h of fermentation per donors 1, 2 & 3 (left to right). Figure S3. Concentration (mM) of butyrate at baseline and following 8 and 24 h of fermentation per donors 1, 2 & 3 (left to right). Figure S4. Concentration (mM) of lactate at baseline and following 8 and 24 h of fermentation per donors 1, 2 & 3 (left to right). Figure S5. Concentration (mM) of acetate at baseline and following 8 and 24 h of fermentation per donors 1, 2 & 3 (left to right). Figure S6. Concentration (mM) of propionate at baseline and following 8 and 24 h of fermentation per donors 1, 2 & 3 (left to right). Figure S7. Concentration (mM) of butyrate at baseline and following 8 and 24 h of fermentation per donors 1, 2 & 3 (left to right). Figure S8. Concentration (mM) of lactate at baseline and following 8 and 24 h of fermentation per donors 1, 2 & 3 (left to right). Figure S9. Concentration (ng/mL) of GABA at baseline and following 8 and 24 h of fermentation per donors 1, 2 & 3 (left to right). Figure S10. Concentration (ng/mL) of serotonin at baseline and following 8 and 24 h of fermentation per donors 1, 2 & 3 (left to right). Figure S11. Concentration (ng/mL) of tryptophan at baseline and following 8 and 24 h of fermentation per donors 1, 2 & 3 (left to right). Figure S12. Concentration (ng/mL) of dopamine at baseline and following 8 and 24 h of fermentation per donors 1, 2 & 3 (left to right). Table S1. Donor 1, Enumeration of bacteria for by Flow-FISH at baseline (0) and following 8 and 24 h of fermentation within the negative control, positive control, and six probiotic vessels, represented as log10 cells/mL culture. Target bacteria: Bifidobacterium spp.(BIF), Lactobacillus spp. (LAB), most Bacteroidaceae and Prevotellaceae (BAC), Clostridium coccoides–Eubacterium rectale group (EREC), Roseburia subcluster (RREC), Faecalibacterium prausnitzii (FPRAU), Clostridium cluster IX (PROP), Atopobium-Coriobacterium spp. (ATO), Desulfovibrio (DSV) and Clostridium histolyticum (CHIS). Table S2. Donor 2, Enumeration of bacteria for by Flow-FISH at baseline (0) and following 8 and 24 h of fermentation within the negative control, positive control, and six probiotic vessels, represented as log10 cells/mL culture. Target bacteria: Bifidobacterium spp.(BIF), Lactobacillus spp. (LAB), most Bacteroidaceae and Prevotellaceae (BAC), Clostridium coccoides–Eubacterium rectale group (EREC), Roseburia subcluster (RREC), Faecalibacterium prausnitzii (FPRAU), Clostridium cluster IX (PROP), Atopobium-Coriobacterium spp. (ATO), Desulfovibrio (DSV) and Clostridium histolyticum (CHIS). Table S3. Donor 3, Enumeration of bacteria for by Flow-FISH at baseline (0) and following 8 and 24 h of fermentation within the negative control, positive control, and six probiotic vessels, represented as log10 cells/mL culture. Target bacteria: Bifidobacterium spp.(BIF), Lactobacillus spp. (LAB), most Bacteroidaceae and Prevotellaceae (BAC), Clostridium coccoides–Eubacterium rectale group (EREC), Roseburia subcluster (RREC), Faecalibacterium prausnitzii (FPRAU), Clostridium cluster IX (PROP), Atopobium-Coriobacterium spp. (ATO), Desulfovibrio (DSV) and Clostridium histolyticum (CHIS).

Author Contributions

Conceptualization, J.E., G.W., D.L., S.v.H. and C.W.; Methodology, J.E., G.W., C.P. and S.E.; Formal analysis, J.E., C.P. and S.E.; Original draft preparation, J.E.; Review and editing, D.L., G.W., C.W. and S.v.H.; Funding acquisition, J.E. All authors have read and agreed to the published version of the manuscript.

Funding

This research was funded by the University of Reading and Winclove Probiotics as part of a matched funding studentship award.

Acknowledgments

The authors would like to thank James Blee for his assistance.

Conflicts of Interest

S.v.H. is employed by Winclove Probiotics, who partially funded the Ph.D. studentship and provided the probiotic bacteria for this research.

References

  1. Nagpal, J.; Cryan, J.F. Microbiota-brain interactions: Moving toward mechanisms in model organisms. Neuron 2021, 109, 3930–3953. [Google Scholar] [CrossRef] [PubMed]
  2. Margolis, K.G.; Cryan, J.F.; Mayer, E.A. The microbiota-gut-brain axis: From motility to mood. Gastroenterology 2021, 160, 1486–1501. [Google Scholar] [CrossRef]
  3. Hill, C.; Guarner, F.; Reid, G.; Gibson, G.R.; Merenstein, D.J.; Pot, B.; Morelli, L.; Canani, R.B.; Flint, H.J.; Salminen, S.; et al. The International Scientific Association for Probiotics and Prebiotics consensus statement on the scope and appropriate use of the term probiotic. Nat. Rev. Gastroenterol. Hepatol. 2014, 11, 506–514. [Google Scholar] [CrossRef]
  4. Eastwood, J.; Walton, G.; Van Hemert, S.; Williams, C.; Lamport, D. The effect of probiotics on cognitive function across the human lifespan: A systematic review. Neurosci. Biobehav. Rev. 2021, 128, 311–327. [Google Scholar] [CrossRef]
  5. Mörkl, S.; Butler, M.I.; Holl, A.; Cryan, J.F.; Dinan, T.G. Probiotics and the microbiota-gut-brain axis: Focus on psychiatry. Curr. Nutr. Rep. 2020, 9, 171–182. [Google Scholar] [CrossRef]
  6. Rieder, R.; Wisniewski, P.J.; Alderman, B.L.; Campbell, S.C. Microbes and mental health: A review. Brain Behav. Immun. 2017, 66, 9–17. [Google Scholar] [CrossRef]
  7. Plaza-Diaz, J.; Ruiz-Ojeda, F.J.; Gil-Campos, M.; Gil, A. Mechanisms of action of probiotics. Adv. Nutr. 2019, 10 (Suppl. S1), S49–S66. [Google Scholar] [CrossRef] [PubMed]
  8. Pokusaeva, K.; Johnson, C.; Luk, B.; Uribe, G.; Fu, Y.; Oezguen, N.; Matsunami, R.K.; Lugo, M.; Major, A.; Mori-Akiyama, Y.; et al. GABA-producing Bifidobacterium dentium modulates visceral sensitivity in the intestine. Neurogastroenterol. Motil. 2017, 29, e12904. [Google Scholar] [CrossRef] [PubMed]
  9. Cao, G.; Tao, F.; Hu, Y.; Li, Z.; Zhang, Y.; Deng, B. Positive effects of a Clostridium butyricum- based compound probiotic on growth performance, immune responses, intestinal morphology, hypothalamic neurotransmitters, and colonic microbiota in weaned piglets. Food Funct. 2019, 10, 2926–2934. [Google Scholar] [CrossRef]
  10. Leblhuber, F.; Steiner, K.; Schuetz, B.; Fuchs, D.; Gostner, J.M. Probiotic supplementation in patients with Alzheimer’s dementia-an explorative intervention study. Curr. Alzheimer Res. 2018, 15, 1106–1113. [Google Scholar] [CrossRef]
  11. Wang, Y.; Li, N.; Yang, J.-J.; Zhao, D.-M.; Chen, B.; Zhang, G.-Q.; Chen, S.; Cao, R.-F.; Yu, H.; Zhao, C.-Y.; et al. Probiotics and fructo-oligosaccharide intervention modulate the microbiota-gut brain axis to improve autism spectrum reducing also the hyper-serotonergic state and the dopamine metabolism disorder. Pharmacol. Res. 2020, 157, 104784. [Google Scholar] [CrossRef] [PubMed]
  12. Cryan, J.F.; Dinan, T.G. Mind-altering microorganisms: The impact of the gut microbiota on brain and behaviour. Nat. Rev. Neurosci. 2012, 13, 701–712. [Google Scholar] [CrossRef] [PubMed]
  13. Strandwitz, P. Neurotransmitter modulation by the gut microbiota. Brain Res. 2018, 1693, 128–133. [Google Scholar] [CrossRef] [PubMed]
  14. Ma, T.; Jin, H.; Kwok, L.Y.; Sun, Z.; Liong, M.T.; Zhang, H. Probiotic consumption relieved human stress and anxiety symptoms possibly via modulating the neuroactive potential of the gut microbiota. Neurobiol. Stress 2021, 14, 100294. [Google Scholar] [CrossRef]
  15. Valles-Colomer, M.; Falony, G.; Darzi, Y.; Tigchelaar, E.F.; Wang, J.; Tito, R.Y.; Schiweck, C.; Kurilshikov, A.; Joossens, M.; Wijmenga, C.; et al. The neuroactive potential of the human gut microbiota in quality of life and depression. Nat. Microbiol. 2019, 4, 623–632. [Google Scholar] [CrossRef]
  16. Kaur, H.; Bose, C.; Mande, S.S. Tryptophan metabolism by gut microbiome and gut-brain-axis: An in silico analysis. Front. Neurosci. 2019, 13, 1365. [Google Scholar] [CrossRef]
  17. Cho, Y.R.; Chang, J.Y.; Chang, H.C. Production of gamma-Aminobutyric Acid (GABA) by Lactobacillus buchneri isolated from Kimchi and its neuroprotective effect on neuronal cells. J. Microbiol. Biotechnol. 2007, 17, 104–109. [Google Scholar]
  18. Barrett, E.; Ross, R.P.; O’Toole, P.W.; Fitzgerald, G.F.; Stanton, C. γ-Aminobutyric acid production by culturable bacteria from the human intestine. J. Appl. Microbiol. 2012, 113, 411–417. [Google Scholar] [CrossRef]
  19. Özoğul, F.; Kuley, E.; Özoğul, Y.; Özoğul, İ. The function of lactic acid bacteria on biogenic amines production by food-borne pathogens in arginine decarboxylase broth. Food Sci. Technol. Res. 2012, 18, 795–804. [Google Scholar] [CrossRef]
  20. Landete, J.M.; Ferrer, S.; Pardo, I. Biogenic amine production by lactic acid bacteria, acetic bacteria and yeast isolated from wine. Food Control 2007, 18, 1569–1574. [Google Scholar] [CrossRef]
  21. Tsavkelova, E.A.; Botvinko, I.V.; Kudrin, V.S.; Oleskin, A.V. Detection of neurotransmitter amines in microorganisms with the use of high-performance liquid chromatography. Dokl. Biochem. 2000, 372, 115–117. [Google Scholar] [PubMed]
  22. Girvin, G.T.; Stevenson, J.W. Cell free “choline acetylase” from Lactobacillus plantarum. Can. J. Biochem. Physiol. 1954, 32, 131–146. [Google Scholar] [CrossRef] [PubMed]
  23. Liu, L.; Poveda, C.; Jenkins, P.E.; Walton, G.E. An in vitro approach to studying the microbial community and impact of pre and probiotics under anorexia nervosa related dietary restrictions. Nutrients 2021, 13, 4447. [Google Scholar] [CrossRef] [PubMed]
  24. Tan, J.; McKenzie, C.; Potamitis, M.; Thorburn, A.N.; Mackay, C.R.; Macia, L. The role of short- chain fatty acids in health and disease. Adv. Immunol. 2014, 121, 91–119. [Google Scholar] [PubMed]
  25. Reigstad, C.S.; Salmonson, C.E.; Rainey, J.F., III; Szurszewski, J.H.; Linden, D.R.; Sonnenburg, J.L.; Farrugia, G.; Kashyap, P.C. Gut microbes promote colonic serotonin production through an effect of short-chain fatty acids on enterochromaffin cells. FASEB J. 2015, 29, 1395. [Google Scholar] [CrossRef]
  26. Dalile, B.; Van Oudenhove, L.; Vervliet, B.; Verbeke, K. The role of short-chain fatty acids in microbiota–gut–brain communication. Nat. Rev. Gastroenterol. Hepatol. 2019, 16, 461–478. [Google Scholar] [CrossRef]
  27. Markowiak-Kopeć, P.; Śliżewska, K. The effect of probiotics on the production of short-chain fatty acids by human intestinal microbiome. Nutrients 2020, 12, 1107. [Google Scholar] [CrossRef]
  28. Tzounis, X.; Vulevic, J.; Kuhnle, G.G.; George, T.; Leonczak, J.; Gibson, G.R.; Kwik-Uribe, C.; Spencer, J.P.E. Flavanol monomer-induced changes to the human faecal microflora. Br. J. Nutr. 2008, 99, 782–792. [Google Scholar] [CrossRef]
  29. Otaru, N.; Ye, K.; Mujezinovic, D.; Berchtold, L.; Constancias, F.; Cornejo, F.A.; Kryzstek, A.; de Wouters, T.; Braegger, C.; Lacroix, C.; et al. GABA production by human intestinal Bacteroides spp.: Prevalence, regulation, and role in acid stress tolerance. Front. Microbiol. 2021, 12, 656895. [Google Scholar] [CrossRef]
  30. Monteagudo-Mera, A.; Fanti, V.; Rodriguez-Sobstel, C.; Gibson, G.; Wijeyesekera, A.; Karatzas, K.A.; Chakrabarti, B. Gamma aminobutyric acid production by commercially available probiotic strains. J. Appl. Microbiol. 2022, 134, lxac066. [Google Scholar] [CrossRef]
  31. Grimaldi, R.; Cela, D.; Swann, J.R.; Vulevic, J.; Gibson, G.R.; Tzortzis, G.; Costabile, A. In vitro fermentation of B-GOS: Impact on faecal bacterial populations and metabolic activity in autistic and non-autistic children. FEMS Microbiol. Ecol. 2017, 93, fiw233. [Google Scholar] [CrossRef]
  32. Wallner, G.; Amann, R.; Beisker, W. Optimizing fluorescent in situ hybridization with rRNA- targeted oligonucleotide probes for flow cytometric identification ofmicroorganisms. Cytom. J. Int. Soc. Anal. Cytol. 1993, 14, 136–143. [Google Scholar]
  33. Daims, H.; Brühl, A.; Amann, R.; Schleifer, K.H.; Wagner, M. The domain-specific probe EUB338 is insufficient for the detection of all Bacteria: Development and evaluation of a more comprehensive probe set. Syst. Appl. Microbiol. 1999, 22, 434–444. [Google Scholar] [CrossRef] [PubMed]
  34. Langendijk, P.S.; Schut, F.; Jansen, G.J.; Raangs, G.C.; Kamphuis, G.R.; Wilkinson, M.H.; Welling, G.W. Quantitative fluorescence in situ hybridization of Bifidobacterium spp. with genus- specific 16S rRNA-targeted probes and its application in fecal samples. Appl. Environ. Microbiol. 1995, 61, 3069–3075. [Google Scholar] [CrossRef] [PubMed]
  35. Harmsen, H.J.; Elfferich, P.M.; Schut, F.; Welling, G.W. A 16S rRNA-targeted Probe for Detection of Lactobacilli and Enterococci in Faecal Samples by FluorescentIn SituHybridization. Microb. Ecol. Health Dis. 1999, 11, 3–12. [Google Scholar] [CrossRef]
  36. Manz, W.; Amann, R.; Ludwig, W.; Vancanneyt, M.; Schleifer, K.H. Application of a suite of 16S rRNA-specific oligonucleotide probes designed to investigate bacteria of the phylum cytophaga- flavobacter-bacteroides in the natural environment. Microbiology 1996, 142, 1097–1106. [Google Scholar] [CrossRef]
  37. Franks, A.H.; Harmsen, H.J.; Raangs, G.C.; Jansen, G.J.; Schut, F.; Welling, G.W. Variations of bacterial populations in human feces measured by fluorescent in situ hybridization with group- specific 16S rRNA-targeted oligonucleotide probes. Appl. Environ. Microbiol. 1998, 64, 3336–3345. [Google Scholar] [CrossRef]
  38. Walker, A.W.; Duncan, S.H.; McWilliam Leitch, E.C.; Child, M.W.; Flint, H.J. pH and peptide supply can radically alter bacterial populations and short-chain fatty acid ratios within microbial communities from the human colon. Appl. Environ. Microbiol. 2005, 71, 3692–3700. [Google Scholar] [CrossRef] [PubMed]
  39. Harmsen, H.J.; Wildeboer-Veloo, A.C.; Grijpstra, J.; Knol, J.; Degener, J.E.; Welling, G.W. Development of 16S rRNA-based probes for the Coriobacterium group and the Atopobium cluster and their application for enumeration of Coriobacteriaceae in human feces from volunteers of different age groups. Appl. Environ. Microbiol. 2000, 66, 4523–4527. [Google Scholar] [CrossRef]
  40. Hold, G.L.; Schwiertz, A.; Aminov, R.I.; Blaut, M.; Flint, H.J. Oligonucleotide Probes That Detect Quantitatively Significant Groups of Butyrate-Producing Bacteria in Human Feces. Appl. Environ. Microbiol. 2003, 69, 4320–4324. [Google Scholar] [CrossRef] [PubMed]
  41. Devereux, R.; Kane, M.D.; Winfrey, J.; Stahl, D.A. Genus-and group-specific hybridization probes for determinative and environmental studies of sulfate-reducing bacteria. Syst. Appl. Microbiol. 1992, 15, 601–609. [Google Scholar] [CrossRef]
  42. Richardson, A.J.; Calder, A.G.; Stewart, C.S.; Smith, A. Simultaneous determination of volatile and non-volatile acidic fermentation products of anaerobes by capillary gas chromatography. Lett. Appl. Microbiol. 1989, 9, 5–8. [Google Scholar] [CrossRef]
  43. Liu, Y.; Gibson, G.R.; Walton, G.E. An in vitro approach to study effects of prebiotics and probiotics on the faecal microbiota and selected immune parameters relevant to the elderly. PLoS ONE 2016, 11, e0162604. [Google Scholar] [CrossRef]
  44. R Core Team. R: A Language and Environment for Statistical Computing; R Foundation for Statistical Computing: Vienna, Austria, 2022; Available online: https://www.r-project.org/ (accessed on 2 April 2023).
  45. Meyer, D.; Stasse-Wolthuis, M. The bifidogenic effect of inulin and oligofructose and its consequences for gut health. Eur. J. Clin. Nutr. 2009, 63, 1277–1289. [Google Scholar] [CrossRef]
  46. van der Beek, C.M.; Canfora, E.E.; Kip, A.M.; Gorissen, S.H.; Damink, S.W.O.; van Eijk, H.M.; Holst, J.J.; Blaak, E.E.; Dejong, C.H.C.; Lanaerts, K. The prebiotic inulin improves substrate metabolism and promotes short-chain fatty acid production in overweight to obese men. Metabolism 2018, 87, 25–35. [Google Scholar] [CrossRef]
  47. Villegas, J.M.; Brown, L.; de Giori, G.S.; Hebert, E.M. Optimization of batch culture conditions for GABA production by Lactobacillus brevis CRL 1942, isolated from quinoa sourdough. LWT—Food Sci. Technol. 2016, 67, 22–26. [Google Scholar] [CrossRef]
  48. Li, H.; Cao, Y. Lactic acid bacterial cell factories for gamma-aminobutyric acid. Amino Acids 2010, 39, 1107–1116. [Google Scholar] [CrossRef] [PubMed]
  49. Williams, T.J.; Reay, A.J.; Whitwood, A.C.; Fairlamb, I.J. A mild and selective Pd-mediated methodology for the synthesis of highly fluorescent 2-arylated tryptophans and tryptophan- containing peptides: A catalytic role for Pd 0 nanoparticles? Chem. Commun. 2014, 50, 3052–3054. [Google Scholar] [CrossRef] [PubMed]
  50. Agus, A.; Planchais, J.; Sokol, H. Gut microbiota regulation of tryptophan metabolism in health and disease. Cell Host Microbe 2018, 23, 716–724. [Google Scholar] [CrossRef] [PubMed]
  51. Hyland, N.P.; Cavanaugh, C.R.; Hornby, P.J. Emerging effects of tryptophan pathway metabolites and intestinal microbiota on metabolism and intestinal function. Amino Acids 2022, 54, 57–70. [Google Scholar] [CrossRef]
  52. Yano, J.M.; Yu, K.; Donaldson, G.P.; Shastri, G.G.; Ann, P.; Ma, L.; Nagler, C.R.; Ismagilov, R.F.; Mazmanian, S.K.; Hsiao, E.Y. Indigenous bacteria from the gut microbiota regulate host serotonin biosynthesis. Cell 2015, 161, 264–276. [Google Scholar] [CrossRef] [PubMed]
  53. Wang, F.B.; Powley, T.L. Vagal innervation of intestines: Afferent pathways mapped with new en bloc horseradish peroxidase adaptation. Cell Tissue Res. 2007, 329, 221–230. [Google Scholar] [CrossRef]
  54. Louis, P.; Flint, H.J. Formation of propionate and butyrate by the human colonic microbiota. Environ. Microbiol. 2017, 19, 29–41. [Google Scholar] [CrossRef]
  55. Kwon, S.; Yoo, I.K.; Lee, W.G.; Chang, H.N.; Chang, Y.K. High-rate continuous production of lactic acid by Lactobacillus rhamnosus in a two-stage membrane cell-recycle bioreactor. Biotechnol. Bioeng. 2001, 73, 25–34. [Google Scholar] [CrossRef]
  56. Song, A.A.L.; In, L.L.; Lim, S.H.E.; Rahim, R.A. A review on Lactococcus lactis: From food to factory. Microb. Cell Factories 2017, 16, 1–15. [Google Scholar]
  57. Pessione, E. Lactic acid bacteria contribution to gut microbiota complexity: Lights and shadows. Front. Cell. Infect. Microbiol. 2012, 2, 86. [Google Scholar] [CrossRef] [PubMed]
  58. Flint, H.J.; Duncan, S.H.; Scott, K.P.; Louis, P. Links between diet, gut microbiota composition and gut metabolism. Proc. Nutr. Soc. 2015, 74, 13–22. [Google Scholar] [CrossRef] [PubMed]
  59. Koh, A.; De Vadder, F.; Kovatcheva-Datchary, P.; Bäckhed, F. From dietary fiber to host physiology: Short-chain fatty acids as key bacterial metabolites. Cell 2016, 165, 1332–1345. [Google Scholar] [CrossRef]
  60. Duncan, S.H.; Louis, P.; Flint, H.J. Lactate-utilizing bacteria, isolated from human feces, that produce butyrate as a major fermentation product. Appl. Environ. Microbiol. 2004, 70, 5810–5817. [Google Scholar] [CrossRef]
  61. Silva, Y.P.; Bernardi, A.; Frozza, R.L. The role of short-chain fatty acids from gut microbiota in gut-brain communication. Front. Endocrinol. 2020, 11, 25. [Google Scholar] [CrossRef]
  62. Xiao, W.; Li, J.; Gao, X.; Yang, H.; Su, J.; Weng, R.; Gao, Y.; Ni, W.; Gu, Y. Involvement of the gut-brain axis in vascular depression via tryptophan metabolism: A benefit of short chain fatty acids. Exp. Neurol. 2022, 358, 114225. [Google Scholar] [CrossRef] [PubMed]
  63. Louis, P.; Duncan, S.H.; Sheridan, P.O.; Walker, A.W.; Flint, H.J. Microbial lactate utilisation and the stability of the gut microbiome. Gut Microbiome 2022, 3, e3. [Google Scholar] [CrossRef]
  64. Redruello, B.; Saidi, Y.; Sampedro, L.; Ladero, V.; Del Rio, B.; Alvarez, M.A. GABA-producing Lactococcus lactis strains isolated from camel’s milk as starters for the production of GABA- enriched cheese. Foods 2021, 10, 633. [Google Scholar] [CrossRef] [PubMed]
  65. Tette, F.M.; Kwofie, S.K.; Wilson, M.D. Therapeutic anti-depressant potential of microbial GABA produced by Lactobacillus rhamnosus strains for GABAergic signaling restoration and inhibition of addiction-induced HPA axis hyperactivity. Curr. Issues Mol. Biol. 2022, 44, 1434–1451. [Google Scholar] [CrossRef]
  66. Bouhnik, Y.; Raskine, L.; Simoneau, G.; Vicaut, E.; Neut, C.; Flourié, B.; Brouns, F.; Bornet, F.R. The capacity of nondigestible carbohydrates to stimulate fecal bifidobacteria in healthy humans: A double-blind, randomized, placebo-controlled, parallel-group, dose-response relation study. Am. J. Clin. Nutr. 2004, 80, 1658–1664. [Google Scholar] [CrossRef] [PubMed]
  67. den Besten, G.; Lange, K.; Havinga, R.; van Dijk, T.H.; Gerding, A.; van Eunen, K.; Müller, M.; Groen, A.K.; Hooiveld, G.J.; Bakker, B.M.; et al. Gut-derived short-chain fatty acids are vividly assimilated into host carbohydrates and lipids. Am. J. Physiol.—Gastrointest. Liver Physiol. 2013, 305, G900–G910. [Google Scholar] [CrossRef] [PubMed]
  68. Poveda, C.; Pereira, D.I.; Lewis, M.C.; Walton, G.E. The impact of low-level iron supplements on the faecal microbiota of irritable bowel syndrome and healthy donors using in vitro batch cultures. Nutrients 2020, 12, 3819. [Google Scholar] [CrossRef]
  69. Gibson, G.R.; Cummings, J.H.; Macfarlane, G.T. Use of a three-stage continuous culture system to study the effect of mucin on dissimilatory sulfate reduction and methanogenesis by mixed populations of human gut bacteria. Appl. Environ. Microbiol. 1988, 54, 2750–2755. [Google Scholar] [CrossRef]
Figure 1. Enumeration of bacteria by Flow-FISH at baseline (T0) and following 8 (T8) and 24 (T24) hours of faecal (1%) fermentation within the negative control, positive control, and six probiotic vessels, represented as log10 cells/mL culture. Target bacteria included: total bacteria (A), Bifidobacterium spp. (BIF) (B), Lactobacillus spp. (LAB) (C), most Bacteroidaceae and Prevotellaceae (BAC) (D), Clostridium coccoides–Eubacterium rectale group (EREC) (E), Roseburia subcluster (RREC) (F), Faecalibacterium prausnitzii (FPRAU) (G), Clostridium cluster IX (PROP) (H), Atopobium–Coriobacterium spp. (ATO) (I), Desulfovibrio (DSV) (J), and Clostridium histolyticum (CHIS) (K). Values are presented as mean ± standard error from three independent experiments. Significant change within vessels is indicated as * p < 0.05. No significant difference between the negative control and other vessels was observed at any of the sampling timepoints.
Nutrients 15 02563 g001aNutrients 15 02563 g001b
Figure 2. SCFA concentrations of acetate (A), propionate (B), butyrate (C), and lactate (D) (mM) per vessel (excluding the positive control vessel) at baseline and following 8 (T8) and 24 h (T24) of fermentation. Values are mean ± standard error. Significant change within vessels is indicated as * p < 0.05 and ** p < 0.01. No significant difference between the negative control and other vessels was observed at any of the sampling timepoints.
Nutrients 15 02563 g002
Figure 3. SCFA concentrations of acetate (A), propionate (B), butyrate (C), and lactate (D) (mM) per vessel (excluding the positive control vessel) at baseline and following 8 (T8) and 24 h (T24) of fermentation. Values are mean ± standard error. Significant change within vessels is indicated as * p < 0.05 and ** p < 0.01. No significant difference between the negative control and other vessels was observed at any of the sampling timepoints.
Nutrients 15 02563 g003aNutrients 15 02563 g003b
Figure 4. Concentrations of GABA (A), serotonin (B), tryptophan (C), and dopamine (D) (mM) per vessel (excluding the positive control vessel) at baseline and following 8 (T8) and 24 h (T24) of fermentation. Values are mean ± standard error. No significant difference within or between vessels was observed at any of the sampling timepoints.
Nutrients 15 02563 g004aNutrients 15 02563 g004b
Table 1. Oligonucleotide probe sequences and corresponding target species.
ProbeSequenceTarget Species
Non-EubACTCCTAGGGAGGCAGAControl probe for EUB338 [32]
Eub338I+GCTGCCTCCCGTAGGAGTMost bacteria [33]
Eub338II+GCAGCCACCCGTAGGTGTPlanctomycetales [33]
Eub338III+GCTGCCACCCGTAGGTGTVerrucomicrobialesm [33]
Bif164CATCCGGCATTACCACCCBifidobacterium spp. [34]
Lab158GGTATTAGCAYCTGTTTGGALactobacillus and Enterococcus [35]
Bac303CCAATGTGGGGGACCTTBacteroidaceae, Prevotellaceae [36]
Erec482GCTTCTTAGTCARGTACCGMost of the Clostridium coccoides-Eubacterium rectale group [37]
Rrec584TCAGACTTGCCGYACCGCRoseburia [38]
Ato291GGTCGGTCTCTCAACCCAtopobium cluster [39]
Prop853ATTGCGTTAACTCCGGCACClostridium cluster IX [38]
Fprau655CGCCTACCTCTGCACTACFaecalibacterium prausnitzii and relatives [40]
DSV687TACGGATTTCACTCCTDesulfovibrio genus [41]
Chis150TTATGCGGTATTAATCTYCCTTTMost of the Clostridium histolyticum group [37]
Table 2. LC-MS/MS conditions used for quantification in faecal supernatant.
CompoundRetention Time
(Min)
Retention Time Window (Min)Precursor
Ion
(m/z)
Product
Ion (m/z)
Fragment Or (V)Collision
Energy (V)
Classification
GABA1.90310487504Organic acid
3104455020
Norepinephrine2.50315210711616Catecholamine
1527711630
Epinephrine4.603184166708Catecholamine
1841077024
Dopamine7.003154137758Catecholamine
154917528
Serotonin9.703177160454Amino acid derivative
1771154530
Kynurenic acid9.77319014410016Organic acid
1901721004
Tryptophan10.203205188784Amino acid
2051467820
Disclaimer/Publisher’s Note: The statements, opinions and data contained in all publications are solely those of the individual author(s) and contributor(s) and not of MDPI and/or the editor(s). MDPI and/or the editor(s) disclaim responsibility for any injury to people or property resulting from any ideas, methods, instructions or products referred to in the content.

