
Evaluation of Subjective Appetite Assessment under Free-Living vs. Controlled Conditions: A Randomized Crossover Trial Comparing Whole-Grain Rye and Refined Wheat Diets (VASA-Home)

 ,
, 

Abstract
1. Introduction
2. Materials and Methods
2.1. Ethical Statement
2.2. Participants
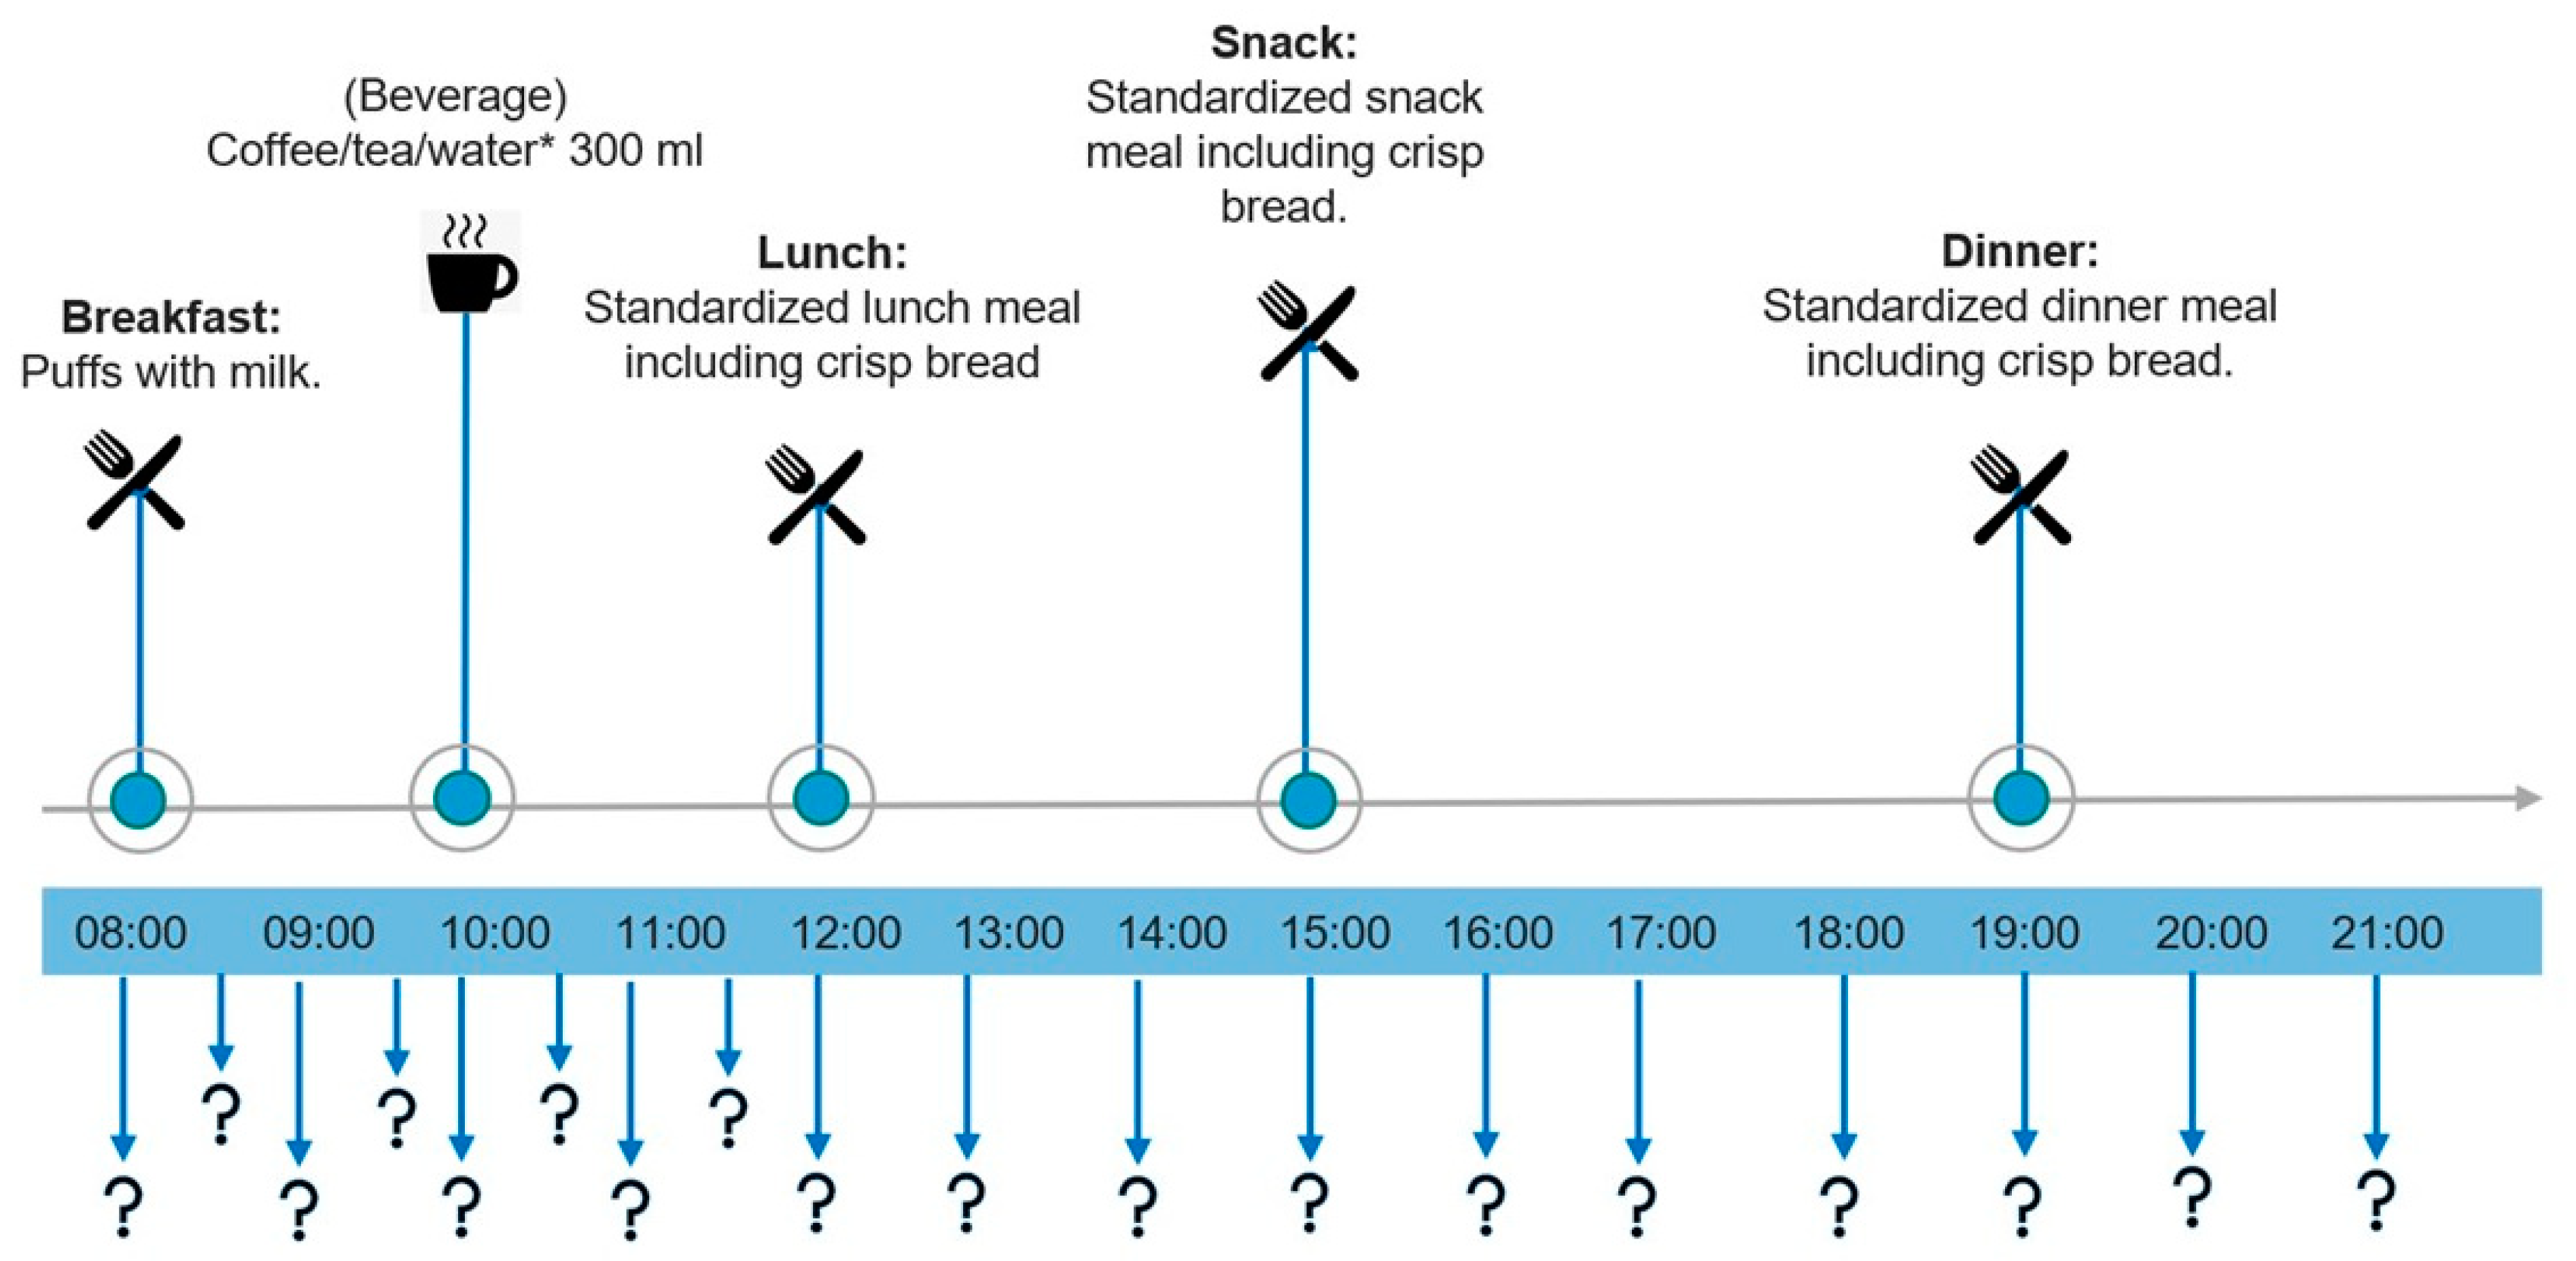
2.3. Study Design
2.4. Blinding
2.5. Intervention Diets
2.6. Appetite Assessment
2.7. Statistical Analysis
3. Results
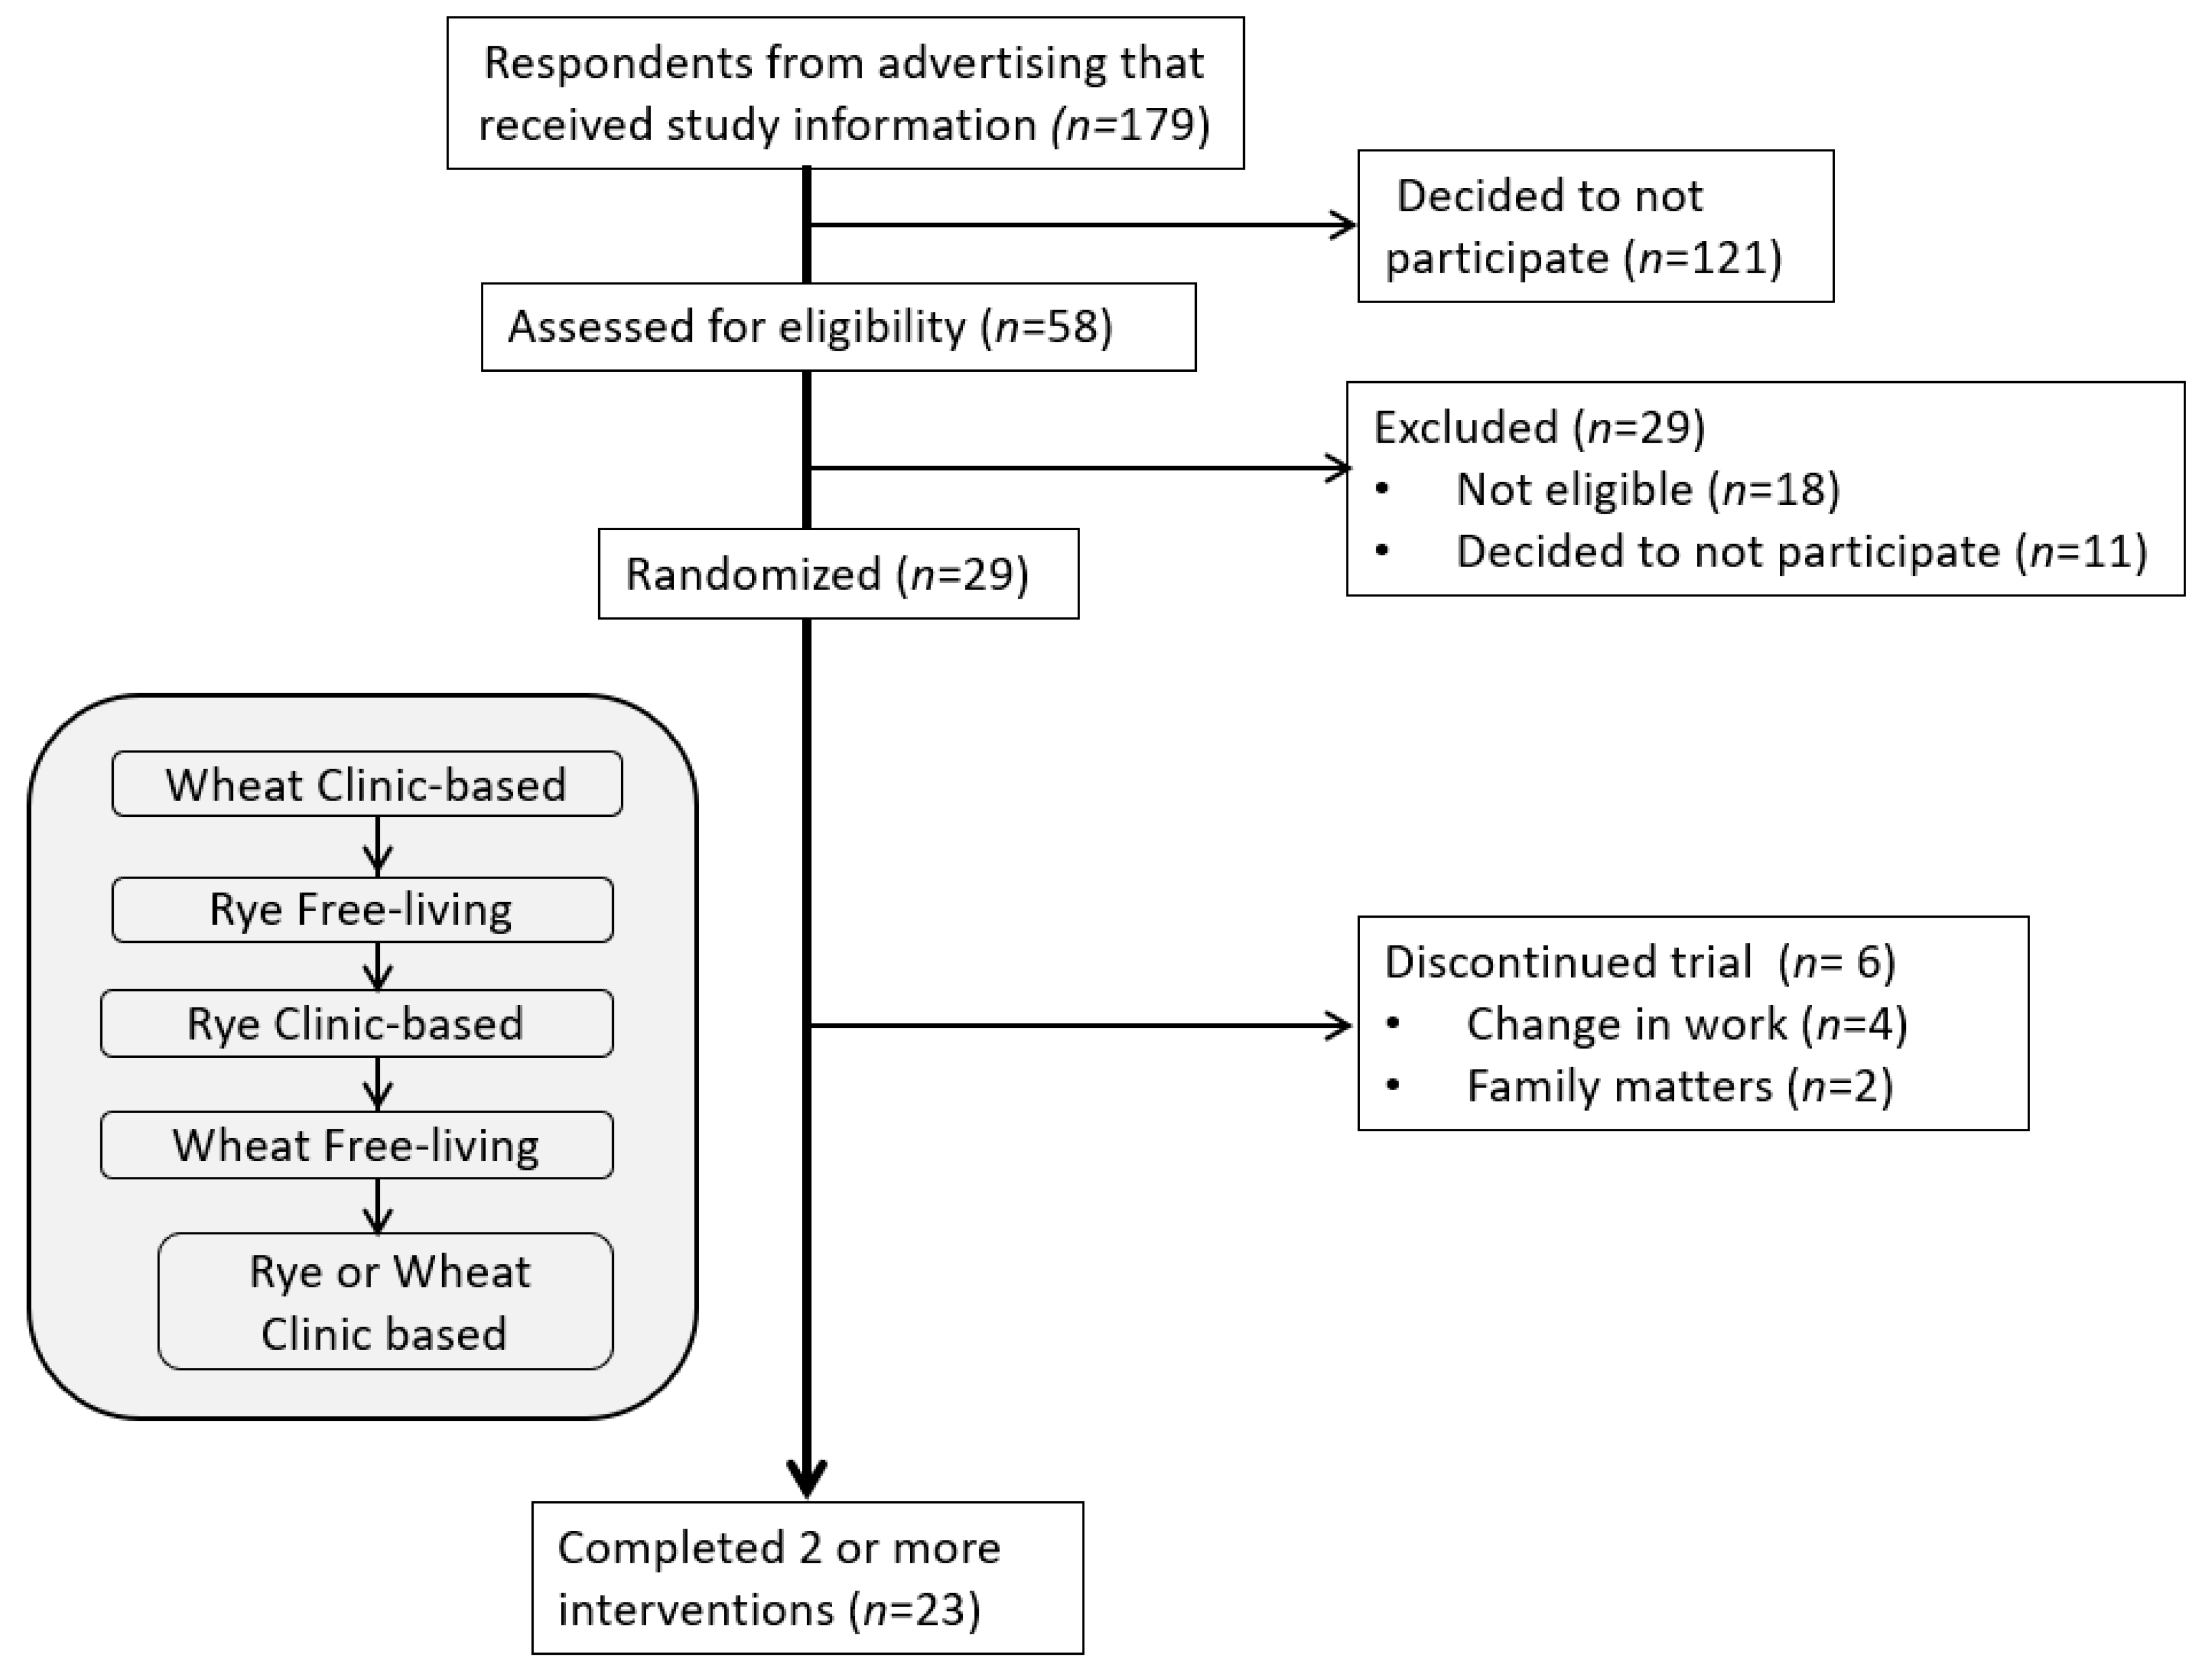
3.1. CONSORT Flow Diagram and Participant Characteristics
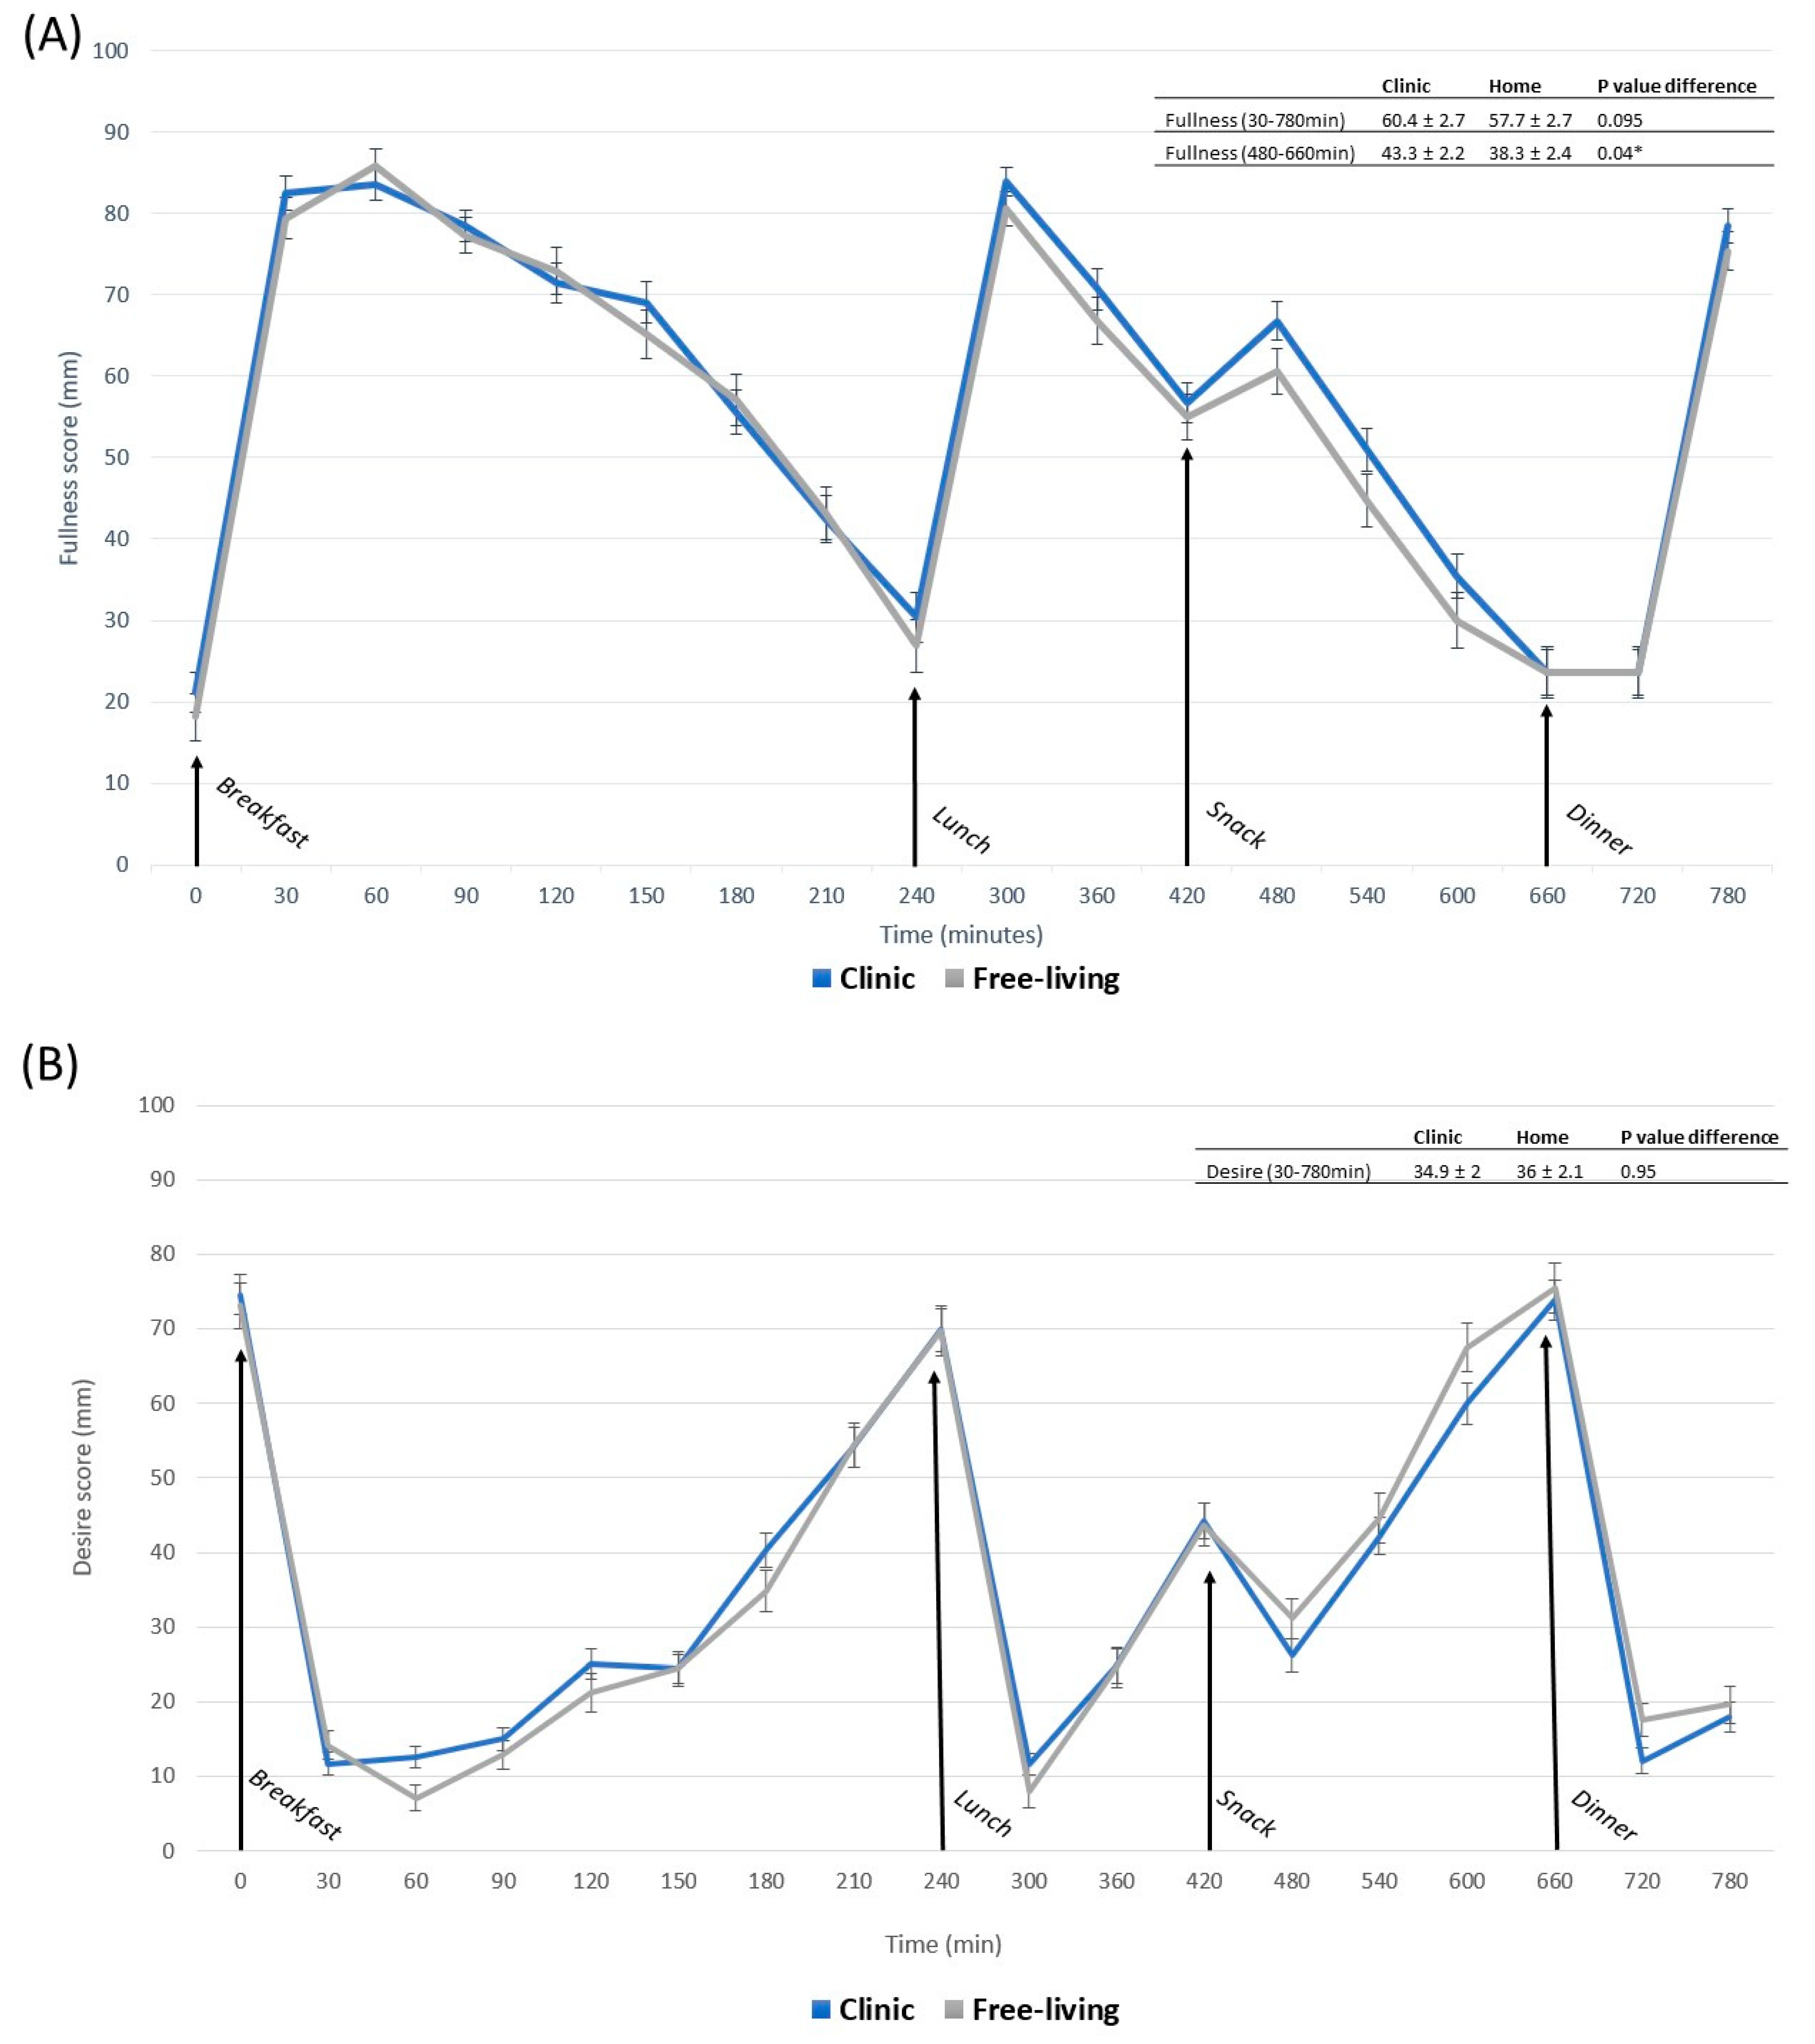
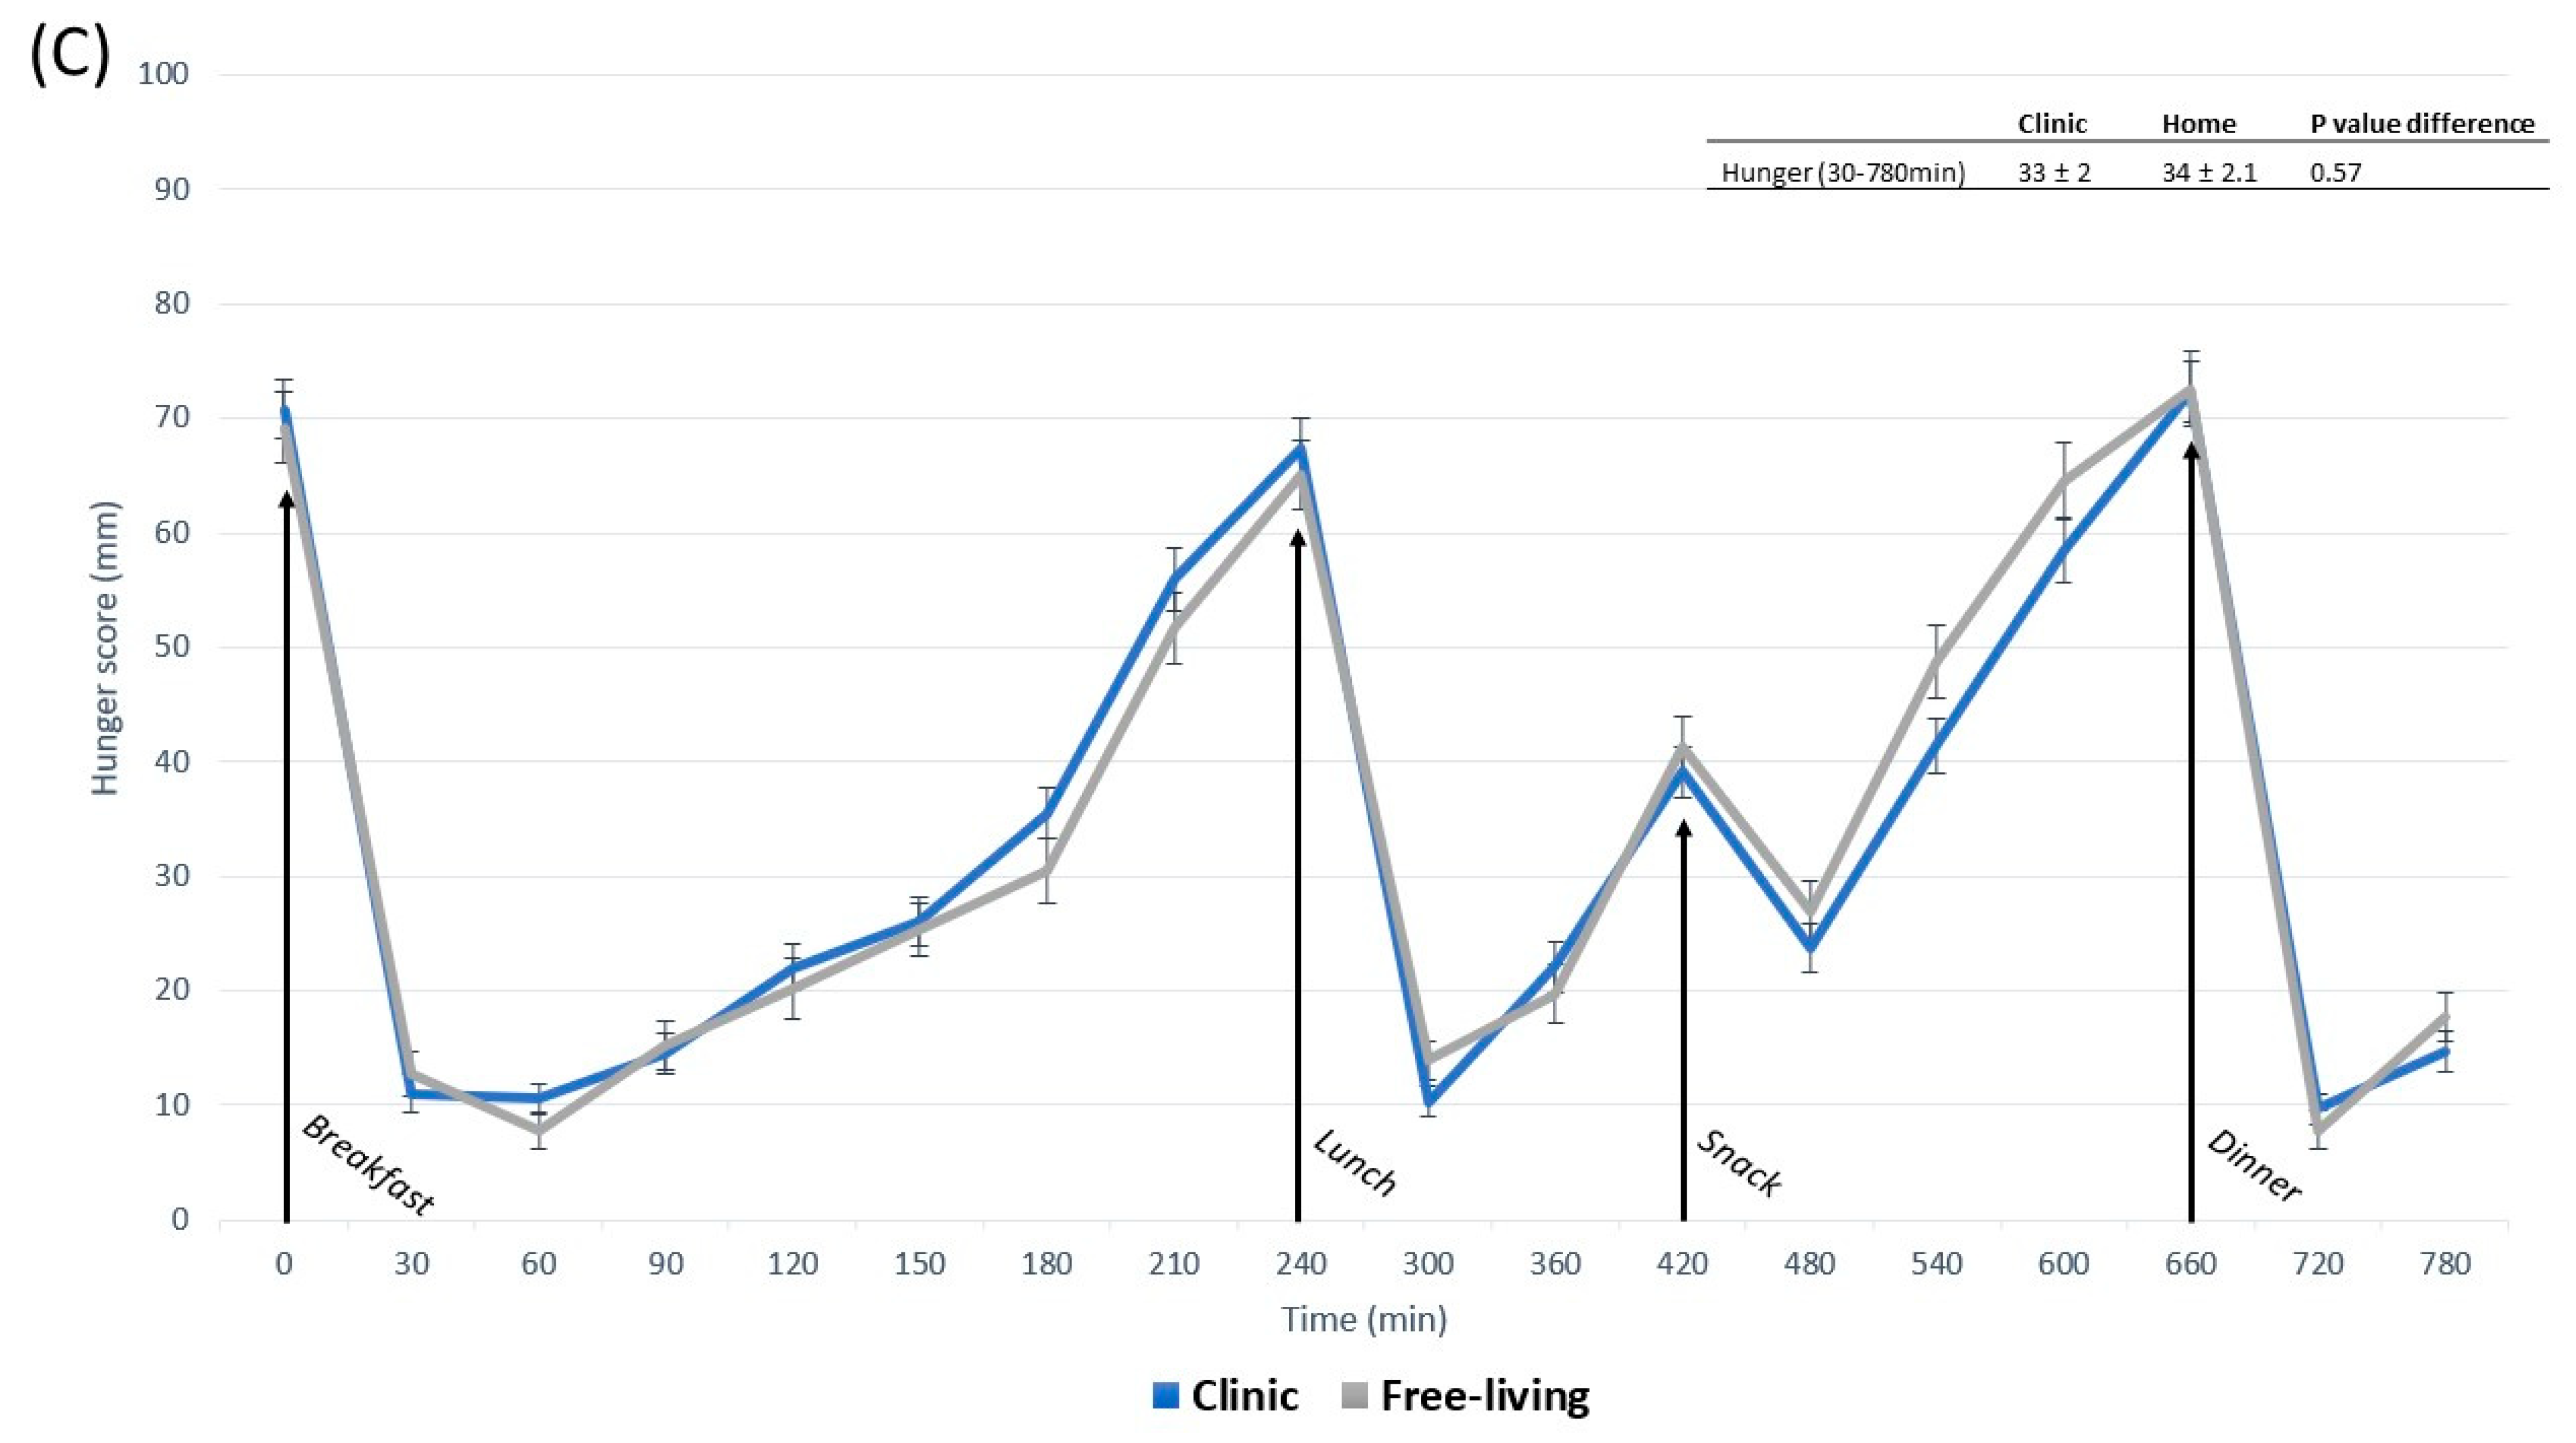
3.2. Appetite Responses
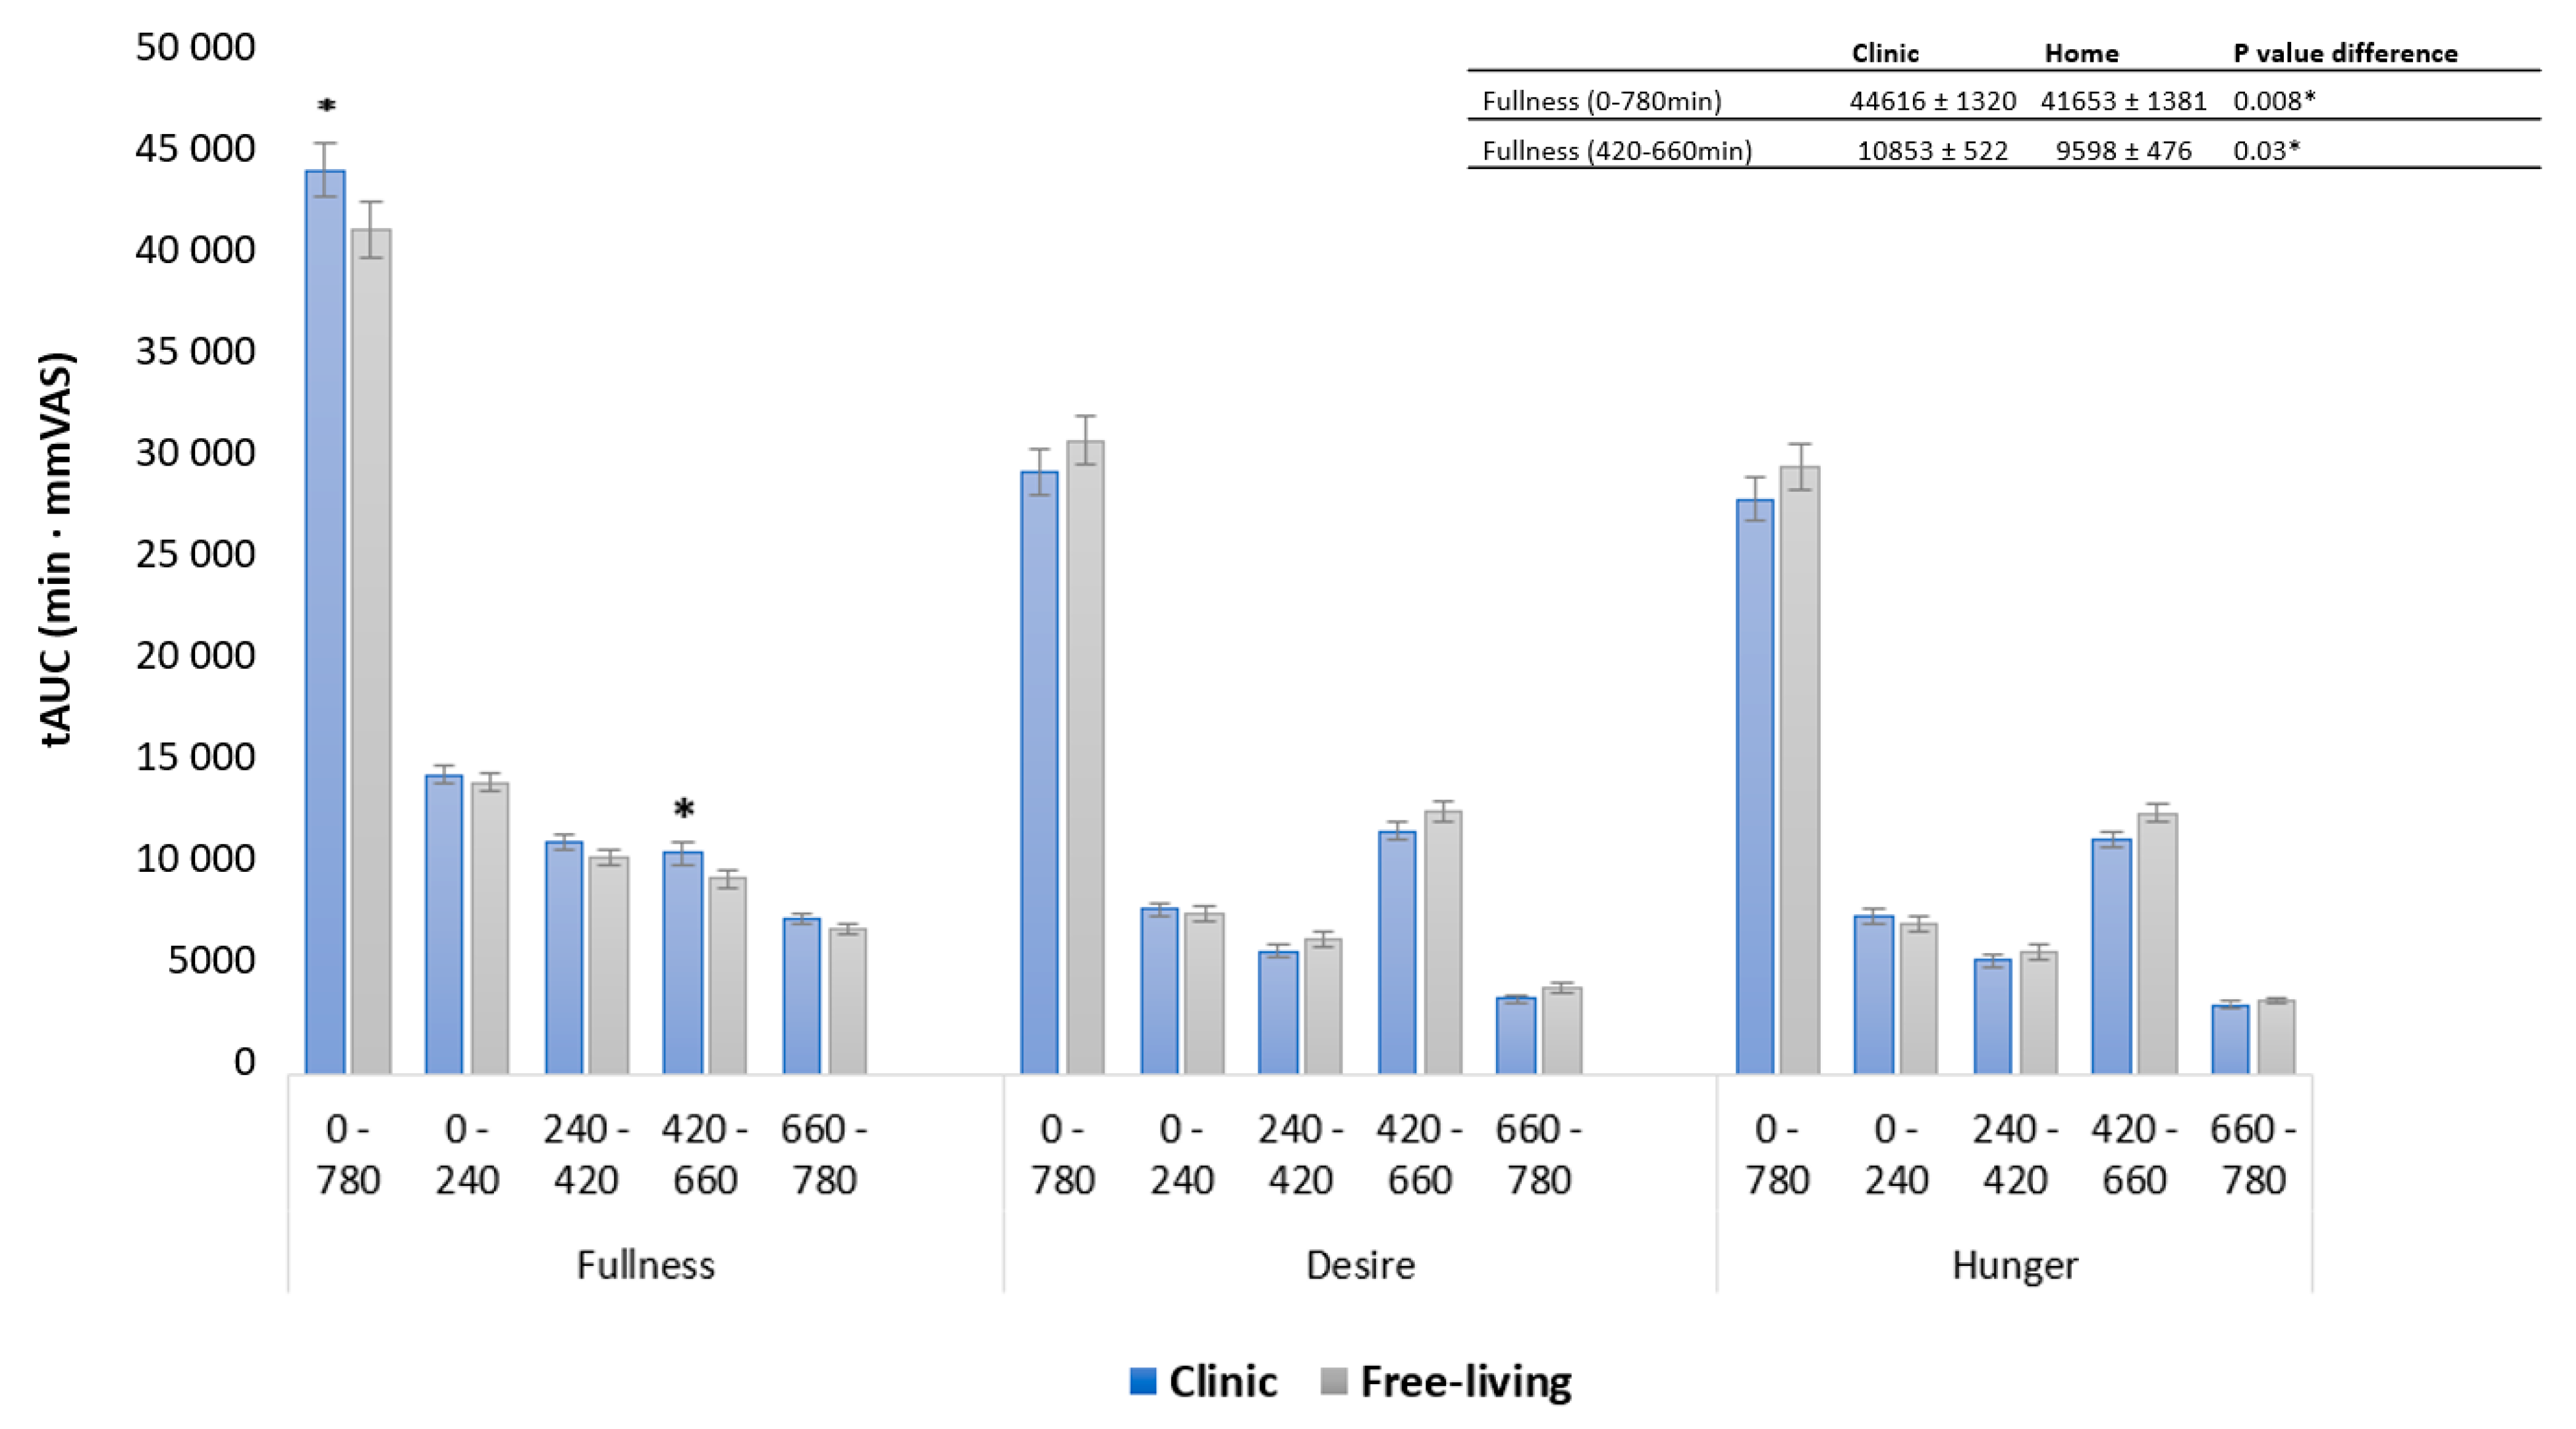
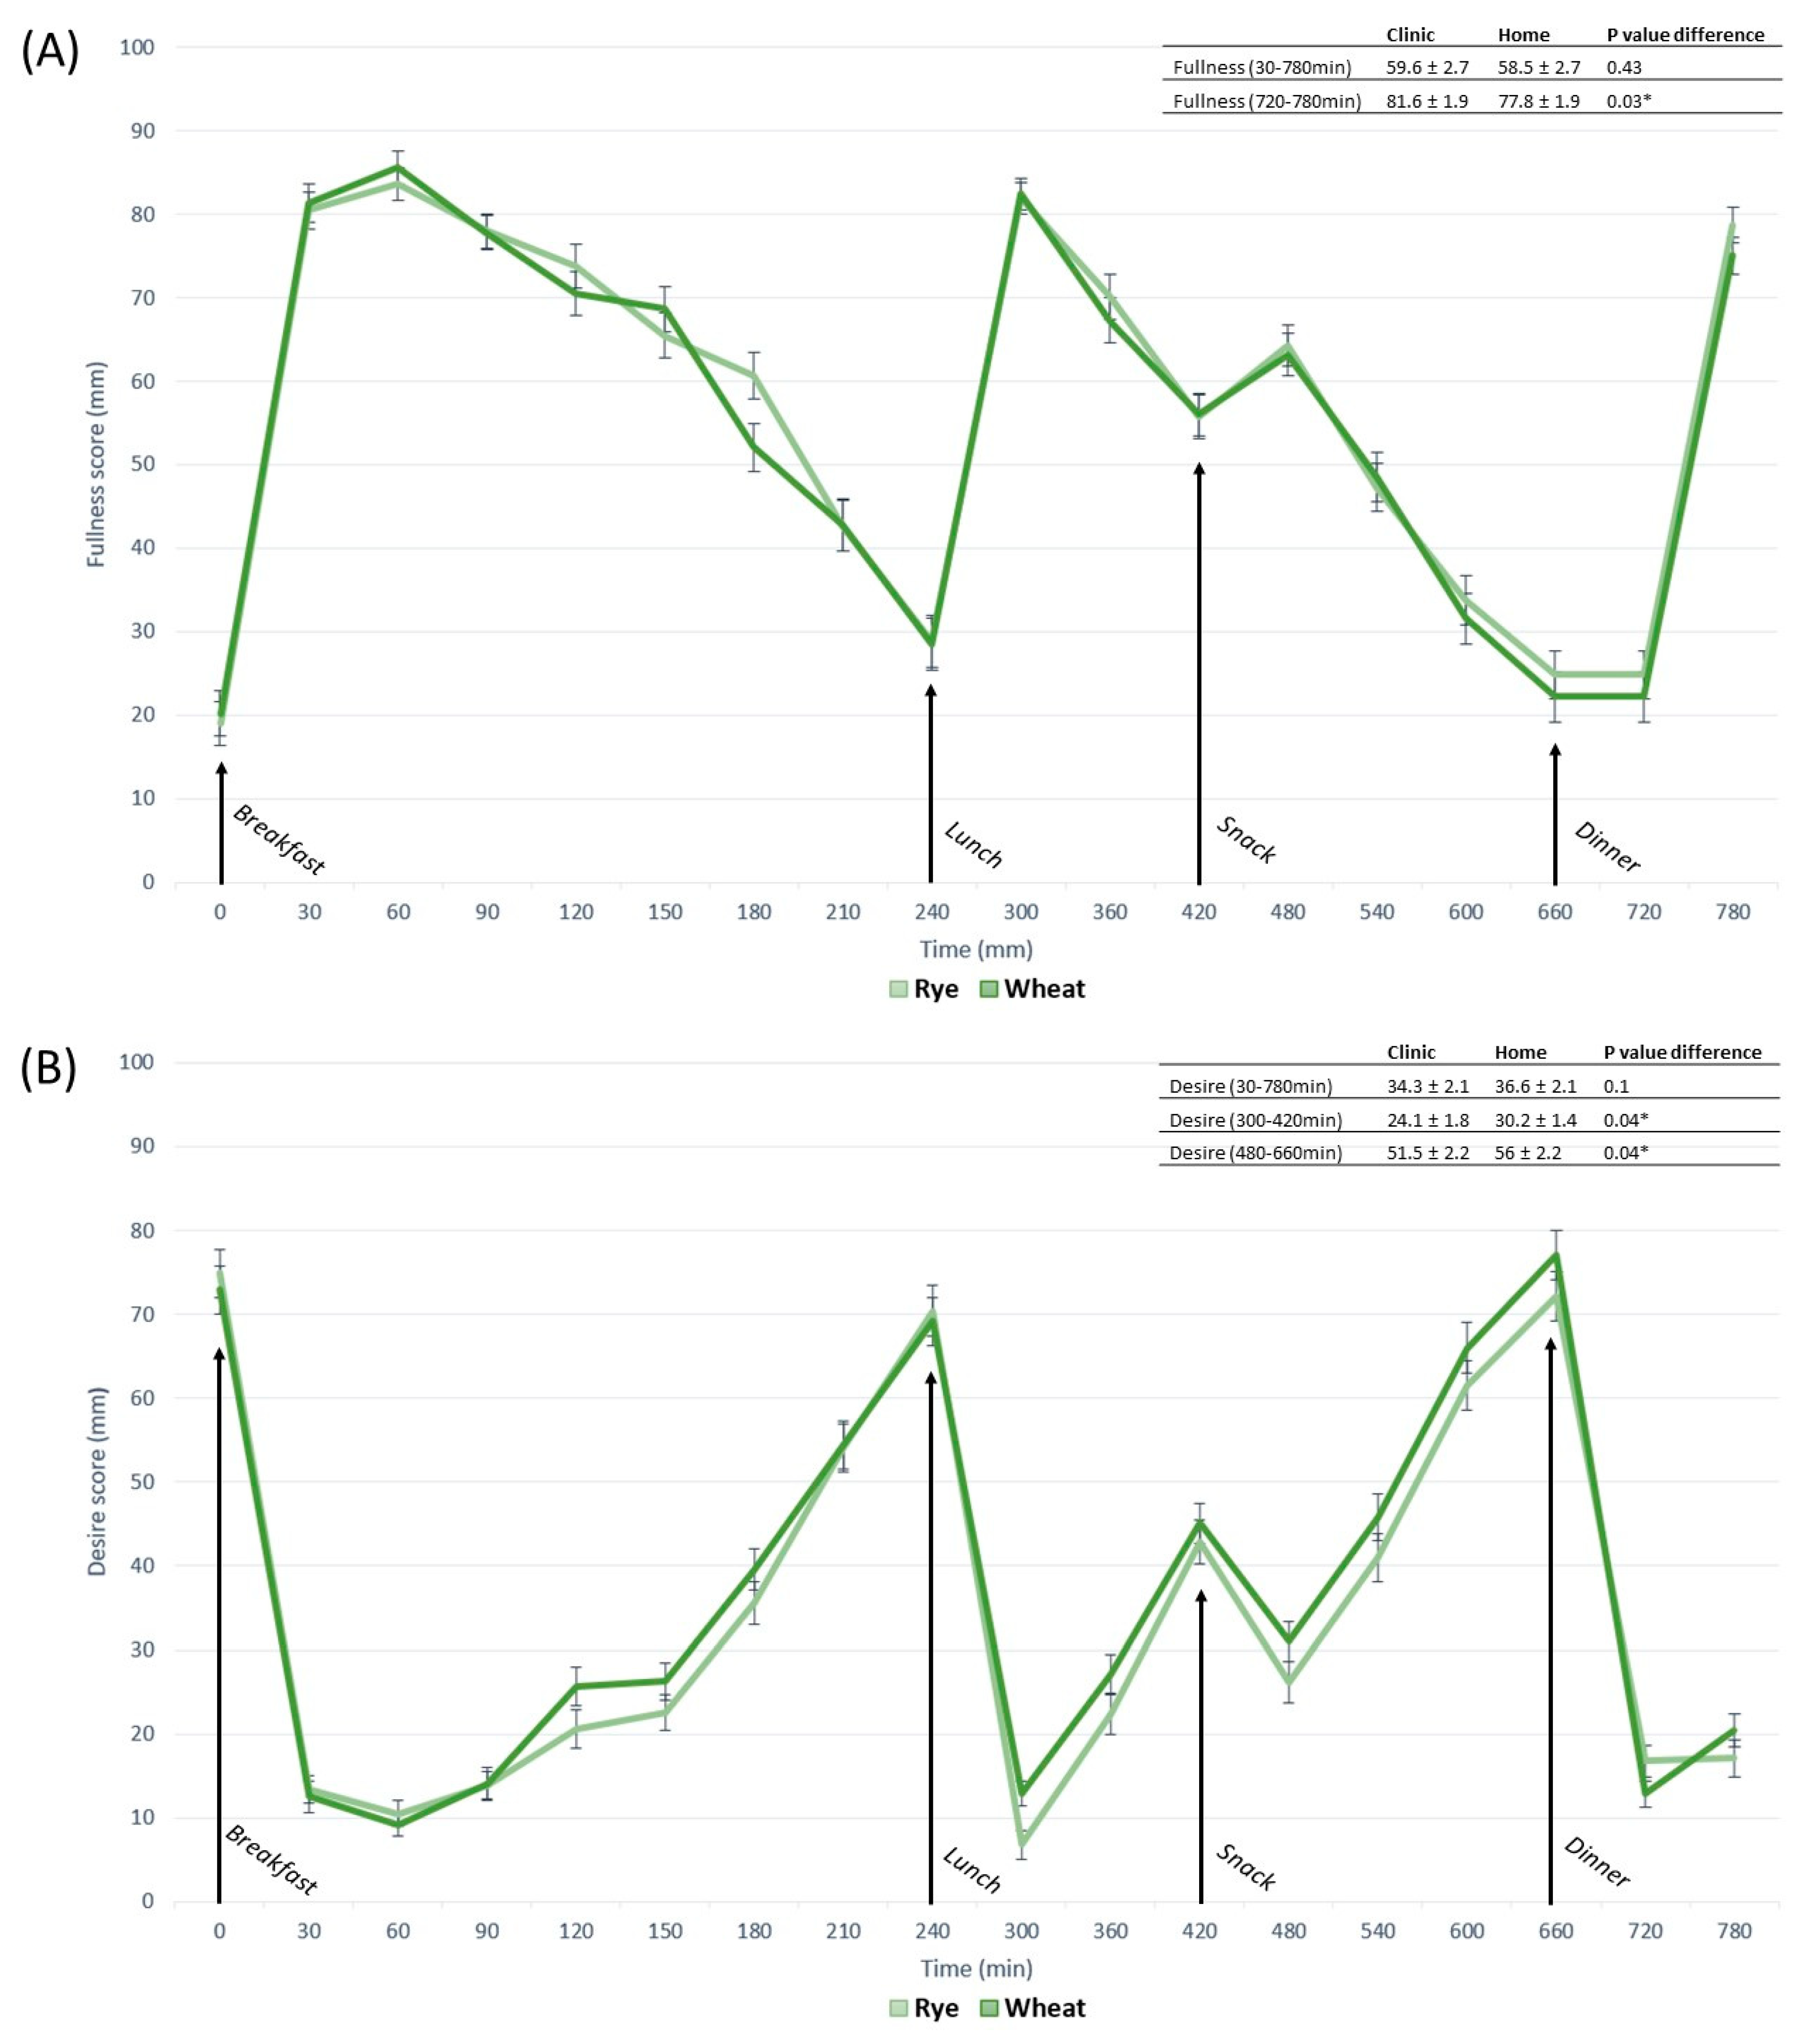
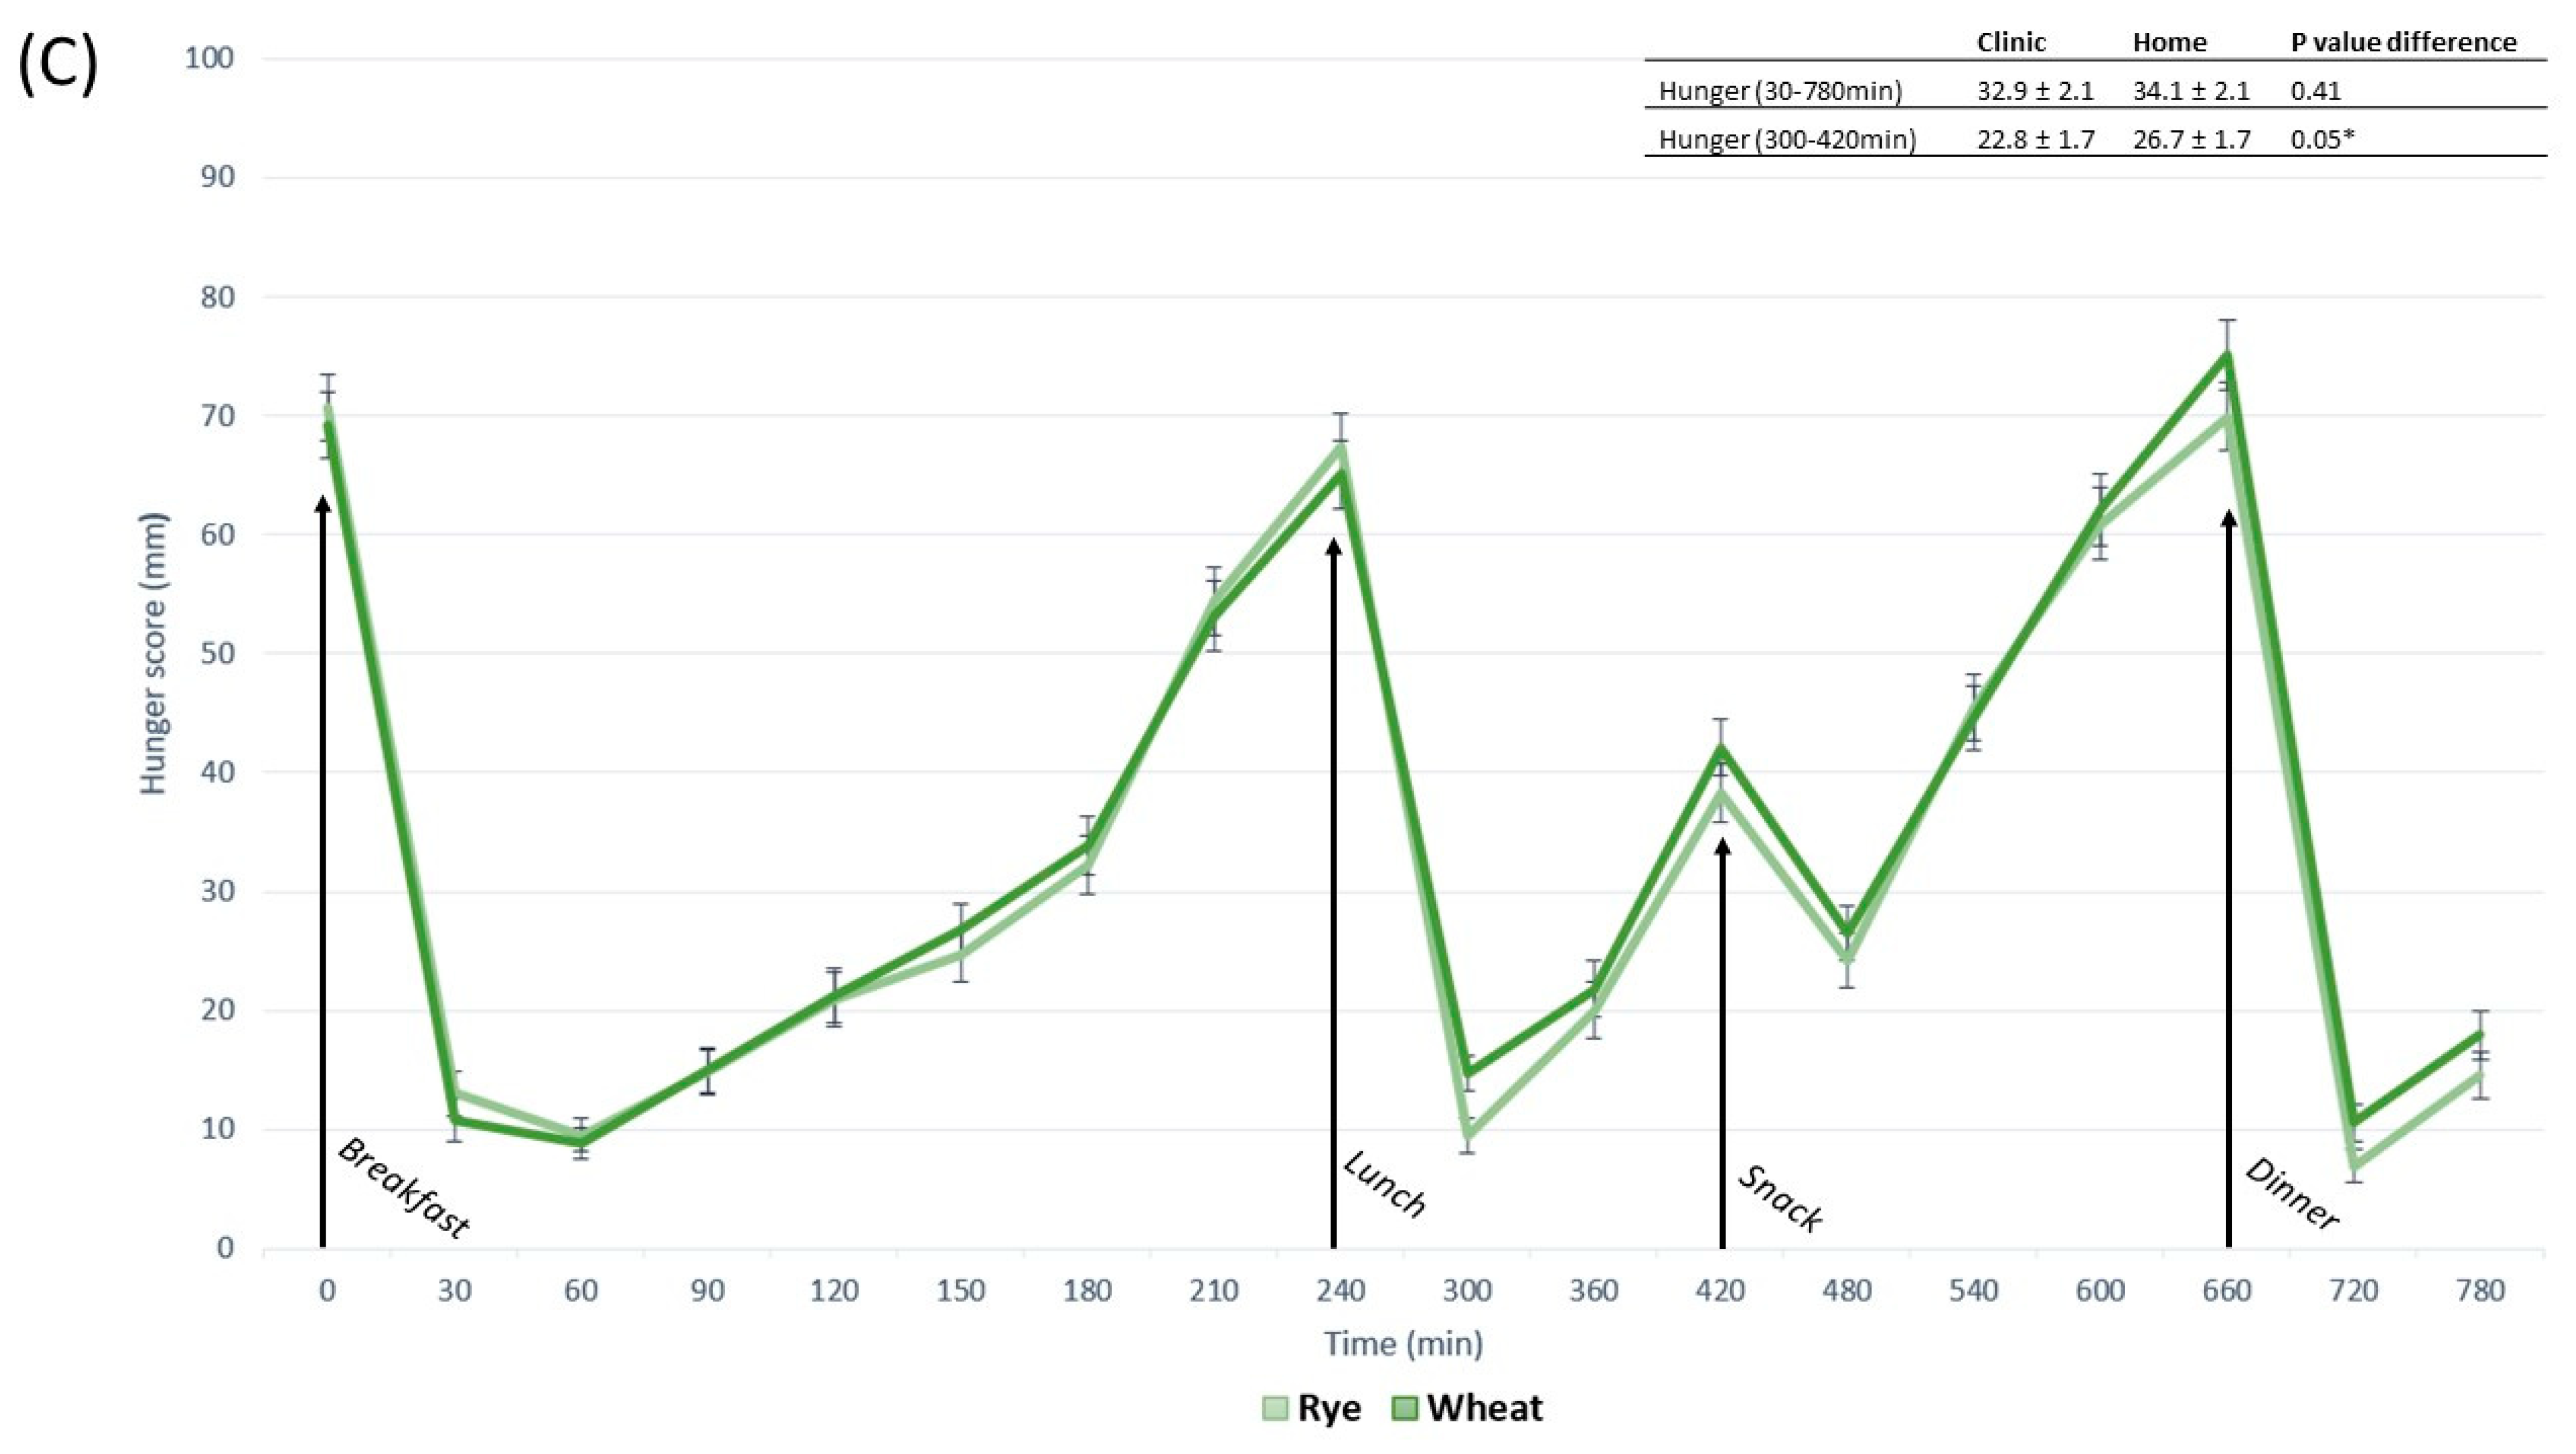
3.3. Contrasts in Appetite between Free-Living and Clinic-Based Interventions
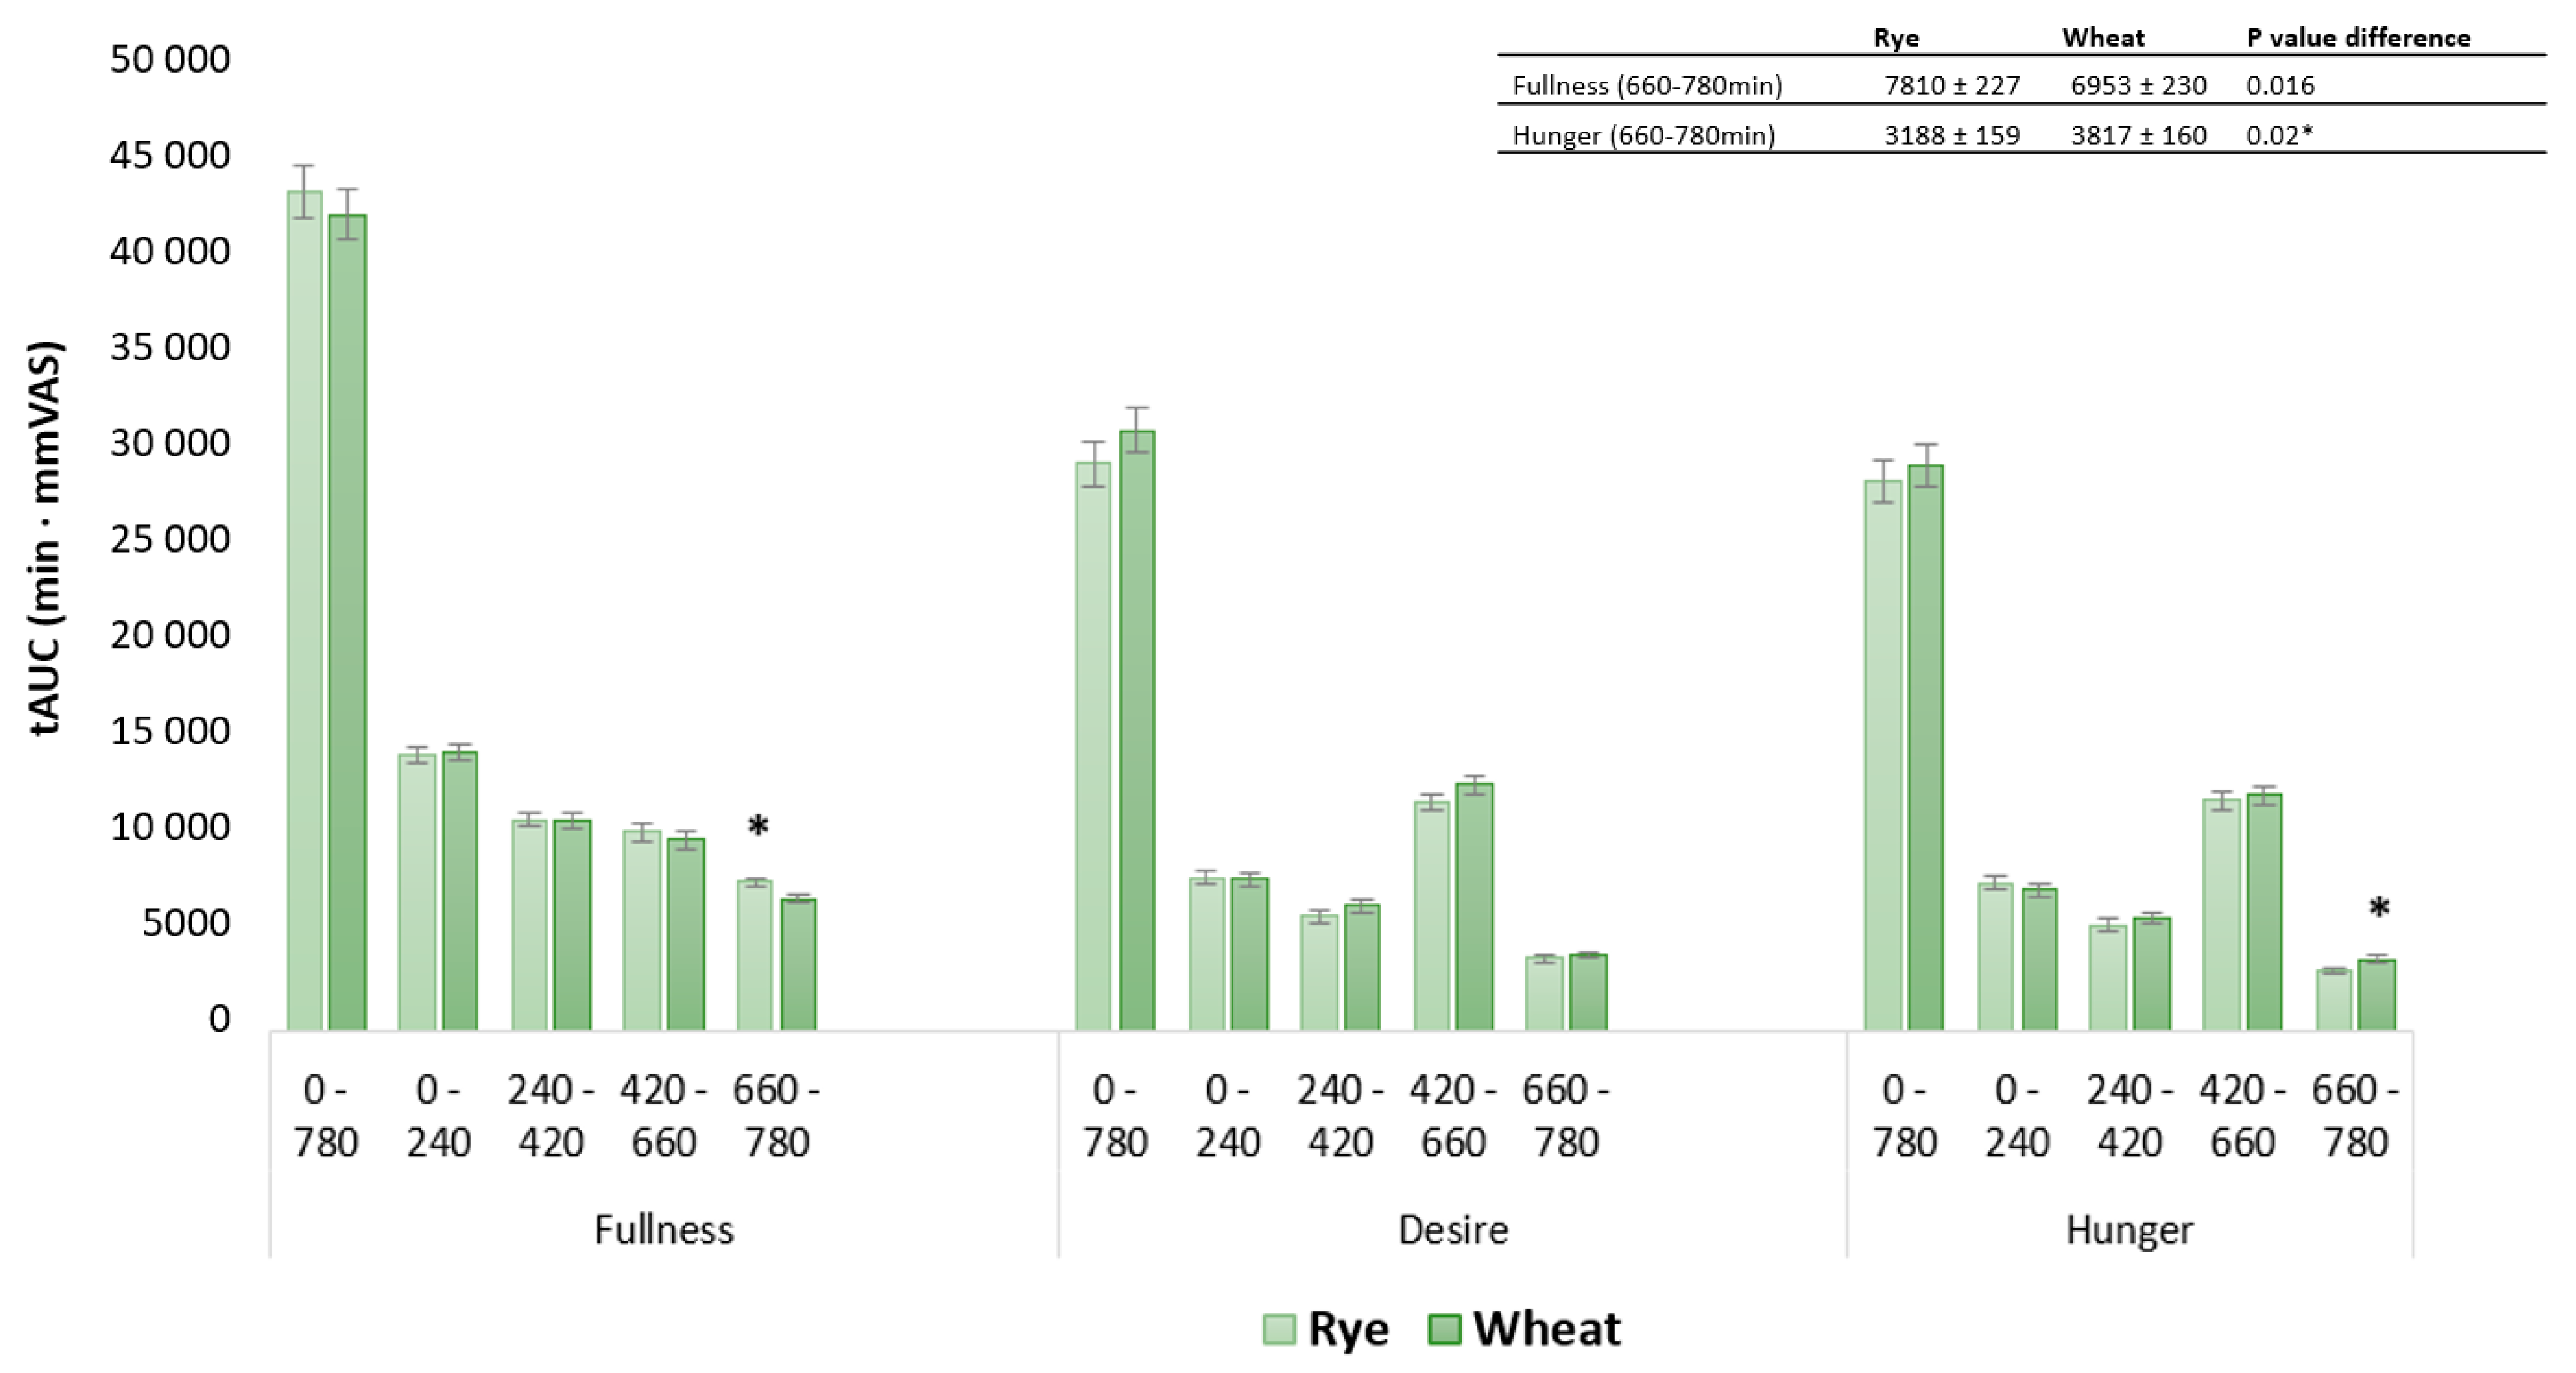
3.4. Contrasts in Appetite between Whole-Grain Rye- and Wheat-Based Interventions
4. Discussion
5. Conclusions
Supplementary Materials
Author Contributions
Funding
Institutional Review Board Statement
Informed Consent Statement
Data Availability Statement
Acknowledgments
Conflicts of Interest
References
- Vos, T.; Lim, S.S.; Abbafati, C.; Abbas, K.M.; Abbasi, M.; Abbasifard, M.; Abbasi-Kangevari, M.; Abbastabar, H.; Abd-Allah, F.; Abdelalim, A.; et al. Global Burden of 369 Diseases and Injuries in 204 Countries and Territories, 1990–2019: A Systematic Analysis for the Global Burden of Disease Study. Lancet 2020, 396, 1204–1222. [Google Scholar] [CrossRef] [PubMed]
- Forouzanfar, M.H.; Afshin, A.; Alexander, L.T.; Biryukov, S.; Brauer, M.; Cercy, K.; Charlson, F.J.; Cohen, A.J.; Dandona, L.; Estep, K.; et al. Global, Regional, and National Comparative Risk Assessment of 79 Behavioural, Environmental and Occupational, and Metabolic Risks or Clusters of Risks, 1990–2015: A Systematic Analysis for the Global Burden of Disease Study 2015. Lancet 2016, 388, 1659. [Google Scholar] [CrossRef] [PubMed]
- Hill, J.O.; Wyatt, H.R.; Peters, J.C. Energy Balance and Obesity. Circulation 2012, 126, 126–132. [Google Scholar] [CrossRef]
- Mendoza, J.A.; Drewnowski, A.; Christakis, D.A. Dietary Energy Density Is Associated with Obesity and the Metabolic Syndrome in U.S. Adults. Diabetes Care 2007, 30, 974–979. [Google Scholar] [CrossRef] [PubMed]
- Vandevijvere, S.; Chow, C.C.; Hall, K.D.; Umali, E.; Swinburn, B.A. Increased Food Energy Supply as a Major Driver of the Obesity Epidemic: A Global Analysis. Bull World Heal. Organ 2015, 93, 446–456. [Google Scholar] [CrossRef] [PubMed]
- Sadoul, B.C.; Schuring, E.A.H.; Mela, D.J.; Peters, H.P.F. The Relationship between Appetite Scores and Subsequent Energy Intake: An Analysis Based on 23 Randomized Controlled Studies. Appetite 2014, 83, 153–159. [Google Scholar] [CrossRef]
- Forde, C.G.; Almiron-Roig, E.; Brunstrom, J.M. Expected Satiety: Application to Weight Management and Understanding Energy Selection in Humans. Curr. Obes. Rep. 2015, 4, 131–140. [Google Scholar] [CrossRef]
- Stubbs, R.J.; Hughes, D.A.; Johnstone, A.M.; Rowley, E.; Reid, C.; Elia, M.; Stratton, R.; Delargy, H.; King, N.; Blundell, J.E. Review Article The Use of Visual Analogue Scales to Assess Motivation to Eat in Human Subjects: A Review of Their Reliability and Validity with an Evaluation of New Hand-Held Computerized Systems for Temporal Tracking of Appetite Ratings. Br. J. Nutr. 2000, 44, 405–415. [Google Scholar] [CrossRef]
- Blundell, J.; De Graaf, C.; Hulshof, T.; Jebb, S.; Livingstone, B.; Lluch, A.; Mela, D.; Salah, S.; Schuring, E.; Van Der Knaap, H.; et al. Appetite Control: Methodological Aspects of the Evaluation of Foods. Obes. Rev. 2010, 11, 251. [Google Scholar] [CrossRef]
- Flint, A.; Raben, A.; Blundell, J.E.; Astrup, A. Reproducibility, Power and Validity of Visual Analogue Scales in Assessment of Appetite Sensations in Single Test Meal Studies. Int. J. Obes. 2000, 24, 38–48. [Google Scholar] [CrossRef]
- Lichtenstein, A.H.; Petersen, K.; Barger, K.; Hansen, K.E.; Anderson, C.A.; Baer, D.J.; Lampe, J.W.; Rasmussen, H.; Matthan, N.R.; Mayer, J. Perspective: Design and Conduct of Human Nutrition Randomized Controlled Trials. Adv. Nutr. 2021, 12, 4–20. [Google Scholar] [CrossRef]
- Gibbons, C.; Hopkins, M.; Beaulieu, K.; Oustric, P.; Blundell, J.E. Issues in Measuring and Interpreting Human Appetite (Satiety/Satiation) and Its Contribution to Obesity. Curr. Obes. Rep. 2019, 8, 77–87. [Google Scholar] [CrossRef]
- Hetherington, M.M.; Cunningham, K.; Dye, L.; Gibson, E.L.; Gregersen, N.T.; Halford, J.C.G.; Lawton, C.L.; Lluch, A.; Mela, D.J.; Van Trijp, H.C.M. Potential Benefits of Satiety to the Consumer: Scientific Considerations. Nutr. Res. Rev. 2013, 26, 22–38. [Google Scholar] [CrossRef] [PubMed]
- World Health Organization. Diet, nutrition and the prevention of chronic diseases: Report of a joint WHO/FAO expert consultation. 2003. Available online: http://apps.who.int/iris/bitstream/handle/10665/42665/WHO_TRS_916.pdf;jsessionid=5150E6DACD1536F5D29D62449171A451?sequence=1 (accessed on 23 September 2022).
- Poutanen, K.S.; Kårlund, A.O.; Gómez-Gallego, C.; Johansson, D.P.; Scheers, N.M.; Marklinder, I.M.; Eriksen, A.K.; Silventoinen, P.C.; Nordlund, E.; Sozer, N.; et al. Grains—A Major Source of Sustainable Protein for Health. Nutr. Rev. 2022, 80, 1648. [Google Scholar] [CrossRef] [PubMed]
- Sanders, L.M.; Zhu, Y.; Wilcox, M.L.; Koecher, K.; Maki, K.C. Effects of Whole Grain Intake, Compared with Refined Grain, on Appetite and Energy Intake: A Systematic Review and Meta-Analysis. Adv. Nutr. 2021, 12, 1177–1195. [Google Scholar] [CrossRef] [PubMed]
- Reynolds, A.; Mann, J.; Cummings, J.; Winter, N.; Mete, E.; Te Morenga, L. Carbohydrate Quality and Human Health: A Series of Systematic Reviews and Meta-Analyses. Lancet 2019, 393, 434–445. [Google Scholar] [CrossRef]
- Jonsson, K.; Andersson, R.; Bach Knudsen, K.E.; Hallmans, G.; Hanhineva, K.; Katina, K.; Kolehmainen, M.; Kyrø, C.; Langton, M.; Nordlund, E.; et al. Rye and Health—Where Do We Stand and Where Do We Go? Trends Food Sci. Technol. 2018, 79, 78–87. [Google Scholar] [CrossRef]
- Frølich, W.; Åman, P.; Tetens, I. Whole Grain Foods and Health—A Scandinavian Perspective. Food Nutr. Res. 2013, 57, 18503. [Google Scholar] [CrossRef]
- Andersson, R.; Fransson, G.; Tietjen, M.; Åman, P. Content and Molecular-Weight Distribution of Dietary Fiber Components in Whole-Grain Rye Flour and Bread. J. Agric. Food Chem. 2009, 57, 2004–2008. [Google Scholar] [CrossRef]
- Hartvigsen, M.L.; Lærke, H.N.; Overgaard, A.; Holst, J.J.; Bach Knudsen, K.E.; Hermansen, K. Postprandial Effects of Test Meals Including Concentrated Arabinoxylan and Whole Grain Rye in Subjects with the Metabolic Syndrome: A Randomised Study. Eur. J. Clin. Nutr. 2014, 68, 567–574. [Google Scholar] [CrossRef]
- Lee, I.; Shi, L.; Webb, D.L.; Hellström, P.M.; Risérus, U.; Landberg, R. Effects of Whole-Grain Rye Porridge with Added Inulin and Wheat Gluten on Appetite, Gut Fermentation and Postprandial Glucose Metabolism: A Randomised, Cross-over, Breakfast Study. Br. J. Nutr. 2016, 116, 2139–2149. [Google Scholar] [CrossRef] [PubMed]
- Rosén, L.A.H.; Östman, E.M.; Björck, I.M.E. Effects of Cereal Breakfasts on Postprandial Glucose, Appetite Regulation and Voluntary Energy Intake at a Subsequent Standardized Lunch; Focusing on Rye Products. Nutr. J. 2011, 10, 7. [Google Scholar] [CrossRef] [PubMed]
- Isaksson, H.; Tillander, I.; Andersson, R.; Olsson, J.; Fredriksson, H.; Webb, D.; Åman, P. Whole Grain Rye Breakfast—Sustained Satiety during Three Weeks of Regular Consumption. Physiol. Behav. 2012, 105, 877–884. [Google Scholar] [CrossRef]
- Johansson, D.P.; Lee, I.; Risérus, U.; Langton, M.; Landberg, R. Effects of Unfermented and Fermented Whole Grain Rye Crisp Breads Served as Part of a Standardized Breakfast, on Appetite and Postprandial Glucose and Insulin Responses: A Randomized Cross-over Trial. PLoS ONE 2015, 10, e0122241. [Google Scholar] [CrossRef]
- Iversen, K.N.; Carlsson, F.; Andersson, A.; Michaëlsson, K.; Langton, M.; Risérus, U.; Hellström, P.M.; Landberg, R. A Hypocaloric Diet Rich in High Fiber Rye Foods Causes Greater Reduction in Body Weight and Body Fat than a Diet Rich in Refined Wheat: A Parallel Randomized Controlled Trial in Adults with Overweight and Obesity (the RyeWeight Study). Clin. Nutr. ESPEN 2021, 45, 155–169. [Google Scholar] [CrossRef]
- Wyatt, P.; Berry, S.E.; Finlayson, G.; O’Driscoll, R.; Hadjigeorgiou, G.; Drew, D.A.; Khatib, H.A.; Nguyen, L.H.; Linenberg, I.; Chan, A.T.; et al. Postprandial Glycaemic Dips Predict Appetite and Energy Intake in Healthy Individuals. Nat. Metab. 2021, 3, 523. [Google Scholar] [CrossRef]
- Henry, C.J.K. Basal Metabolic Rate Studies in Humans: Measurement and Development of New Equations. Publ. Online Camb. Univ. Press 2005, 8, 1133–1152. [Google Scholar] [CrossRef] [PubMed]
- Gabrielsson, J.; Weiner, D. Pharmacokinetic and Pharmacodynamic Data Analysis: Concepts and Applications. In Pharmacokinetic and Pharmacodynamic Data Analysis: Concepts and Applications; 2000; pp. 141–153. Swedish pharmaceutical press: Stockholm, Sweden. [Google Scholar]
- Di, J.; Demanuele, C.; Kettermann, A.; Karahanoglu, F.I.; Cappelleri, J.C.; Potter, A.; Bury, D.; Cedarbaum, J.M.; Byrom, B. Considerations to Address Missing Data When Deriving Clinical Trial Endpoints from Digital Health Technologies. Contemp. Clin. Trials 2022, 113, 106661. [Google Scholar] [CrossRef]
- Pasman, W.J.; Hendriks, H.F.J.; Minekus, M.M.; de Ligt, R.A.F.; Scholtes-Timmerman, M.J.; Clabbers, N.D.S.; Leonards, N.M.; Johnson, J.; Bellmann, S. Subjective Feelings of Appetite of Wholegrain Breakfasts Evaluated under Controlled, Laboratory and ‘at Home’ Conditions. Physiol. Behav. 2018, 194, 285–291. [Google Scholar] [CrossRef]
- Nielson, R.; Vehrs, P.R.; Fellingham, G.W.; Hager, R.; Prusak, K.A. Step Counts and Energy Expenditure as Estimated by Pedometry during Treadmill Walking at Different Stride Frequencies. J. Phys. Act. Health 2011, 8, 1004–1013. [Google Scholar] [CrossRef]
- Dye, L.; Blundell, J.E. Menstrual Cycle and Appetite Control: Implications for Weight Regulation. Hum. Reprod. 1997, 12, 1142–1151. [Google Scholar] [CrossRef] [PubMed]


|
|
|
|
|
|
| Randomized | Completers | |
|---|---|---|
| Characteristics | n = 29 | n = 23 |
| Female (%) | 72 | 70 |
| Age (years) | 56 ± 13 | 55 ± 13 |
| Weight (kg) | 87 ± 13 | 88 ± 13 |
| BMI (kg/m2) | 32 ± 9 | 32 ± 10 |
| Systolic BP (mmHg) | 130 ± 13 | 130 ± 12 |
Disclaimer/Publisher’s Note: The statements, opinions and data contained in all publications are solely those of the individual author(s) and contributor(s) and not of MDPI and/or the editor(s). MDPI and/or the editor(s) disclaim responsibility for any injury to people or property resulting from any ideas, methods, instructions or products referred to in the content. |
© 2023 by the authors. Licensee MDPI, Basel, Switzerland. This article is an open access article distributed under the terms and conditions of the Creative Commons Attribution (CC BY) license (https://creativecommons.org/licenses/by/4.0/).
Share and Cite
Åberg, S.; Palmnäs-Bédard, M.; Karlsson, T.; Hjorth, T.; Iversen, K.N.; Landberg, R. Evaluation of Subjective Appetite Assessment under Free-Living vs. Controlled Conditions: A Randomized Crossover Trial Comparing Whole-Grain Rye and Refined Wheat Diets (VASA-Home). Nutrients 2023, 15, 2456. https://doi.org/10.3390/nu15112456
Åberg S, Palmnäs-Bédard M, Karlsson T, Hjorth T, Iversen KN, Landberg R. Evaluation of Subjective Appetite Assessment under Free-Living vs. Controlled Conditions: A Randomized Crossover Trial Comparing Whole-Grain Rye and Refined Wheat Diets (VASA-Home). Nutrients. 2023; 15(11):2456. https://doi.org/10.3390/nu15112456
Chicago/Turabian StyleÅberg, Sebastian, Marie Palmnäs-Bédard, Therese Karlsson, Thérése Hjorth, Kia Nøhr Iversen, and Rikard Landberg. 2023. "Evaluation of Subjective Appetite Assessment under Free-Living vs. Controlled Conditions: A Randomized Crossover Trial Comparing Whole-Grain Rye and Refined Wheat Diets (VASA-Home)" Nutrients 15, no. 11: 2456. https://doi.org/10.3390/nu15112456
APA StyleÅberg, S., Palmnäs-Bédard, M., Karlsson, T., Hjorth, T., Iversen, K. N., & Landberg, R. (2023). Evaluation of Subjective Appetite Assessment under Free-Living vs. Controlled Conditions: A Randomized Crossover Trial Comparing Whole-Grain Rye and Refined Wheat Diets (VASA-Home). Nutrients, 15(11), 2456. https://doi.org/10.3390/nu15112456