

Reliability of Self-Reported Height and Weight in Children: A School-Based Cross-Sectional Study and a Review


Abstract
1. Introduction
2. Materials and Methods
2.1. School-Based Cross-Sectional Study
2.1.1. Data Collection
2.1.2. Data Analysis
2.2. Review
2.2.1. Data Collection
2.2.2. Data Analysis
3. Results
3.1. Cross-Sectional Study
3.1.1. Participant Characteristics
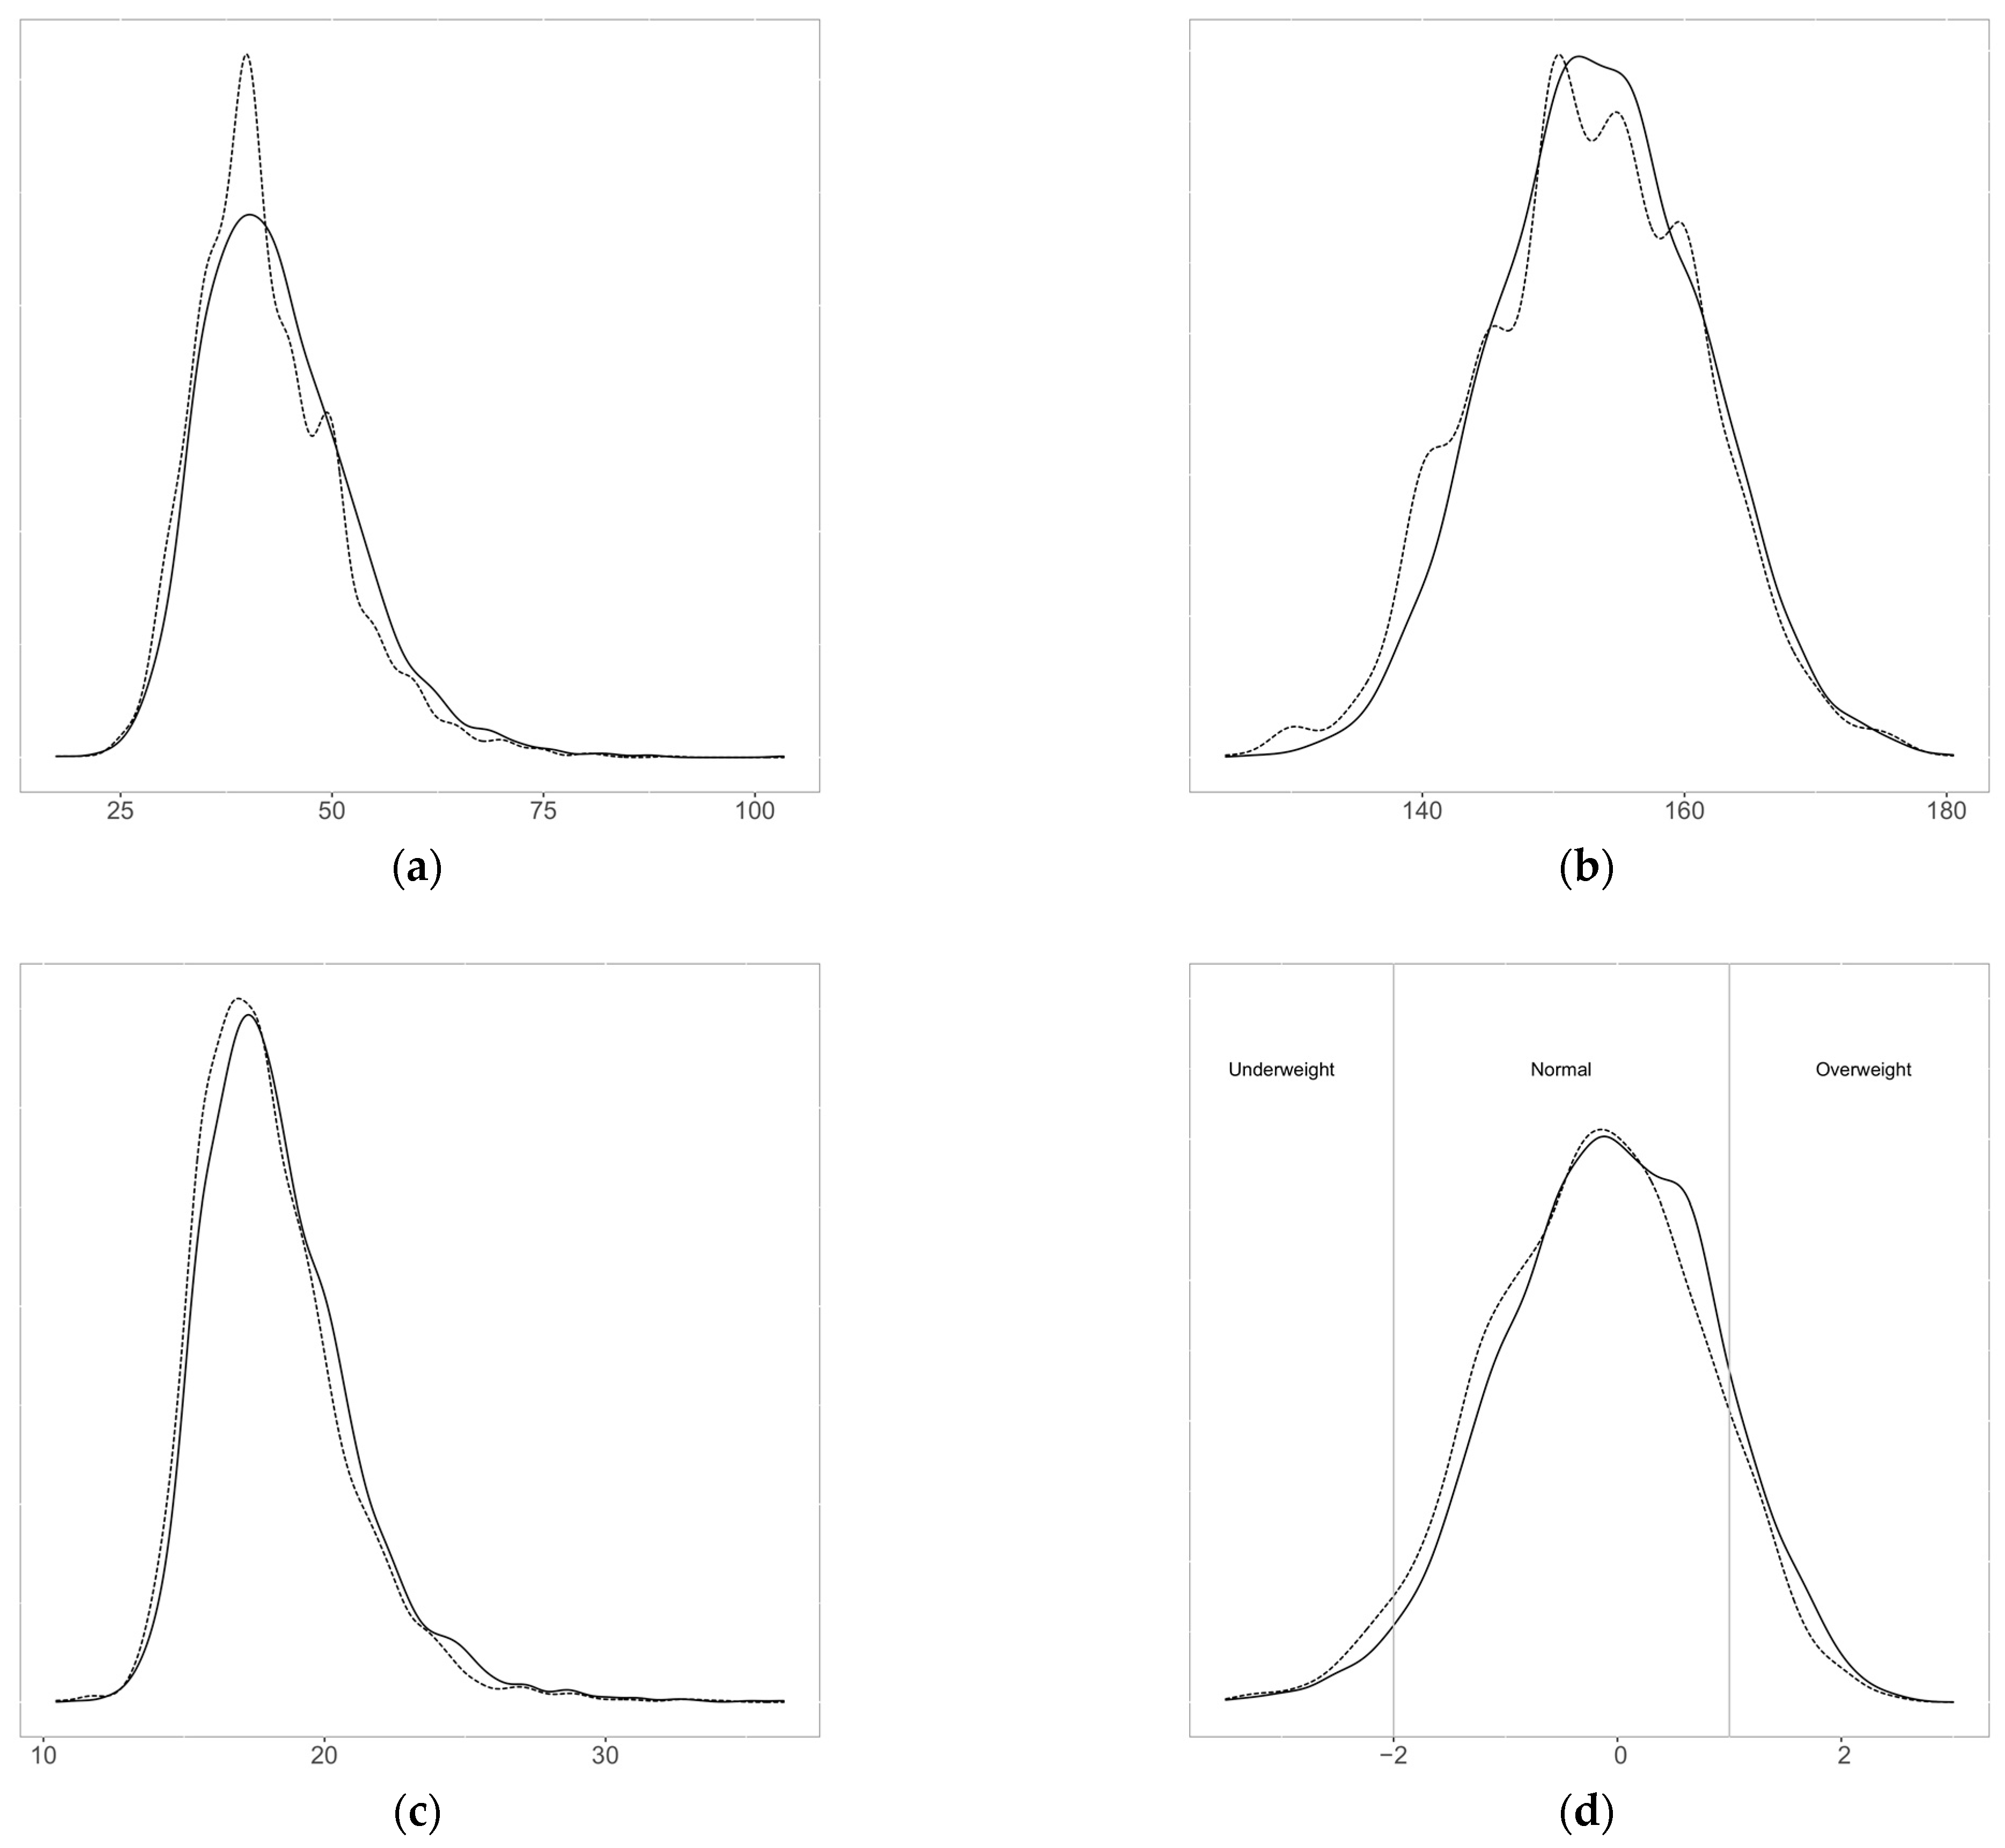
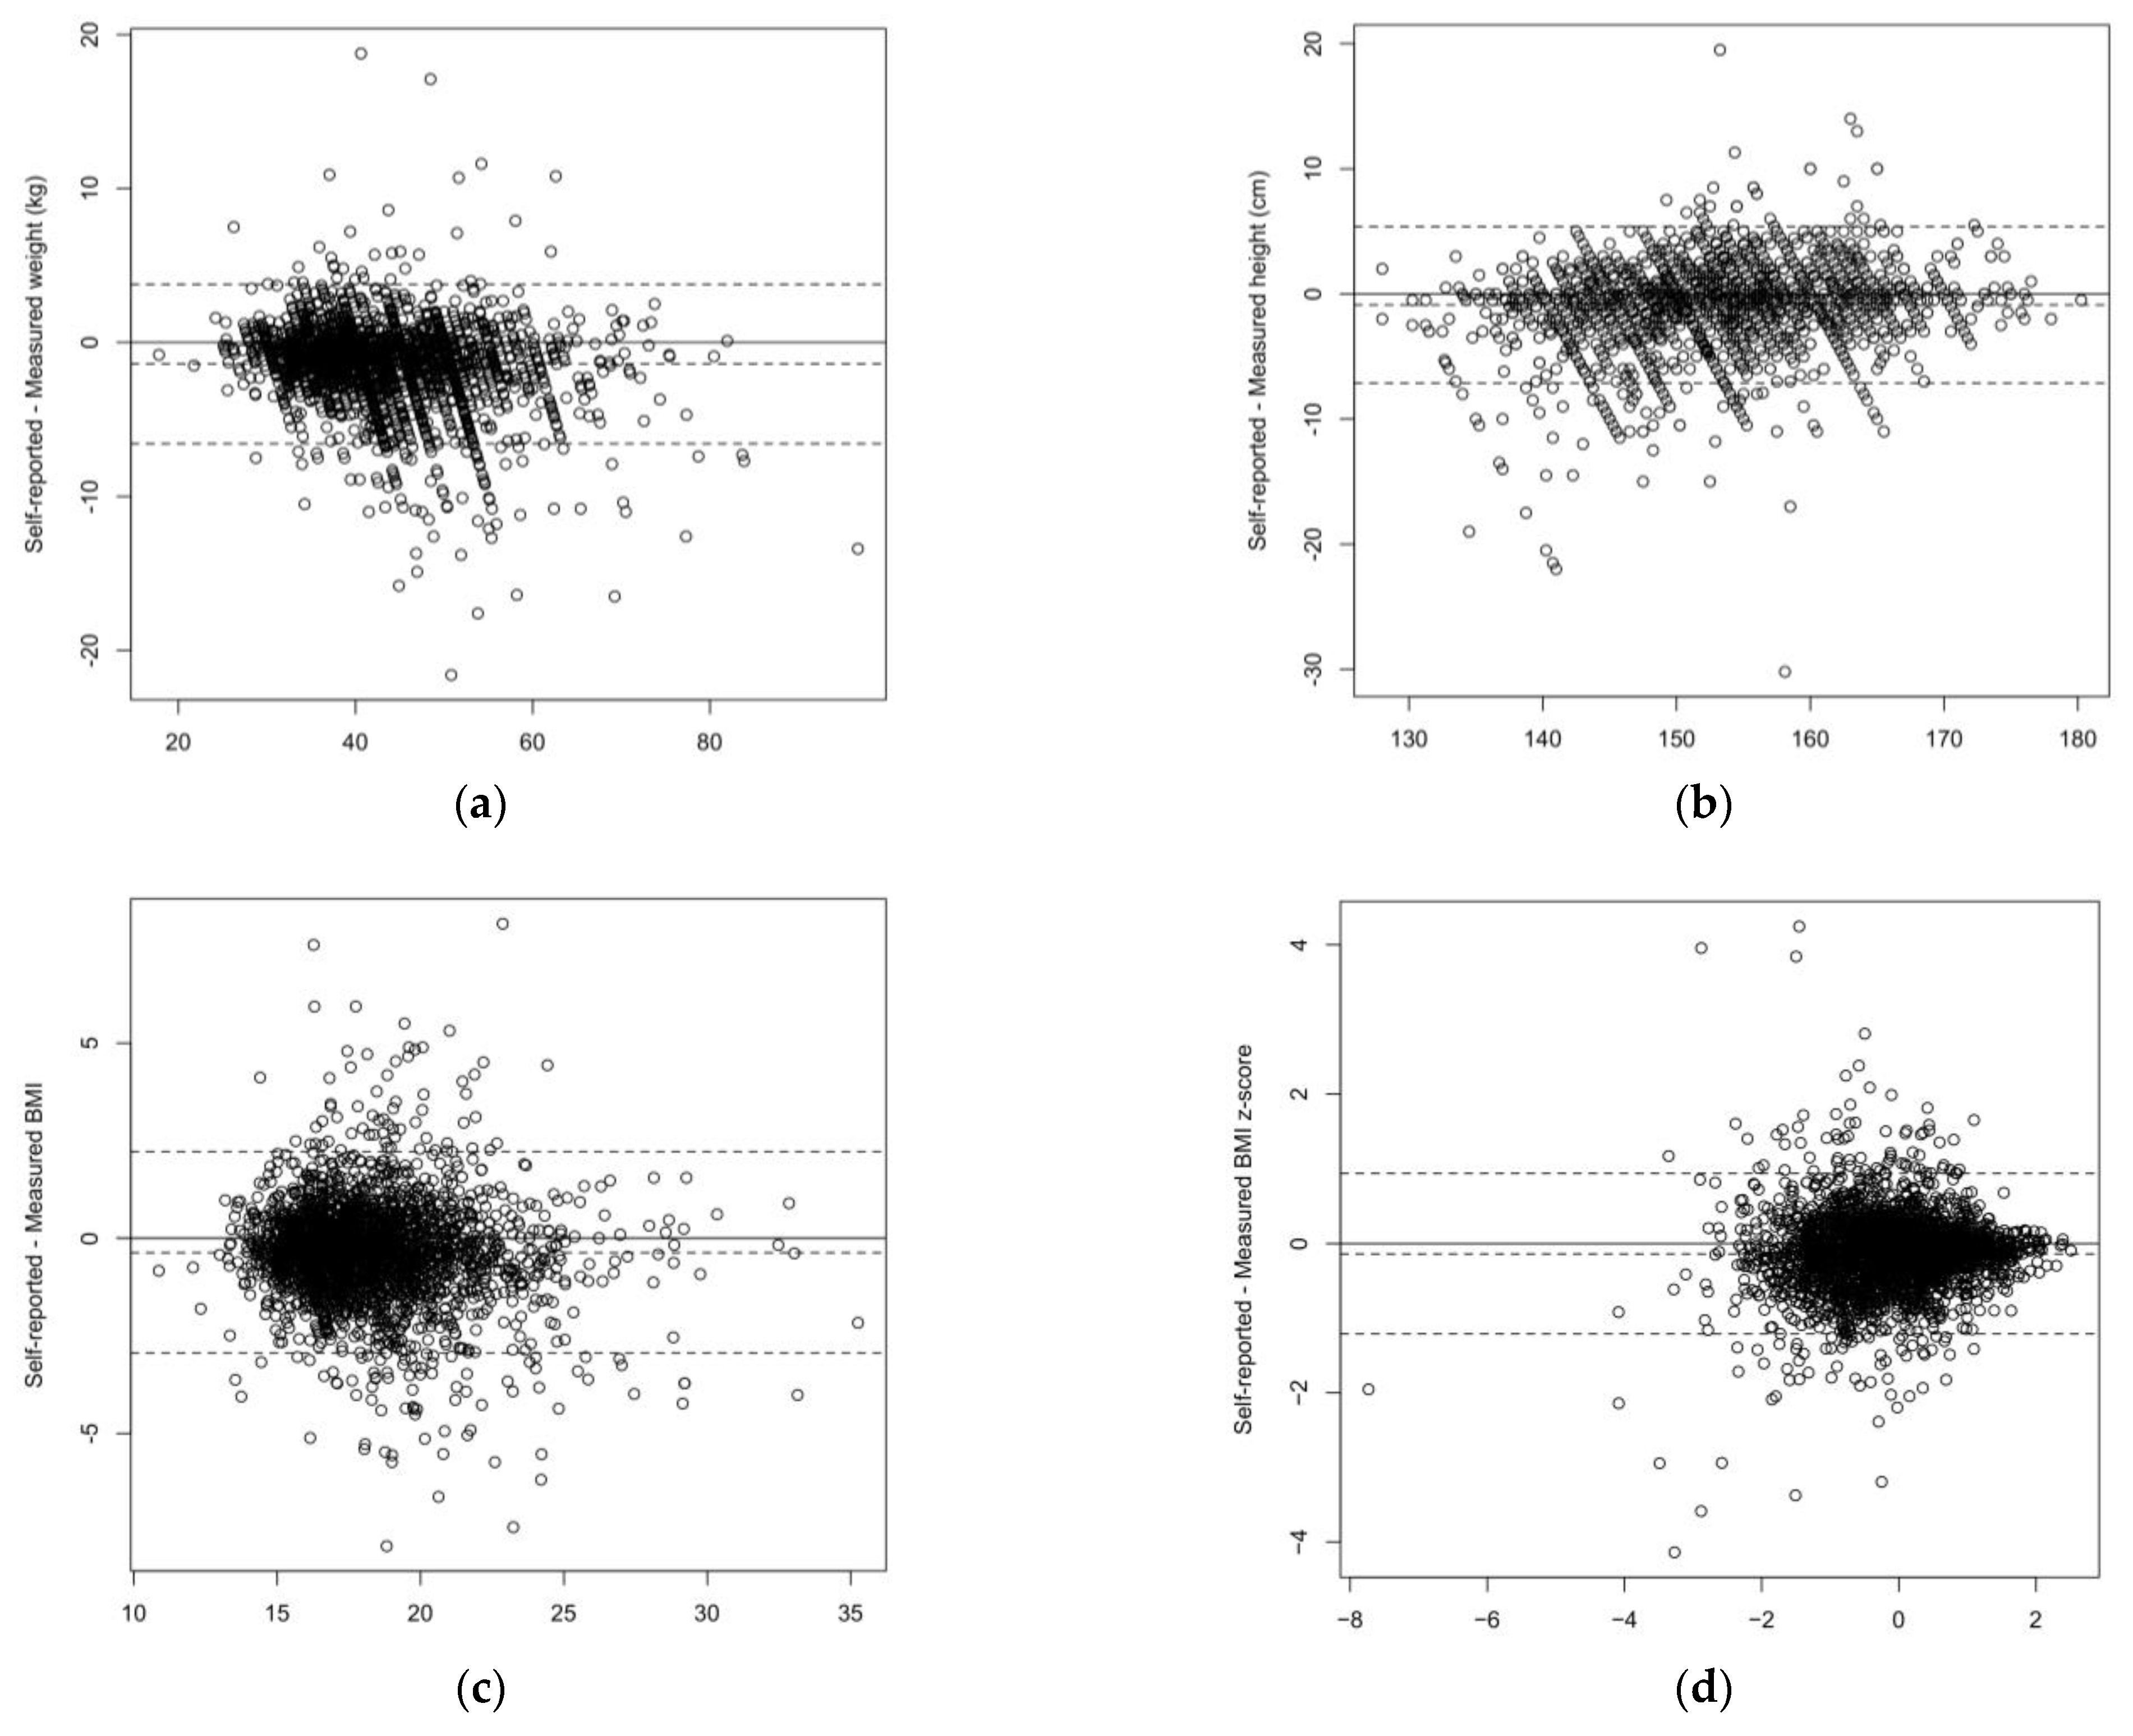
3.1.2. Differences between Self-Reported and Measured Values
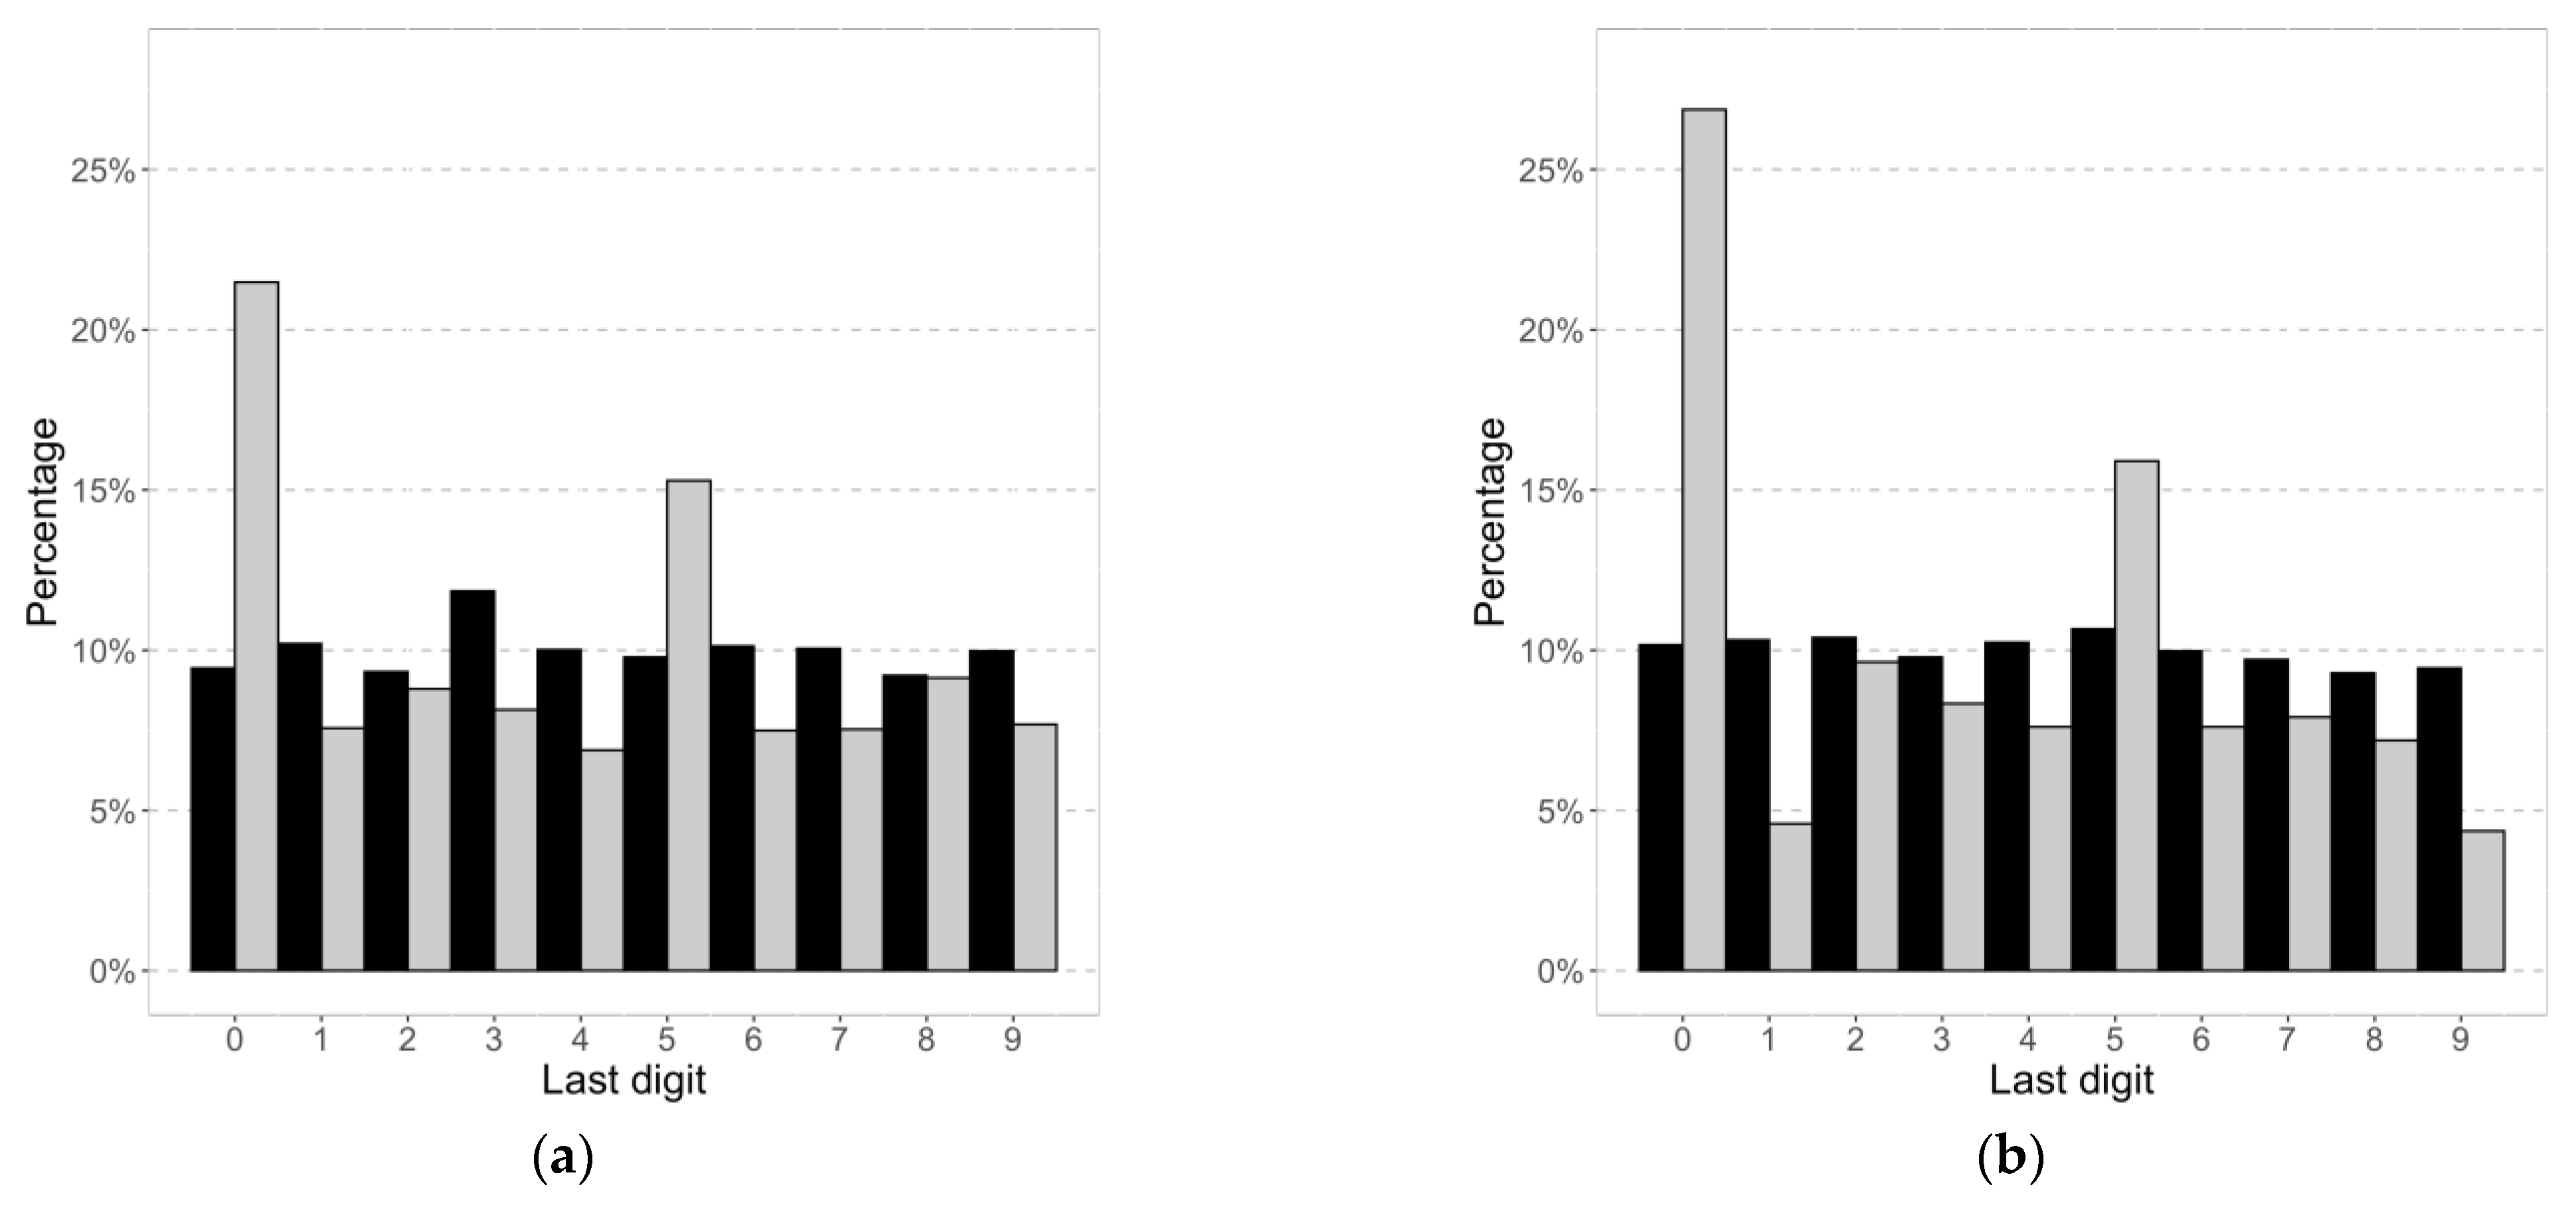
3.1.3. Digit Preferences
3.1.4. Factors Associated with Reporting
3.2. Review
3.2.1. Study Characteristics
3.2.2. Meta-Analysis
4. Discussion
5. Conclusions
Supplementary Materials
Author Contributions
Funding
Institutional Review Board Statement
Informed Consent Statement
Data Availability Statement
Conflicts of Interest
References
- NCD Risk Factor Collaboration (NCD-RisC). Worldwide Trends in Body-Mass Index, Underweight, Overweight, and Obesity from 1975 to 2016: A Pooled Analysis of 2416 Population-Based Measurement Studies in 128·9 Million Children, Adolescents, and Adults. Lancet 2017, 390, 2627–2642. [Google Scholar] [CrossRef] [PubMed]
- Drake, K.M.; Longacre, M.R.; Dalton, M.A.; Langeloh, G.; Peterson, K.E.; Titus, L.J.; Beach, M.L. Two-Method Measurement for Adolescent Obesity Epidemiology: Reducing the Bias in Self-Report of Height and Weight. J. Adolesc. Health 2013, 53, 322–327. [Google Scholar] [CrossRef] [PubMed]
- Rasmussen, M.; Holstein, B.E.; Melkevik, O.; Damsgaard, M.T. Validity of Self-Reported Height and Weight among Adolescents: The Importance of Reporting Capability. BMC Med. Res. Methodol. 2013, 13, 85. [Google Scholar] [CrossRef] [PubMed]
- Gorber, S.C.; Tremblay, M.; Moher, D.; Gorber, B. A Comparison of Direct vs. Self-Report Measures for Assessing Height, Weight and Body Mass Index: A Systematic Review. Obes. Rev. 2007, 8, 307–326. [Google Scholar] [CrossRef] [PubMed]
- Faeh, D.; Marques-Vidal, P.; Chiolero, A.; Bopp, M. Obesity in Switzerland: Do Estimates Depend on How Body Mass Index Has Been Assessed? Swiss Med. Wkly. 2008, 138, 204–210. [Google Scholar] [CrossRef] [PubMed]
- Chiolero, A.; Peytremann-Bridevaux, I.; Paccaud, F. Associations between Obesity and Health Conditions May Be Overestimated If Self-Reported Body Mass Index Is Used. Obes. Rev. 2007, 8, 373–374. [Google Scholar] [CrossRef] [PubMed]
- Flegal, K.M.; Kit, B.K.; Graubard, B.I. Bias in Hazard Ratios Arising From Misclassification According to Self-Reported Weight and Height in Observational Studies of Body Mass Index and Mortality. Am. J. Epidemiol. 2018, 187, 125–134. [Google Scholar] [CrossRef] [PubMed]
- Bopp, M.; Faeh, D. End-Digits Preference for Self-Reported Height Depends on Language. BMC Public Health 2008, 8, 342. [Google Scholar] [CrossRef]
- Dijkshoorn, H.; Ujcic-Voortman, J.K.; Viet, L.; Verhoeff, A.P.; Uitenbroek, D.G. Ethnic Variation in Validity of the Estimated Obesity Prevalence Using Self-Reported Weight and Height Measurements. BMC Public Health 2011, 11, 408. [Google Scholar] [CrossRef]
- Brestoff, J.R.; Perry, I.J.; Van den Broeck, J. Challenging the Role of Social Norms Regarding Body Weight as an Explanation for Weight, Height, and BMI Misreporting Biases: Development and Application of a New Approach to Examining Misreporting and Misclassification Bias in Surveys. BMC Public Health 2011, 11, 331. [Google Scholar] [CrossRef]
- Chiolero, A.; Cachat, F.; Burnier, M.; Paccaud, F.; Bovet, P. Prevalence of Hypertension in Schoolchildren Based on Repeated Measurements and Association with Overweight. J. Hypertens. 2007, 25, 2209–2217. [Google Scholar] [CrossRef] [PubMed]
- Lasserre, A.M.; Chiolero, A.; Cachat, F.; Paccaud, F.; Bovet, P. Overweight in Swiss Children and Associations with Children’s and Parents’ Characteristics. Obesity 2007, 15, 2912–2919. [Google Scholar] [CrossRef] [PubMed]
- WHO Expert Committee (Ed.) Physical Status: The Use and Interpretation of Anthropometry: Report of a WHO Expert Committee; WHO Technical Report Series; World Health Organization: Geneva, Switzerland, 1995; ISBN 978-92-4-120854-3. [Google Scholar]
- Kuczmarski, R.J.; Ogden, C.L.; Guo, S.S.; Grummer-Strawn, L.M.; Flegal, K.M.; Mei, Z.; Wei, R.; Curtin, L.R.; Roche, A.F.; Johnson, C.L. 2000 CDC Growth Charts for the United States: Methods and Development. Vital Health Stat. 11 2002, 1–190. [Google Scholar]
- Flegal, K.M.; Graubard, B.; Ioannidis, J.P.A. Use and Reporting of Bland-Altman Analyses in Studies of Self-Reported versus Measured Weight and Height. Int. J. Obes. 2020, 44, 1311–1318. [Google Scholar] [CrossRef]
- He, J.; Cai, Z.; Fan, X. Accuracy of Using Self-Reported Data to Screen Children and Adolescents for Overweight and Obesity Status: A Diagnostic Meta-Analysis. Obes. Res. Clin. Pract. 2017, 11, 257–267. [Google Scholar] [CrossRef]
- He, J.; Cai, Z.; Fan, X. How Accurate Is the Prevalence of Overweight and Obesity in Children and Adolescents Derived from Self-Reported Data? A Meta-Analysis. Public Health Nutr. 2018, 21, 1865–1873. [Google Scholar] [CrossRef]
- Sherry, B.; Jefferds, M.E.; Grummer-Strawn, L.M. Accuracy of Adolescent Self-Report of Height and Weight in Assessing Overweight Status: A Literature Review. Arch. Pediatr. Adolesc. Med. 2007, 161, 1154–1161. [Google Scholar] [CrossRef]
- Higgins, J.; Green, S. Cochrane Handbook for Systematic Reviews of Interventions; The Cochrane Collaboration: London, UK, 2019. [Google Scholar]
- Aasvee, K.; Rasmussen, M.; Kelly, C.; Kurvinen, E.; Giacchi, M.V.; Ahluwalia, N. Validity of Self-Reported Height and Weight for Estimating Prevalence of Overweight among Estonian Adolescents: The Health Behaviour in School-Aged Children Study. BMC Res. Notes 2015, 8, 606. [Google Scholar] [CrossRef]
- Abalkhail, B.A.; Shawky, S.; Soliman, N.K. Validity of Self-Reported Weight and Height among Saudi School Children and Adolescents. Saudi Med. J. 2002, 23, 831–837. [Google Scholar]
- Abraham, S.; Luscombe, G.; Boyd, C.; Olesen, I. Predictors of the Accuracy of Self-Reported Height and Weight in Adolescent Female School Students. Int. J. Eat. Disord. 2004, 36, 76–82. [Google Scholar] [CrossRef]
- Ambrosi-Randić, N.; Bulian, A.P. Self-Reported versus Measured Weight and Height by Adolescent Girls: A Croatian Sample. Percept. Mot. Skills 2007, 104, 79–82. [Google Scholar] [CrossRef] [PubMed]
- Andersen, L.F.; Lillegaard, I.T.L.; Øverby, N.; Lytle, L.; Klepp, K.-I.; Johansson, L. Overweight and Obesity among Norwegian Schoolchildren: Changes from 1993 to 2000. Scand. J. Public Health 2005, 33, 99–106. [Google Scholar] [CrossRef] [PubMed]
- Bae, J.; Joung, H.; Kim, J.Y.; Kwon, K.N.; Kim, Y.; Park, S.W. Validity of Self-Reported Height, Weight, and Body Mass Index of the Korea Youth Risk Behavior Web-Based Survey Questionnaire. J. Prev. Med. Public Health 2010, 43, 396–402. [Google Scholar] [CrossRef] [PubMed]
- Baile, J.I.; González-Calderón, M.J. Accuracy of body mass index derived from self-reported height and weight in a spanish sample of children. Nutr. Hosp. 2014, 29, 829–831. [Google Scholar] [CrossRef]
- Beck, J.; Schaefer, C.A.; Nace, H.; Steffen, A.D.; Nigg, C.; Brink, L.; Hill, J.O.; Browning, R.C. Accuracy of Self-Reported Height and Weight in Children Aged 6 to 11 Years. Prev. Chronic Dis. 2012, 9, E119. [Google Scholar] [CrossRef][Green Version]
- Béghin, L.; Huybrechts, I.; Ortega, F.B.; Coopman, S.; Manios, Y.; Wijnhoven, T.M.A.; Duhamel, A.; Ciarapica, D.; Gilbert, C.C.; Kafatos, A.; et al. Nutritional and Pubertal Status Influences Accuracy of Self-Reported Weight and Height in Adolescents: The HELENA Study. Ann. Nutr. Metab. 2013, 62, 189–200. [Google Scholar] [CrossRef]
- Berg, I.M.; Simonsson, B.; Brantefor, B.; Ringqvist, I. Prevalence of Overweight and Obesity in Children and Adolescents in a County in Sweden. Acta Paediatr. 2001, 90, 671–676. [Google Scholar] [CrossRef]
- Brault, M.-C.; Turcotte, O.; Aimé, A.; Côté, M.; Bégin, C. Body Mass Index Accuracy in Preadolescents: Can We Trust Self-Report or Should We Seek Parent Report? J. Pediatr. 2015, 167, 366–371. [Google Scholar] [CrossRef]
- Brener, N.D.; Mcmanus, T.; Galuska, D.A.; Lowry, R.; Wechsler, H. Reliability and Validity of Self-Reported Height and Weight among High School Students. J Adolesc. Health 2003, 32, 281–287. [Google Scholar] [CrossRef]
- Brettschneider, A.-K.; Schaffrath Rosario, A.; Wiegand, S.; Kollock, M.; Ellert, U. Development and Validation of Correction Formulas for Self-Reported Height and Weight to Estimate BMI in Adolescents. Results from the KiGGS Study. Obes. Facts 2015, 8, 30–42. [Google Scholar] [CrossRef]
- Brooks-Gunn, J.; Warren, M.P.; Rosso, J.; Gargiulo, J. Validity of Self-Report Measures of Girls’ Pubertal Status. Child Dev. 1987, 58, 829. [Google Scholar] [CrossRef] [PubMed]
- Buttenheim, A.M.; Goldman, N.; Pebley, A.R. Underestimation of Adolescent Obesity. Nurs. Res. 2013, 62, 195–202. [Google Scholar] [CrossRef] [PubMed]
- Chan, N.P.T.; Choi, K.C.; Nelson, E.A.S.; Sung, R.Y.T.; Chan, J.C.N.; Kong, A.P.S. Self-Reported Body Weight and Height: An Assessment Tool for Identifying Children with Overweight/Obesity Status and Cardiometabolic Risk Factors Clustering. Matern. Child Health J. 2013, 17, 282–291. [Google Scholar] [CrossRef] [PubMed]
- Charalampos, H.; Michael, T.; Antonia, S.; Savva, S.; Antonis, K. Validity of Self-Reported Height, Weight and Body Mass Index among Cypriot Adolescents: Accuracy in Assessing Overweight Status and Weight Overestimation as Predictor of Disordered Eating Behaviour. Mediterr. J. Soc. Sci. 2012, 3, 209–217. [Google Scholar] [CrossRef]
- Chau, N.; Chau, K.; Mayet, A.; Baumann, M.; Legleye, S.; Falissard, B. Self-Reporting and Measurement of Body Mass Index in Adolescents: Refusals and Validity, and the Possible Role of Socioeconomic and Health-Related Factors. BMC Public Health 2013, 13, 815. [Google Scholar] [CrossRef]
- Clarke, P.; Sastry, N.; Duffy, D.; Ailshire, J. Accuracy of Self-Reported versus Measured Weight over Adolescence and Young Adulthood: Findings from the National Longitudinal Study of Adolescent Health, 1996–2008. Am. J. Epidemiol. 2014, 180, 153–159. [Google Scholar] [CrossRef][Green Version]
- Dalton, W.T.; Wang, L.; Southerland, J.L.; Schetzina, K.E.; Slawson, D.L. Self-Reported Versus Actual Weight and Height Data Contribute to Different Weight Misperception Classifications. South. Med. J. 2014, 107, 348–355. [Google Scholar] [CrossRef]
- Davis, H.; Gergen, P.J. The Weights and Heights of Mexican-American Adolescents: The Accuracy of Self-Reports. Am. J. Public Health 1994, 84, 459–462. [Google Scholar] [CrossRef][Green Version]
- De Vriendt, T.; Huybrechts, I.; Ottevaere, C.; Van Trimpont, I.; De Henauw, S. Validity of Self-Reported Weight and Height of Adolescents, Its Impact on Classification into BMI-Categories and the Association with Weighing Behaviour. Int. J. Environ. Res. Public Health 2009, 6, 2696–2711. [Google Scholar] [CrossRef]
- Domingues, A.P.; Silva, A.M.; de Matos, M.M.N.G.; Calmeiro, L. Accuracy of Self-Reported Measures of Height and Weight in Children and Adolescents. Rev. Psicol. Criança Adolesc. 2011, 2, 41–51. [Google Scholar]
- Ekström, S.; Kull, I.; Nilsson, S.; Bergström, A. Web-Based Self-Reported Height, Weight, and Body Mass Index among Swedish Adolescents: A Validation Study. J. Med. Internet Res. 2015, 17, e73. [Google Scholar] [CrossRef] [PubMed]
- Elgar, F.J.; Roberts, C.; Tudor-Smith, C.; Moore, L. Validity of Self-Reported Height and Weight and Predictors of Bias in Adolescents. J. Adolesc. Health 2005, 37, 371–375. [Google Scholar] [CrossRef]
- Enes, C.C.; Fernandez, P.M.F.; Voci, S.M.; Toral, N.; Romero, A.; Slater, B. Validity and Reliability of Self-Reported Weight and Height Measures for the Diagnoses of Adolescent’s Nutritional Status. Rev. Bras. Epidemiol. 2009, 12, 627–635. [Google Scholar] [CrossRef]
- Farré Rovira, R.; Frasquet Pons, I.; Martínez Martínez, M.I.; Romá Sánchez, R. Self-Reported versus Measured Height, Weight and Body Mass Index in Spanish Mediterranean Teenagers: Effects of Gender, Age and Weight on Perceptual Measures of Body Image. Ann. Nutr. Metab. 2002, 46, 68–72. [Google Scholar] [CrossRef] [PubMed]
- Fonseca, H.; Silva, A.M.; Matos, M.G.; Esteves, I.; Costa, P.; Guerra, A.; Gomes-Pedro, J. Validity of BMI Based on Self-Reported Weight and Height in Adolescents. Acta Paediatr. 2010, 99, 83–88. [Google Scholar] [CrossRef]
- Fortenberry, J.D. Reliability of Adolescents’ Reports of Height and Weight. J. Adolesc. Health 1992, 13, 114–117. [Google Scholar] [CrossRef]
- Frayon, S.; Cavaloc, Y.; Wattelez, G.; Cherrier, S.; Lerrant, Y.; Galy, O. Self-Reported Height and Weight in Oceanian School-Going Adolescents and Factors Associated With Errors. Asia Pac. J. Public Health 2017, 29, 526–536. [Google Scholar] [CrossRef]
- Ghosh-Dastidar, M.B.; Haas, A.C.; Nicosia, N.; Datar, A. Accuracy of BMI Correction Using Multiple Reports in Children. BMC Obes. 2016, 3, 37. [Google Scholar] [CrossRef]
- Giacchi, M.; Mattei, R.; Rossi, S. Correction of the Self-Reported BMI in a Teenage Population. Int. J. Obes. Relat. Metab. Disord. 1998, 22, 673–677. [Google Scholar] [CrossRef]
- Goodman, E.; Hinden, B.R.; Khandelwal, S. Accuracy of Teen and Parental Reports of Obesity and Body Mass Index. Pediatrics 2000, 106, 52–58. [Google Scholar] [CrossRef]
- Hauck, F.R.; White, L.; Cao, G.; Woolf, N.; Strauss, K. Inaccuracy of Self-Reported Weights and Heights among American Indian Adolescents. Ann. Epidemiol. 1995, 5, 386–392. [Google Scholar] [CrossRef] [PubMed]
- Himes, J.H.; Story, M. Validity of Self-Reported Weight and Stature of American Indian Youth. J. Adolesc. Health 1992, 13, 118–120. [Google Scholar] [CrossRef] [PubMed]
- Himes, J.H.; Faricy, A. Validity and Reliability of Self-Reported Stature and Weight of US Adolescents. Am. J. Hum. Biol. 2001, 13, 255–260. [Google Scholar] [CrossRef] [PubMed]
- Himes, J.H.; Hannan, P.; Wall, M.; Neumark-Sztainer, D. Factors Associated with Errors in Self-Reports of Stature, Weight, and Body Mass Index in Minnesota Adolescents. Ann. Epidemiol. 2005, 15, 272–278. [Google Scholar] [CrossRef]
- Jansen, W.; van de Looij-Jansen, P.M.; Ferreira, I.; de Wilde, E.J.; Brug, J. Differences in Measured and Self-Reported Height and Weight in Dutch Adolescents. Ann. Nutr. Metab. 2006, 50, 339–346. [Google Scholar] [CrossRef]
- Jayawardene, W.; Lohrmann, D.; YoussefAgha, A. Discrepant Body Mass Index: Behaviors Associated with Height and Weight Misreporting among US Adolescents from the National Youth Physical Activity and Nutrition Study. Child Obes. 2014, 10, 225–233. [Google Scholar] [CrossRef]
- Kee, C.C.; Lim, K.H.; Sumarni, M.G.; Teh, C.H.; Chan, Y.Y.; Nuur Hafizah, M.I.; Cheah, Y.K.; Tee, E.O.; Ahmad Faudzi, Y.; Amal Nasir, M. Validity of Self-Reported Weight and Height: A Cross-Sectional Study among Malaysian Adolescents. BMC Med. Res. Methodol. 2017, 17, 85. [Google Scholar] [CrossRef]
- Kurth, B.-M.; Ellert, U. Estimated and Measured BMI and Self-Perceived Body Image of Adolescents in Germany: Part 1—General Implications for Correcting Prevalence Estimations of Overweight and Obesity. Obes. Facts 2010, 3, 181–190. [Google Scholar] [CrossRef]
- Lee, K.; Valeria, B.; Kochman, C.; Lenders, C.M. Self-Assessment of Height, Weight, and Sexual Maturation: Validity in Overweight Children and Adolescents. J. Adolesc. Health 2006, 39, 346–352. [Google Scholar] [CrossRef]
- Lee, B.; Chung, S.-J.; Lee, S.-K.; Yoon, J. Validation of Self-Reported Height and Weight in Fifth-Grade Korean Children. Nutr. Res. Pract. 2013, 7, 326–329. [Google Scholar] [CrossRef][Green Version]
- Legleye, S.; Beck, F.; Spilka, S.; Chau, N. Correction of Body-Mass Index Using Body-Shape Perception and Socioeconomic Status in Adolescent Self-Report Surveys. PLoS ONE 2014, 9, e96768. [Google Scholar] [CrossRef] [PubMed]
- Linhart, Y.; Romano-Zelekha, O.; Shohat, T. Validity of Self-Reported Weight and Height among 13–14 Year Old Schoolchildren in Israel. Isr. Med. Assoc. J. 2010, 12, 603–605. [Google Scholar] [PubMed]
- Morrissey, S.L.; Whetstone, L.M.; Cummings, D.M.; Owen, L.J. Comparison of Self-Reported and Measured Height and Weight in Eighth-Grade Students. J. Sch. Health 2006, 76, 512–515. [Google Scholar] [CrossRef] [PubMed]
- Ohlmer, R.; Jacobi, C.; Fittig, E. Diagnosing Underweight in Adolescent Girls: Should We Rely on Self-Reported Height and Weight? Eat. Behav. 2012, 13, 1–4. [Google Scholar] [CrossRef] [PubMed]
- Pérez, A.; Gabriel, K.P.; Nehme, E.K.; Mandell, D.J.; Hoelscher, D.M. Measuring the Bias, Precision, Accuracy, and Validity of Self-Reported Height and Weight in Assessing Overweight and Obesity Status among Adolescents Using a Surveillance System. Int. J. Behav. Nutr. Phys. Act. 2015, 12, S2. [Google Scholar] [CrossRef]
- Rasmussen, F.; Eriksson, M.; Nordquist, T. Bias in Height and Weight Reported by Swedish Adolescents and Relations to Body Dissatisfaction: The COMPASS Study. Eur. J. Clin. Nutr. 2007, 61, 870–876. [Google Scholar] [CrossRef][Green Version]
- Robinson, L.E.; Suminski, R. Accuracy of Self-Reported Height and Weight in Low-Income, Rural African American Children. J. Child Adolesc. Behav. 2014, 2, 1–5. [Google Scholar] [CrossRef]
- Rodrigues, P.R.M.; Gonçalves-Silva, R.M.V.; Pereira, R.A. Validity of Self-Reported Weight and Stature in Adolescents from Cuiabá, Central-Western Brazil. Rev. Nutr. 2013, 26, 283–290. [Google Scholar] [CrossRef][Green Version]
- Seghers, J.; Claessens, A.L. Bias in Self-Reported Height and Weight in Preadolescents. J. Pediatr. 2010, 157, 911–916. [Google Scholar] [CrossRef]
- Štefan, L.; Baić, M.; Pekas, D. Validity of Measured vs. Self-Reported Height, Weight and Body-Mass Index in Urban Croatian Adolescents. Int. J. Sport Stud. Health, 2019; 2, e89627. [Google Scholar] [CrossRef]
- Strauss, R.S. Comparison of Measured and Self-Reported Weight and Height in a Cross-Sectional Sample of Young Adolescents. Int. J. Obes. Relat. Metab. Disord. 1999, 23, 904–908. [Google Scholar] [CrossRef]
- Tienboon, P.; Wahlqvist, M.L.; Rutishauser, I.H. Self-Reported Weight and Height in Adolescents and Their Parents. J. Adolesc. Health 1992, 13, 528–532. [Google Scholar] [CrossRef] [PubMed]
- Tokmakidis, S.P.; Christodoulos, A.D.; Mantzouranis, N.I. Validity of Self-Reported Anthropometric Values Used to Assess Body Mass Index and Estimate Obesity in Greek School Children. J. Adolesc. Health 2007, 40, 305–310. [Google Scholar] [CrossRef] [PubMed]
- Tsigilis, N. Can Secondary School Students’ Self-Reported Measures of Height and Weight Be Trusted? An Effect Size Approach. Eur. J. Public Health 2006, 16, 532–535. [Google Scholar] [CrossRef] [PubMed]
- Wang, Z.; Patterson, C.M.; Hills, A.P. A Comparison of Self-Reported and Measured Height, Weight and BMI in Australian Adolescents. Aust. N. Z. J. Public Health 2002, 26, 473–478. [Google Scholar] [CrossRef]
- Yoshitake, N.; Okuda, M.; Sasaki, S.; Kunitsugu, I.; Hobara, T. Validity of Self-Reported Body Mass Index of Japanese Children and Adolescents. Pediatr. Int. 2012, 54, 397–401. [Google Scholar] [CrossRef]
- Zhou, X.; Dibley, M.J.; Cheng, Y.; Ouyang, X.; Yan, H. Validity of Self-Reported Weight, Height and Resultant Body Mass Index in Chinese Adolescents and Factors Associated with Errors in Self-Reports. BMC Public Health 2010, 10, 190. [Google Scholar] [CrossRef]


| Variable | Group | Mean ± SD (Range) or Percentage (n) |
|---|---|---|
| Age (years) | All | 12.2 ± 0.5 (10.2–14.8) |
| Sex | Female | 47.5% (1243) |
| Physical activity | Never | 4.2% (110) |
| A few times per month | 8.0% (210) | |
| 1–2× per week | 37.8% (962) | |
| 3–4× per week | 27.6% (722) | |
| 5–6× per week | 10.0% (261) | |
| Daily | 13.1% (344) | |
| Missing | 0.3% (7) | |
| TV viewing during week | Never | 15% (390) |
| <15 min per day | 15% (401) | |
| 15–30 min per day | 25% (652) | |
| 30–60 min per day | 26% (670) | |
| 1–2 h per day | 14% (360) | |
| >2 h per day | 5% (119) | |
| Missing | 1% (24) | |
| Nationality | Swiss | 79% (1846) |
| Other | 22% (568) | |
| Missing | 8% (202) | |
| Highest parental education | University | 32% (828) |
| High school baccalaureate | 14% (368) | |
| Apprenticeship | 34% (895) | |
| Primary/secondary school | 10% (263) | |
| Other/missing | 10% (260) | |
| Parental BMI (kg/m2) | Mother | 22.9 ± 3.6 (14.5–44.98) |
| Father | 25.4 ± 3.2 (14.6–42.9) |
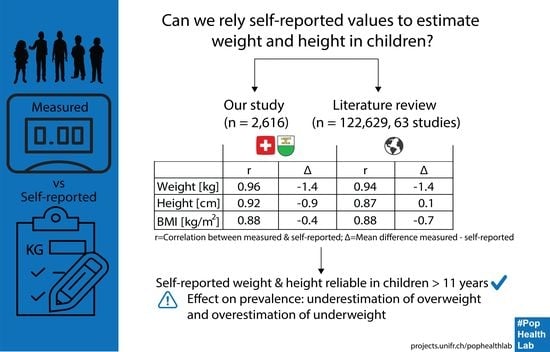
| Measures | Self-Reported (Mean ± SD) | Measured (Mean ± SD) | Mean Difference * (Mean (95% CI)) | Pearson’s r Correlation | Intra-Class Correlation |
|---|---|---|---|---|---|
| Weight (kg) | 42.3 ± 8.4 | 43.7 ± 9.0 | −1.4 (−1.5, −1.3) | 0.96 | 0.94 |
| Height (cm) | 152.7 ± 8.4 | 153.5 ± 7.8 | −0.9 (−1.0, −0.8) | 0.92 | 0.92 |
| BMI (kg/m2) | 18.07 ± 2.63 | 18.43 ± 2.76 | −0.36 (−0.41, −0.31) | 0.88 | 0.87 |
| BMI z-score | −0.23 ± 0.99 | −0.09 ± 0.96 | −0.14 (−0.16, −0.12) | 0.84 | 0.83 |
| Variable | Group | Weight (kg) | Height (cm) |
|---|---|---|---|
| Sex | Boys | −1.3 (−1.5, −1.2) | −0.9 (−1.1, −0.7) |
| Girls | −1.5 (−1.6, −1.4) | −0.9 (−1.0, −0.7) | |
| BMI category | Underweight | 0.8 (−0.1, 1.6) | −1.2 (−2.0, −0.4) |
| Normal | −1.2 (−3.2, −1.1) | −0.9 (−1.1, −0.8) | |
| Overweight | −3.2 (−3.7, −2.9) | −0.3 (−0.7, 0.0) |
| Study ID | Country | Sample Size | Sex | Age (Years) Mean ± SD (Range) | Participants Aware of Upcoming Measurement | Time between Self-Reported and Measured Values | No Self-Reported Data | Collection of Self-Reported Values |
|---|---|---|---|---|---|---|---|---|
| Aasvee 2015 [20] | Estonia | 3379 | Both | 11, 13, 15 | Yes | Same day | 19% | Paper questionnaire |
| Abalkhail 2002 [21] | Saudi Arabia | 2860 | Both | 14 ± 3 (9–21) | Unclear | Same day | 59% | In-person interview |
| Abraham 2004 [22] | Australia | 683 | Female | 15 + 2 (11–18) | Unclear | Same day | Unclear | Paper questionnaire |
| Ambrosi-Randic 2007 [23] | Croatia | 234 | Female | (10–18) | Unclear | Same day | Unclear | In-person interview |
| Andersen 2005 [24] | Norway | 159 | Both | 8, 12 | Unclear | 3 d | 3% | Paper questionnaire |
| Bae 2010 [25] | South Korea | 379 | Both | (8–16) | Yes | Unclear | Unclear | Online questionnaire |
| Baile 2014 [26] | Spain | 171 | Both | (10–11) | Unclear | Same day | Unclear | Paper questionnaire |
| Beck 2012 [27] | United States | 487 | Both | (6–7, 8–9, 10–11) | Unclear | Unclear | Unclear | In-person interview |
| Beghin 2013 [28] | Europe | 3865 | Both | (12.5–17.5) | Unclear | Same day | 5–23% | Paper questionnaire |
| Berg 2001 [29] | Sweden | 628 | Both | 9, 12, 15, 18 | Unclear | Same day | Unclear | Paper questionnaire |
| Brault 2015 [30] | Canada | 875 | Both | (8–12) | Unclear | Unclear | Unclear | Paper questionnaire |
| Brener 2003 [31] | United States | 2032 | Both | (14–18) | Unclear | 0–2 d | 23% | Paper questionnaire |
| Brettschneider 2015 [32] | Germany | 3468 | Both | (11–17) | Yes | Same day | 80% | In-person interview |
| Brooks-Gunn 1987 [33] | United States | 151 | Female | (11–13) | Unclear | Same day | Unclear | Paper questionnaire |
| Buttenheim 2013 [34] | United States | 613 | Both | (12–17) | Unclear | Unclear | 6–23% | Online questionnaire |
| Chan 2013 [35] | China | 1614 | Both | (6–18) | Yes | 1–2 weeks | 21% | Paper questionnaire |
| Charalampos 2009 [36] | Cyprus | 579 | Both | 15 ± 2 | Unclear | Same day | Unclear | Paper questionnaire |
| Chau 2013 [37] | France | 1559 | Both | 13 ± 1 (9–18) | Yes | Same day | 4–8% | Paper questionnaire |
| Clarke 2014 [38] | United States | 19,238 | Both | 13 | Yes | Same day | Unclear | Paper questionnaire |
| Dalton 2014 [39] | United States | 1243 | Both | 15 ± 1 (14–18) | Unclear | Unclear | 18% | In-person interview |
| Davis 1994 [40] | United States | 829 | Both | (12–19) | Unclear | A few weeks | Unclear | Phone interview |
| De Vriendt 2009 [41] | Belgium | 982 | Both | 14 ±1 (10–18) | No | Same day | 1% | Paper questionnaire |
| Domingues 2011 [42] | Portugal | 719 | Both | 14 (10–19) | No | Same day | 1% | Paper questionnaire |
| Drake 2013 [2] | United States | 407 | Both | (12–18) | No | Unclear | 75% | Phone interview |
| Ekström 2015 [43] | Sweden | 1698 | Both | 16.5 ± 0.3 | No | 4 weeks | 56% | Online questionnaire |
| Elgar 2005 [44] | Canada | 395 | Both | 16 (15–17) | No | Same day | 6% | Paper questionnaire |
| Enes 2009 [45] | Brazil | 360 | Both | (10–14) | No | Same day | 14% | In-person interview |
| Farre Rovira 2002 [46] | Spain | 568 | Both | (14–20) | Yes | Same day | Unclear | Paper questionnaire |
| Fonseca 2010 [47] | Portugal | 462 | Both | 14 ± 2 (12–16) | Unclear | Same day | 0% | Paper questionnaire |
| Fortenberry 1992 [48] | United States | 725 | Both | 17 (14–20) | Unclear | Same day | 4% | Paper questionnaire |
| Frayon 2017 [49] | New Caledonia | 665 | Both | 14 ± 1 (10–17) | Unclear | maximum 2 d | 3–6% | Online questionnaire |
| Ghosh-Dastidar 2016 [50] | United States | 475 | Both | 13 ± 1 | Unclear | 1 month | 74% | Online questionnaire |
| Giacchi 1998 [51] | Italy | 133 | Both | (15–17) | Unclear | 1 week | 7% | Paper questionnaire |
| Goodman 2000 [52] | United States | 11,495 | Both | (12–18) | Unclear | Unclear | 47% | In-person interview |
| Hauck 1995 [53] | United States | 619 | Both | 15 ± 2 (12–19) | Unclear | 1–7 d | 28% | Paper questionnaire |
| Himes 1992 [54] | United States | 69 | Both | 15 (12–19) | No | Unclear | Unclear | Paper questionnaire |
| Himes 2001 [55] | United States | 1635 | Both | (12–16) | Yes | Same day | 4–16% | Paper questionnaire |
| Himes 2005 [56] | United States | 3797 | Both | 15 ± 2 (12–18) | Unclear | Same or next day | 4–5% | Paper questionnaire |
| Jansen 2006 [57] | Netherlands | 499 | Both | (12–14) | No | 3 months | 30% | Paper questionnaire |
| Jayawardene 2014 [58] | United States | 7160 | Both | (14–17) | Unclear | Unclear | 31% | Paper questionnaire |
| Kee 2017 [59] | Malaysia | 663 | Both | (13–17) | No | Max 6 months | 5% | Paper questionnaire |
| Kurth 2010 [60] | Germany | 3436 | Both | (11–17) | Unclear | Same day | Unclear | In-person interview |
| Lee 2006 [61] | United States | 71 | Both | 13 ± 3 (8–18) | Unclear | Same day | Unclear | Paper questionnaire |
| Lee 2013 [62] | South Korea | 422 | Both | 11 ± 1 | Unclear | Unclear | Unclear | Paper questionnaire |
| Legleye 2014 [63] | France | 303 | Both | (17–18) | No | Same day | 11% | Paper questionnaire |
| Linhart 2010 [64] | Israel | 517 | Both | (13–14) | Unclear | Unclear | 44% | Paper questionnaire |
| Morrissey 2006 [65] | United States | 416 | Both | (10–16) | Yes | Same day | 26% | Paper questionnaire |
| Ohlmer 2012 [66] | Germany | 162 | Female | 14 ± 1 (12–16) | Unclear | Same day | Unclear | Paper questionnaire |
| Perez 2015 [67] | United States | 24,221 | Both | 13.7, 16.7 | Unclear | Unclear | Unclear | Paper questionnaire |
| Rasmussen 2007 [68] | Sweden | 2726 | Both | 15 | Unclear | Up to 1 month | 11% | Paper questionnaire |
| Rasmussen 2013 [3] | Denmark | 2100 | Both | 11, 13, 15 | Unclear | 1–3 weeks | 11% | Paper questionnaire |
| Robinson 2014 [69] | United States | 92 | Both | 10 ± 1 | Unclear | Next day | Unclear | Paper questionnaire |
| Rodrigues 2013 [70] | Brazil | 97 | Both | 16 ± 1 (14–19) | Unclear | Same day | Unclear | In-person interview |
| Seghers 2010 [71] | Belgium | 789 | Both | 9 ± 1 (8–11) | Unclear | Same day | 22% | Paper questionnaire |
| Stefan 2019 [72] | Croatia | 286 | Both | 16 ± 1 | Yes | Same day | Unclear | Paper questionnaire |
| Strauss 1999 [73] | United States | 1932 | Both | (12–16) | Yes | Same day | 14% | In-person interview |
| Tienboon 1992 [74] | Australia | 204 | Both | (14–15) | No | Same day | Unclear | Paper questionnaire |
| Tokmakidis 2007 [75] | Greece | 676 | Both | 11, 12 | No | Next day | Unclear | Paper questionnaire |
| Tsigilis 2006 [76] | Greece | 300 | Both | 16 ± 1 | No | Next day | Unclear | Paper questionnaire |
| Wang 2002 [77] | Australia | 572 | Both | (15–19) | No | A few weeks | Unclear | Paper questionnaire |
| Yoshitake 2012 [78] | Japan | 358 | Both | 10–11, 13–14 | Unclear | Same day | Unclear | Paper questionnaire |
| Zhou 2010 [79] | China | 1761 | Both | (12–16) | No | 1 week | 2% | Paper questionnaire |
| Current study | Switzerland | 2616 | Both | 12 ± 1 (10–14) | Yes | Same day | 38% | Paper questionnaire |
| Pearson’s Correlation | Mean Difference | |||||||||||
|---|---|---|---|---|---|---|---|---|---|---|---|---|
| Sub-Groups | Weight (kg) | p | Height (cm) | p | BMI (kg/m2) | p | Weight (kg) | p | Height (cm) | p | BMI (kg/m2) | p |
| All | 0.94 (0.94, 0.95) | 0.87 (0.86, 0.89) | 0.88 (0.87, 0.89) | −1.4 (−1.5, −1.2) | 0.1 (0.0, 0.1) | −0.7 (−1.0, −0.3) | ||||||
| Sex | ||||||||||||
| Boys | 0.95 (0.94, 0.96) | 0.908 | 0.91 (0.89, 0.92) | 0.031 | 0.89 (0.87, 0.90) | 0.394 | −1.2 (−1.5, −1.0) | 0.113 | −0.4 (−0.5, −0.2) | <0.001 | −0.5 (−0.6, −0.4) | 0.038 |
| Girls | 0.95 (0.94, 0.96) | 0.88 (0.86, 0.90) | 0.90 (0.88, 0.91) | −1.5 (−1.7, −1.3) | 0.0 (−0.1, 0.1) | −0.6 (−0.7, −0.5) | ||||||
| Age | ||||||||||||
| 6–11 years | 0.94 (0.92, 0.96) | 0.909 | 0.84 (0.79, 0.88) | <0.001 | 0.86 (0.82, 0.90) | 0.002 | −1.6 (−2.0, −1.1) | 0.461 | −0.5 (−1, 0.1) | <0.001 | −0.5 (−0.8, −0.3) | 0.033 |
| 12–15 years | 0.93 (0.92, 0.95) | 0.87 (0.85, 0.90) | 0.87 (0.86, 0.89) | −1.6 (−1.8, −1.4) | −0.2 (−0.3, −0.1) | −0.8 (−1.2, −0.4) | ||||||
| 16–21 years | 0.93 (0.89, 0.97) | 0.92 (0.90, 0.94) | 0.92 (0.90, 0.95) | −1.4 (−1.7, −1.1) | 1.4 (0.9, 2.0) | −0.9 (−1.1, −0.7) | ||||||
| Region | ||||||||||||
| Asia | 0.94 (0.90, 0.98) | <0.001 | 0.89 (0.83, 0.96) | <0.001 | 0.89 (0.82, 0.97) | <0.001 | −1.2 (−1.8, −0.5) | 0.230 | −0.3 (−0.8, 0.2) | 0.125 | 0.0 (−1.1, 1.2) | <0.001 |
| Australasia/ Oceania | 0.87 (0.84, 0.90) | 0.77 (0.71, 0.83) | 0.67 (0.59, 0.75) | −1.8 (−2.7, −0.9) | −0.6 (−2.3, 1.2) | −0.3 (−0.5, 0.0) | ||||||
| Europe | 0.95 (0.94, 0.96) | 0.93 (0.92, 0.94) | 0.89 (0.88, 0.91) | −1.4 (−1.7, −1.2) | 0.2 (0.1, 0.3) | −0.9 (−1.1, −0.7) | ||||||
| North America | 0.94 (0.93, 0.95) | 0.82 (0.78, 0.85) | 0.87 (0.85, 0.89) | −1.3 (−1.5, −1.0) | 0.0 (−0.6, 0.6) | −0.9 (−1.5, −0.3) | ||||||
| South America | −0.8 (−1.4, −0.2) | −1.2 (−3.6, 1.2) | 0.0 (−0.2, 0.2) | |||||||||
| Knowing about subsequent measurement | ||||||||||||
| Yes | 0.96 (0.95, 0.97) | 0.016 | 0.93 (0.91, 0.95) | <0.001 | 0.91 (0.88, 0.93) | 0.022 | −1.1 (−1.3, −0.8) | 0.007 | −0.3 (−0.6, 0.0) | 0.018 | −0.8 (−1.9, 0.2) | 0.894 |
| No | 0.92 (0.90, 0.94) | 0.87 (0.84, 0.91) | 0.84 (0.80, 0.88) | −1.9 (−2.4, −1.4) | 0.1 (0.0, 0.2) | −0.5 (−1.3, 0.2) | ||||||
| Unclear | 0.94 (0.94, 0.95) | 0.85 (0.82, 0.88) | 0.89 (0.87, 0.9) | −1.2 (−1.4, −1.0) | 0.2 (0.1, 0.3) | −0.7 (−0.9, −0.5) | ||||||
| Time between self-reported and measured values | ||||||||||||
| <7 days | 0.95 (0.94, 0.96) | 0.165 | 0.87 (0.85, 0.89) | 0.123 | 0.89 (0.87, 0.90) | 0.472 | −1.3 (−1.5, −1.1) | 0.001 | 0.1 (0.0, 0.2) | 0.010 | −0.7 (−0.9, −0.6) | 0.766 |
| ≥7 days | 0.92 (0.90, 0.95) | 0.91 (0.88, 0.93) | 0.84 (0.76, 0.91) | −2.3 (−3.1, −1.6) | −0.3 (−0.5, −0.1) | −0.3 (−1.5, 0.9) | ||||||
| Unclear | 0.95 (0.93, 0.96) | 0.86 (0.79, 0.92) | 0.89 (0.86, 0.91) | −0.8 (−1.1, −0.6) | 0.2 (−0.3, 0.6) | −0.8 (−1.3, −0.2) | ||||||
| Self-report data collection | ||||||||||||
| Paper questionnaire | 0.94 (0.94, 0.95) | 0.606 | 0.88 (0.85, 0.90) | 0.454 | 0.88 (0.87, 0.89) | 0.148 | −1.4 (−1.6, −1.2) | 0.005 | 0.2 (0.1, 0.2) | <0.001 | −0.8 (−1.3, −0.2) | 0.001 |
| Online questionnaire | - | - | - | −1.9 (−2.7, −1.1) | −0.7 (−1.5, 0.1) | −0.5 (−0.6, −0.4) | ||||||
| In-person interview | 0.94 (0.92, 0.95) | 0.86 (0.82, 0.90) | 0.89 (0.86, 0.92) | −0.8 (−1.2, −0.4) | −0.4 (−0.7, 0.2) | −0.3 (−0.4, −0.2) | ||||||
| Phone interview | 0.94 (0.93, 0.95) | 0.86 (0.84, 0.88) | 0.86 (0.84, 0.88) | |||||||||
Disclaimer/Publisher’s Note: The statements, opinions and data contained in all publications are solely those of the individual author(s) and contributor(s) and not of MDPI and/or the editor(s). MDPI and/or the editor(s) disclaim responsibility for any injury to people or property resulting from any ideas, methods, instructions or products referred to in the content. |
© 2022 by the authors. Licensee MDPI, Basel, Switzerland. This article is an open access article distributed under the terms and conditions of the Creative Commons Attribution (CC BY) license (https://creativecommons.org/licenses/by/4.0/).
Share and Cite
Rios-Leyvraz, M.; Ortega, N.; Chiolero, A. Reliability of Self-Reported Height and Weight in Children: A School-Based Cross-Sectional Study and a Review. Nutrients 2023, 15, 75. https://doi.org/10.3390/nu15010075
Rios-Leyvraz M, Ortega N, Chiolero A. Reliability of Self-Reported Height and Weight in Children: A School-Based Cross-Sectional Study and a Review. Nutrients. 2023; 15(1):75. https://doi.org/10.3390/nu15010075
Chicago/Turabian StyleRios-Leyvraz, Magali, Natalia Ortega, and Arnaud Chiolero. 2023. "Reliability of Self-Reported Height and Weight in Children: A School-Based Cross-Sectional Study and a Review" Nutrients 15, no. 1: 75. https://doi.org/10.3390/nu15010075
APA StyleRios-Leyvraz, M., Ortega, N., & Chiolero, A. (2023). Reliability of Self-Reported Height and Weight in Children: A School-Based Cross-Sectional Study and a Review. Nutrients, 15(1), 75. https://doi.org/10.3390/nu15010075