
Lysine or Threonine Deficiency Decreases Body Weight Gain in Growing Rats despite an Increase in Food Intake without Increasing Energy Expenditure in Response to FGF21
 , , , and
Abstract
1. Introduction
2. Materials and Methods
2.1. Animals
2.2. Experimental Diets
2.3. Experimental Design
2.4. Food Intake, Body Weight and Body Composition Measurements
2.5. Energy Expenditure Measurement by Indirect Calorimetry
2.6. Biochemical Analysis and mRNA Expression Measurements
2.7. Statistical Analysis
3. Results
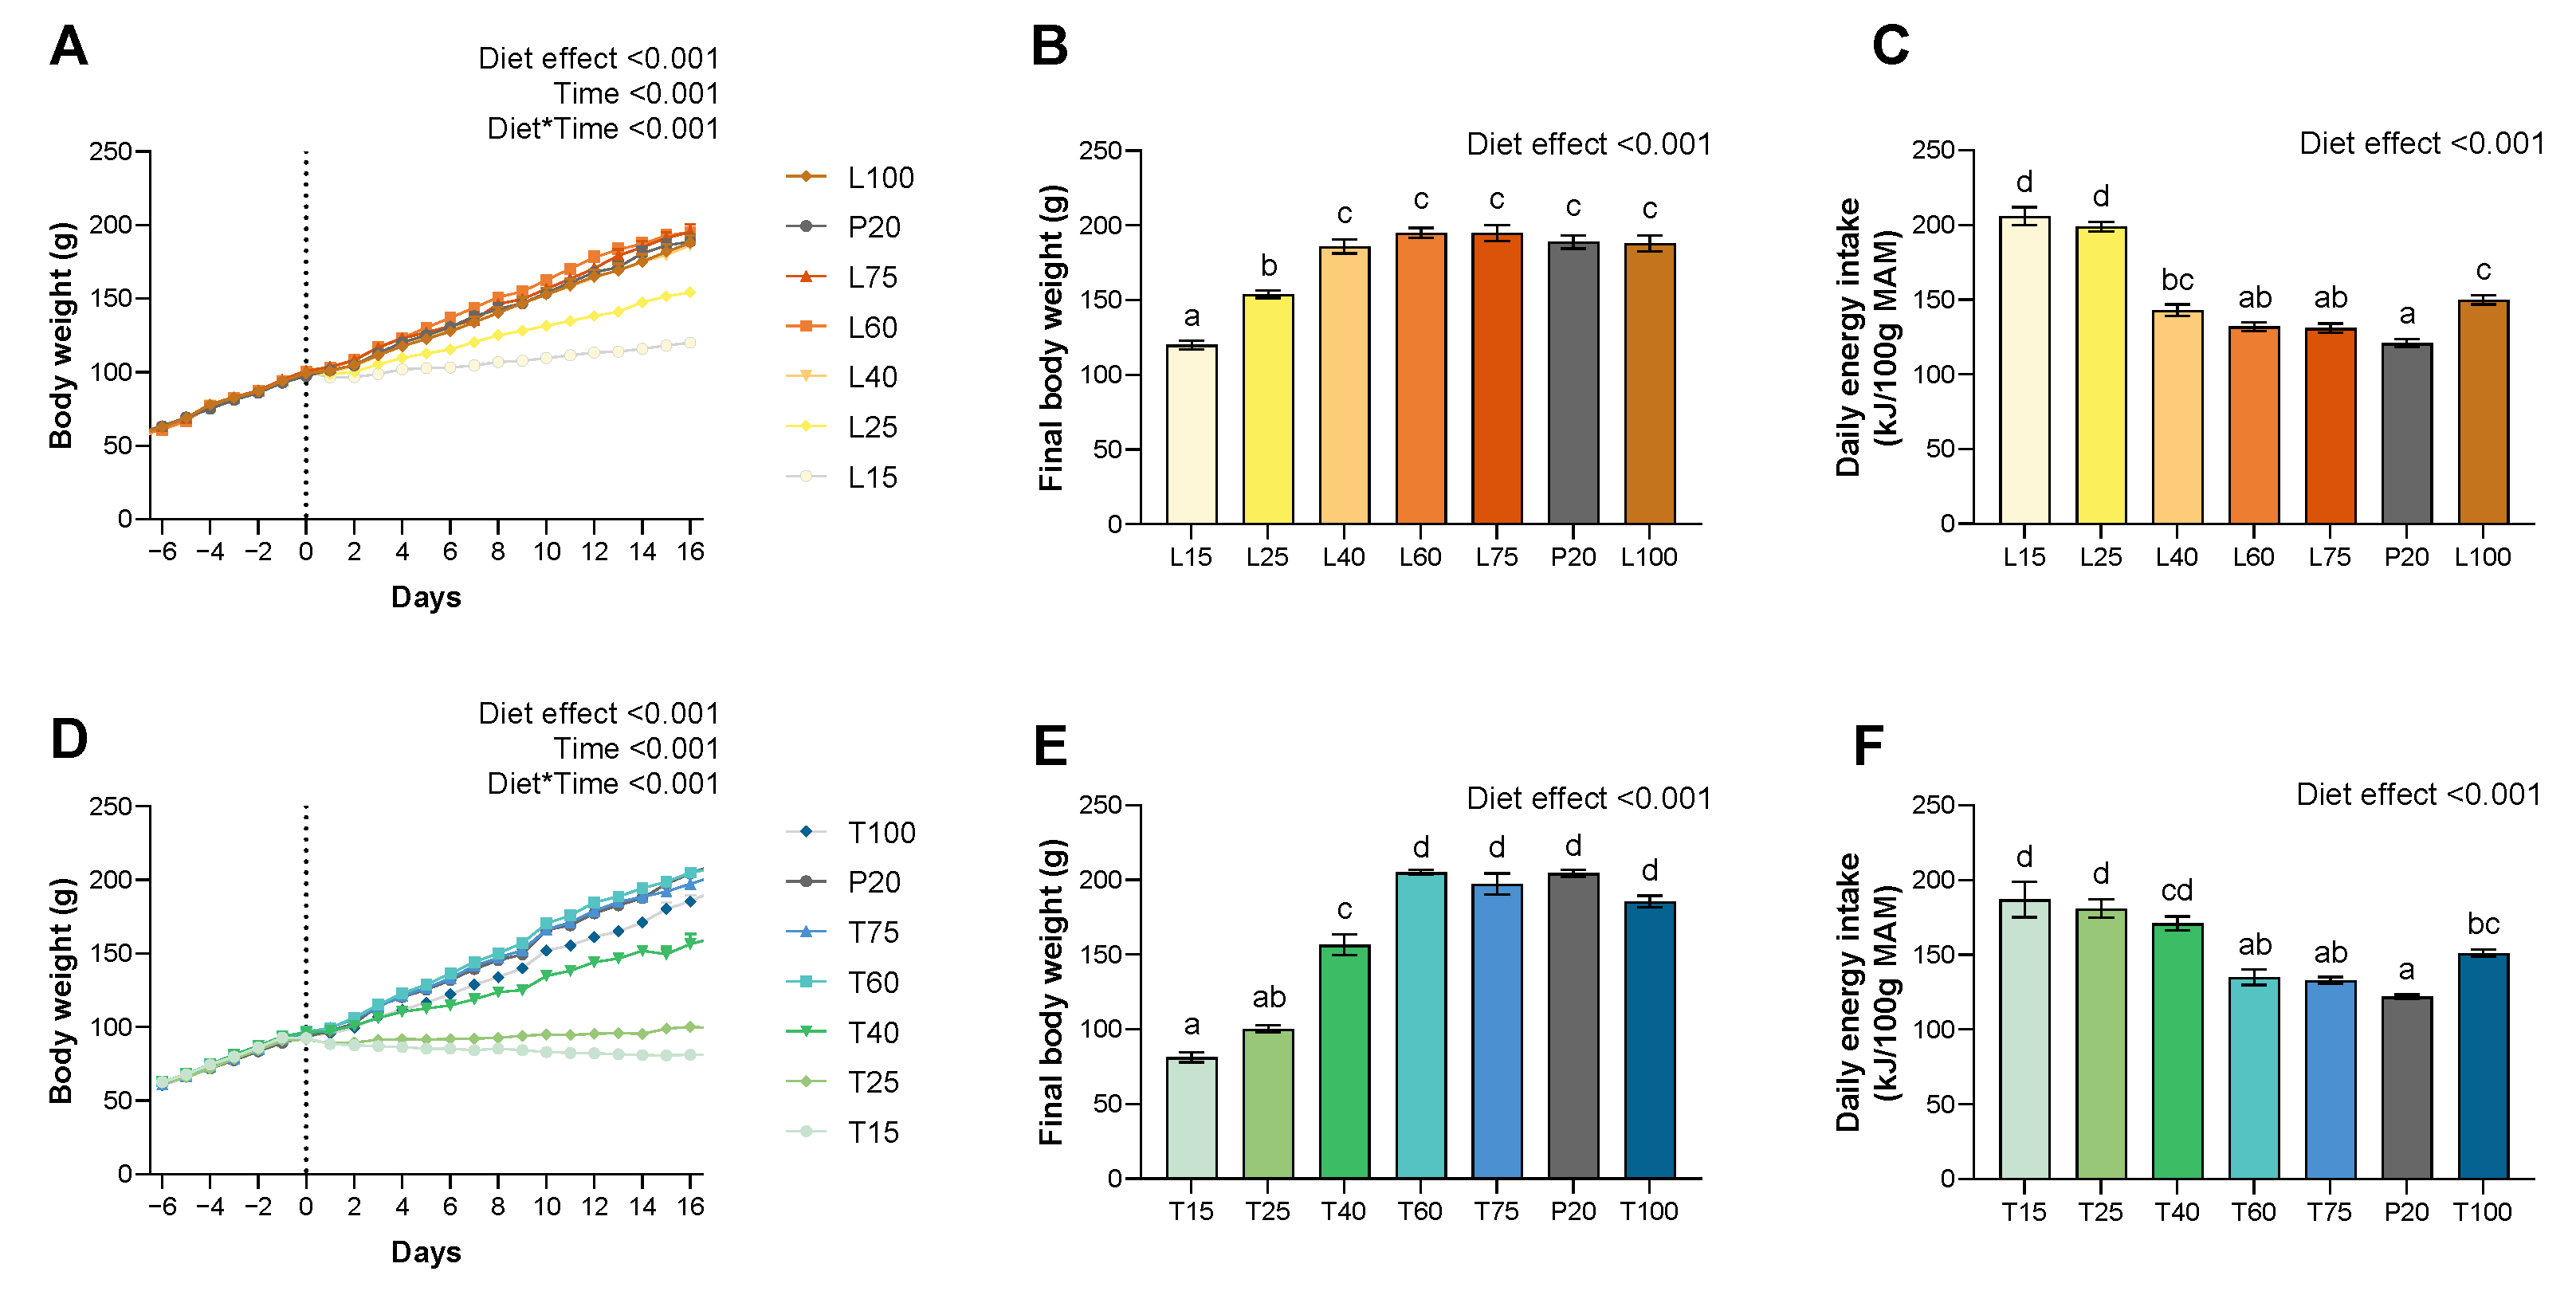
3.1. Food Intake, Body Weight and Food Efficiency
3.2. Body Composition
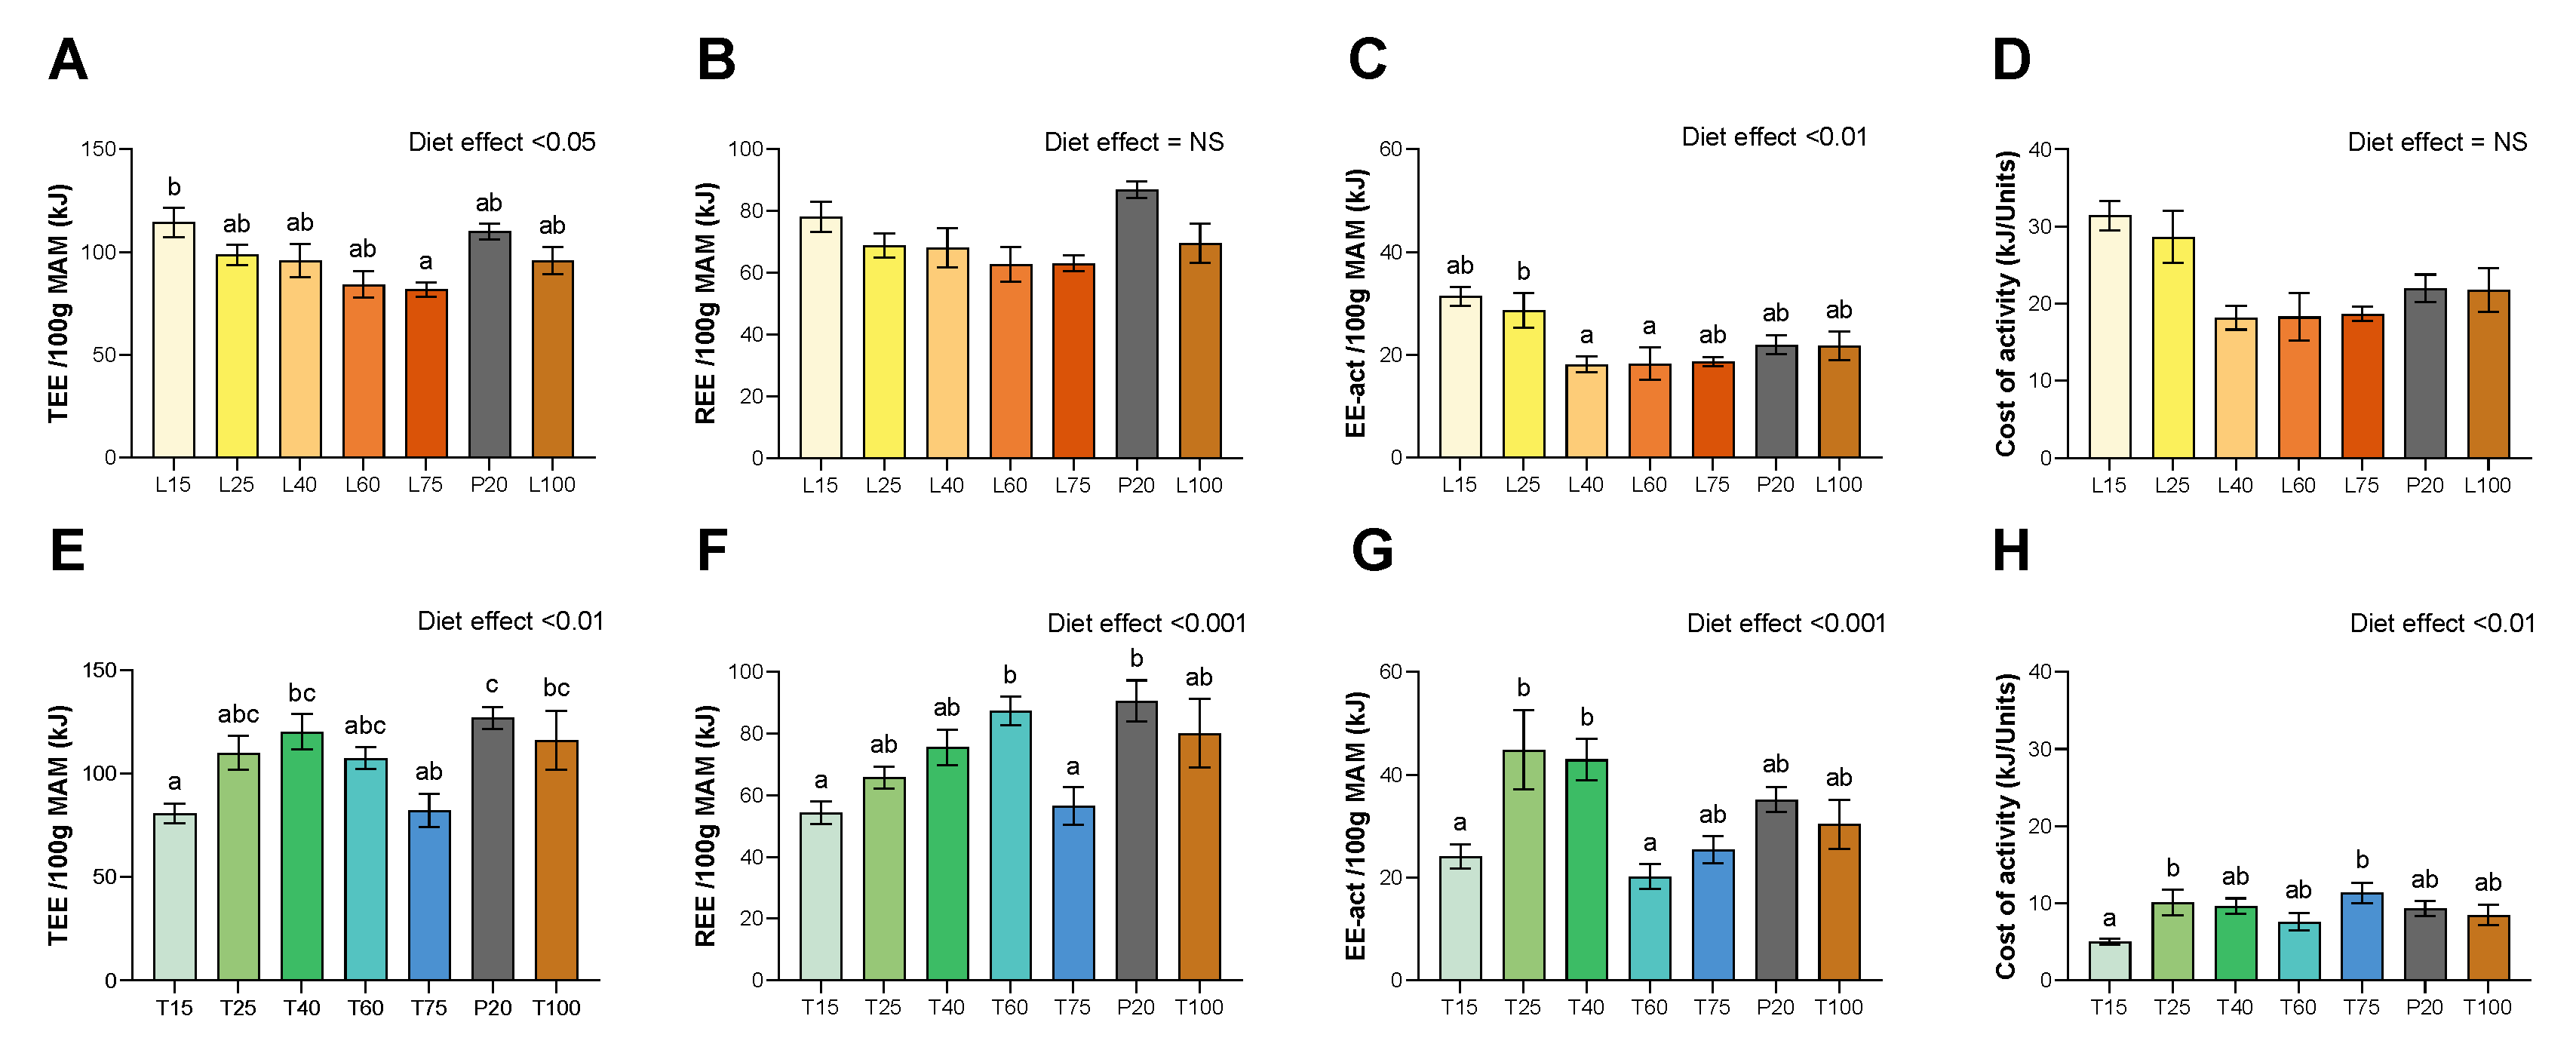
3.3. Energy Expenditure
3.4. Expression of Genes in Liver, Adipose Tissue, Muscle and Hypothalamus
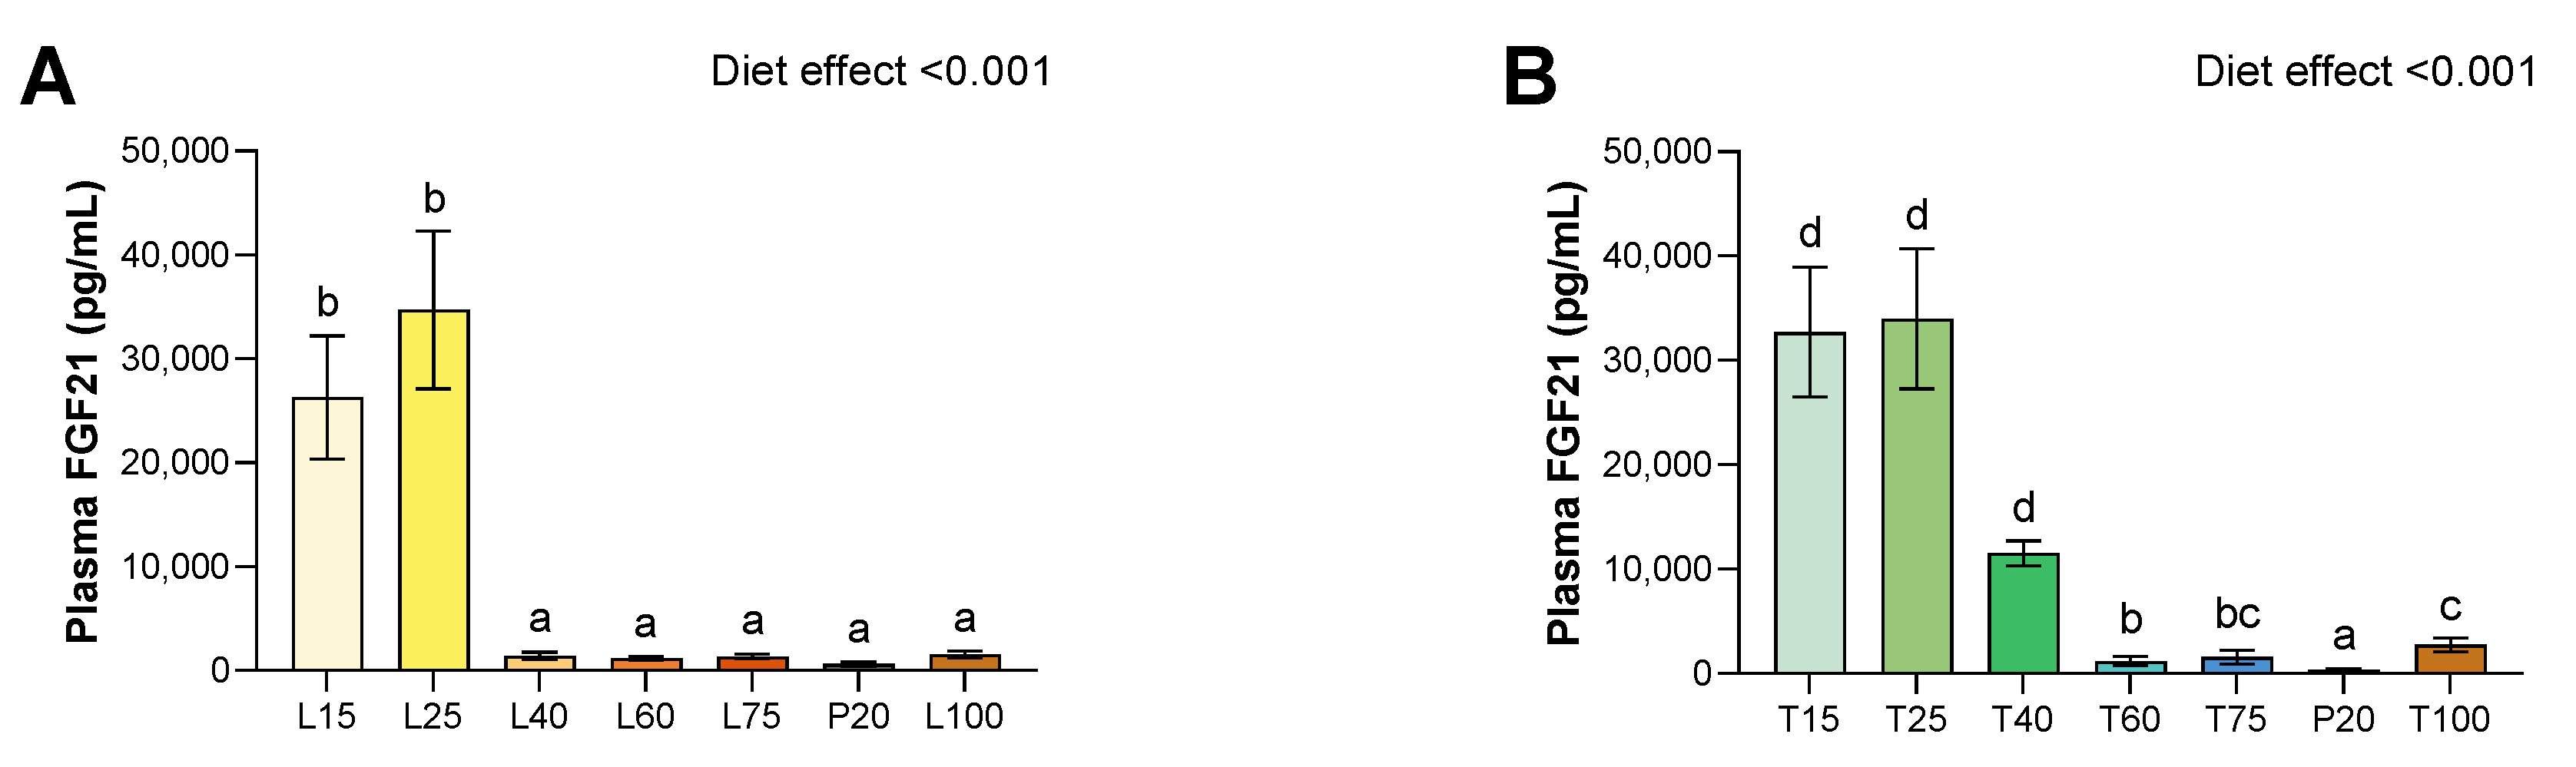
3.5. Plasma FGF-21
4. Discussion
5. Conclusions
Author Contributions
Funding
Institutional Review Board Statement
Informed Consent Statement
Data Availability Statement
Acknowledgments
Conflicts of Interest
Appendix A

| L15 | L25 | L40 | L60 | L75 | P20 | L100 | |
|---|---|---|---|---|---|---|---|
| Amino acid content (g/kg) | |||||||
| Histidine | 3.28 | 3.28 | 3.28 | 3.28 | 3.28 | 3.28 | 3.28 |
| Isoleucine | 6.26 | 6.26 | 6.26 | 6.26 | 6.26 | 6.26 | 6.26 |
| Leucine | 13.56 | 13.56 | 13.56 | 13.56 | 13.56 | 13.56 | 13.56 |
| Lysine | 1.52 | 2.51 | 4.03 | 6.07 | 7.59 | 10.13 | 10.13 |
| Threonine | 6.11 | 6.11 | 6.11 | 6.11 | 6.11 | 6.11 | 6.11 |
| Tryptophan | 2.98 | 2.98 | 2.98 | 2.98 | 2.98 | 2.98 | 2.98 |
| Valine | 7.90 | 7.90 | 7.90 | 7.90 | 7.90 | 7.90 | 7.90 |
| Arginine | 5.22 | 5.22 | 5.22 | 5.22 | 5.22 | 5.22 | 5.22 |
| Methionine | 3.43 | 3.43 | 3.43 | 3.43 | 3.43 | 3.43 | 3.43 |
| Phenylalanine | 6.56 | 6.56 | 6.56 | 6.56 | 6.56 | 6.56 | 6.56 |
| Alanine | 4.77 | 4.77 | 4.77 | 4.77 | 4.77 | 4.77 | 4.77 |
| Aspartic acid | 10.28 | 10.28 | 10.28 | 10.28 | 10.28 | 10.28 | 10.28 |
| Cysteine | 1.34 | 1.34 | 1.34 | 1.34 | 1.34 | 1.34 | 1.34 |
| Glutamic acid | 27.27 | 27.27 | 27.27 | 27.27 | 27.27 | 27.27 | 27.27 |
| Glycine | 2.38 | 2.38 | 2.38 | 2.38 | 2.38 | 2.38 | 2.38 |
| Proline | 12.52 | 12.52 | 12.52 | 12.52 | 12.52 | 12.52 | 12.52 |
| Serine | 7.45 | 7.45 | 7.45 | 7.45 | 7.45 | 7.45 | 7.45 |
| Tyrosine | 6.56 | 6.56 | 6.56 | 6.56 | 6.56 | 6.56 | 6.56 |
| Weight content (g/kg) | |||||||
| Milk proteins | 29 | 48 | 77 | 116 | 145 | 193.5 | 29 |
| Starch | 576.4 | 576.4 | 576.4 | 576.4 | 576.4 | 576.4 | 576.4 |
| Sucrose | 92.8 | 92.8 | 92.8 | 92.8 | 92.8 | 92.8 | 92.8 |
| Soy Oil | 40 | 40 | 40 | 40 | 40 | 40 | 40 |
| Minerals | 35 | 35 | 35 | 35 | 35 | 35 | 35 |
| Vitamins | 10 | 10 | 10 | 10 | 10 | 10 | 10 |
| Cellulose | 50 | 50 | 50 | 50 | 50 | 50 | 50 |
| Choline | 2.3 | 2.3 | 2.3 | 2.3 | 2.3 | 2.3 | 2.3 |
| Energy content (%) | |||||||
| Protein | 19.8 | 19.8 | 19.8 | 19.9 | 19.9 | 20 | 19.8 |
| Carbohydrate | 69.1 | 69 | 68.9 | 68.8 | 68.8 | 68.5 | 69.1 |
| Fat | 10.1 | 10.2 | 10.2 | 10.3 | 10.3 | 10.4 | 10.1 |
| Energy density (kJ/g) | 15 | 14.95 | 14.87 | 14.77 | 14.77 | 14.57 | 15 |
| T15 | T25 | T40 | T60 | T75 | P20 | T100 | |
|---|---|---|---|---|---|---|---|
| Amino acid content (g/kg) | |||||||
| Histidine | 3.28 | 3.28 | 3.28 | 3.28 | 3.28 | 3.28 | 3.28 |
| Isoleucine | 6.26 | 6.26 | 6.26 | 6.26 | 6.26 | 6.26 | 6.26 |
| Leucine | 13.56 | 13.56 | 13.56 | 13.56 | 13.56 | 13.56 | 13.56 |
| Lysine | 10.13 | 10.13 | 10.13 | 10.13 | 10.13 | 10.13 | 10.13 |
| Threonine | 0.92 | 1.52 | 2.43 | 3.66 | 4.58 | 6.11 | 6.11 |
| Tryptophan | 2.98 | 2.98 | 2.98 | 2.98 | 2.98 | 2.98 | 2.98 |
| Valine | 7.90 | 7.90 | 7.90 | 7.90 | 7.90 | 7.90 | 7.90 |
| Arginine | 5.22 | 5.22 | 5.22 | 5.22 | 5.22 | 5.22 | 5.22 |
| Methionine | 3.43 | 3.43 | 3.43 | 3.43 | 3.43 | 3.43 | 3.43 |
| Phenylalanine | 6.56 | 6.56 | 6.56 | 6.56 | 6.56 | 6.56 | 6.56 |
| Alanine | 4.77 | 4.77 | 4.77 | 4.77 | 4.77 | 4.77 | 4.77 |
| Aspartic acid | 10.28 | 10.28 | 10.28 | 10.28 | 10.28 | 10.28 | 10.28 |
| Cysteine | 1.34 | 1.34 | 1.34 | 1.34 | 1.34 | 1.34 | 1.34 |
| Glutamic acid | 27.27 | 27.27 | 27.27 | 27.27 | 27.27 | 27.27 | 27.27 |
| Glycine | 2.38 | 2.38 | 2.38 | 2.38 | 2.38 | 2.38 | 2.38 |
| Proline | 12.52 | 12.52 | 12.52 | 12.52 | 12.52 | 12.52 | 12.52 |
| Serine | 7.45 | 7.45 | 7.45 | 7.45 | 7.45 | 7.45 | 7.45 |
| Tyrosine | 6.56 | 6.56 | 6.56 | 6.56 | 6.56 | 6.56 | 6.56 |
| Weight content (g/kg) | |||||||
| Milk proteins | 29 | 48 | 77 | 116 | 145 | 193.5 | 29 |
| Starch | 576.4 | 576.4 | 576.4 | 576.4 | 576.4 | 576.4 | 576.4 |
| Sucrose | 92.8 | 92.8 | 92.8 | 92.8 | 92.8 | 92.8 | 92.8 |
| Soy Oil | 40 | 40 | 40 | 40 | 40 | 40 | 40 |
| Minerals | 35 | 35 | 35 | 35 | 35 | 35 | 35 |
| Vitamins | 10 | 10 | 10 | 10 | 10 | 10 | 10 |
| Cellulose | 50 | 50 | 50 | 50 | 50 | 50 | 50 |
| Choline | 2.3 | 2.3 | 2.3 | 2.3 | 2.3 | 2.3 | 2.3 |
| Energy content (%) | |||||||
| Protein | 20.2 | 20.3 | 20.5 | 20.7 | 20.9 | 20 | 20.2 |
| Carbohydrate | 68.3 | 68.2 | 68.1 | 67.9 | 67.7 | 68.5 | 68.3 |
| Fat | 10.4 | 10.4 | 10.4 | 10.3 | 10.3 | 10.4 | 10.4 |
| Energy density (kJ/g) | 14.60 | 14.62 | 14.65 | 14.70 | 14.73 | 14.57 | 14.60 |
Appendix B
| Gene/Protein | Full-Length Name | Forward Primer (5′ to 3′) | Reverse Primer (3′ to 5′) |
|---|---|---|---|
| House-keeping genes | |||
| 18S | 18S ribosomal RNA | ACGGAAGGGCACCACCAGGAG | GCACCACCACCCACGGAAACG |
| RPL13A | Ribosomal protein L13a | GGATCCCTCCACCCTTATGACA | CTGGTACTTCCACCCGACCTC |
| Liver | |||
| GK | Glucokinase | CCCTGAGTGGCTTACAGTTC | ACGGATGTGGAGTGTTGAAGC |
| L-PK | Pyruvate kinase | CTGGAACACCTCTGCCTTCTG | CACAATTTCCACCTCCGACTC |
| CD36 | Glycogen synthase | TGCTGGGTCGCTACCTATGTG | TCTGCCTCTCGCCTGCTT |
| CPT1a | Cluster of differentiation 36 | CATGATTAATGGCACAGATGCA | GCAAATGTCAGAGGAAAAGAACCT |
| ACOX | Carnitine palmitoyl transferase 1a | TCTCTGGATGCGGTAGAAAAGG | CTCTATATCCCTGTTCCGATTCGT |
| ACCa | Acyl CoA oxidase | AAGAGTTCATTCTCAACAGCCC | CTTGGACAGACTCTGAGCTGC |
| FAS | Acetyl-CoA carboxylase a | TGGTGCAGAGGTACCGAAGTG | CGTAGTGGCCGTTCTGAAACT |
| MTTP | Microsomal triglyceride transfer protein | AGGGTGGTCTAGCCATTGACA | CAGCCACCCGATTTTTCACT |
| FGF21 | Fatty acid synthase | TGCTCCCAGCTGCAGGC | GCCCGGTAGCTCTGGGTGTA |
| Muscle | |||
| ACOX | Acyl CoA oxidase | AAGAGTTCATTCTCAACAGCCC | CTTGGACAGACTCTGAGCTGC |
| CD36 | Cluster of differentiation 36 | CATGATTAATGGCACAGATGCA | GCAAATGTCAGAGGAAAAGAACCT |
| CPT1b | Carnitine palmitoyl transferase 1b | CAGCCATGCCACCAAGATC | CTTGGGCAGTGATGTTTGGA |
| EAT | |||
| ACCa | Acetyl-CoA carboxylase a | TGGTGCAGAGGTACCGAAGTG | CGTAGTGGCCGTTCTGAAACT |
| FAS | Fatty acid synthase | TGCTCCCAGCTGCAGGC | GCCCGGTAGCTCTGGGTGTA |
| CD36 | Cluster of differentiation 36 | CATGATTAATGGCACAGATGCA | GCAAATGTCAGAGGAAAAGAACCT |
| UCP1 | Mitochondrial uncoupling protein 1 | CGTACCAAGCTGTGCGATGT | GACCCGAGTCGCAGAAAAGA |
| UCP2 | Mitochondrial uncoupling protein 2 | TGAAAGCCAACCTCATGACAGA | CAATGACGGTGGTGCAGAAG |
| UCP3 | Mitochondrial uncoupling protein 3 | GGGATCCTGGAACGTGATGA | TGGAGATTCCCGCAGTACCT |
| Hypothalamus | |||
| FGF21 | Fibroblast growth factor 21 | CCTGGAGCTCAAAGCCTTGA | AAACTGCAGGCCTCAGGATC |
| FGF R1 | Fibroblast growth factor receptor 1 | TGGCACCTGAGGCATTGTT | CCCCAAAAGACCACACATCAC |
| FGF R2B | Fibroblast growth factor receptor 2b | GCCCTTTTTGATAGAGTTTACACTCA | TGAACCCCTAAAGTGAAGATCTC |
| FGF R2C | Fibroblast growth factor receptor 2c | CCCAAAAATGTATCCATCGAGACT | TCATCACGTTGTTTTCTGTTACCA |
| FGF R3 | Fibroblast growth factor receptor 3c | GCCTGCTGACCCCAAGTG | CCTGTCCAAAGCAGCCTTCT |
| NPY | Neuropeptide Y | CTCTGCGACACTACATCAATCTCA | GTGTCTCAGGGCTGGATCTCTT |
| AGRP | Agouti-related peptide | GGCAAGGATCAACAAGCAAAG | TGCCAGCAGCAGGACACA |
| Y2R | Neuropeptide Y receptor Y2 | GAGCTGCAAGTGACCATTACCA | CGCACACGAGCATTTTGG |
| POMC | Proopiomelanocortin | GGCCTTTCCCCTAGAGTTCAA | GTCGGCCTTCTCGGTATCC |
| CART | Cocaine- and amphetamine-regulated transcript | CCGAGCCCTGGACATCTACTC | GCCTTGGCAGCTCCTTCTC |
| MOR | Mu-opioid receptor | GCATTTGGCTACTGGCATCA | CATCCACATCTTCCCTGACTTTG |
| MC3R | Melanocortin-3 receptor | CCTGGAGCTGCGGAACAC | GCCCACGTTCATGCCATT |
| MC4R | Melanocortin-4 receptor | GGGAAAGCCACAAAAAACGA | GGCGCTACTGAAAGCTCACTCT |
| CRF | Corticotropin-releasing factor | CAACCTCAGCCGGTTCTGA | CCCCAGGCGGAGGAAGTA |
References
- Laeger, T.; Albarado, D.C.; Burke, S.J.; Trosclair, L.; Hedgepeth, J.W.; Berthoud, H.-R.; Gettys, T.W.; Collier, J.J.; Münzberg, H.; Morrison, C.D. Metabolic Responses to Dietary Protein Restriction Require an Increase in FGF21 that Is Delayed by the Absence of GCN2. Cell Rep. 2016, 16, 707–716. [Google Scholar] [CrossRef] [PubMed]
- Hill, C.M.; Laeger, T.; Dehner, M.; Albarado, D.C.; Clarke, B.; Wanders, D.; Burke, S.J.; Collier, J.J.; Qualls-Creekmore, E.; Solon-Biet, S.M.; et al. FGF21 Signals Protein Status to the Brain and Adaptively Regulates Food Choice and Metabolism. Cell Rep. 2019, 27, 2934–2947.e3. [Google Scholar] [CrossRef] [PubMed]
- Chalvon-Demersay, T.; Even, P.C.; Tomé, D.; Chaumontet, C.; Piedcoq, J.; Gaudichon, C.; Azzout-Marniche, D. Low-Protein Diet Induces, Whereas High-Protein Diet Reduces Hepatic FGF21 Production in Mice, but Glucose and Not Amino Acids up-Regulate FGF21 in Cultured Hepatocytes. J. Nutr. Biochem. 2016, 36, 60–67. [Google Scholar] [CrossRef] [PubMed]
- Moro, J.; Chaumontet, C.; Even, P.C.; Blais, A.; Piedcoq, J.; Gaudichon, C.; Tomé, D.; Azzout-Marniche, D. Severe Protein Deficiency Induces Hepatic Expression and Systemic Level of FGF21 but Inhibits Its Hypothalamic Expression in Growing Rats. Sci. Rep. 2021, 11, 12436. [Google Scholar] [CrossRef]
- Blais, A.; Chaumontet, C.; Azzout-Marniche, D.; Piedcoq, J.; Fromentin, G.; Gaudichon, C.; Tomé, D.; Even, P.C. Low-Protein Diet-Induced Hyperphagia and Adiposity Are Modulated through Interactions Involving Thermoregulation, Motor Activity, and Protein Quality in Mice. Am. J. Physiol. Endocrinol. Metab. 2018, 314, E139–E151. [Google Scholar] [CrossRef]
- Yap, Y.W.; Rusu, P.M.; Chan, A.Y.; Fam, B.C.; Jungmann, A.; Solon-Biet, S.M.; Barlow, C.K.; Creek, D.J.; Huang, C.; Schittenhelm, R.B.; et al. Restriction of Essential Amino Acids Dictates the Systemic Metabolic Response to Dietary Protein Dilution. Nat. Commun. 2020, 11, 2894. [Google Scholar] [CrossRef]
- Hill, C.M.; Berthoud, H.-R.; Münzberg, H.; Morrison, C.D. Homeostatic Sensing of Dietary Protein Restriction: A Case for FGF21. Front. Neuroendocrinol. 2018, 51, 125–131. [Google Scholar] [CrossRef]
- Laeger, T.; Henagan, T.M.; Albarado, D.C.; Redman, L.M.; Bray, G.A.; Noland, R.C.; Münzberg, H.; Hutson, S.M.; Gettys, T.W.; Schwartz, M.W.; et al. FGF21 Is an Endocrine Signal of Protein Restriction. J. Clin. Investig. 2014, 124, 3913–3922. [Google Scholar] [CrossRef]
- Díaz, J.A.C.; Vallet, J.L.; Boyd, R.D.; Lents, C.A.; Prince, T.J.; DeDecker, A.E.; Phillips, C.E.; Foxcroft, G.; Stalder, K.J. Effect of Feeding Three Lysine to Energy Diets on Growth, Body Composition and Age at Puberty in Replacement Gilts. Anim. Reprod. Sci. 2017, 184, 1–10. [Google Scholar] [CrossRef][Green Version]
- Bastianelli, D.; Quentin, M.; Bouvarel, I.; Relandeau, C.; Lescoat, P.; Picard, M.; Tesseraud, S. Early Lysine Deficiency in Young Broiler Chicks. Animal 2007, 1, 587–594. [Google Scholar] [CrossRef]
- Han, Y.; Baker, D.H. Effects of Sex, Heat Stress, Body Weight, and Genetic Strain on the Dietary Lysine Requirement of Broiler Chicks. Poult. Sci. 1993, 72, 701–708. [Google Scholar] [CrossRef] [PubMed]
- Jiang, Y.; Xie, M.; Fan, W.; Xue, J.; Zhou, Z.; Tang, J.; Chen, G.; Hou, S. Transcriptome Analysis Reveals Differential Expression of Genes Regulating Hepatic Triglyceride Metabolism in Pekin Ducks during Dietary Threonine Deficiency. Front. Genet. 2019, 10, 710. [Google Scholar] [CrossRef] [PubMed]
- Hasek, B.E.; Stewart, L.K.; Henagan, T.M.; Boudreau, A.; Lenard, N.R.; Black, C.; Shin, J.; Huypens, P.; Malloy, V.L.; Plaisance, E.P.; et al. Dietary Methionine Restriction Enhances Metabolic Flexibility and Increases Uncoupled Respiration in both Fed and Fasted States. Am. J. Physiol. Regul. Integr. Comp. Physiol. 2010, 299, R728–R739. [Google Scholar] [CrossRef] [PubMed]
- Komninou, D.; Leutzinger, Y.; Reddy, B.S.; Richie, J.P. Methionine Restriction Inhibits Colon Carcinogenesis. Nutr. Cancer 2006, 54, 202–208. [Google Scholar] [CrossRef] [PubMed]
- Lees, E.K.; Król, E.; Grant, L.; Shearer, K.; Wyse, C.; Moncur, E.; Bykowska, A.S.; Mody, N.; Gettys, T.W.; Delibegovic, M. Methionine Restriction Restores a Younger Metabolic Phenotype in Adult Mice with Alterations in Fibroblast Growth Factor 21. Aging Cell 2014, 13, 817–827. [Google Scholar] [CrossRef] [PubMed]
- Orentreich, N.; Matias, J.R.; DeFelice, A.; Zimmerman, J.A. Low Methionine Ingestion by Rats Extends Life Span. J. Nutr. 1993, 123, 269–274. [Google Scholar] [CrossRef] [PubMed]
- Saunderson, C.L.; Mackinlay, J. Changes in Body-Weight, Composition and Hepatic Enzyme Activities in Response to Dietary Methionine, Betaine and Choline Levels in Growing Chicks. Br. J. Nutr. 1990, 63, 339–349. [Google Scholar] [CrossRef]
- Stone, K.P.; Wanders, D.; Orgeron, M.; Cortez, C.C.; Gettys, T.W. Mechanisms of Increased in Vivo Insulin Sensitivity by Dietary Methionine Restriction in Mice. Diabetes 2014, 63, 3721–3733. [Google Scholar] [CrossRef]
- Ying, Z.; Zhang, H.; Su, W.; Zhou, L.; Wang, F.; Li, Y.; Zhang, L.; Wang, T. Dietary Methionine Restriction Alleviates Hyperglycemia in Pigs with Intrauterine Growth Restriction by Enhancing Hepatic Protein Kinase B Signaling and Glycogen Synthesis. J. Nutr. 2017, 147, 1892–1899. [Google Scholar] [CrossRef]
- Cieslak, D.G.; Benevenga, N.J. Response of Rats to Diets of Equal Chemical Score: Effect of Lysine or Threonine as the Limiting Amino Acid and of an Amino Acid Excess. J. Nutr. 1986, 116, 969–977. [Google Scholar] [CrossRef]
- Narita, K.; Nagao, K.; Bannai, M.; Ichimaru, T.; Nakano, S.; Murata, T.; Higuchi, T.; Takahashi, M. Dietary Deficiency of Essential Amino Acids Rapidly Induces Cessation of the Rat Estrous Cycle. PLoS ONE 2011, 6, e28136. [Google Scholar] [CrossRef]
- Wu, G.; Shi, Y.; Han, L.; Feng, C.; Ge, Y.; Yu, Y.; Tang, X.; Cheng, X.; Sun, J.; Le, G.-W. Dietary Methionine Restriction Ameliorated Fat Accumulation, Systemic Inflammation, and Increased Energy Metabolism by Altering Gut Microbiota in Middle-Aged Mice Administered Different Fat Diets. J. Agric. Food Chem. 2020, 68, 7745–7756. [Google Scholar] [CrossRef] [PubMed]
- Bolton, L.L.; Squibb, R.L.; Collier, G.H. Lysine Deficiency and Voluntary Exercise in the Albino Rat. J. Nutr. 1979, 109, 1313–1320. [Google Scholar] [CrossRef]
- Canfield, L.M.; Chytil, F. Effect of Low Lysine Diet on Rat Protein Metabolism. J. Nutr. 1978, 108, 1343–1347. [Google Scholar] [CrossRef] [PubMed]
- Canfield, L.M.; Chytil, F. Effect of Low Lysine Diet on Rat Liver Nuclear Metabolism. J. Nutr. 1978, 108, 1336–1342. [Google Scholar] [CrossRef] [PubMed]
- Aström, S.; von der Decken, A. Lysine Deficiency Reduces Transcription Activity and Concentration of Chromatin Proteins Reversibly in Rat Liver. Acta Physiol. Scand. 1983, 117, 519–525. [Google Scholar] [CrossRef]
- Smriga, M.; Murakami, H.; Mori, M.; Torii, K. Effects of L-Lysine Deficient Diet on the Hypothalamic Interstitial Norepinephrine and Diet-Induced Thermogenesis in Rats in Vivo. Biofactors 2000, 12, 137–142. [Google Scholar] [CrossRef]
- Tabuchi, E.; Ono, T.; Nishijo, H.; Torii, K. Amino Acid and NaCl Appetite, and LHA Neuron Responses of Lysine-Deficient Rat. Physiol. Behav. 1991, 49, 951–964. [Google Scholar] [CrossRef]
- Tsurugizawa, T.; Uematsu, A.; Uneyama, H.; Torii, K. Reversible Brain Response to an Intragastric Load of L-Lysine under L-Lysine Depletion in Conscious Rats. Br. J. Nutr. 2013, 109, 1323–1329. [Google Scholar] [CrossRef]
- Xiao, C.-W.; Wood, C.; Bertinato, J. Dietary Supplementation with L-Lysine Affects Body Weight and Blood Hematological and Biochemical Parameters in Rats. Mol. Biol. Rep. 2018, 46, 433–442. [Google Scholar] [CrossRef]
- Hamard, A.; Mazurais, D.; Boudry, G.; Le Huërou-Luron, I.; Sève, B.; Le Floc’h, N. A Moderate Threonine Deficiency Affects Gene Expression Profile, Paracellular Permeability and Glucose Absorption Capacity in the Ileum of Piglets. J. Nutr. Biochem. 2010, 21, 914–921. [Google Scholar] [CrossRef] [PubMed]
- Pradas, I.; Jové, M.; Cabré, R.; Ayala, V.; Mota-Martorell, N.; Pamplona, R. Effects of Aging and Methionine Restriction on Rat Kidney Metabolome. Metabolites 2019, 9, 280. [Google Scholar] [CrossRef] [PubMed]
- Tamanna, N.; Kroeker, K.; Braun, K.; Banh, S.; Treberg, J.R. The Effect of Short-Term Methionine Restriction on Glutathione Synthetic Capacity and Antioxidant Responses at the Whole Tissue and Mitochondrial Level in the Rat Liver. Exp. Gerontol. 2019, 127, 110712. [Google Scholar] [CrossRef]
- Nagao, K.; Bannai, M.; Seki, S.; Kawai, N.; Mori, M.; Takahashi, M. Voluntary Wheel Running Is Beneficial to the Amino Acid Profile of Lysine-Deficient Rats. Am. J. Physiol. Endocrinol. Metab. 2010, 298, E1170–E1178. [Google Scholar] [CrossRef] [PubMed]
- Fang, H.; Stone, K.P.; Forney, L.A.; Wanders, D.; Gettys, T.W. Nutritional Regulation of Hepatic FGF21 by Dietary Restriction of Methionine. Front. Endocrinol. 2021, 12, 773975. [Google Scholar] [CrossRef]
- Cornu, M.; Oppliger, W.; Albert, V.; Robitaille, A.M.; Trapani, F.; Quagliata, L.; Fuhrer, T.; Sauer, U.; Terracciano, L.; Hall, M.N. Hepatic MTORC1 Controls Locomotor Activity, Body Temperature, and Lipid Metabolism through FGF21. Proc. Natl. Acad. Sci. USA 2014, 111, 11592–11599. [Google Scholar] [CrossRef]
- Shimizu, N.; Maruyama, T.; Yoshikawa, N.; Matsumiya, R.; Ma, Y.; Ito, N.; Tasaka, Y.; Kuribara-Souta, A.; Miyata, K.; Oike, Y.; et al. A Muscle-Liver-Fat Signalling Axis Is Essential for Central Control of Adaptive Adipose Remodelling. Nat. Commun. 2015, 6, 6693. [Google Scholar] [CrossRef]
- Maida, A.; Zota, A.; Sjøberg, K.A.; Schumacher, J.; Sijmonsma, T.P.; Pfenninger, A.; Christensen, M.M.; Gantert, T.; Fuhrmeister, J.; Rothermel, U.; et al. A Liver Stress-Endocrine Nexus Promotes Metabolic Integrity during Dietary Protein Dilution. J. Clin. Investig. 2016, 126, 3263–3278. [Google Scholar] [CrossRef]
- Forney, L.A.; Wanders, D.; Stone, K.P.; Pierse, A.; Gettys, T.W. Concentration-Dependent Linkage of Dietary Methionine Restriction to the Components of Its Metabolic Phenotype. Obesity 2017, 25, 730–738. [Google Scholar] [CrossRef]
- Ables, G.P.; Perrone, C.E.; Orentreich, D.; Orentreich, N. Methionine-Restricted C57BL/6J Mice Are Resistant to Diet-Induced Obesity and Insulin Resistance but Have Low Bone Density. PLoS ONE 2012, 7, e51357. [Google Scholar] [CrossRef]
- Olsen, T.; Øvrebø, B.; Haj-Yasein, N.; Lee, S.; Svendsen, K.; Hjorth, M.; Bastani, N.E.; Norheim, F.; Drevon, C.A.; Refsum, H.; et al. Effects of Dietary Methionine and Cysteine Restriction on Plasma Biomarkers, Serum Fibroblast Growth Factor 21, and Adipose Tissue Gene Expression in Women with Overweight or Obesity: A Double-Blind Randomized Controlled Pilot Study. J. Transl. Med. 2020, 18, 122. [Google Scholar] [CrossRef] [PubMed]
- Fontana, L.; Cummings, N.E.; Arriola Apelo, S.I.; Neuman, J.C.; Kasza, I.; Schmidt, B.A.; Cava, E.; Spelta, F.; Tosti, V.; Syed, F.A.; et al. Decreased Consumption of Branched-Chain Amino Acids Improves Metabolic Health. Cell Rep. 2016, 16, 520–530. [Google Scholar] [CrossRef] [PubMed]
- De Sousa-Coelho, A.L.; Marrero, P.F.; Haro, D. Activating Transcription Factor 4-Dependent Induction of FGF21 during Amino Acid Deprivation. Biochem. J. 2012, 443, 165–171. [Google Scholar] [CrossRef] [PubMed]
- De Sousa-Coelho, A.L.; Relat, J.; Hondares, E.; Pérez-Martí, A.; Ribas, F.; Villarroya, F.; Marrero, P.F.; Haro, D. FGF21 Mediates the Lipid Metabolism Response to Amino Acid Starvation. J. Lipid Res. 2013, 54, 1786–1797. [Google Scholar] [CrossRef]
- Rusu, P.M.; Chan, A.Y.; Heikenwalder, M.; Müller, O.J.; Rose, A.J. Dietary Essential Amino Acid Restriction Promotes Hyperdipsia via Hepatic FGF21. Nutrients 2021, 13, 1469. [Google Scholar] [CrossRef]
- National Research Council (US). Subcommittee on Laboratory Animal Nutrition. In Nutrient Requirements of Laboratory Animals: Fourth Revised Edition, 1995; National Academies Press (US): Washington, DC, USA, 1995; ISBN 978-0-309-05126-2. [Google Scholar]
- Even, P.C.; Nadkarni, N.A. Indirect Calorimetry in Laboratory Mice and Rats: Principles, Practical Considerations, Interpretation and Perspectives. Am. J. Physiol. Regul. Integr. Comp. Physiol. 2012, 303, R459–R476. [Google Scholar] [CrossRef]
- Weir, J.B.D.V. New Methods for Calculating Metabolic Rate with Special Reference to Protein Metabolism. J. Physiol. 1949, 109, 1–9. [Google Scholar] [CrossRef]
- Yin, J.; Li, Y.; Han, H.; Liu, Z.; Zeng, X.; Li, T.; Yin, Y. Long-Term Effects of Lysine Concentration on Growth Performance, Intestinal Microbiome, and Metabolic Profiles in a Pig Model. Food Funct. 2018, 9, 4153–4163. [Google Scholar] [CrossRef]
- Khwatenge, C.N.; Kimathi, B.M.; Taylor-Bowden, T.; Nahashon, S.N. Expression of Lysine-Mediated Neuropeptide Hormones Controlling Satiety and Appetite in Broiler Chickens. Poult. Sci. 2020, 99, 1409–1420. [Google Scholar] [CrossRef]
- Zou, J.-M.; Zhu, Q.-S.; Liang, H.; Lu, H.-L.; Liang, X.-F.; He, S. Lysine Deprivation Regulates Npy Expression via GCN2 Signaling Pathway in Mandarin Fish (Siniperca Chuatsi). Int. J. Mol. Sci. 2022, 23, 6727. [Google Scholar] [CrossRef]
- Le, N.-M.P.; Brown, J.W. Characterization of the Thermoneutral Zone of the Laboratory Rat. FASEB J. 2008, 22, 956.19. [Google Scholar] [CrossRef]
- Even, P.C.; Blais, A. Increased Cost of Motor Activity and Heat Transfer between Non-Shivering Thermogenesis, Motor Activity, and Thermic Effect of Feeding in Mice Housed at Room Temperature—Implications in Pre-Clinical Studies. Front. Nutr. 2016, 3, 43. [Google Scholar] [CrossRef] [PubMed]
- Straub, L.; Wolfrum, C. FGF21, Energy Expenditure and Weight Loss—How Much Brown Fat Do You Need? Mol. Metab. 2015, 4, 605–609. [Google Scholar] [CrossRef]
- Ricquier, D.; Bouillaud, F. The Uncoupling Protein Homologues: UCP1, UCP2, UCP3, StUCP and AtUCP. Biochem. J. 2000, 345, 161–179. [Google Scholar] [CrossRef] [PubMed]
- Boss, O.; Samec, S.; Paoloni-Giacobino, A.; Rossier, C.; Dulloo, A.; Seydoux, J.; Muzzin, P.; Giacobino, J.-P. Uncoupling Protein-3: A New Member of the Mitochondrial Carrier Family with Tissue-Specific Expression. FEBS Lett. 1997, 408, 39–42. [Google Scholar] [CrossRef] [PubMed]
- Zouhar, P.; Janovska, P.; Stanic, S.; Bardova, K.; Funda, J.; Haberlova, B.; Andersen, B.; Rossmeisl, M.; Cannon, B.; Kopecky, J.; et al. A Pyrexic Effect of FGF21 Independent of Energy Expenditure and UCP1. Mol. Metab. 2021, 53, 101324. [Google Scholar] [CrossRef]


| Diet | L15 | L25 | L40 | L60 | L75 | P20 | L100 | Diet Effect |
|---|---|---|---|---|---|---|---|---|
| Cumulated food intake (g) | 285.38 ± 10.92 a | 367.40 ± 4.00 c | 333.33 ± 5.46 bc | 341.80 ± 6.29 c | 331.67 ± 11.18 bc | 305.03 ± 5.68 ab | 361.09 ± 11.04 c | <0.001 |
| Daily food intake (g/100 g MAM) | 14.19 ± 0.42 a | 13.70 ± 0.22 a | 9.82 ± 0.27 bc | 9.09 ± 0.20 cd | 8.98 ± 0.21 cd | 8.31 ± 0.19 d | 10.30 ± 0.20 b | <0.001 |
| Daily energy intake (kJ) | 244.09 ± 9.34 c | 314.45 ± 3.43 a | 285.29 ± 4.68 ab | 292.74 ± 5.38 a | 284.06 ± 9.58 ab | 261.42 ± 4.86 bc | 308.84 ± 9.44 a | <0.001 |
| Daily energy intake (kJ/100 g MAM) | 206.39 ± 5.96 a | 199.38 ± 3.28 a | 142.85 ± 3.96 bc | 132.37 ± 2.95 cd | 130.72 ± 3.04 cd | 121.12 ± 2.78 d | 149.83 ± 2.97 b | <0.001 |
| Food efficiency (kJ/kJ) | 0.03 ± 0.01 c | 0.09 ± 0.01 b | 0.13 ± 0.01 ab | 0.13 ± 0.01 ab | 0.12 ± 0.01 ab | 0.10 ± 0.01 ab | 0.12 ± 0.01 ab | <0.001 |
| Diet | T15 | T25 | T40 | T60 | T75 | P20 | T100 | Diet Effect |
|---|---|---|---|---|---|---|---|---|
| Cumulated food intake (g) | 172.92 ± 9.97 d | 207.85 ± 9.40 d | 335.35 ± 7.59 abc | 346.69 ± 13.24 ab | 333.19 ± 9.26 abc | 306.79 ± 5.84 bc | 349.61 ± 11.26 a | <0.001 |
| Daily food intake (g/100 g MAM) | 12.87 ± 0.82 a | 12.47 ± 0.43 a | 11.78 ± 0.32 ab | 9.25 ± 0.35 cd | 9.12 ± 0.15 cd | 8.40 ± 0.10 d | 10.35 ± 0.17 bc | <0.001 |
| Daily energy intake (kJ) | 147.89 ± 8.53 c | 177.90 ± 8.04 c | 289.02 ± 6.50 ab | 296.93 ± 11.34 a | 285.37 ± 7.93 ab | 262.93 ± 5.00 ab | 299.02 ± 9.63 a | <0.001 |
| Daily energy intake (kJ/100 g MAM) | 187.25 ± 12.00 a | 181.47 ± 6.19 a | 171.36 ± 4.67 ab | 134.68 ± 5.02 cd | 132.84 ± 2.12 cd | 122.45 ± 1.46 d | 150.52 ± 2.42 bc | <0.001 |
| Food efficiency (kJ/kJ) | −0.10 ± 0.01 c | −0.04 ± 0.01 bc | 0.08 ± 0.01 ab | 0.13 ± 0.01 a | 0.16 ± 0.01 a | 0.15 ± 0.01 a | 0.12 ± 0.00 a | <0.001 |
| Diet | L15 | L25 | L40 | L60 | L75 | P20 | L100 | Diet Effect |
|---|---|---|---|---|---|---|---|---|
| Initial body weight (g) | 62.34 ± 0.82 | 61.73 ± 1.09 | 61.73 ± 1.09 | 61.00 ± 0.89 | 63.61 ± 0.69 | 63.33 ± 0.94 | 62.64 ± 1.14 | NS |
| Final body weight (g) | 128.64 ± 3.36 d | 174.24 ± 3.05 c | 217.63 ± 6.03 b | 240.88 ± 6.70 a | 232.13 ± 3.65 ab | 228.79 ± 5.90 ab | 223.96 ± 7.00 ab | < 0.001 |
| MAM (g) | 70.46 ± 2.03 d | 96.34 ± 1.43 c | 126.53 ± 3.17 b | 138.88 ± 3.76 ab | 138.18 ± 1.81 ab | 135.93 ± 4.02 ab | 130.65 ± 3.69 ab | <0.001 |
| Fat mass (g) | 13.02 ± 0.72 c | 20.40 ± 1.22 ab | 21.39 ± 1.56 ab | 23.73 ± 1.30 a | 18.98 ± 1.67 abc | 15.45 ± 1.15 bc | 22.10 ± 2.29 a | <0.001 |
| Adiposity (%) | 10.09 ± 0.40 bc | 11.66 ± 0.55 c | 9.78 ± 0.54 bc | 9.86 ± 0.47 bc | 8.13 ± 0.64 ab | 6.42 ± 0.42 a | 9.76 ± 0.80 bc | <0.001 |
| Lean body mass (g) | 67.86 ± 1.91 d | 92.26 ± 1.30 c | 122.25 ± 2.96 b | 134.13 ± 3.66 ab | 134.39 ± 1.65 ab | 132.84 ± 3.90 ab | 126.25 ± 3.33 ab | <0.001 |
| Liver (g) | 3.90 ± 0.15 c | 7.11 ± 0.37 c | 7.11 ± 037 b | 8.88 ± 0.43 a | 8.73 ± 0.27 a | 8.34 ± 0.28 ab | 7.76 ± 0.40 ab | <0.001 |
| Kidneys (g) | 1.10 ± 0.04 d | 1.38 ± 0.03 cd | 1.67 ± 0.06 ac | 1.78 ± 0.06 a | 1.74 ± 0.04 ab | 1.76 ± 0.07 ab | 1.46 ± 0.14 bc | <0.001 |
| Gastrocnemius muscle (g) | 1.18 ± 0.04 c | 1.52 ± 0.04 b | 2.00 ± 0.04 a | 2.08 ± 0.09 a | 2.08 ± 0.05 a | 2.09 ± 0.07 a | 2.17 ± 0.14 a | <0.001 |
| Carcass (g) | 44.8 ± 1.19 c | 59.48 ± 0.91 b | 77.09 ± 1.64 a | 83.35 ± 2.40 a | 84.5 ± 1.18 a | 84.44 ± 2.84 a | 78.6 ± 1.62 a | <0.001 |
| Epididymal fat (g) | 1.76 ± 0.12 c | 2.67 ± 0.22 bc | 3.36 ± 0.34 ab | 3.90 ± 2.29 a | 3.01 ± 2.88 ab | 2.65 ± 0.20 bc | 3.25 ± 0.37 ab | <0.001 |
| Mesenteric fat (g) | 1.97 ± 0.14 c | 2.94 ± 0.19 ab | 3.21 ± 0.17 ab | 3.84 ± 0.22 a | 3.04 ± 0.26 ab | 2.65 ± 0.09 bc | 3.36 ± 0.3 ab | <0.001 |
| Retroperitoneal fat (g) | 1.88 ± 0.16 d | 3.35 ± 0.20 abc | 3.71 ± 0.30 abc | 4.56 ± 0.38 a | 3.10 ± 0.43 bcd | 2.31 ± 0.17 cd | 4.15 ± 0.50 ab | <0.001 |
| Subcutaneous fat (g) | 7.41 ± 0.41 b | 11.44 ± 0.77 a | 11.10 ± 0.85 ab | 11.43 ± 0.78 a | 9.81 ± 1.07 ab | 7.84 ± 0.90 ab | 11.34 ± 1.24 a | <0.01 |
| Brown adipose tissue (g) | 0.43 ± 0.03 | 0.53 ± 0.04 | 0.52 ± 0.04 | 0.53 ± 0.03 | 0.44 ± 0.03 | 0.44 ± 0.03 | 0.50 ± 0.06 | NS |
| Diet | T15 | T25 | T40 | T60 | T75 | P20 | T100 | Diet Effect |
|---|---|---|---|---|---|---|---|---|
| Initial body weight (g) | 62.71 ± 1.79 | 62.44 ± 1.67 | 62.74 ± 1.68 | 63.31 ± 1.72 | 61.21 ± 1.56 | 64.95 ± 1.23 | 60.59 ± 1.69 | NS |
| Final body weight (g) | 81.63 ± 1.68 d | 102.14 ± 2.16 d | 180.89 ± 4.12 c | 241.79 ± 3.69 a | 233.59 ± 55.46 ab | 230.96 ± 5.91 ab | 215.61 ± 7.32 b | <0.001 |
| MAM (g) | 44.29 ± 1.13 e | 57.67 ± 1.27 d | 106.86 ± 2.08 c | 141.28 ± 3.21 a | 137.71 ± 2.83 ab | 137.87 ± 4.06 ab | 126.01 ± 4.61 b | <0.001 |
| Fat mass (g) | 2.94 ± 0.26 d | 5.16 ± 0.43 d | 16.48 ± 0.75 c | 26.47 ± 1.45 a | 23.43 ± 1.76 ab | 19.89 ± 1.82 bc | 21.05 ± 1.60 abc | <0.001 |
| Adiposity (%) | 3.60 ± 0.31 c | 5.00 ± 0.35 c | 8.94 ± 0.34 ab | 10.94 ± 0.57 a | 10.0 ± 0.63 ab | 8.58 ± 0.70 b | 9.69 ± 0.44 ab | <0.001 |
| Lean body mass (g) | 43.70 ± 1.10 e | 56.77 ± 1.17 d | 103.63 ± 2.00 c | 135.98 ± 3.23 a | 133.03 ± 2.74 ab | 133.89 ± 3.93 ab | 121.80 ± 4.34 b | <0.001 |
| Liver (g) | 2.77 ± 0.10 d | 3.07 ± 0.08 d | 6.11 ± 0.31 c | 8.47 ± 0.20 a | 7.91 ± 0.25 ab | 8.75 ± 0.35 a | 7.33 ± 0.36 b | <0.001 |
| Kidneys (g) | 0.74 ± 0.01 c | 0.88 ± 0.02 c | 1.41 ± 0.03 b | 1.70 ± 0.04 a | 1.69 ± 0.05 a | 1.78 ± 0.06 a | 1.65 ± 0.05 a | <0.001 |
| Gastrocnemius muscle (g) | 0.84 ± 0.02 c | 1.07 ± 0.02 c | 1.78 ± 0.05 b | 2.23 ± 0.08 a | 2.19 ± 0.09 a | 2.28 ± 0.09 a | 2.13 ± 0.16 ab | <0.001 |
| Carcass (g) | 29.43 ± 0.71 d | 38.42 ± 0.86 c | 68.31 ± 1.26 b | 84.85 ± 2.12 a | 82.25 ± 1.95 a | 84.31 ± 2.41 a | 77.16 ± 2.88 a | <0.001 |
| Epididymal fat (g) | 0.31 ± 0.19 c | 0.54 ± 0.05 c | 2.31 ± 0.29 b | 4.27 ± 0.35 a | 3.84 ± 0.26 a | 3.28 ± 0.45 ab | 3.26 ± 0.40 ab | <0.001 |
| Mesenteric fat (g) | 0.44 ± 0.05 d | 0.76 ± 0.06 d | 2.46 ± 0.14 c | 4.06 ± 0.34 a | 3.80 ± 0.27 ab | 3.31 ± 0.35 bc | 3.25 ± 0.23 bc | <0.001 |
| Retroperitoneal fat (g) | 0.16 ± 0.04 c | 0.39 ± 0.07 c | 2.06 ± 0.15 b | 4.62 ± 0.31 a | 4.08 ± 0.38 a | 3.44 ± 0.49 ab | 3.61 ± 0.46 a | <0.001 |
| Subcutaneous fat (g) | 2.03 ± 0.19 c | 3.60 ± 0.28 c | 9.35 ± 0.59 b | 12.98 ± 0.68 a | 11.70 ± 1.11 ab | 9.86 ± 0.70 b | 10.92 ± 0.66 ab | <0.001 |
| Brown adipose tissue (g) | 0.18 ± 0.02 b | 0.27 ± 0.03 b | 0.50 ± 0.04 a | 0.55 ± 0.05 a | 0.51 ± 0.06 a | 0.47 ± 0.03 a | 0.54 ± 0.06 a | <0.001 |
| Organ | Diet | L15 | L25 | L40 | L60 | L75 | P20 | L100 | Diet Effect |
|---|---|---|---|---|---|---|---|---|---|
| Liver | GK | 0.98 ± 0.30 | 0.89 ± 0.16 | 0.83 ± 0.34 | 0.63 ± 0.14 | 0.68 ± 0.13 | 1.00 ± 0.20 | 0.59 ± 0.14 | NS |
| L-PK | 1.37 ± 0.25 | 1.29 ± 0.17 | 0.97 ± 0.17 | 0.99 ± 0.15 | 1.09 ± 0.18 | 1.00 ± 0.30 | 1.10 ± 0.14 | NS | |
| CD36 | 1.20 ± 0.29 | 0.65 ± 0.09 | 0.79 ± 0.11 | 0.69 ± 0.06 | 0.69 ± 0.15 | 1.00 ± 0.11 | 0.74 ± 0.11 | NS | |
| CPT1a | 1.83 ± 0.34 b | 0.95 ± 0.11 ab | 0.94 ± 0.18 ab | 0.66 ± 0.06 a | 0.63 ± 0.10 a | 1.00 ± 0.13 ab | 0.81 ± 0.10 ab | <0.05 | |
| ACOX | 1.21 ± 0.19 | 0.70 ± 0.06 | 0.73 ± 0.16 | 0.69 ± 0.05 | 0.80 ± 0.09 | 1.00 ± 0.13 | 0.82 ± 0.07 | NS | |
| ACCa | 1.28 ± 0.22 | 0.85 ± 0.08 | 0.76 ± 0.12 | 0.70 ± 0.08 | 0.72 ± 0.06 | 1.00 ± 0.08 | 0.81 ± 0.05 | NS | |
| FAS | 2.38 ± 0.54 | 1.56 ± 0.11 | 1.26 ± 0.25 | 1.09 ± 0.19 | 1.15 ± 0.18 | 1.00 ± 0.28 | 1.19 ± 0.20 | NS | |
| MTTP | 1.23 ± 0.14 | 0.91 ± 0.06 | 0.85 ± 0.12 | 0.81 ± 0.07 | 0.87 ± 0.07 | 1.00 ± 0.10 | 0.91 ± 0.05 | NS | |
| FGF21 | 11.58 ± 3.85 b | 10.06 ± 3.09 b | 1.12 ± 0.37 a | 0.70 ± 0.16 a | 1.50 ± 0.32 a | 1.00 ± 0.27 a | 1.08 ± 0.28 a | <0.001 | |
| Muscle | ACOX | 1.94 ± 0.19 b | 1.25 ± 0.13 ab | 1.51 ± 0.29 ab | 1.43 ± 0.18 ab | 1.06 ± 0.15 a | 1.00 ± 0.13 a | 1.58 ± 0.20 ab | <0.01 |
| CD36 | 2.59 ± 0.42 b | 1.90 ± 0.79 ab | 1.72 ± 0.41 ab | 1.18 ± 0.16 ab | 0.82 ± 0.14 a | 1.00 ± 0.12 ab | 1.35 ± 0.24 ab | <0.05 | |
| CPT1b | 2.11 ± 0.39 b | 1.01 ± 0.08 a | 1.46 ± 0.36 ab | 1.23 ± 0.14 ab | 0.86 ± 0.12 a | 1.00 ± 0.13 a | 1.34 ± 0.20 ab | <0.01 | |
| EAT | ACCa | 1.08 ± 0.25 | 1.12 ± 0.16 | 0.83 ± 0.11 | 1.00 ± 0.05 | 0.55 ± 0.12 | 1.00 ± 0.20 | 0.73 ± 0.12 | NS |
| FAS | 1.27 ± 0.21 | 1.32 ± 0.15 | 0.81 ± 0.07 | 1.15 ± 0.07 | 0.81 ± 0.20 | 1.00 ± 0.19 | 0.86 ± 0.14 | NS | |
| CD36 | 1.17 ± 0.22 | 1.00 ± 0.11 | 0.85 ± 0.16 | 0.76 ± 0.06 | 0.81 ± 0.16 | 1.00 ± 0.16 | 0.77 ± 0.15 | NS | |
| UCP1 | 4.28 ± 1.33 b | 2.77 ± 1.27 ab | 0.72 ± 0.21 a | 1.22 ± 0.49 ab | 1.28 ± 0.74 ab | 1.00 ± 0.25 ab | 1.06 ± 0.31 ab | <0.05 | |
| UCP2 | 0.97 ± 0.16 ab | 1.08 ± 0.08 ab | 1.17 ± 0.20 ab | 0.99 ± 0.08 ab | 0.78 ± 0.13 a | 1.00 ± 0.06 ab | 0.94 ± 0.08 a | <0.05 | |
| UCP3 | 1.20 ± 0.22 | 0.91 ± 0.18 | 0.79 ± 0.15 | 1.06 ± 0.15 | 0.83 ± 0.11 | 1.00 ± 0.16 | 0.88 ± 0.20 | NS | |
| Hypothalamus | FGF21 | 1.54 ± 0.44 | 0.81 ± 0.15 | 0.73 ± 0.14 | 0.69 ± 0.16 | 1.37 ± 0.58 | 1.00 ± 0.25 | 1.93 ± 0.45 | NS |
| FGF R1 | 0.86 ± 0.07 | 0.89 ± 0.08 | 0.92 ± 0.07 | 0.86 ± 0.07 | 1.09 ± 0.12 | 1.00 ± 0.06 | 1.06 ± 0.08 | NS | |
| FGF R2B | 0.93 ± 0.12 | 0.83 ± 0.15 | 0.63 ± 0.06 | 0.71 ± 0.06 | 0.99 ± 0.20 | 1.00 ± 0.20 | 0.99 ± 0.17 | NS | |
| FGF R2C | 0.84 ± 0.13 a | 0.79 ± 0.08 a | 0.80 ± 0.09 a | 0.78 ± 0.07 a | 1.13 ± 0.14 a | 1.00 ± 0.08 a | 1.14 ± 0.09 a | <0.05 | |
| FGF R3 | 0.96 ± 0.13 | 0.70 ± 0.08 | 0.74 ± 0.08 | 0.82 ± 0.12 | 1.06 ± 0.17 | 1.00 ± 0.10 | 0.97 ± 0.10 | NS | |
| NPY | 0.97 ± 0.25 | 0.64 ± 0.14 | 0.92 ± 0.16 | 0.67 ± 0.10 | 0.68 ± 0.21 | 1.00 ± 0.19 | 0.78 ± 0.11 | NS | |
| AGRP | 0.90 ± 0.10 | 0.81 ± 0.09 | 0.96 ± 0.07 | 0.78 ± 0.13 | 1.01 ± 0.14 | 1.00 ± 0.13 | 1.04 ± 0.10 | NS | |
| Y2R | 0.88 ± 0.13 | 0.80 ± 0.09 | 0.97 ± 0.11 | 0.92 ± 0.09 | 0.72 ± 0.10 | 1.00 ± 0.07 | 0.97 ± 0.06 | NS |
| Organ | Diet | T15 | T25 | T40 | T60 | T75 | P20 | T100 | Diet Effect |
|---|---|---|---|---|---|---|---|---|---|
| Liver | GK | 0.38 ± 0.12 | 0.94 ± 0.15 | 1.25 ± 0.23 | 1.33 ± 0.34 | 1.40 ± 0.27 | 1.00 ± 0.23 | 1.50 ± 0.44 | NS |
| L-PK | 1.04 ± 0.11 | 0.90 ± 0.18 | 1.91 ± 0.50 | 1.65 ± 0.36 | 1.21 ± 0.17 | 1.00 ± 0.18 | 1.03 ± 0.24 | NS | |
| CD36 | 1.39 ± 0.15 | 1.10 ± 0.14 | 0.95 ± 0.13 | 1.23 ± 0.13 | 1.27 ± 0.12 | 1.00 ± 0.11 | 1.02 ± 0.09 | NS | |
| CPT1a | 1.10 ± 0.15 a | 1.11 ± 0.14 a | 1.84 ± 0.35 ab | 2.37 ± 0.51 b | 2.19 ± 0.19 ab | 1.00 ± 0.26 a | 1.74 ± 0.26 ab | <0.01 | |
| ACOX | 0.73 ± 0.06 a | 0.76 ± 0.13 a | 1.24 ± 0.23 abc | 1.83 ± 0.41 bc | 1.94 ± 0.24 c | 1.00 ± 0.12 ab | 1.22 ± 0.15 abc | <0.001 | |
| ACCa | 1.28 ± 0.17 | 1.04 ± 0.13 | 1.23 ± 0.18 | 1.77 ± 0.33 | 1.32 ± 0.14 | 1.00 ± 0.11 | 1.69 ± 0.37 | NS | |
| FAS | 3.01 ± 0.55 b | 2.15 ± 0.44 ab | 2.29 ± 0.41 ab | 1.98 ± 0.45 ab | 1.31 ± 0.21 ab | 1.00 ± 0.10 ab | 2.20 ± 0.51 ab | <0.05 | |
| MTTP | 1.03 ± 0.07 | 0.91 ± 0.10 | 1.00 ± 0.10 | 1.35 ± 0.17 | 1.04 ± 0.17 | 1.00 ± 0.10 | 1.12 ± 0.07 | NS | |
| FGF21 | 17.23 ± 6.40 cde | 35.05 ± 14.42 e | 13.81 ± 2.97 de | 1.80 ± 0.35 ab | 5.37 ± 3.18 abc | 1.00 ± 0.39 a | 4.36 ± 1.28 bcd | <0.001 | |
| Muscle | ACOX | 0.91 ± 0.14 | 1.06 ± 0.13 | 0.90 ± 0.08 | 0.87 ± 0.08 | 0.90 ± 0.06 | 1.00 ± 0.14 | 1.08 ± 0.09 | NS |
| CD36 | 1.59 ± 0.20 b | 1.41 ± 0.19 b | 0.78 ± 0.09 a | 0.75 ± 0.08 a | 0.69 ± 0.08 a | 1.00 ± 0.14 ab | 1.19 ± 0.16 ab | <0.001 | |
| CPT1b | 1.08 ± 0.16 | 1.58 ± 0.33 | 0.85 ± 0.06 | 1.02 ± 0.11 | 0.96 ± 0.06 | 1.00 ± 0.15 | 1.19 ± 0.19 | NS | |
| EAT | ACCa | 0.79 ± 0.15 | 1.22 ± 0.34 | 0.72 ± 0.07 | 0.71 ± 0.10 | 0.48 ± 0.08 | 1.00 ± 0.26 | 0.71 ± 0.11 | NS |
| FAS | 0.70 ± 0.13 | 1.08 ± 0.27 | 0.71 ± 0.08 | 0.75 ± 0.10 | 0.46 ± 0.10 | 1.00 ± 0.22 | 0.71 ± 0.10 | NS | |
| CD36 | 1.05 ± 0.26 | 1.03 ± 0.31 | 0.75 ± 0.12 | 0.61 ± 0.08 | 0.57 ± 0.06 | 1.00 ± 0.20 | 0.71 ± 0.19 | NS | |
| UCP1 | 5.48 ± 1.48 c | 5.24 ± 2.05 bc | 3.40 ± 1.32 abc | 1.03 ± 0.46 abc | 1.43 ± 1.02 abc | 1.00 ± 0.25 ab | 0.68 ± 0.12 a | <0.001 | |
| UCP2 | 1.24 ± 0.41 | 1.22 ± 0.35 | 0.62 ± 0.06 | 0.77 ± 0.09 | 0.63 ± 0.05 | 1.00 ± 0.17 | 0.68 ± 0.13 | NS | |
| UCP3 | 0.35 ± 0.08 a | 0.98 ± 0.29 b | 0.73 ± 0.08 ab | 0.58 ± 0.09 ab | 0.42 ± 0.05 ab | 1.00 ± 0.35 ab | 0.57 ± 0.09 ab | <0.05 | |
| Hypothalamus | FGF21 | 0.71 ± 0.20 | 1.20 ± 0.29 | 0.92 ± 0.20 | 1.45 ± 0.34 | 1.34 ± 0.30 | 1.00 ± 0.22 | 1.29 ± 0.24 | NS |
| FGF R1 | 0.83 ± 0.09 | 1.01 ± 0.08 | 1.09 ± 0.14 | 1.18 ± 0.16 | 1.13 ± 0.13 | 1.00 ± 0.12 | 1.08 ± 0.08 | NS | |
| FGF R2B | 0.78 ± 0.06 | 0.99 ± 0.09 | 1.00 ± 0.16 | 1.08 ± 0.14 | 1.12 ± 0.12 | 1.00 ± 0.12 | 0.98 ± 0.03 | NS | |
| FGF R2C | 0.75 ± 0.07 | 0.97 ± 0.11 | 0.97 ± 0.14 | 1.06 ± 0.15 | 1.07 ± 0.12 | 1.00 ± 0.13 | 0.94 ± 0.02 | NS | |
| FGF R3 | 0.96 ± 0.06 | 1.10 ± 0.05 | 1.08 ± 0.10 | 1.24 ± 0.12 | 1.24 ± 0.13 | 1.00 ± 0.08 | 1.15 ± 0.05 | NS | |
| NPY | 2.13 ± 0.21 c | 1.69 ± 0.14 bc | 1.31 ± 0.09 ab | 1.10 ± 0.11 ab | 1.25 ± 0.21 ab | 1.00 ± 0.06 a | 0.99 ± 0.06 a | <0.001 | |
| AGRP | 2.73 ± 0.26 b | 2.23 ± 0.18 b | 1.42 ± 0.18 a | 1.29 ± 0.16 a | 1.27 ± 0.10 a | 1.00 ± 0.10 a | 1.15 ± 0.06 a | <0.001 | |
| Y2R | 0.78 ± 0.10 | 1.04 ± 0.12 | 1.10 ± 0.19 | 1.18 ± 0.18 | 1.31 ± 0.26 | 1.00 ± 0.14 | 1.16 ± 0.12 | NS | |
| POMC | 0.29 ± 0.04 a | 0.45 ± 0.05 ab | 0.87 ± 0.14 bc | 1.10 ± 0.12 c | 1.14 ± 0.14 c | 1.00 ± 0.15 c | 1.08 ± 0.08 c | <0.001 | |
| CART | 0.88 ± 0.06 | 0.94 ± 0.05 | 1.01 ± 0.06 | 1.12 ± 0.14 | 1.24 ± 0.08 | 1.00 ± 0.04 | 1.08 ± 0.09 | NS | |
| MOR | 0.81 ± 0.06 | 1.16 ± 0.17 | 1.07 ± 0.17 | 1.23 ± 0.23 | 1.34 ± 0.16 | 1.00 ± 0.13 | 1.12 ± 0.11 | NS | |
| MC3R | 0.85 ± 0.11 | 1.08 ± 0.10 | 1.11 ± 0.18 | 1.16 ± 0.17 | 1.03 ± 0.15 | 1.00 ± 0.16 | 1.22 ± 0.16 | NS | |
| MC4R | 0.79 ± 0.10 | 0.92 ± 0.06 | 0.98 ± 0.15 | 1.01 ± 0.15 | 1.45 ± 0.25 | 1.00 ± 0.12 | 1.05 ± 0.09 | NS | |
| CRF | 1.05 ± 0.17 | 1.28 ± 0.10 | 1.36 ± 0.26 | 1.28 ± 0.25 | 1.20 ± 0.14 | 1.00 ± 0.14 | 1.07 ± 0.12 | NS |
Disclaimer/Publisher’s Note: The statements, opinions and data contained in all publications are solely those of the individual author(s) and contributor(s) and not of MDPI and/or the editor(s). MDPI and/or the editor(s) disclaim responsibility for any injury to people or property resulting from any ideas, methods, instructions or products referred to in the content. |
© 2022 by the authors. Licensee MDPI, Basel, Switzerland. This article is an open access article distributed under the terms and conditions of the Creative Commons Attribution (CC BY) license (https://creativecommons.org/licenses/by/4.0/).
Share and Cite
Moro, J.; Roisné-Hamelin, G.; Chaumontet, C.; Even, P.C.; Blais, A.; Cansell, C.; Piedcoq, J.; Gaudichon, C.; Tomé, D.; Azzout-Marniche, D. Lysine or Threonine Deficiency Decreases Body Weight Gain in Growing Rats despite an Increase in Food Intake without Increasing Energy Expenditure in Response to FGF21. Nutrients 2023, 15, 197. https://doi.org/10.3390/nu15010197
Moro J, Roisné-Hamelin G, Chaumontet C, Even PC, Blais A, Cansell C, Piedcoq J, Gaudichon C, Tomé D, Azzout-Marniche D. Lysine or Threonine Deficiency Decreases Body Weight Gain in Growing Rats despite an Increase in Food Intake without Increasing Energy Expenditure in Response to FGF21. Nutrients. 2023; 15(1):197. https://doi.org/10.3390/nu15010197
Chicago/Turabian StyleMoro, Joanna, Gaëtan Roisné-Hamelin, Catherine Chaumontet, Patrick C. Even, Anne Blais, Celine Cansell, Julien Piedcoq, Claire Gaudichon, Daniel Tomé, and Dalila Azzout-Marniche. 2023. "Lysine or Threonine Deficiency Decreases Body Weight Gain in Growing Rats despite an Increase in Food Intake without Increasing Energy Expenditure in Response to FGF21" Nutrients 15, no. 1: 197. https://doi.org/10.3390/nu15010197
APA StyleMoro, J., Roisné-Hamelin, G., Chaumontet, C., Even, P. C., Blais, A., Cansell, C., Piedcoq, J., Gaudichon, C., Tomé, D., & Azzout-Marniche, D. (2023). Lysine or Threonine Deficiency Decreases Body Weight Gain in Growing Rats despite an Increase in Food Intake without Increasing Energy Expenditure in Response to FGF21. Nutrients, 15(1), 197. https://doi.org/10.3390/nu15010197