
Effects of Moringa oleifera Lam. Supplementation on Inflammatory and Cardiometabolic Markers in Subjects with Prediabetes

 , , ,
, , , 
Abstract
:1. Introduction
2. Materials and Methods
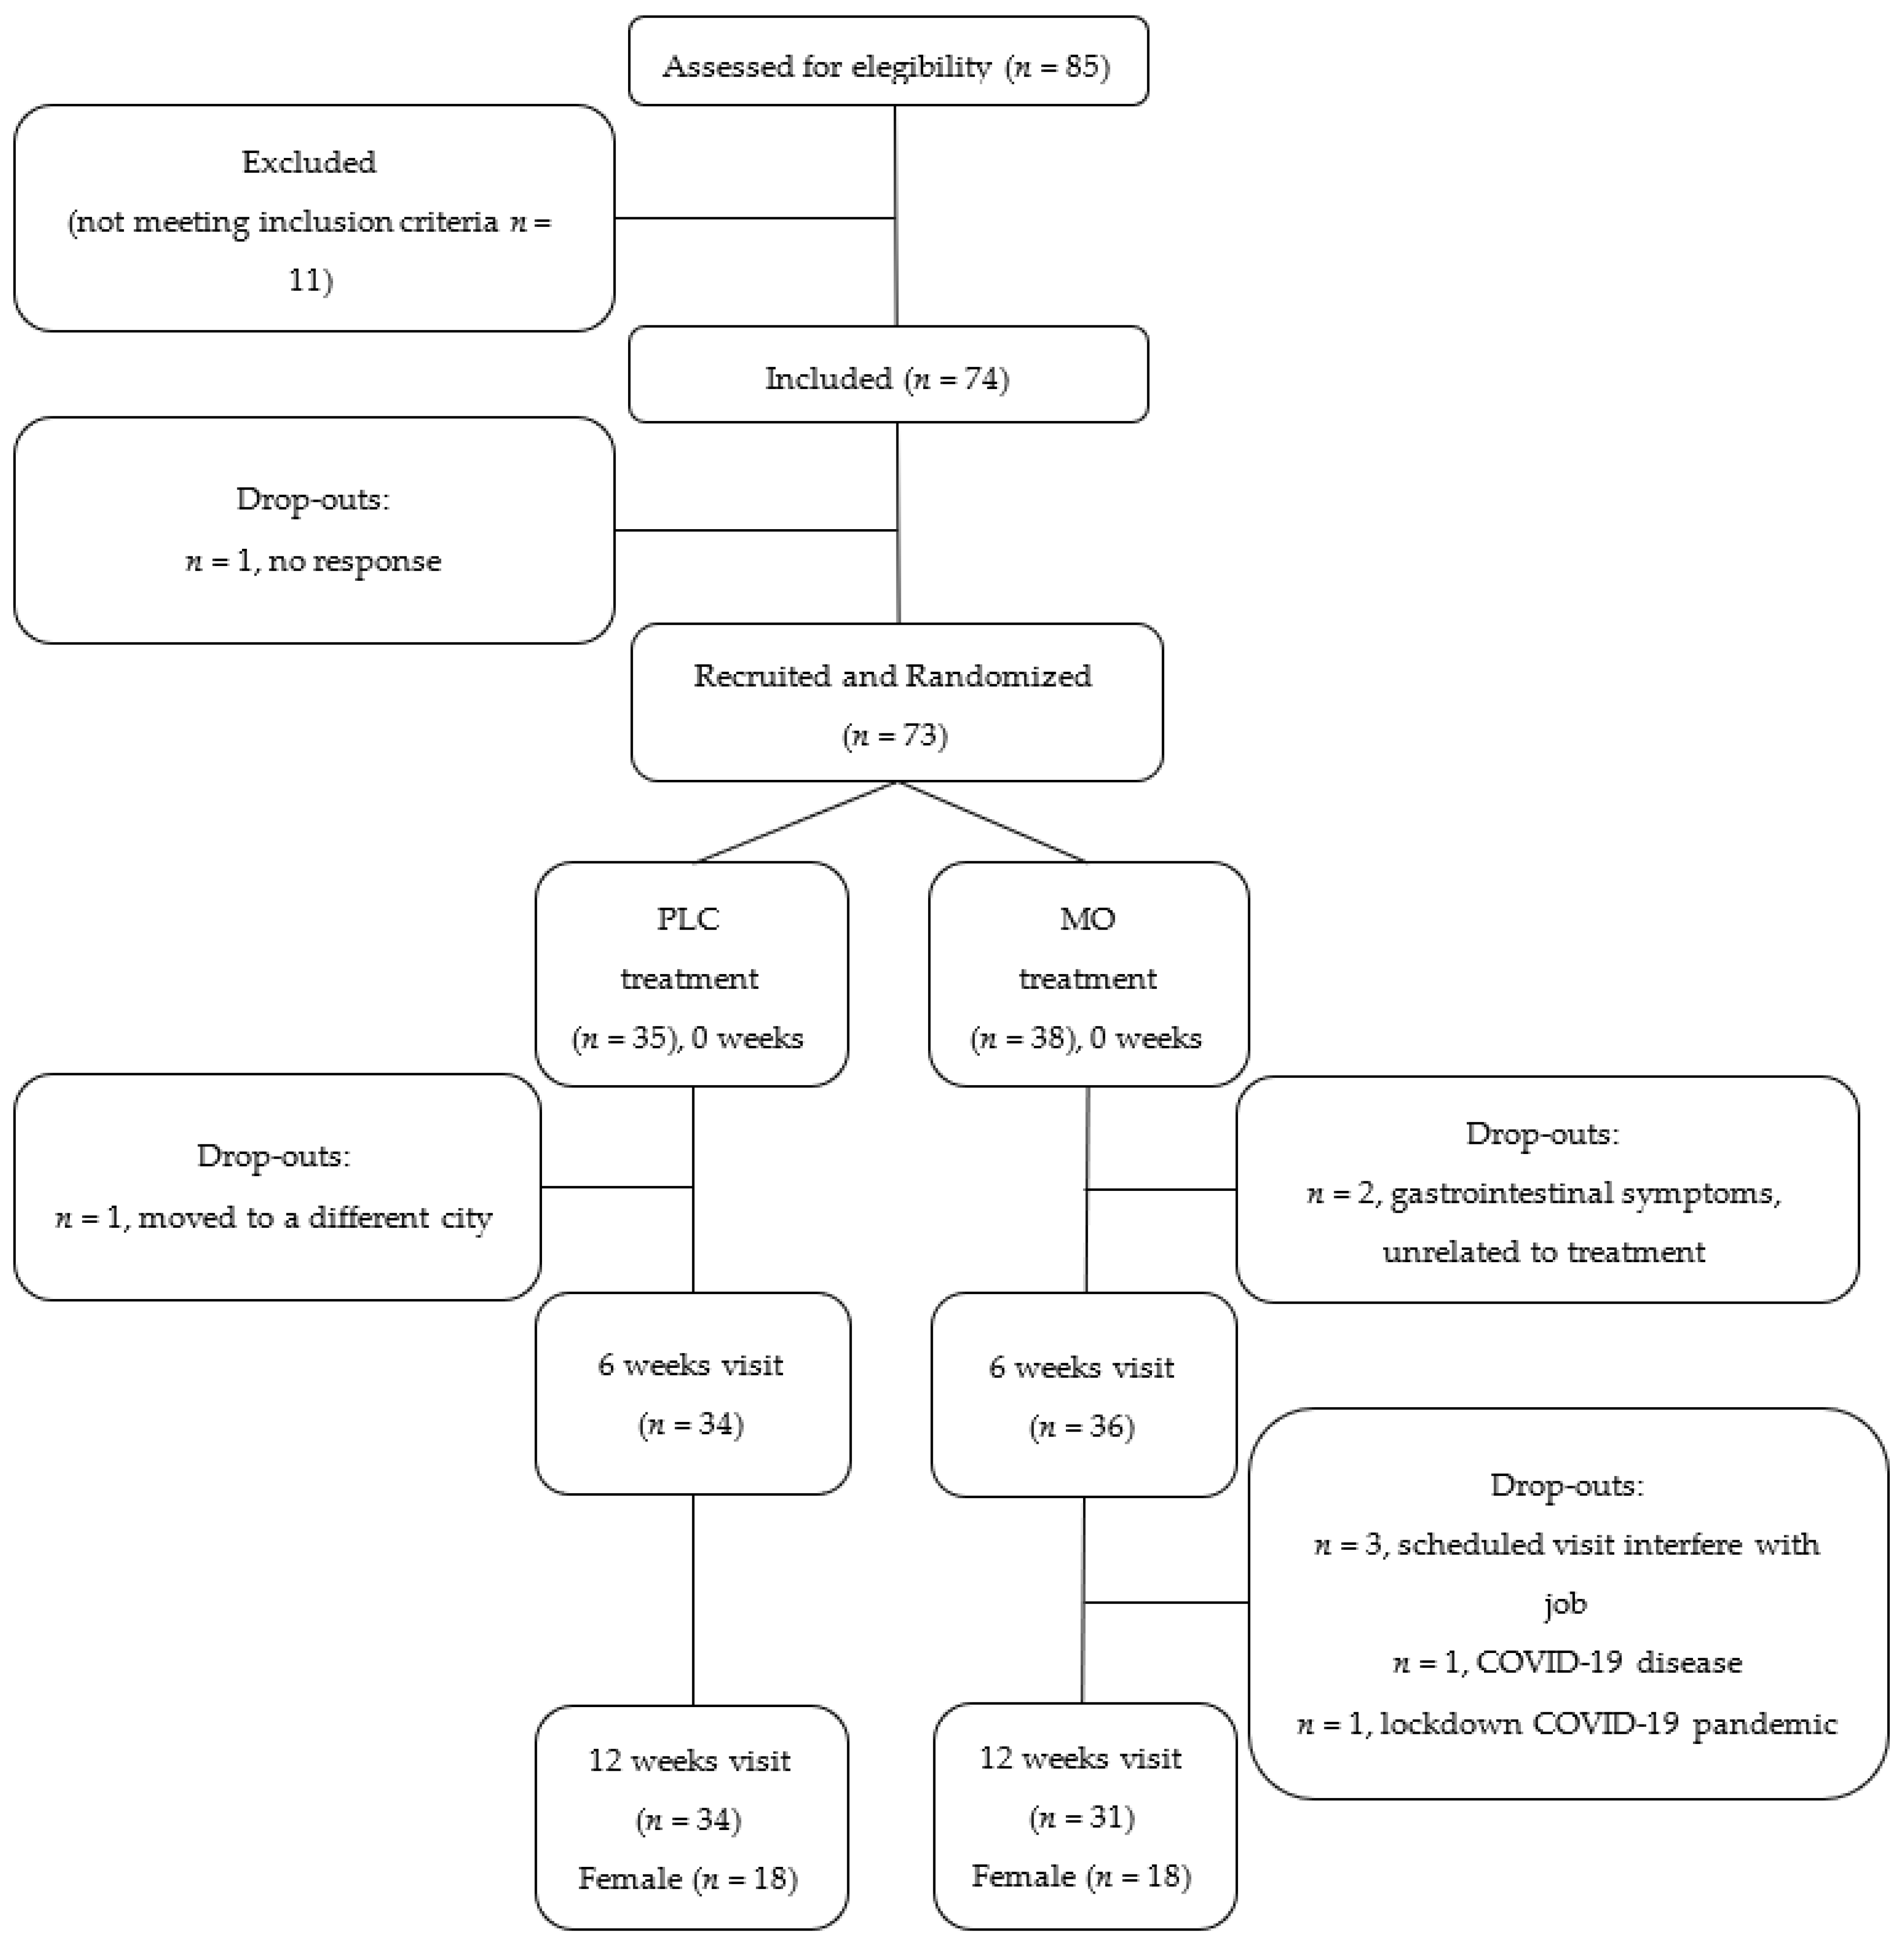
2.1. Study Design
2.2. Study Participants
2.3. Intervention
2.4. Outcomes
2.5. Blood Lipid Profile and Inflammatory Biomarker Analyses
2.6. TAC Assessment
2.7. Blood Pressure
2.8. Fecal Sample Biomarkers
2.9. MO Metabolites in Urine Samples
2.10. Diet and Anthropometry Assessments
2.11. Statistical Analysis
3. Results
4. Discussion
Supplementary Materials
Author Contributions
Funding
Institutional Review Board Statement
Informed Consent Statement
Data Availability Statement
Acknowledgments
Conflicts of Interest
References
- Leone, A.; Spada, A.; Battezzati, A.; Schiraldi, A.; Aristil, J.; Bertoli, S. Cultivation, Genetic, Ethnopharmacology, Phytochemistry and Pharmacology of Moringa oleifera Leaves: An Overview. Int. J. Mol. Sci. 2015, 16, 12791–12835. [Google Scholar] [CrossRef] [PubMed]
- Taher, M.; Bin Nyeem, M.; Ahammed, M.; Hossain, M.; Islam, M.N. Moringa oleifera (Shajna): The wonderful indigenous medicinal plant. Asian J. Med. Biol. Res. 2017, 3, 20–30. [Google Scholar] [CrossRef] [Green Version]
- Anwar, F.; Latif, S.; Ashraf, M.; Gilani, A.H. Moringa oleifera: A food plant with multiple medicinal uses. Phytother. Res. 2007, 21, 17–25. [Google Scholar] [CrossRef] [PubMed]
- Mbikay, M. Therapeutic Potential of Moringa oleifera Leaves in Chronic Hyperglycemia and Dyslipidemia: A Review. Front. Pharmacol. 2012, 3, 24. [Google Scholar] [CrossRef] [Green Version]
- Meireles, D.; Gomes, J.; Lopes, L.; Hinzmann, M.; Machado, J. A review of properties, nutritional and pharmaceutical applications of Moringa oleifera: Integrative approach on conventional and traditional Asian medicine. Adv. Tradit. Med. 2020, 20, 495–515. [Google Scholar] [CrossRef]
- Garza, N.G.G.; Koyoc, J.A.C.; Castillo, J.A.T.; Zambrano, E.A.G.; Ancona, D.B.; Guerrero, L.C.; García, S.R.S. Biofunctional properties of bioactive peptide fractions from protein isolates of moringa seed (Moringa oleifera). J. Food Sci. Technol. 2017, 54, 4268–4276. [Google Scholar] [CrossRef]
- Tian, H.; Liang, Y.; Liu, G.; Li, Y.; Deng, M.; Liu, D.; Guo, Y.; Sun, B. Moringa oleifera polysaccharides regulates caecal microbiota and small intestinal metabolic profile in C57BL/6 mice. Int. J. Biol. Macromol. 2021, 182, 595–611. [Google Scholar] [CrossRef]
- Li, S.; Li, W.; Wu, R.; Yin, R.; Sargsyan, D.; Raskin, I.; Kong, A.N. Epigenome and transcriptome study of moringa isothiocyanate in mouse kidney mesangial cells induced by high glucose, a potential model for diabetic-induced nephropathy. AAPS J. 2019, 22, 8. [Google Scholar] [CrossRef]
- Rajan, T.S.; Giacoppo, S.; Iori, R.; De Nicola, G.R.; Grassi, G.; Pollastro, F.; Bramanti, P.; Mazzon, E. Anti-inflammatory and antioxidant effects of a combination of cannabidiol and moringin in LPS-stimulated macrophages. Fitoterapia 2016, 112, 104–115. [Google Scholar] [CrossRef]
- Amaglo, N.K.; Bennett, R.N.; Lo Curto, R.B.; Rosa, E.A.; Lo Turco, V.; Giuffrida, A.; Lo Curto, A.; Crea, F.; Timpo, F.M. Profiling selected phytochemicals and nutrients in different tissues of the multipurpose tree Moringa oleifera L., grown in Ghana. Food Chem. 2010, 122, 1047–1054. [Google Scholar] [CrossRef]
- Nova, E.; Redondo-Useros, N.; Martínez-García, R.M.; Gómez-Martínez, S.; Díaz-Prieto, L.E.; Marcos, A. Potential of Moringa oleifera to Improve Glucose Control for the Prevention of Diabetes and Related Metabolic Alterations: A Systematic Review of Animal and Human Studies. Nutrients 2020, 12, 2050. [Google Scholar] [CrossRef] [PubMed]
- Islam, Z.; Islam, S.M.R.; Hossen, F.; Mahtab-Ul-Islam, K.; Hasan, M.R.; Karim, R. Moringa oleifera is a Prominent Source of Nutrients with Potential Health Benefits. Int. J. Food Sci. 2021, 2021, 6627265. [Google Scholar] [CrossRef] [PubMed]
- Ahmad, J.; Khan, I.; Johnson, S.K.; Alam, I.; Din, Z.U. Effect of Incorporating Stevia and Moringa in Cookies on Postprandial Glycemia, Appetite, Palatability, and Gastrointestinal Well-Being. J. Am. Coll. Nutr. 2018, 37, 133–139. [Google Scholar] [CrossRef]
- Anthanont, P.; Lumlerdkij, N.; Akarasereenont, P.; Vannasaeng, S.; Sriwijitkamol, A. Moringa oleifera Leaf Increases Insulin Secretion after Single Dose Administration: A Preliminary Study in Healthy Subjects. J. Med. Assoc. Thail. 2016, 99, 308–313. [Google Scholar]
- Fombang, E.N.; Saa, W.R. Antihyperglycemic Activity of Moringa oleifera Lam leaf functional tea in rat models and human subjects. Food Nutr. Sci. 2016, 7, 1021–1032. [Google Scholar] [CrossRef] [Green Version]
- Leone, A.; Bertoli, S.; Di Lello, S.; Bassoli, A.; Ravasenghi, S.; Borgonovo, G.; Forlani, F.; Battezzati, A. Effect of Moringa oleifera Leaf Powder on Postprandial Blood Glucose Response: In Vivo Study on Saharawi People Living in Refugee Camps. Nutrients 2018, 10, 1494. [Google Scholar] [CrossRef] [PubMed] [Green Version]
- Kumari, D.J. Hypoglycemic effect of Moringa oleifera and Azadirachta indica in type-2 diabetes. Bioscan 2010, 5, 211–214. [Google Scholar]
- Giridhari, V.A.; Malathi, D.; Geetha, K. Anti diabetic property of drumstick (Moringa oleifera) leaf tablets. Int. J. Health Nutr. 2011, 2, 1–5. [Google Scholar]
- Kushwaha, S.; Chawla, P.; Kochhar, A. Effect of supplementation of drumstick (Moringa oleifera) and amaranth (Amaranthus tricolor) leaves powder on antioxidant profile and oxidative status among postmenopausal women. J. Food Sci. Technol. 2014, 51, 3464–3469. [Google Scholar] [CrossRef] [Green Version]
- Taweerutchana, R.; Lumlerdkij, N.; Vannasaeng, S.; Akarasereenont, P.; Sriwijitkamol, A. Effect of Moringa oleifera Leaf Capsules on Glycemic Control in Therapy-Naïve Type 2 Diabetes Patients: A Randomized Placebo Controlled Study. Evid.-Based Complement. Altern. Med. 2017, 2017, 6581390. [Google Scholar] [CrossRef] [Green Version]
- Gómez-Martínez, S.; Díaz-Prieto, L.E.; Vicente Castro, I.; Jurado, C.; Iturmendi, N.; Martín-Ridaura, M.C.; Calle, N.; Dueñas, M.; Picón, M.J.; Marcos, A.; et al. Moringa oleifera Leaf Supplementation as a Glycemic Control Strategy in Subjects with Prediabetes. Nutrients 2021, 14, 57. [Google Scholar] [CrossRef] [PubMed]
- Sangrós, F.J.; Torrecilla, J.; Giráldez-García, C.; Carrillo, L.; Mancera, J.; Mur, T.; Franch, J.; Díez, J.; Goday, A.; Serrano, R.; et al. Association of General and Abdominal Obesity with Hypertension, Dyslipidemia and Prediabetes in the PREDAPS Study. Rev. Esp. Cardiol. 2018, 71, 170–177. [Google Scholar] [CrossRef] [PubMed]
- Morigny, P.; Houssier, M.; Mouisel, E.; Langin, D. Adipocyte lipolysis and insulin resistance. Biochimie 2016, 125, 259–266. [Google Scholar] [CrossRef] [PubMed]
- Henderson, G.C. Plasma Free Fatty Acid Concentration as a Modifiable Risk Factor for Metabolic Disease. Nutrients 2021, 13, 2590. [Google Scholar] [CrossRef]
- Joung, H.; Kim, B.; Park, H.; Lee, K.; Kim, H.H.; Sim, H.C.; Do, H.J.; Hyun, C.K.; Do, M.S. Fermented Moringa oleifera decreases hepatic adiposity and ameliorates glucose intolerance in high-fat diet-induced obese mice. J. Med. Food 2017, 20, 439–447. [Google Scholar] [CrossRef]
- Bao, Y.; Xiao, J.; Weng, Z.; Lu, X.; Shen, X.; Wang, F. A phenolic glycoside from Moringa oleifera Lam. improves the carbohydrate and lipid metabolisms through AMPK in db/db mice. Food Chem. 2020, 311, 125948. [Google Scholar] [CrossRef]
- Arulselvan, P.; Tan, W.S.; Gothai, S.; Muniandy, K.; Fakurazi, S.; Esa, N.M.; Alarfaj, A.A.; Kumar, S.S. Anti-Inflammatory Potential of Ethyl Acetate Fraction of Moringa oleifera in Downregulating the NF-κB Signaling Pathway in Lipopolysaccharide-Stimulated Macrophages. Molecules 2016, 21, 1452. [Google Scholar] [CrossRef] [Green Version]
- Luetragoon, T.; Pankla Sranujit, R.; Noysang, C.; Thongsri, Y.; Potup, P.; Suphrom, N.; Nuengchamnong, N.; Usuwanthim, K. Bioactive Compounds in Moringa oleifera Lam. Leaves Inhibit the Pro-Inflammatory Mediators in Lipopolysaccharide-Induced Human Monocyte-Derived Macrophages. Molecules 2020, 25, 191. [Google Scholar] [CrossRef] [Green Version]
- Tang, Y.; Choi, E.J.; Han, W.C.; Oh, M.; Kim, J.; Hwang, J.Y.; Park, P.J.; Moon, S.H.; Kim, Y.S.; Kim, E.K. Moringa oleifera from Cambodia ameliorates oxidative stress, hyperglycemia, and kidney dysfunction in type 2 diabetic mice. J. Med. Food 2017, 20, 502–510. [Google Scholar] [CrossRef]
- Omodanisi, E.I.; Aboua, Y.G.; Chegou, N.N.; Oguntibeju, O.O. Hepatoprotective, Antihyperlipidemic, and Anti-inflammatory Activity of Moringa oleifera in Diabetic-induced Damage in Male Wistar Rats. Pharmacogn. Res. 2017, 9, 182–187. [Google Scholar] [CrossRef]
- Waterman, C.; Cheng, D.M.; Rojas-Silva, P.; Poulev, A.; Dreifus, J.; Lila, M.A.; Raskin, I. Stable, water extractable isothiocyanates from Moringa oleifera leaves attenuate inflammation in vitro. Phytochemistry 2014, 103, 114–122. [Google Scholar] [CrossRef] [PubMed] [Green Version]
- Cheng, D.; Gao, L.; Su, S.; Sargsyan, D.; Wu, R.; Raskin, I.; Kong, A.-N. Moringa isothiocyanate activates Nrf2: Potential role in diabetic nephropathy. AAPS J. 2019, 21, 31. [Google Scholar] [CrossRef] [PubMed]
- Sailaja, B.S.; Aita, R.; Maledatu, S.; Ribnicky, D.; Verzi, M.P.; Raskin, I. Moringa isothiocyanate-1 regulates Nrf2 and NF-κB pathway in response to LPS-driven sepsis and inflammation. PLoS ONE 2021, 16, e0248691. [Google Scholar] [CrossRef] [PubMed]
- Aekthammarat, D.; Tangsucharit, P.; Pannangpetch, P.; Sriwantana, T.; Sibmooh, N. Moringa oleifera leaf extract enhances endothelial nitric oxide production leading to relaxation of resistance artery and lowering of arterial blood pressure. Biomed. Pharmacother. 2020, 130, 110605. [Google Scholar] [CrossRef]
- Ma, K.; Wang, Y.; Wang, M.; Wang, Z.; Wang, X.; Ju, X.; He, R. Antihypertensive activity of the ACE-renin inhibitory peptide derived from Moringa oleifera protein. Food Funct. 2021, 12, 8994–9006. [Google Scholar] [CrossRef]
- Nambiar, V.S.; Guin, P.; Parnami, S.; Daniel, M. Impact of antioxidants from drumstick leaves on the lipid profile of hyperlipidemics. J. Herb. Med. Toxicol. 2010, 4, 165–172. [Google Scholar]
- Chan Sun, M.; Ruhomally, Z.B.; Boojhawon, R.; Neergheen-Bhujun, V.S. Consumption of Moringa oleifera Lam. Leaves Lowers Postprandial Blood Pressure. J. Am. Coll. Nutr. 2020, 39, 54–62. [Google Scholar] [CrossRef]
- American Diabetes Association. Standards of medical care in diabetes. Diabetes Care 2013, 36, S11–S66. [Google Scholar] [CrossRef] [Green Version]
- Domínguez-Perles, R.; Medina, S.; Moreno, D.A.; García-Viguera, C.; Ferreres, F.; Gil-Izquierdo, A. A new ultra-rapid UHPLC/MS/MS method for assessing glucoraphanin and sulforaphane bioavailability in human urine. Food Chem. 2014, 143, 132–138. [Google Scholar] [CrossRef]
- Gallagher, D.; Heymsfield, S.B.; Heo, M.; Jebb, S.A.; Murgatroyd, P.R.; Sakamoto, Y. Healthy percentage body fat ranges: An approach for developing guidelines based on body mass index. Am. J. Clin Nutr. 2000, 72, 694–701. [Google Scholar] [CrossRef]
- Martínez-González, M.A.; García-Arellano, A.; Toledo, E.; Salas-Salvadó, J.; Buil-Cosiales, P.; Corella, D.; Covas, M.I.; Schröder, H.; Arós, F.; Gómez-Gracia, E.; et al. A 14-Item Mediterranean Diet Assessment Tool and Obesity Indexes among High-Risk Subjects: The PREDIMED Trial. PLoS ONE 2012, 7, e43134. [Google Scholar] [CrossRef] [PubMed] [Green Version]
- Ainsworth, B.E.; Haskell, W.L.; Herrmann, S.D.; Meckes, N.; Bassett, D.R.; Tudor-Locke, C.; Greer, J.L.; Vezina, J.; Whitt-Glover, M.C.; Leon, A.S. Compendium of physical activities: A second update of codes and MET values. Med. Sci. Sports Exerc. 2011, 43, 1575–1581. [Google Scholar] [CrossRef] [PubMed] [Green Version]
- Khan, W.; Parveen, R.; Chester, K.; Parveen, S.; Ahmad, S. Hypoglycemic Potential of Aqueous Extract of Moringa oleifera Leaf and In Vivo GC-MS Metabolomics. Front. Pharmacol. 2017, 8, 577. [Google Scholar] [CrossRef] [PubMed] [Green Version]
- Abd Eldaim, M.A.; Shaban Abd Elrasoul, A.; Abd Elaziz, S.A. An aqueous extract from Moringa oleifera leaves ameliorates hepatotoxicity in alloxan-induced diabetic rats. Biochem. Cell Biol. 2017, 95, 524–530. [Google Scholar] [CrossRef] [PubMed]
- Waterman, C.; Rojas-Silva, P.; Tumer, T.B.; Kuhn, P.; Richard, A.J.; Wicks, S.; Stephens, J.M.; Wang, Z.; Mynatt, R.; Cefalu, W.; et al. Isothiocyanate-rich Moringa oleifera extract reduces weight gain, insulin resistance, and hepatic gluconeogenesis in mice. Mol. Nutr. Food Res. 2015, 59, 1013–1024. [Google Scholar] [CrossRef] [Green Version]
- Gao, X.; Xie, Q.; Liu, L.; Kong, P.; Sheng, J.; Xiang, H. Metabolic adaptation to the aqueous leaf extract of Moringa oleifera Lam.-supplemented diet is related to the modulation of gut microbiota in mice. Appl. Microbiol. Biotechnol. 2017, 101, 5115–5130. [Google Scholar] [CrossRef]
- Duarte, K.; Thomas, B.; Varma, S.R.; Kamath, V.; Shetty, B.; Kuduruthullah, S.; Nambiar, M. Antiplaque Efficacy of a Novel Moringa oleifera Dentifrice: A Randomized Clinical Crossover Study. Eur. J. Dent. 2022. [Google Scholar] [CrossRef]
- Luetragoon, T.; Sranujit, R.P.; Noysang, C.; Thongsri, Y.; Potup, P.; Somboonjun, J.; Maichandi, N.; Suphrom, N.; Sangouam, S.; Usuwanthim, K. Evaluation of Anti-Inflammatory Effect of Moringa oleifera Lam. and Cyanthillium cinereum (Less) H. Rob. Lozenges in Volunteer Smokers. Plants 2021, 10, 1336. [Google Scholar] [CrossRef]
- Wang, F.; Long, S.; Zhang, J. Moringa oleifera Lam. leaf extract safely inhibits periodontitis by regulating the expression of p38α/MAPK14-OPG/RANKL. Arch. Oral Biol. 2021, 132, 105280. [Google Scholar] [CrossRef]
- Siddhuraju, P.; Becker, K. Antioxidant properties of various solvent extracts of total phenolic constituents from three different agroclimatic origins of drumstick tree (Moringa oleifera Lam.) leaves. J. Agric. Food Chem. 2003, 51, 2144–2155. [Google Scholar] [CrossRef]
- Ngamukote, S.; Khannongpho, T.; Siriwatanapaiboon, M.; Sirikwanpong, S.; Dahlan, W.; Adisakwattana, S. Moringa Oleifera leaf extract increases plasma antioxidant status associated with reduced plasma malondialdehyde concentration without hypoglycemia in fasting healthy volunteers. Chin. J. Integr. Med. 2016. [Google Scholar] [CrossRef] [PubMed]
- Costantini, D. On the measurement of circulating antioxidant capacity and the nightmare of uric acid. Methods Ecol. Evol. 2011, 2, 321–325. [Google Scholar] [CrossRef]
- Fombang, N.E.; BlaiseBouba, B.; Ngaruoa. Management of Hypertension in Normal and Obese Hypertensive Patients through Supplementation with Moringa Oleifera Lam Leaf Powder. Indian J. Nutr. 2016, 3, 3–7. [Google Scholar]
- Pigsborg, K.; Magkos, F. Metabotyping for Precision Nutrition and Weight Management: Hype or Hope? Curr. Nutr. Rep. 2022. [Google Scholar] [CrossRef] [PubMed]
- Zheng, J.S.; Ordovás, J.M. Precision nutrition for gut microbiome and diabetes research: Application of nutritional n-of-1 clinical trials. J. Diabetes 2021, 13, 1059–1061. [Google Scholar] [CrossRef] [PubMed]
- Jardon, K.M.; Canfora, E.E.; Goossens, G.H.; Blaak, E.E. Dietary macronutrients and the gut microbiome: A precision nutrition approach to improve cardiometabolic health. Gut 2022. [Google Scholar] [CrossRef]

| PLC (n = 34) | MO (n = 31) | p# | |
|---|---|---|---|
| BMI < 25, n (%) | 6 (18) | 4 (13) | 0.561 |
| 25–29.9, n (%) | 17 (50) | 13 (42) | |
| ≥30, n (%) | 11 (32) | 14 (45) | |
| Fat_Status | 0.683 | ||
| Normal, n (%) | 8 (23.5) | 6 (19.4) | |
| Above normal, n (%) | 26 (76.5) | 25 (80.6) | |
| Body fat excess (%) a | 5.1 ± 6.2 | 5.7 ± 4.4 | 0.327 |
| Lipid lowering agents, n (%) | 8 (23.5) | 10 (32.3) | 0.432 |
| Antihypertensive agents, n (%) | 9 (26.5) | 7 (22.6) | 0.716 |
| MEDAS score | 9.5 ± 2.5 | 10.2 ± 1.8 | 0.208 |
| Physical activity (kcal/week) | 4591 ± 2831 | 3890 ± 2176 | 0.279 |
| Normal Body Fat % (n = 14) | High Body Fat % (n = 51) | p | |
|---|---|---|---|
| Male:Female #, n (%) | 7:7 (50:50) | 22:29 (43:57) | 0.647 |
| Age (year) | 53.3 ± 11.4 | 56.9 ± 9.6 | 0.116 |
| BMI | 24.3 ± 1.9 | 30.2 ± 3.3 | <0.001 |
| <25 # (n) | 10 | 0 | <0.001 |
| WC (men) | 87.6 ± 5.3 | 101.8 ± 9.7 | <0.001 |
| (women) | 84.7 ± 5.8 | 94.9 ± 9.7 | <0.001 |
| Glucose (mg/mL) | 98.3 ± 9.6 | 105.3 ± 14.1 | 0.042 |
| HbA1c (%) | 5.7 ± 0.3 | 5.9 ± 0.3 | 0.014 |
| Uric acid (mg/dL) | 5.4 ± 0.7 | 5.6 ± 1.4 | 0.246 |
| GOT (UI/L) Φ | 21.50 (17.75–25.50) | 22.00 (19.00–27.00) | 0.835 |
| GPT (UI/L) Φ | 20.50 (15.00–31.50) | 26.00 (21.00–33.00) | 0.089 |
| GGT (UI/L) Φ | 20.00 (14.75–29.75) | 24.00 (19.00–36.00) | 0.177 |
| Total Cholesterol (mg/dL) | 207.0 ± 38.1 | 202.1 ± 33.7 | 0.327 |
| TAG (mg/dL) | 83.6 ± 18.9 | 111.8 ± 47.3 | 0.003 |
| HDL-C (mg/dL) | 58.2 ± 12.3 | 58.1 ± 13.3 | 0.488 |
| LDL-C (mg/dL) | 131.9 ± 34.2 | 121.7 ± 31.5 | 0.147 |
| VLDL-C (mg/dL) | 16.9 ± 3.9 | 22.4 ± 9.4 | 0.004 |
| hsCRP (mg/dL) Φ | 0.03 (0.006–0.09) | 0.16 (0.07–0.51) | 0.001 |
| 0 Weeks | 6 Weeks | 12 Weeks | MIXED Model p # | Rate of Change a 0 Weeks–12 Weeks | ||
|---|---|---|---|---|---|---|
| MCP-1 (pg/mL) | PLC | 67, 82 ± 57 | 69, 77 ± 42 | 69, 77 ± 36 | 0.328 | 0.063 ± 0.418 |
| MO | 63, 71 ± 35 | 70, 64 ± 24 | 57, 69 ± 45 | −0.002 ± 0.312 | ||
| NS | ||||||
| TNF-α (pg/mL) | PLC | 6.0, 7.4 ± 3.7 | 6.4, 7.1 ± 3.5 | 5.5, 6.7 ± 3.1 | 0.291 | −0.057 ± 0.232 |
| MO | 5.7, 6.4 ± 2.4 | 6.5, 6.8 ± 2.8 | 5.5, 6.0 ± 2.3 | −0.034 ± 0.279 | ||
| NS | ||||||
| IL-6 (pg/mL) | PLC | 1.8, 2.6 ± 3.0 | 1.7, 3.7 ± 7.3 | 1.8, 2.3 ± 2.1 | 0.607 | −0.012 ± 0.599 |
| MO | 1.3, 3.6 ± 7.9 | 1.7, 4.9 ± 11.5 | 1.2, 3.2 ± 9.1 | −0.158 ± 0.368 | ||
| NS | ||||||
| IL-1β (pg/mL) | PLC | 1.4, 1.7 ± 1.1 | 1.3, 1.7 ± 1.0 | 1.3, 1.6 ± 0.9 | 0.908 | −0.008 ± 0.372 |
| MO | 1.4, 1.5 ± 0.8 | 1.3, 1.5 ± 0.8 | 1.1, 1.3 ± 0.6 | −0.061 ± 0.328 | ||
| NS | ||||||
| hsCRP (pg/mL) | PLC | 0.15, 0.40 ± 0.64 | 0.11, 0.31 ± 0.67 | 0.12, 0.30 ± 0.50 | 0.359 | 0.457 ± 2.457 |
| MO | 0.10, 0.23 ± 0.41 | 0.11, 0.19 ± 0.21 | 0.11, 0.19 ± 0.22 | 1.189 ± 3.423 | ||
| NS | ||||||
| Leptin (ng/mL) | PLC | 5.63, 7.59 ± 7.97 | 6.61, 7.75 ± 8.29 | 5.66, 6.72 ± 5.45 | 0.343 | 0.072 ± 0.454 |
| MO | 6.48, 7.15 ± 4.68 | 8.35, 7.96 ± 4.73 | 5.87, 6.99 ± 4.95 | −0.017 ± 0.387 | ||
| NS | ||||||
| Adiponectin (µg/mL) | PLC | 23.1, 27.7 ± 21.7 | 21.09, 24.5 ± 16.6 | 15.42, 18.5 ± 12.0 | 0.871 | −0.242 ± 0.338 |
| MO | 23.4, 26.5 ± 16.1 | 15.91, 23.2 ± 16.4 | 15.60, 18.8 ± 10.9 | −0.262 ± 0.252 | ||
| NS |
| 0 Weeks | 6 Weeks | 12 Weeks | MIXED Model p # | Rate of Change 0 Weeks–12 Weeks a | ||
|---|---|---|---|---|---|---|
| Total Cholesterol (mg/dL) | PLC | 206.4 ± 36.4 | 207.7 ± 36.0 | 211.2 ± 34.6 | 0.494 | 0.033 ± 0.122 |
| MO | 197.9 ± 31.5 | 208.6 ± 29.1 | 203.1 ± 35.0 | 0.011 ± 0.123 | ||
| NS | ||||||
| TAG (mg/dL) | PLC | 102.2 ± 46.5 | 106.7 ± 43.2 | 113.0 ± 51.2 | 0.824 | 0.143 ± 0.352 |
| MO | 110.2 ± 43.3 | 115.82 ± 49.5 | 121.8 ± 72.8 | 0.110 ± 0.297 | ||
| NS | ||||||
| HDL-C (mg/dL) | PLC | 57.8 ± 12.0 | 59.6 ± 13.4 | 61.8 ± 15.0 | 0.608 | 0.073 ± 0.157 |
| MO | 57.8 ± 14.3 | 59.1 ± 14.7 | 58.9 ± 14.9 | 0.026 ± 0.176 | ||
| NS | ||||||
| LDL-C (mg/dL) | PLC | 128.1 ± 34.4 | 126.8 ± 33.2 | 126.7 ± 34.5 | 0.307 | 0.001 ± 0.155 |
| MO | 118.1 ± 27.9 | 126.4 ± 27.4 | 119.8 ± 30.0 | 0.000 ± 0.184 | ||
| NS | ||||||
| VLDL-C (mg/dL) | PLC | 20.4 ± 9.3 | 21.3 ± 8.6 | 22.7 ± 10.1 | 0.776 | 0.145 ± 0.349 |
| MO | 22.1 ± 8.5 | 23.1 ± 9.9 | 24.4 ± 14.6 | 0.096 ± 0.296 | ||
| NS | ||||||
| TAC | PLC | 1.34 ± 0.32 | 1.29 ± 0.37 | 1.30 ± 0.45 | 0.134 | −0.01 ± 0.32 |
| MO | 1.22 ± 0.42 | 1.27 ± 0.39 | 1.09 ± 0.44 | 0.03 ± 0.57 | ||
| NS | ||||||
| 0 Weeks PLC, n = 34; MO, n = 29 | 6 Weeks PLC, n = 29; MO, n = 22 | 12 Weeks PLC, n = 26; MO, n = 18 | MIXED Model p # | Rate of Change 0 Weeks–12 Weeks a PLC, n = 26; MO, n = 18. | ||
|---|---|---|---|---|---|---|
| SBP (mmHg) | PLC | 129 ± 15 | 127 ± 187 | 128 ± 16 | 0.807 | −0.005 ± 0.099 |
| MO | 129 ± 15 | 125 ± 11 | 126 ± 11 | −0.011 ± 0.077 | ||
| NS | ||||||
| DBP (mmHg) | PLC | 79 ± 9 | 78 ± 11 | 81 ± 11 | 0.441 | 0.007 ± 0.083 |
| MO | 80 ± 9 | 76 ± 8 | 77 ± 8 | −0.031 ± 0.063 | ||
| NS | ||||||
| 0 Weeks | 6 Weeks | 12 Weeks | MIXED Model p # | Rate of Change 0 Weeks–12 Weeks a | ||
|---|---|---|---|---|---|---|
| Calprotectin (µg/mL) | PLC | 25; 73 ± 95 | - | 30; 58 ± 70 | 0.851 | 0.0; 0.5 ± 1.6 |
| MO | 32; 58 ± 69 | - | 32; 59 ± 63 | 0.1; 0.6 ± 1.6 | ||
| NS | ||||||
| sIgA (µg/mL) | PLC | 1448; 2017 ± 1856 | - | 1402; 2208 ± 2437 | 0.941 | −0.1; 1.5 ± 5.8 |
| MO | 1343; 1663 ± 1478 | - | 1245; 2187 ± 2154 | −0.2; 1.0 ± 3.5 | ||
| NS | ||||||
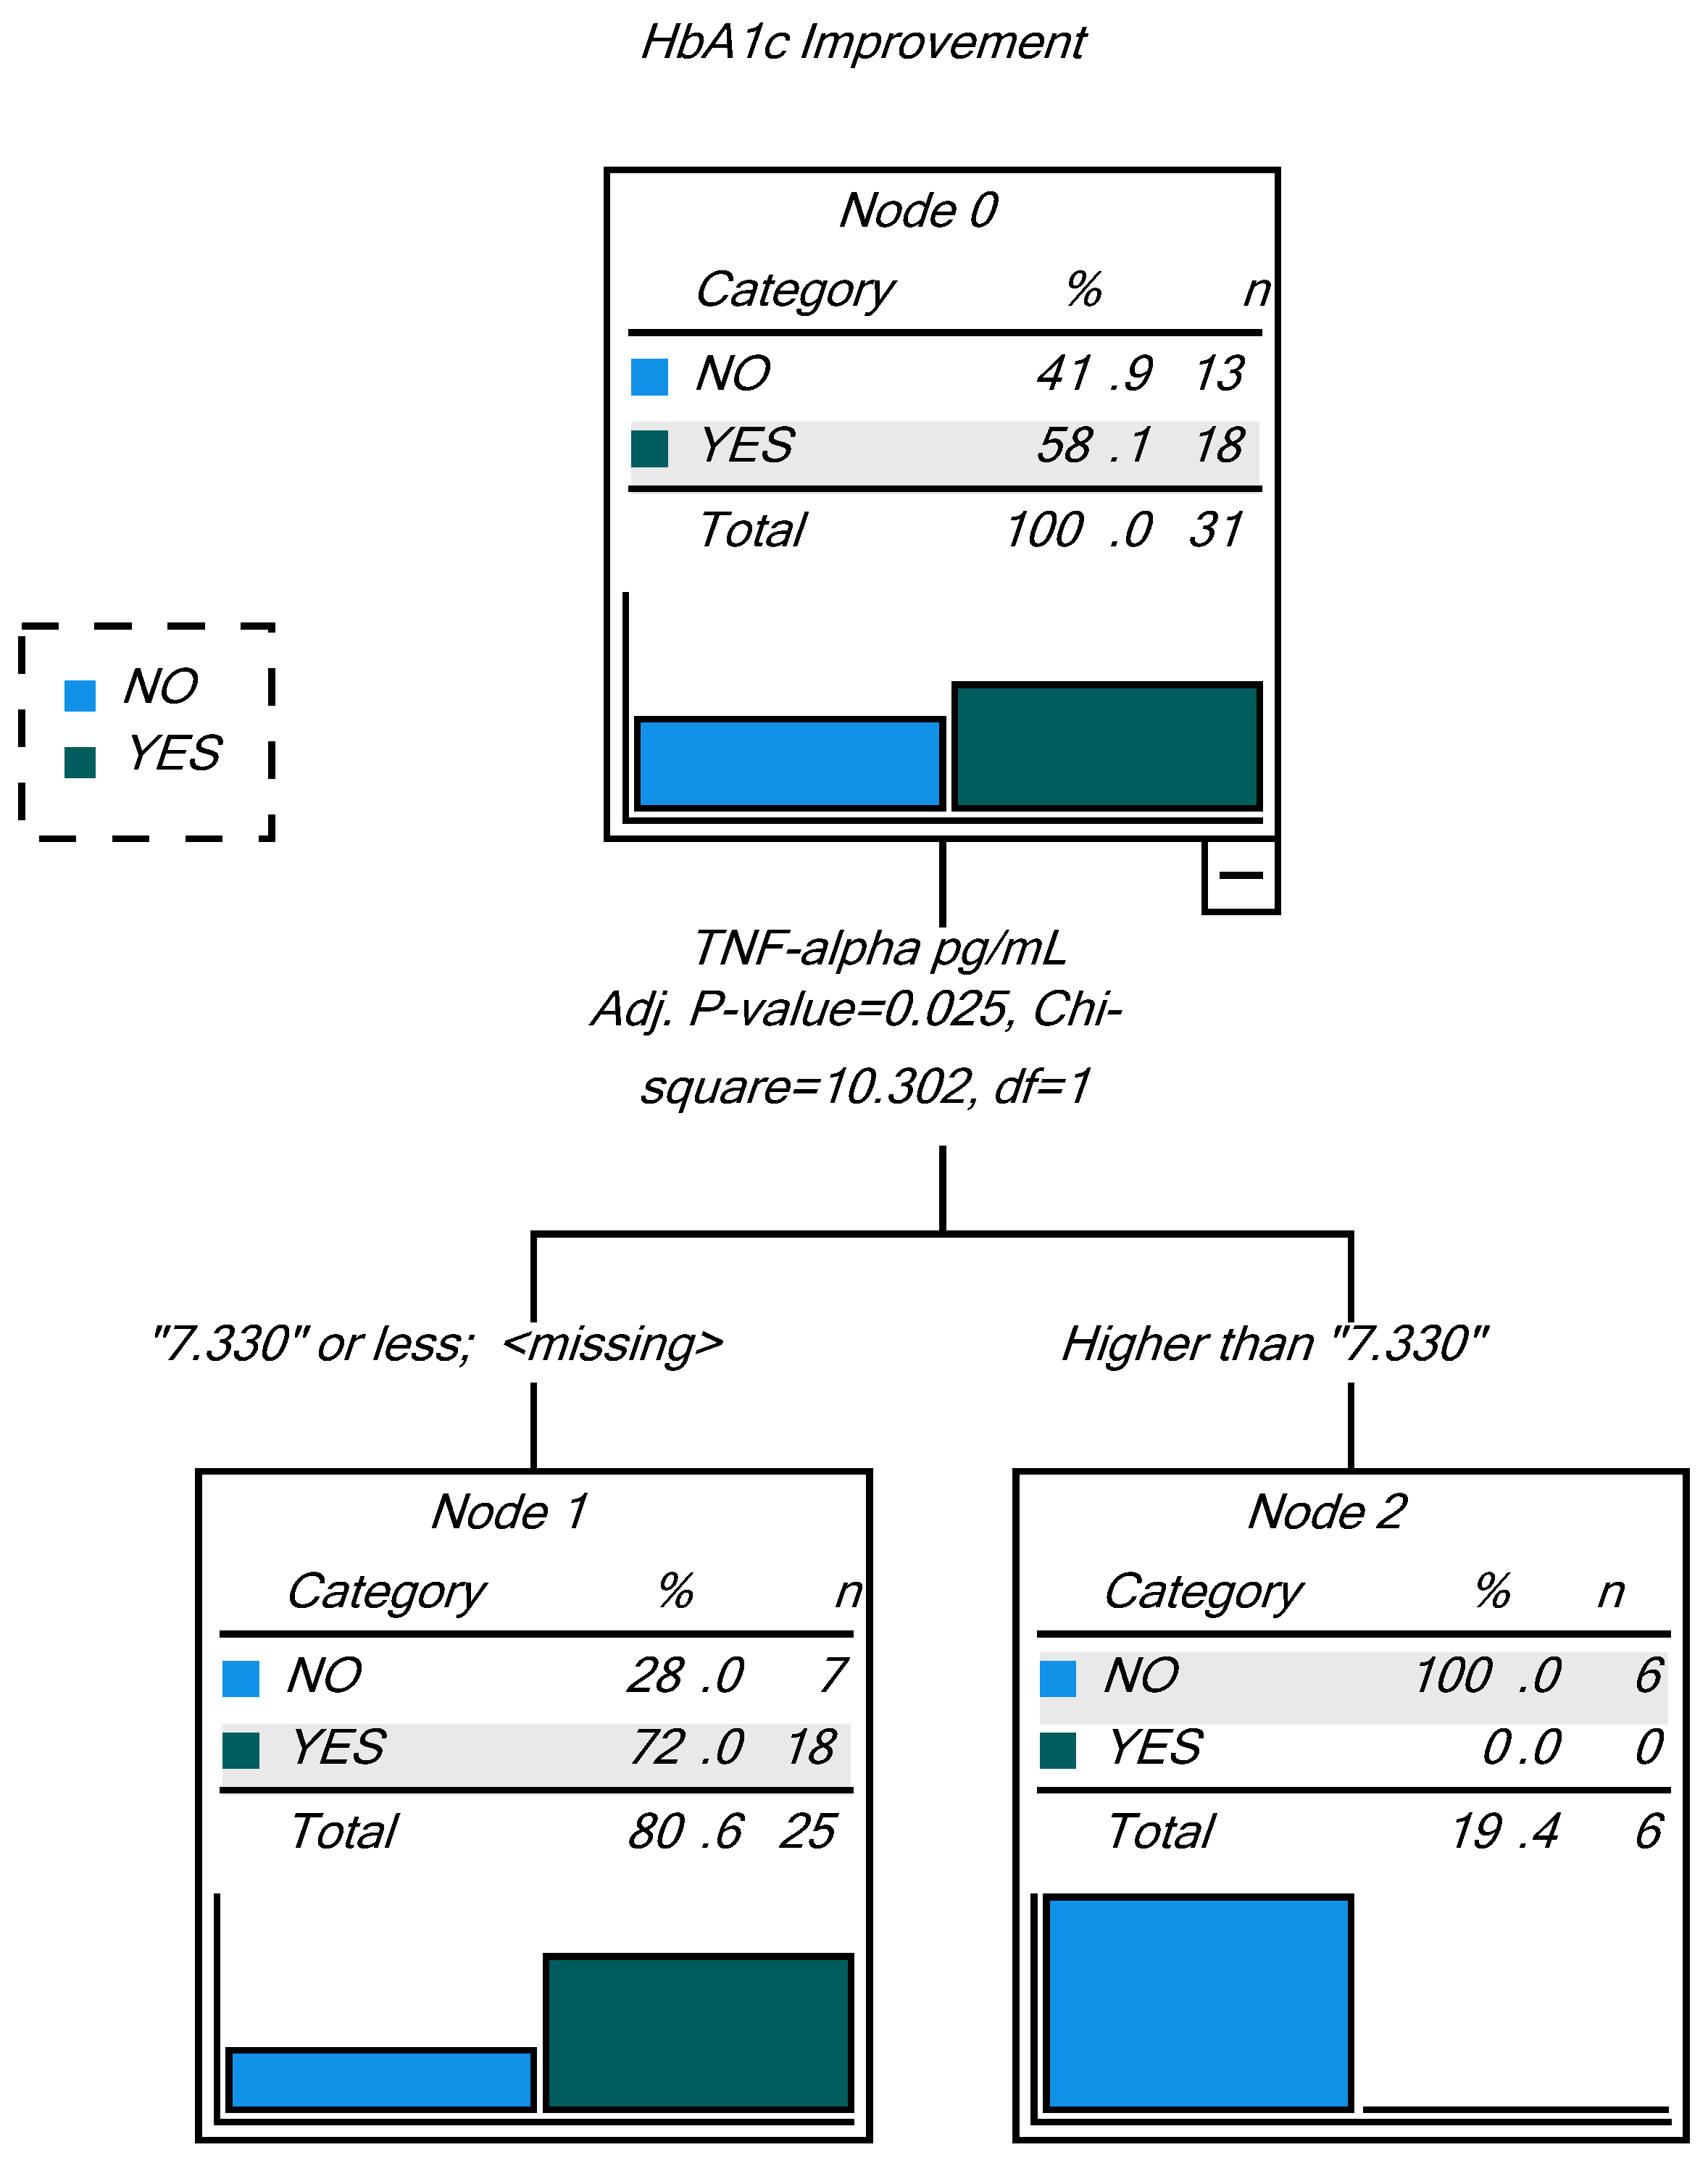
| Observed | Predicted | ||
|---|---|---|---|
| NO | YES | Percent Correct | |
| NO | 6 | 7 | 46.2% |
| YES | 0 | 18 | 100.0% |
| Overall Percentage | 19.4% | 80.6% | 77.4% |
Publisher’s Note: MDPI stays neutral with regard to jurisdictional claims in published maps and institutional affiliations. |
© 2022 by the authors. Licensee MDPI, Basel, Switzerland. This article is an open access article distributed under the terms and conditions of the Creative Commons Attribution (CC BY) license (https://creativecommons.org/licenses/by/4.0/).
Share and Cite
Díaz-Prieto, L.E.; Gómez-Martínez, S.; Vicente-Castro, I.; Heredia, C.; González-Romero, E.A.; Martín-Ridaura, M.d.C.; Ceinos, M.; Picón, M.J.; Marcos, A.; Nova, E. Effects of Moringa oleifera Lam. Supplementation on Inflammatory and Cardiometabolic Markers in Subjects with Prediabetes. Nutrients 2022, 14, 1937. https://doi.org/10.3390/nu14091937
Díaz-Prieto LE, Gómez-Martínez S, Vicente-Castro I, Heredia C, González-Romero EA, Martín-Ridaura MdC, Ceinos M, Picón MJ, Marcos A, Nova E. Effects of Moringa oleifera Lam. Supplementation on Inflammatory and Cardiometabolic Markers in Subjects with Prediabetes. Nutrients. 2022; 14(9):1937. https://doi.org/10.3390/nu14091937
Chicago/Turabian StyleDíaz-Prieto, Ligia E., Sonia Gómez-Martínez, Iván Vicente-Castro, Carlos Heredia, Elena A. González-Romero, María del Carmen Martín-Ridaura, Mercedes Ceinos, María J. Picón, Ascensión Marcos, and Esther Nova. 2022. "Effects of Moringa oleifera Lam. Supplementation on Inflammatory and Cardiometabolic Markers in Subjects with Prediabetes" Nutrients 14, no. 9: 1937. https://doi.org/10.3390/nu14091937
APA StyleDíaz-Prieto, L. E., Gómez-Martínez, S., Vicente-Castro, I., Heredia, C., González-Romero, E. A., Martín-Ridaura, M. d. C., Ceinos, M., Picón, M. J., Marcos, A., & Nova, E. (2022). Effects of Moringa oleifera Lam. Supplementation on Inflammatory and Cardiometabolic Markers in Subjects with Prediabetes. Nutrients, 14(9), 1937. https://doi.org/10.3390/nu14091937