Article

Temporal Associations between Tri-Ponderal Mass Index and Blood Pressure in Chinese Children: A Cross-Lag Analysis

Department of Epidemiology and Health Statistics, School of Public Health, Qingdao University, Qingdao 266071, China
*
Author to whom correspondence should be addressed.
Nutrients 2022, 14(9), 1783; https://doi.org/10.3390/nu14091783
Submission received: 18 January 2022 / Revised: 20 April 2022 / Accepted: 22 April 2022 / Published: 24 April 2022
(This article belongs to the Section Pediatric Nutrition)

Abstract

:
Background: No longitudinal studies have explored the relationship between tri-ponderal mass index (TMI) and blood pressure (BP) in children. This study is aimed to investigate the temporal associations between TMI and BP among children in China. Methods: A longitudinal study was carried out with Chinese children from 2014 to 2019. Data of the anthropometric examination and blood pressure were collected annually. TMI was calculated by dividing weight by the cube of height. BP was measured using a standard mercury sphygmomanometer. We investigated temporal associations between TMI and BP with a cross-lagged panel model using repeated measure data from 2014 (Wave 1), 2016 (Wave 2), and 2018 (Wave 3). Results: Results of the cross-lagged panel model showed that TMI was associated with subsequent BP. Participants with higher levels of TMI presented higher levels of BP (Wave 1: β = 0.737 for systolic blood pressure (SBP) and β = 0.308 for diastolic blood pressure (DBP), Wave 2: β = 0.422 for SBP and β = 0.165 for DBP, p < 0.01). In addition, children with higher BP could also present higher TMI (Wave 1: β = 0.004 for SBP and β = 0.006 for DBP, Wave 2: β = 0.003 for SBP and β = 0.005 for DBP, p < 0.01), but the cross-lag path coefficient indicated that the influence of TMI on BP was stronger than the influence of BP on TMI. Conclusions: There was a temporal association between TMI and BP in Chinese children. Higher TMI predicted higher subsequent BP rather than the reverse relationship.

1. Introduction

Hypertension in childhood is a global public health issue [1]. Several studies have suggested that hypertension in childhood is a strong predictor of adult hypertension [2,3,4]. Children with hypertension also have a greater chance of developing cardiovascular disease, cognitive impairment, and retinal changes during adolescence [5,6,7]. A meta-analysis indicated that the prevalence of elevated blood pressure in Chinese children and adolescents varied from 2.2 to 26.4%, and the pooled prevalence was 9.8% [8]. Meanwhile, the prevalence of elevated blood pressure in obese children and overweight children was much higher than that in normal children [8].
Being overweight, including obesity, is defined as an excess of body fat mass [9]. Body mass index (BMI), defined as weight divided by height squared (kg/m2), is widely used to diagnose overweight and obesity in populations worldwide [10]. However, the applicability of BMI in children and adolescence remains controversial. Evidence has shown that weight and height squared are not proportional during adolescent growth, thus reducing the accuracy of BMI [11,12]. To overcome this limitation, Peterson et al. proposed the tri-ponderal mass index (TMI) as a substitute for BMI in body fat screening among children and adolescents, which was calculated as weight divided by height cubed [13]. For children and adolescents, TMI was more stable with age, estimated body fat mass more accurately, and presented a lower misclassification in screening adiposity [14].
Several studies have reported the association between obesity and hypertension both in adults [15,16,17] and in children [18,19,20,21,22] based on BMI. A cross-sectional study conducted in Italian adolescents found that TMI was superior to BMI in assessing hypertension [23]. To date, however, no longitudinal study has investigated whether TMI could predict subsequent changes in blood pressure in the child. In addition, the effect of blood pressure on weight status in childhood remains unclear. To address these limitations, here, we examine the temporal relationship between TMI and blood pressure over time with a traditional cross-lagged panel model (CLPM), using longitudinal data from a survey of Yantai children’s health examinations from 2014 to 2019. CLPM can be used to explore how two or more variables affect each other over time if they are measured on two or more occasions [24,25].

2. Materials and Methods

2.1. Study Design and Procedures

This study used data from a longitudinal cohort survey titled “Yantai children’s health examination project”, which investigated the health and development of children. The project was carried out in all primary schools in Yantai of Shandong province from 2014 to 2019. Data of the anthropometric examination and blood pressure were collected annually. First, we observed the longitudinal changes of BMI, TMI, SBP, and DBP with age in children by a fixed cohort. A total of 46,876 students at 7 years old were recruited in the 2014 academic year as baseline and were traced for 6 consecutive years to 2019. After excluding students with incomplete data (n = 25,519), data of 21,357 students were analyzed. Second, we performed a cross-lagged model analysis of TMI and blood pressure using data from 2014 (Wave 1), 2016 (Wave 2), and 2018 (Wave 3). A total of 328,857 students 7–12 years old were enrolled in 2014 as baseline. After excluding students with incomplete data (n = 196,698), data of 132,159 students were used in this set of data analysis. This study was approved by the Ethics Committee of Qingdao University Medical College (20131109). Children’s parents signed informed consent forms.

2.2. Study Measures

Children’s weight, height, and blood pressure (BP) were measured by well-trained health professionals using the same anthropometric measurement procedures and tools each visit. The height and weight of the students were measured without shoes and outerwear. Height was measured to the nearest 0.1 cm using a portable height board (model TZG, Jiangyin No. 2 Medical Equipment Factory, Jiangsu Province, China). Weight was measured to the nearest 0.1 kg using a portable digital scale (Shorr Productions, Olney, MD, USA). BMI was calculated as weight (kg) divided by height squared (m2). Weight in kilograms was divided by the cube of height in meters to calculate TMI.
BP was measured by trained observers on the right arm of students in a quiet room, in a sitting position after resting for at least 10 min. Systolic blood pressure (SBP) and diastolic blood pressure (DBP) were measured three times consecutively using a standard mercury sphygmomanometer (model XJ11D, Shanghai Medical Instruments Co., Ltd., Shanghai, China) with appropriate cuff size, making sure that cuff size fit the length and circumference of the upper arm. The first and fifth Korotkoff sound was defined as SBP and DBP. The mean values of the 3 readings were taken for analysis.

2.3. Statistical Analysis

Descriptive statistics for demographic information and temporal associations among the study variables were calculated using IBM SPSS Statistics for Windows (Version 21.0). Repeated measures analysis of variance was used to assess longitudinal changes in BMI, TMI, SBP, and DBP between the six consecutive years.
To examine the temporal associations between TMI and BP over time, we performed cross-lagged panel analysis using Mplus version 7.0 (Muthén & Muthén, Los Angeles, CA, USA). In this study, TMI and BP levels were measured at three waves. Missing data were processed by full information maximum likelihood (FIML) procedures in Mplus. FIML estimation used all available data to provide robust estimates for non-normal and non-independent data [26].
The cross-lagged panel model is a structural model that examines both reciprocal and longitudinal relationships among the variables [25]. We constructed four models to identify causality: (1) Model 1 was a stability model with TMI and BP (SBP and DBP) without cross-lagged structural paths, (2) Model 2 added cross-lagged paths from TMI to BP on the basis of Model 1, (3) Model 3 extended Model 2 by adding cross-lagged paths from BP to TMI, and (4) All autoregressive and cross-lagged paths from Models 1–3 were included in Model 4. We used the following fit indices to evaluate the validity of model fit: comparative fit index (CFI) ≥ 0.95, Tucker--Lewis index (TLI) ≥ 0.95, standardized root mean residual (SRMR) ≤ 0.08, and root mean square error of approximation (RMSEA) ≤ 0.06. We considered p < 0.05 to be statistically significant [27,28]. The chi-square difference test was used to compare the difference between nested models.

3. Results

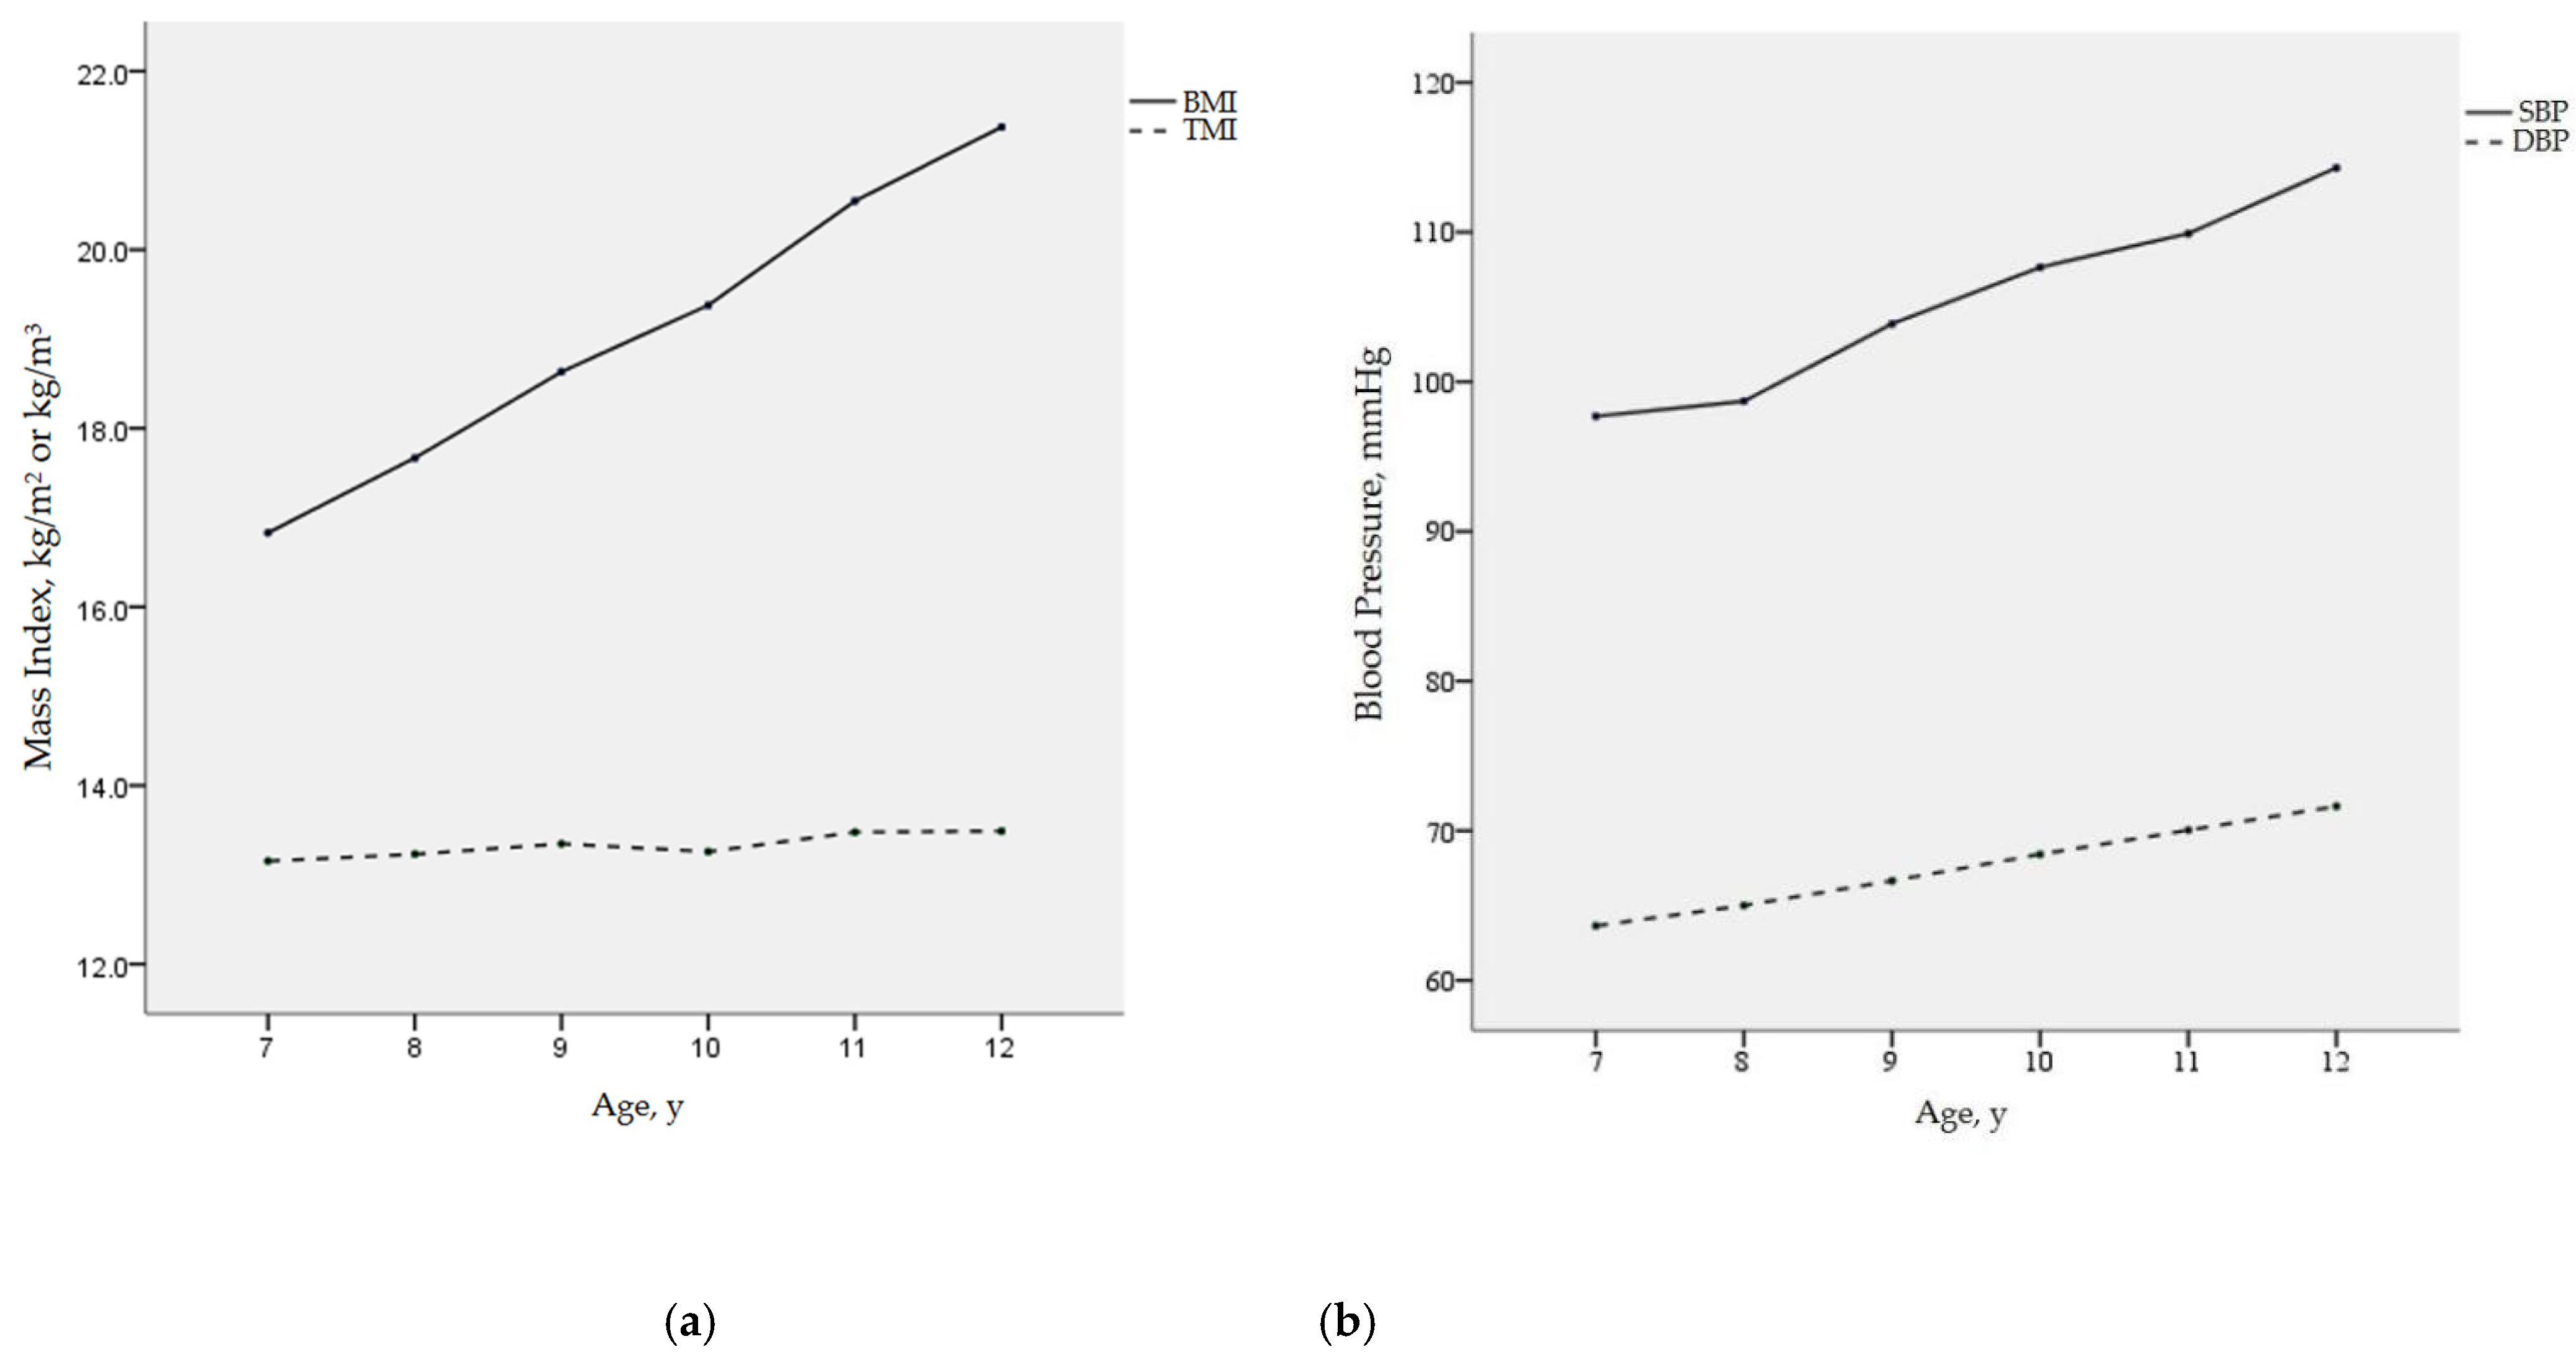
3.1. Stability of TMI and BMI with Age

We investigated the longitudinal changes of BMI, TMI, SBP, and DBP with age using repeated measures analysis of variance. The results in Figure 1 show that BMI increased rapidly between ages 7 and 12 (p < 0.001), while TMI was almost stable throughout childhood, with population means hovering at approximately 13 kg/m3. In addition, both SBP and DBP levels increased with age in elementary school children (both p < 0.001), and SBP increased more obviously than DBP.

3.2. Cross-Lagged Panel Analysis

3.2.1. Descriptive Statistics

We performed a cross-lagged model analysis of TMI and blood pressure using three-wave data (Wave 1, Wave 2, and Wave 3). Table 1 presents the demographic characteristics of the participants. A total of 132,159 children provided data at three waves. A total of 64,226 (48.6%) were males, and 67,933 (51.4%) were females. The mean age of participants was 9.33 years at baseline. There were significant differences between males and females in age, region, height, weight, TMI, SBP, and DBP. Compared with the previous visit, SBP and DBP were higher for each follow-up visit, suggesting an increase in blood pressure with age.
Correlations between TMI and BP across the three Waves are displayed in Table 2. Significant positive associations between TMI and SBP were found, except that SBP at Wave 1 did not correlate significantly with TMI at Waves 2 and 3. Moreover, the positive associations between TMI and DBP were explored in the three waves. The correlations of all variables were similar in three time points, indicating the stability of the relations.

3.2.2. Stability Model

A stability model with TMI and BP at three waves is shown in Figure 2. After controlling sociodemographic variables, including age, sex, and region, the paths between the three waves for TMI (β = 0.642 for Wave 1 and β = 0.746 for Wave 2, p < 0.01) and the three waves for SBP (β = 0.197 for Wave 1 and β = 0.276 for Wave 2, p < 0.01) were all statistically significant. Statistical significance was also found in the three wave paths of TMI (β = 0.645 for Wave 1 and β = 0.747 for Wave 2, p < 0.01) and DBP (β = 0.144 for Wave 1 and β = 0.218 for Wave 2, p < 0.01). That is, children’s TMI and BP were stable over time. Meanwhile, TMI was significantly associated with SBP and DBP at each of the three Waves (SBP: β = 1.943 for Wave 1, β = 0.966 for Wave 2 and β = 0.850 for Wave 3, p < 0.01; DBP: β = 0.981 for Wave 1, β = 0.533 for Wave 2 and β = 0.489 for Wave 3, p < 0.01).

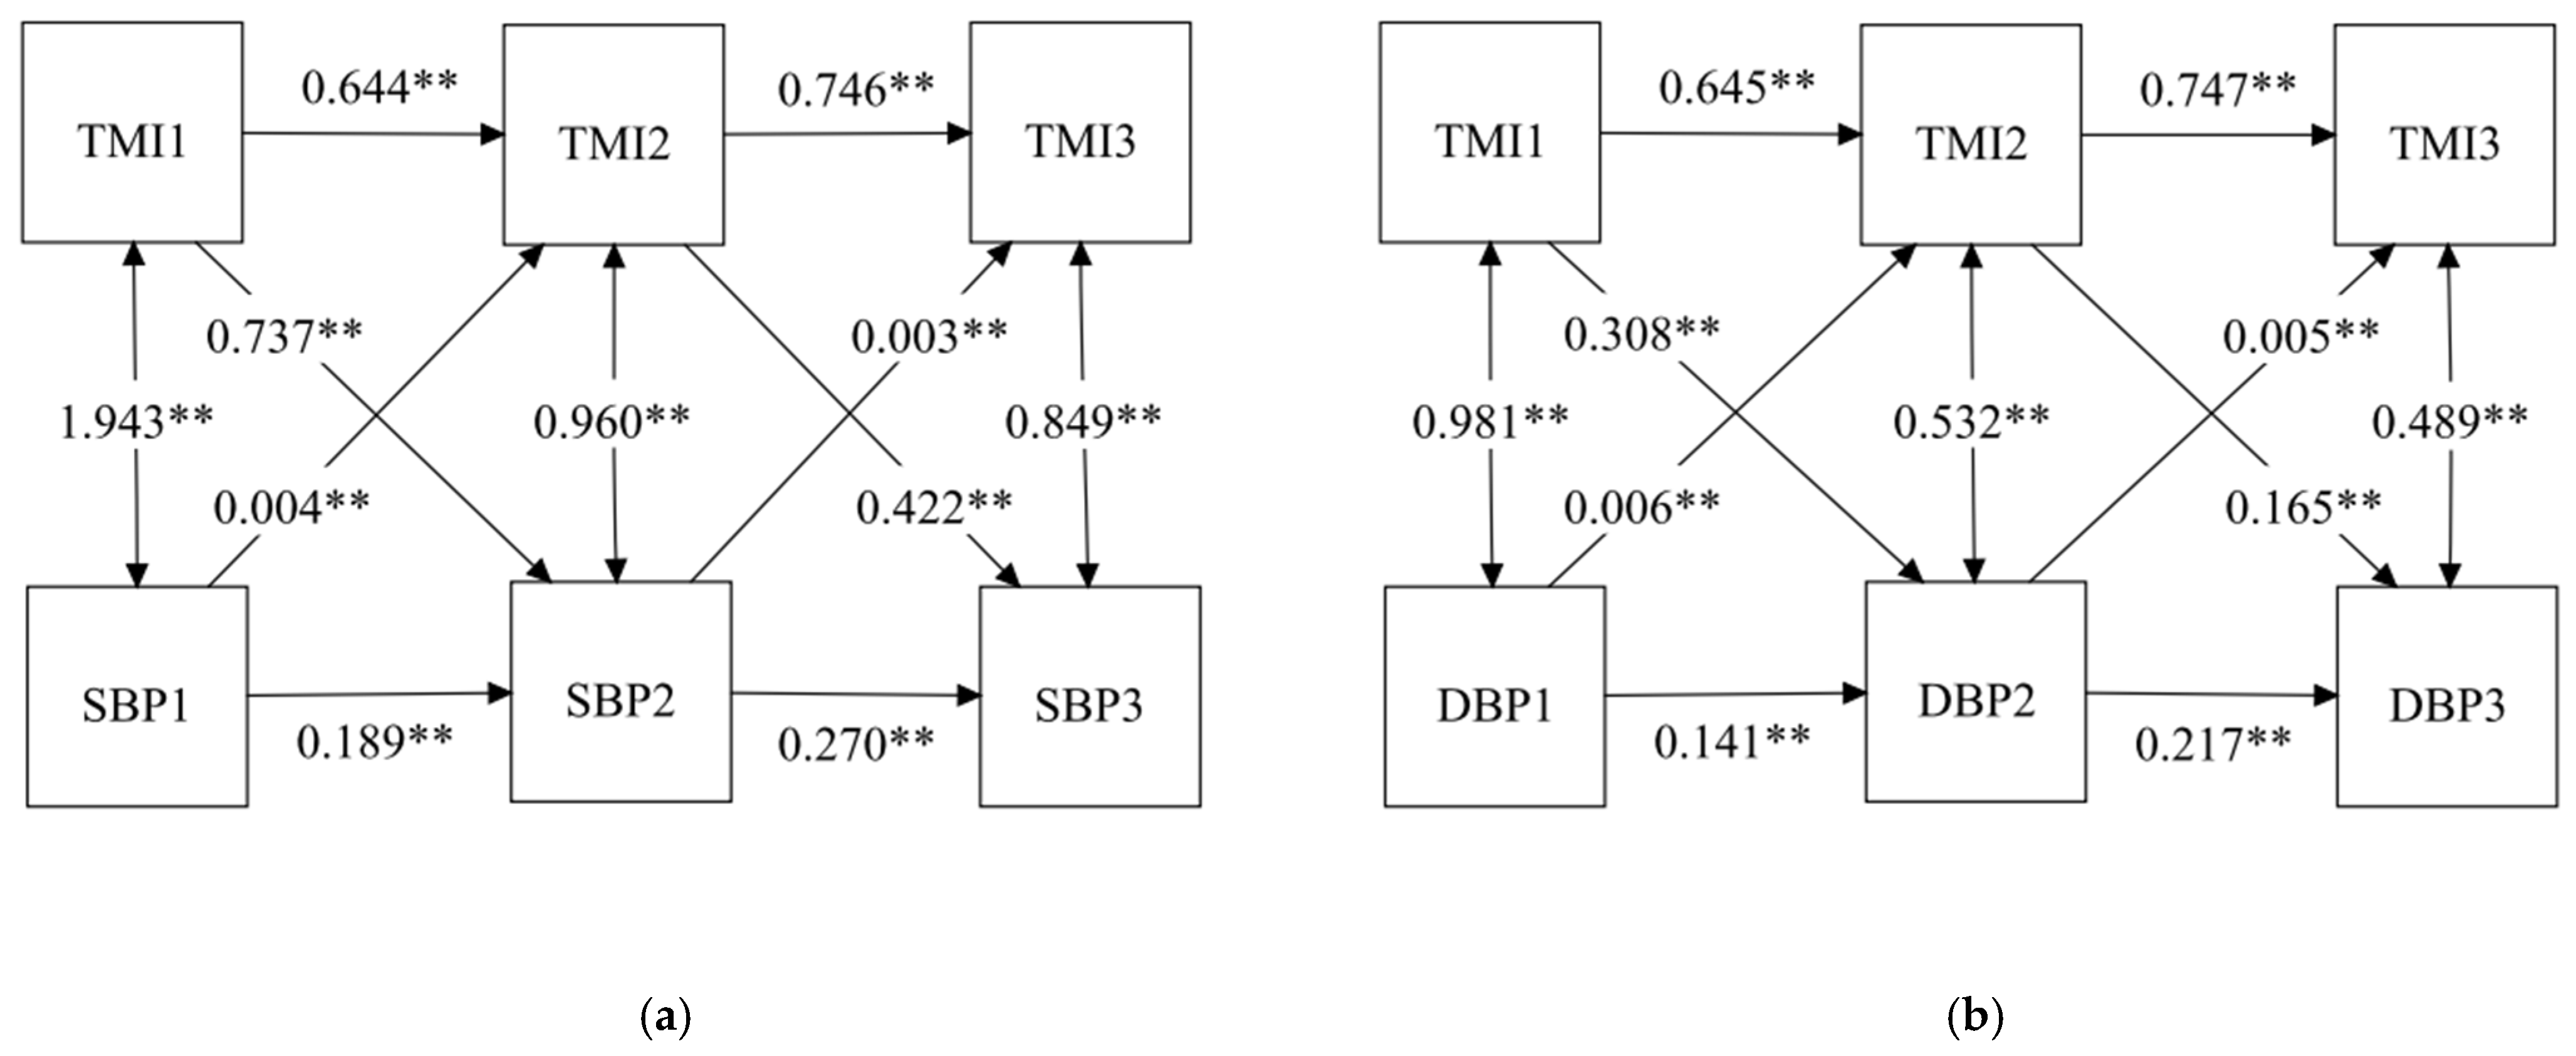
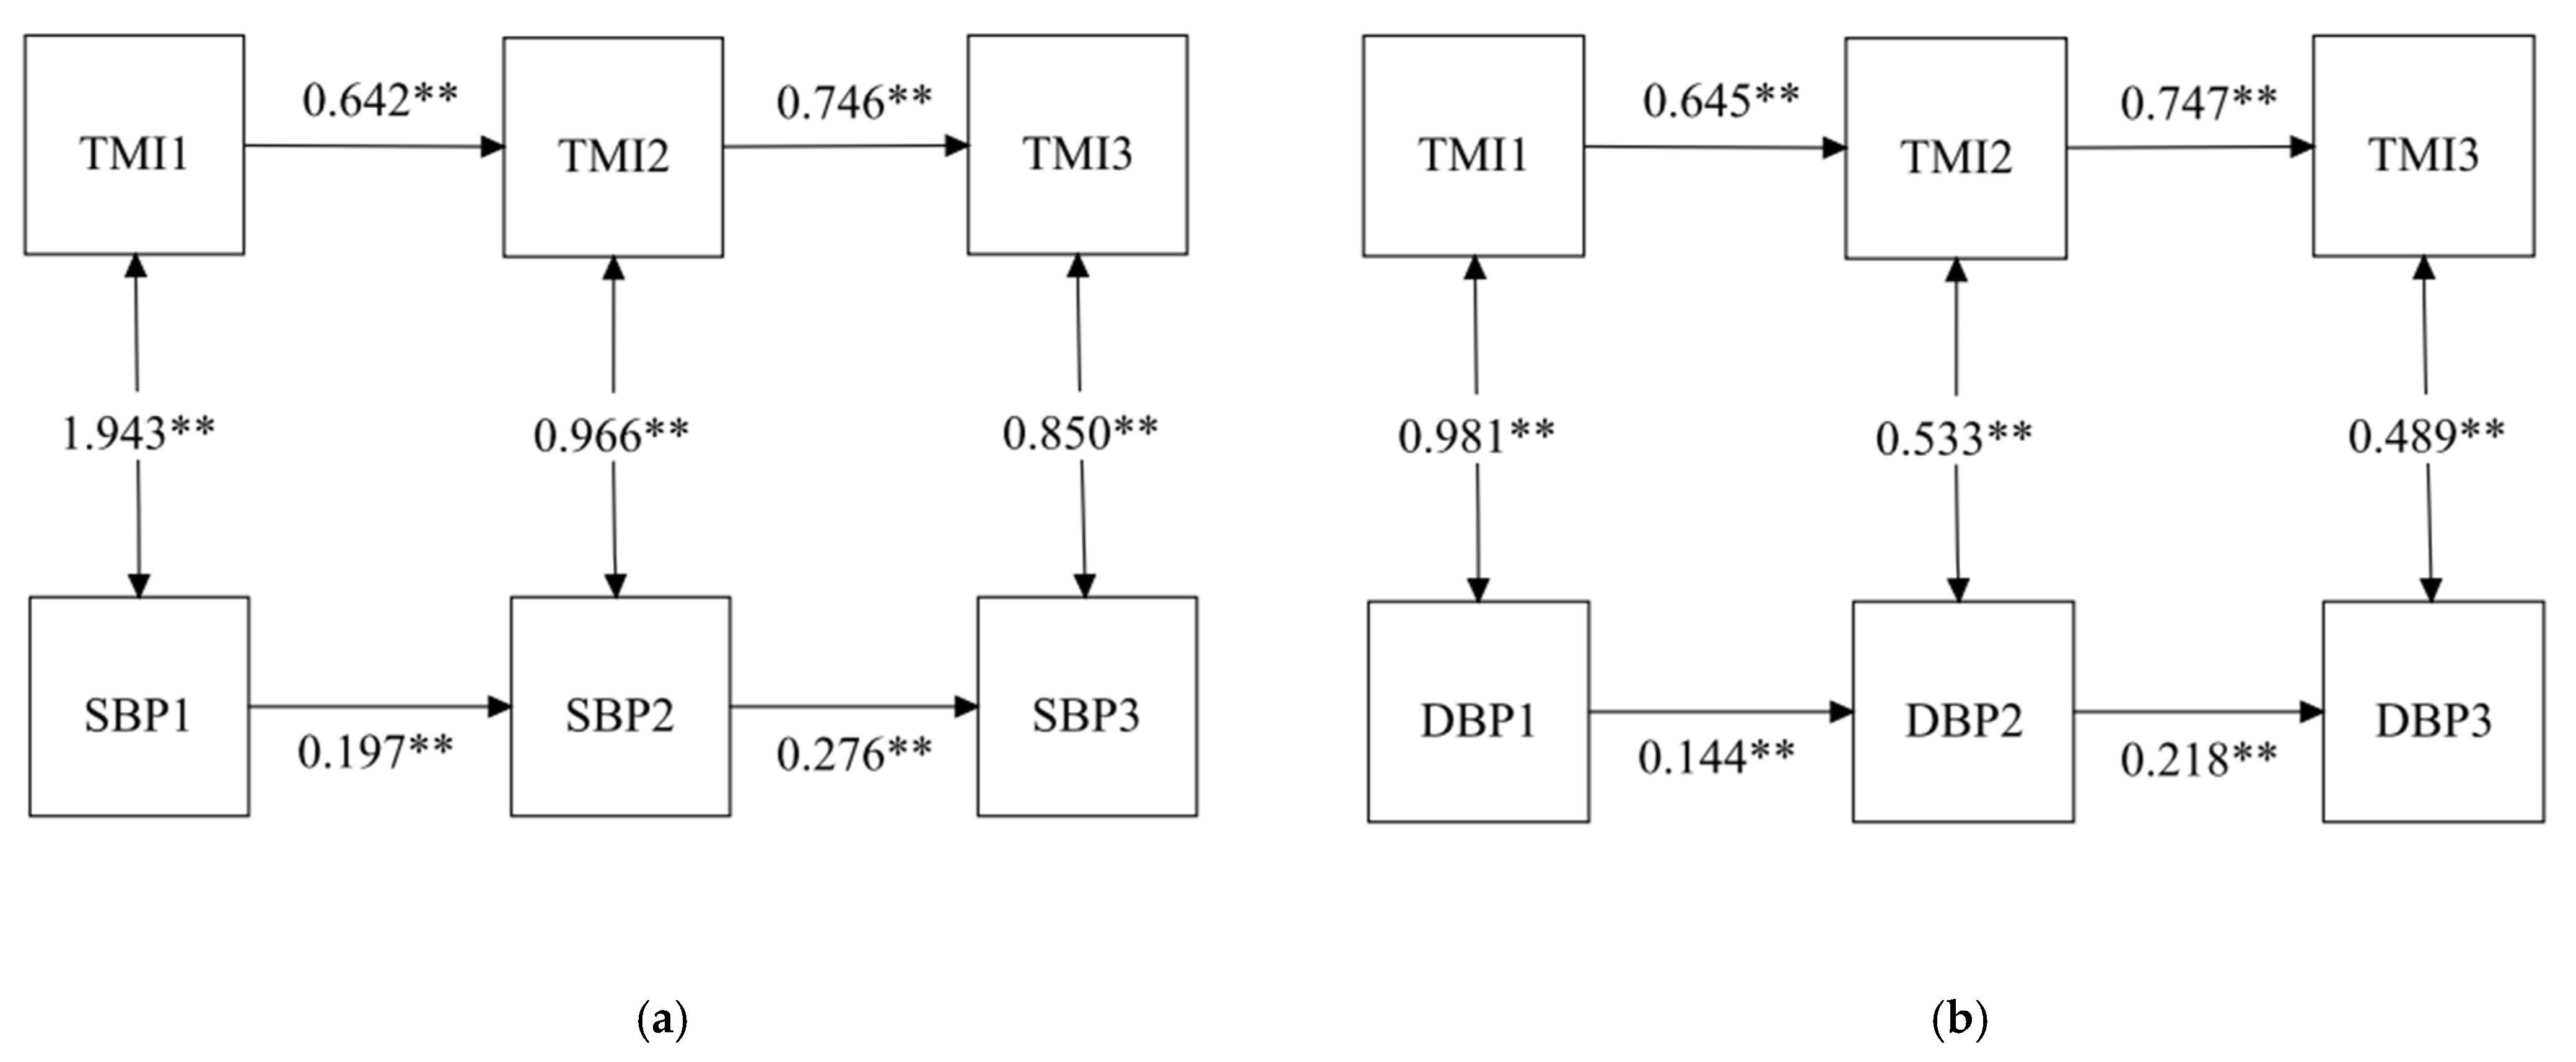
3.2.3. Cross-Lagged Model

We analyzed the reciprocal relationship between TMI and BP by using the cross-lagged panel model. We added cross-lagged paths from TMI to BP and from BP to TMI in Models 2 and 3. Fit indices are presented in Table 3, which indicates that the models have good fits to the data. Cross-lagged paths from TMI to BP (Model 2) were significant. In addition, significant cross-lagged associations were also found between BP and TMI (Model 3). All autoregressive and cross-lagged paths were included in Model 4. The results are shown in Figure 3. A chi-square difference test between the stability model and the cross-lagged panel model was significant (χ2 = 2411.62 for SBP and χ2 = 974.82 for DBP, p < 0.01), suggesting that the cross-lagged model fit better. Positive and significant autoregressive coefficients indicated that all autoregressive paths had high stability over time. The cross-lagged results were similar to Models 2 and 3. In the cross-lagged panel analysis, TMI at Wave 1 was a significant predictor of BP at Wave 2 (β = 0.737 for SBP and β = 0.308 for DBP, p < 0.01), and TMI at Wave 2 was a significant predictor of BP at Wave 3 (β = 0.422 for SBP and β = 0.165 for DBP, p < 0.01). Meanwhile, BP at Wave 1 was significantly associated with TMI at Wave 2 (β = 0.004 for SBP and β = 0.006 for DBP, p < 0.01), and BP at Wave 2 was significantly associated with TMI at Wave 3 (β = 0.003 for SBP and β = 0.005 for DBP, p < 0.01). In addition, the cross-lagged path coefficients indicated that the influence of TMI on BP was stronger than that of BP on TMI.

4. Discussion

The longitudinal study conducted with Chinese elementary school children for the first time investigated the temporal associations between TMI and BP by cross-lagged panel model. We revealed a bidirectional causal relationship between TMI and BP. The influence of TMI on BP was stronger than that of BP on TMI. In addition, we also confirmed that TMI remained stable with age, but BMI, SBP, and DBP increased with age in elementary school children.
Several studies had reported the positive association between obesity and hypertension [29,30,31,32,33] based on BMI. Two longitudinal studies conducted separately in Guangzhou [19] and Mexico [33] both found that compared with normal weight students, overweight and obese students had a higher risk to develop hypertension. To date, however, few studies have examined the relationship between TMI and blood pressure in children [23,34]. In the present study, we demonstrated that higher TMI predicted higher blood pressure over time in Chinese children. To some extent, the results were consistent with a previous study conducted in Italy that found that TMI was associated with hypertension and was more accurate than BMI in assessing blood pressure in adolescents [23]. Since central obesity and hypertension are two criteria that define metabolic syndrome (MetS) in children and adolescents, TMI may be an indicator of detecting cardio-metabolic risk [35]. In this regard, a recent study in Colombian children, adolescents, and young adults showed a correlation between TMI and MetS [36]. Another study concluded that TMI was a better predictor of MetS than BMI in both genders [37]. In addition, our study also found that higher blood pressure in children also led to higher levels of TMI, but the causal relationship was weaker than the influence of TMI on blood pressure in children. We have noticed that no studies have previously examined the effect of BP on TMI. There is no basic experiment to explore the effect of BP on TMI, and the mechanism of BP on TMI remains unclear. The possible reason was that the strong influence of TMI on blood pressure masks the influence of blood pressure on TMI.
BMI has been used to screen for obesity. However, evidence indicates that BMI did not take into account changes in body proportions and body fat levels during adolescent growth, raising questions about the accuracy of BMI in assessing obesity in adolescents [38]. In 2017, Peterson et al. raised TMI, a super body fat index, as an alteration of BMI to assess obesity in children and adolescents for the first time. In children and adolescents, TMI was more stable over time, estimated body fat percent more accurately, and presented a lower misclassification in screening for obesity [13]. A study conducted in Finland also confirmed the high stability of TMI with age among children [39]. Consistent with the above research [13,39], our study investigated the changes of TMI and BMI in Chinese children from 7 to 12 years old and found that TMI was approximately constant at 13 kg/m3, while BMI increased significantly. In addition, the present study confirmed previous findings [40,41,42] that SBP and DBP increased with age in elementary school children, and the stability of SBP was higher than DBP from childhood to adulthood.
Although the underlying mechanisms between obesity and hypertension remain unclear, some possible mechanisms might explain the association. First, obesity impairs microvascular function and structure, and microvascular dysfunction may increase peripheral vascular resistance, thereby contributing to hypertension [43]. Second, several adipose tissue-derived factors may influence insulin signaling, thereby affecting insulin-mediated vasodilation, ultimately leading to hypertension [43]. Then, visceral adipose tissue produces more proinflammatory cytokines, which may induce endothelial dysfunction and play an important role in subsequent hypertension [44,45]. Finally, obesity is associated with increased adipose tissue renin and angiotensinogen, resulting in sodium retention and hypertension via activation of the renin--angiotensin system and the sympathetic nervous system [44,45].
There were several strengths in this study. First, our study was the first study to examine the bidirectional temporal relationship between TMI and blood pressure over three time points in Chinese children. Second, this study had a large sample of boys and girls from primary school, making the results representative. Finally, this study used TMI, a more accurate indicator of obesity screening in adolescents, to investigate the temporal relationship with blood pressure.
Despite the novelty strengths of this study, our study suffers from several limitations. First, this study mainly included a sample of participants from school-age children, which may limit its generalizability to a wider population. Second, several potential confounders, such as dietary factors, physical activity, parental socioeconomic status, and the educational level of the parents could influence the results of this study. However, due to data limitations, the information of the above covariates was not provided. As a result, it is impossible to adjust them. Third, we should take repeated blood pressure measurements on three different occasions, rather than three readings at one visit.

5. Conclusions

In summary, the longitudinal study showed that there was a dominant cross-lagged effect between tri-ponderal mass index and blood pressure, even after controlling for age, sex, and region. Higher TMI was associated with higher BP at the next time-point and subsequent time-lag, and higher BP was associated with higher TMI, but the influence of TMI on BP was stronger than that of BP on TMI. This has important implications for prevention of overweight or obesity. Our results require further prospective studies to help with the health management of children and the prevention of hypertension.

Author Contributions

Conceptualization, Y.C. and X.S.; formal analysis, Y.C. and M.H.; investigation, Y.C., F.Z. and L.Z.; methodology, Y.C. and R.S.; software, Y.C. and H.W.; validation, F.Z., L.Z., R.S. and M.H.; visualization, Y.C. and H.W.; writing—original draft, Y.C.; writing—review and editing, X.S. All authors have read and agreed to the published version of the manuscript.

Funding

The study was supported in part by a grant from China National Foundation of Natural Science (82171570).

Institutional Review Board Statement

The study was conducted according to the guidelines of the Declaration of Helsinki and approved by the Ethics Committee of Qingdao University Medical College (20131109).

Informed Consent Statement

Informed consent was obtained from all subjects involved in the study.

Data Availability Statement

The data presented in the current study are not publicly available due to the stipulations related to privacy and confidentiality.

Acknowledgments

The authors acknowledge the efforts of the research team members and the participating students, teachers, parents, as well as the doctors and nurses involved in this study for anthropometric measurement and data collection.

Conflicts of Interest

The authors declare no conflict of interest.

References

  1. Ashraf, M.; Irshad, M.; Parry, N.A. Pediatric hypertension: An updated review. Clin. Hypertens. 2020, 26, 22. [Google Scholar] [CrossRef] [PubMed]
  2. Rao, G. Diagnosis, Epidemiology, and Management of Hypertension in Children. Pediatrics 2016, 138. [Google Scholar] [CrossRef] [PubMed] [Green Version]
  3. Dong, Y.; Song, Y.; Zou, Z.; Ma, J.; Dong, B.; Prochaska, J.J. Updates to pediatric hypertension guidelines: Influence on classification of high blood pressure in children and adolescents. J Hypertens. 2019, 37, 297–306. [Google Scholar] [CrossRef] [PubMed]
  4. Hanevold, C.D. White Coat Hypertension in Children and Adolescents. Hypertension 2019, 73, 24–30. [Google Scholar] [CrossRef] [PubMed]
  5. Cha, S.D.; Patel, H.P.; Hains, D.S.; Mahan, J.D. The effects of hypertension on cognitive function in children and adolescents. Int. J. Pediatr. 2012, 2012, 891094. [Google Scholar] [CrossRef] [PubMed]
  6. Thompson, M.; Dana, T.; Bougatsos, C.; Blazina, I.; Norris, S.L. Screening for hypertension in children and adolescents to prevent cardiovascular disease. Pediatrics 2013, 131, 490–525. [Google Scholar] [CrossRef] [Green Version]
  7. Lona, G.; Endes, K.; Kochli, S.; Infanger, D.; Zahner, L.; Hanssen, H. Retinal Vessel Diameters and Blood Pressure Progression in Children. Hypertension 2020, 76, 450–457. [Google Scholar] [CrossRef]
  8. Wang, L.; Song, L.; Liu, B.; Zhang, L.; Wu, M.; Cao, Z.; Wang, Y. Trends and Status of the Prevalence of Elevated Blood Pressure in Children and Adolescents in China: A Systematic Review and Meta-analysis. Curr. Hypertens. Rep. 2019, 21, 88. [Google Scholar] [CrossRef]
  9. WHO. Obesity and Overweight. Fact Sheet. 2015. Available online: http://www.who.int/mediacentre/factsheets/fs311/en/ (accessed on 10 December 2021).
  10. Prentice, A.M.; Jebb, S.A. Beyond body mass index. Obes. Rev. 2001, 2, 141–147. [Google Scholar] [CrossRef]
  11. Cole, T.; Flegal, K.; Nicholls, D.; Jackson, A. Body mass index cut offs to define thinness in children and adolescents: International survey. BMJ Clin. Res. Ed. 2007, 335, 194. [Google Scholar] [CrossRef] [Green Version]
  12. Moselakgomo, V.K.; Van Staden, M. Diagnostic accuracy of tri-ponderal mass index and body mass index in estimating overweight and obesity in South African children. Afr. J. Prim. Health Care Fam. Med. 2019, 11, e1–e7. [Google Scholar] [CrossRef] [PubMed]
  13. Peterson, C.M.; Su, H.; Thomas, D.M.; Heo, M.; Golnabi, A.H.; Pietrobelli, A.; Heymsfield, S.B. Tri-Ponderal Mass Index vs. Body Mass Index in Estimating Body Fat During Adolescence. JAMA Pediatr. 2017, 171, 629–636. [Google Scholar] [CrossRef] [PubMed]
  14. De Lorenzo, A.; Romano, L.; Di Renzo, L.; Gualtieri, P.; Salimei, C.; Carrano, E.; Rampello, T.; de Miranda, R.C. Triponderal mass index rather than body mass index: An indicator of high adiposity in Italian children and adolescents. Nutrition 2019, 60, 41–47. [Google Scholar] [CrossRef] [PubMed]
  15. Qu, Y.; Niu, H.; Li, L.; Li, M.; Yan, S.; Li, M.; Jiang, S.; Ma, X.; Li, B.; Wu, H. Analysis of Dose-response Relationship between BMI and Hypertension in Northeastern China Using Restricted Cubic Spline Functions. Sci. Rep. 2019, 9, 18208. [Google Scholar] [CrossRef] [PubMed] [Green Version]
  16. Zeng, Q.; Sun, L.; Zeng, Q. Trajectories of mid-life to elderly adulthood BMI and incident hypertension: The China Health and Nutrition Survey. BMJ Open 2021, 11, e047920. [Google Scholar] [CrossRef]
  17. Sabo, R.T.; Lu, Z.; Daniels, S.; Sun, S.S. Serial childhood BMI and associations with adult hypertension and obesity: The Fels Longitudinal Study. Obesity 2012, 20, 1741–1743. [Google Scholar] [CrossRef]
  18. Wang, X.; Dong, B.; Huang, S.; Ma, Y.; Zou, Z.; Ma, J.; Yang, Z.; Wang, Z. Body Mass Index Trajectory and Incident Hypertension: Results from a Longitudinal Cohort of Chinese Children and Adolescents, 2006–2016. Am. J. Public Health 2020, 110, 1689–1695. [Google Scholar] [CrossRef]
  19. Wang, J.; Zhu, Y.; Jing, J.; Chen, Y.; Mai, J.; Wong, S.H.; O’Reilly, J.; Ma, L. Relationship of BMI to the incidence of hypertension: A 4 years’ cohort study among children in Guangzhou, 2007–2011. BMC Public Health 2015, 15, 782. [Google Scholar] [CrossRef] [Green Version]
  20. Hu, J.; Chu, G.P.; Huang, F.F.; Zhou, Y.K.; Teng, C.G.; Yang, H.B.; Shen, H. Relation of body mass index (BMI) to the prevalence of hypertension in children: A 3years’ school-based prospective study in Suzhou, China. Int. J. Cardiol. 2016, 222, 270–274. [Google Scholar] [CrossRef]
  21. Lu, Y.; Luo, B.; Xie, J.; Zhang, X.; Zhu, H. Prevalence of hypertension and prehypertension and its association with anthropometrics among children: A cross-sectional survey in Tianjin, China. J. Hum. Hypertens. 2018, 32, 789–798. [Google Scholar] [CrossRef]
  22. Macdonald-Wallis, C.; Solomon-Moore, E.; Sebire, S.J.; Thompson, J.L.; Lawlor, D.A.; Jago, R. A longitudinal study of the associations of children’s body mass index and physical activity with blood pressure. PLoS ONE 2017, 12, e0188618. [Google Scholar] [CrossRef] [PubMed] [Green Version]
  23. Malavazos, A.E.; Capitanio, G.; Milani, V.; Ambrogi, F.; Matelloni, I.A.; Basilico, S.; Dubini, C.; Sironi, F.M.; Stella, E.; Castaldi, S.; et al. Tri-Ponderal Mass Index vs. body Mass Index in discriminating central obesity and hypertension in adolescents with overweight. Nutr. Metab. Cardiovasc. Dis. NMCD 2021, 31, 1613–1621. [Google Scholar] [CrossRef] [PubMed]
  24. Burns, R.A.; Crisp, D.A.; Burns, R.B. Re-examining the reciprocal effects model of self-concept, self-efficacy, and academic achievement in a comparison of the Cross-Lagged Panel and Random-Intercept Cross-Lagged Panel frameworks. Br. J. Educ. Psychol. 2020, 90, 77–91. [Google Scholar] [CrossRef] [PubMed]
  25. Hamaker, E.L.; Kuiper, R.M.; Grasman, R.P. A critique of the cross-lagged panel model. Psychol. Methods 2015, 20, 102–116. [Google Scholar] [CrossRef]
  26. Graham, J.W. Missing data analysis: Making it work in the real world. Annu. Rev. Psychol. 2009, 60, 549–576. [Google Scholar] [CrossRef] [PubMed] [Green Version]
  27. Bentler, P. Comparative fit indexes in structural models. Psychol. Bull. 1990, 107, 238–246. [Google Scholar] [CrossRef]
  28. McDonald, R.P.; Ho, M.-H.R. Principles and practice in reporting structural equation analyses. Psychol. Methods 2002, 7, 64–82. [Google Scholar] [CrossRef]
  29. Oni, T.; Macia, E.; Gueye, L.; Duboz, P. Hypertension and Obesity in Dakar, Senegal. PLoS ONE 2016, 11, e0161544. [Google Scholar] [CrossRef] [Green Version]
  30. Gao, W.; Qiao, X.; Wang, Y.; Wan, L.; Wang, Z.; Wang, X.; Di, Z.; Liu, X. The Interactive Association of General Obesity and Central Obesity with Prevalent Hypertension in Rural Lanzhou, China. PLoS ONE 2016, 11, e0164409. [Google Scholar] [CrossRef]
  31. Matsuo, T.; Sairenchi, T.; Suzuki, K.; Tanaka, K.; Muto, T. Long-term stable obesity increases risk of hypertension. Int. J. Obes. 2011, 35, 1056–1062. [Google Scholar] [CrossRef] [Green Version]
  32. Kruger, R.; Kruger, H.S.; Monyeki, M.A.; Pienaar, A.E.; Roux, S.B.-L.; Gafane-Matemane, L.F.; Smith, W.; Mels, C.M.C.; Lammertyn, L.; Brits, J.S.; et al. A demographic approach to assess elevated blood pressure and obesity in prepubescent children: The ExAMIN Youth South Africa study. J. Hypertens. 2021, 39, 2190–2199. [Google Scholar] [CrossRef]
  33. Sanchez-Zamorano, L.M.; Salazar-Martinez, E.; Anaya-Ocampo, R.; Lazcano-Ponce, E. Body mass index associated with elevated blood pressure in Mexican school-aged adolescents. Prev. Med. 2009, 48, 543–548. [Google Scholar] [CrossRef] [PubMed]
  34. Wang, X.; Dong, B.; Ma, J.; Song, Y.; Zou, Z.; Arnold, L. Role of tri-ponderal mass index in cardio-metabolic risk assessment in children and adolescents: Compared with body mass index. Int. J. Obes. 2020, 44, 886–894. [Google Scholar] [CrossRef] [PubMed]
  35. Weihe, P.; Weihrauch-Bluher, S. Metabolic Syndrome in Children and Adolescents: Diagnostic Criteria, Therapeutic Options and Perspectives. Curr. Obes. Rep. 2019, 8, 472–479. [Google Scholar] [CrossRef]
  36. Ramirez-Velez, R.; Correa-Bautista, J.E.; Carrillo, H.A.; Gonzalez-Jimenez, E.; Schmidt-RioValle, J.; Correa-Rodriguez, M.; Garcia-Hermoso, A.; Gonzalez-Ruiz, K. Tri-Ponderal Mass Index vs. Fat Mass/Height(3) as a Screening Tool for Metabolic Syndrome Prediction in Colombian Children and Young People. Nutrients 2018, 10, 412. [Google Scholar] [CrossRef] [PubMed] [Green Version]
  37. Khoshhali, M.; Heidari-Beni, M.; Qorbani, M.; Motlagh, M.E.; Ziaodini, H.; Heshmat, R.; Kelishadi, R. Tri-ponderal mass index and body mass index in prediction of pediatric metabolic syndrome: The CASPIAN-V study. Arch. Endocrinol. Metab. 2020, 64, 171–178. [Google Scholar] [CrossRef] [Green Version]
  38. Wang, X.; Ma, J.; Huang, S.; Dong, B.; Dong, Y.; Yang, Z.; Hu, J.; Liang, W. Use of Tri-Ponderal Mass Index in Predicting Late Adolescent Overweight and Obesity in Children Aged 7-18. Front Nutr 2022, 9, 785863. [Google Scholar] [CrossRef]
  39. Wu, F.; Buscot, M.J.; Niinikoski, H.; Rovio, S.P.; Juonala, M.; Sabin, M.A.; Jula, A.; Ronnemaa, T.; Viikari, J.S.A.; Raitakari, O.T.; et al. Age-Specific Estimates and Comparisons of Youth Tri-Ponderal Mass Index and Body Mass Index in Predicting Adult Obesity-Related Outcomes. J. Pediatr. 2020, 218, 198–203.e6. [Google Scholar] [CrossRef]
  40. Lee, M.H.; Kang, D.R.; Kim, H.C.; Ahn, S.V.; Khaw, K.T.; Suh, I. A 24-year follow-up study of blood pressure tracking from childhood to adulthood in Korea: The Kangwha Study. Yonsei Med. J. 2014, 55, 360–366. [Google Scholar] [CrossRef] [Green Version]
  41. Kelly, R.K.; Thomson, R.; Smith, K.J.; Dwyer, T.; Venn, A.; Magnussen, C.G. Factors Affecting Tracking of Blood Pressure from Childhood to Adulthood: The Childhood Determinants of Adult Health Study. J. Pediatr. 2015, 167, 1422–1428.e2. [Google Scholar] [CrossRef] [Green Version]
  42. Sarganas, G.; Schaffrath Rosario, A.; Niessner, C.; Woll, A.; Neuhauser, H.K. Tracking of Blood Pressure in Children and Adolescents in Germany in the Context of Risk Factors for Hypertension. Int. J. Hypertens. 2018, 2018, 8429891. [Google Scholar] [CrossRef] [PubMed]
  43. Jonk, A.; Houben, A.; de Jongh, R.; Serné, E.; Schaper, N.; Stehouwer, C. Microvascular dysfunction in obesity: A potential mechanism in the pathogenesis of obesity-associated insulin resistance and hypertension. Physiology 2007, 22, 252–260. [Google Scholar] [CrossRef] [PubMed]
  44. Vaneckova, I.; Maletinska, L.; Behuliak, M.; Nagelova, V.; Zicha, J.; Kunes, J. Obesity-related hypertension: Possible pathophysiological mechanisms. J. Endocrinol. 2014, 223, R63–R78. [Google Scholar] [CrossRef] [PubMed] [Green Version]
  45. Wirix, A.J.G.; Kaspers, P.J.; Nauta, J.; Chinapaw, M.J.M.; Kist-van Holthe, J.E. Pathophysiology of hypertension in obese children: A systematic review. Obes. Rev. 2015, 16, 831–842. [Google Scholar] [CrossRef]
Figure 1. Mean values of BMI, TMI, SBP, and DBP with age: (a) BMI and TMI with age; (b) SBP and DBP with age; BMI, body mass index; TMI, tri-ponderal mass index; SBP, systolic blood pressure; DBP, diastolic blood pressure.
Nutrients 14 01783 g001
Figure 2. Stability model with TMI and BP among children at three time points: (a) stability model with TMI and SBP; (b) stability model with TMI and DBP. ** p < 0.001; TMI, tri-ponderal mass index; SBP, systolic blood pressure; DBP, diastolic blood pressure.
Nutrients 14 01783 g002
Figure 3. Cross-lagged model with TMI and BP among children at three time points: (a) cross-lagged model with TMI and SBP; (b) cross-lagged model with TMI and DBP; ** p < 0.001; TMI, tri-ponderal mass index; SBP, systolic blood pressure; DBP, diastolic blood pressure.
Nutrients 14 01783 g003
Table 1. Descriptive statistics of the participants in this study.
Total ParticipantsMalesFemalesp
N (%)132,15964,226 (48.6)67,933 (51.4)
Age9.33 ± 1.689.24 ± 1.679.43 ± 1.68<0.001 a
Urban, n (%)66,454 (50.3)32,256 (50.2)34,198 (50.3)<0.001 b
Height (m)1.41 ± 0.121.41 ± 0.121.42 ± 0.12<0.001 a
Weight (kg)36.30 ± 9.4836.40 ± 9.5236.21 ± 9.440.001 a
TMI (kg/m3)
Wave 112.72 ± 1.6912.90 ± 1.7112.55 ± 1.65<0.001 a
Wave 212.79 ± 1.7912.88 ± 1.8812.70 ± 1.69<0.001 a
Wave 312.93 ± 1.8112.80 ± 1.9213.07 ± 1.69<0.001 a
SBP (mmHg)
Wave 1102.08 ± 12.48102.19 ± 12.46101.97 ± 12.500.001 a
Wave 2110.38 ± 12.25111.06 ± 12.61109.74 ± 11.88<0.001 a
Wave 3115.04 ± 11.87116.96 ± 12.32113.22 ± 11.12<0.001 a
DBP (mmHg)
Wave 165.32 ± 8.6265.19 ± 8.5465.45 ± 8.69<0.001 a
Wave 269.04 ± 8.7268.80 ± 8.8269.27 ± 8.62<0.001 a
Wave 372.02 ± 8.3171.92 ± 8.5372.12 ± 8.08<0.001 a
Values are expressed as mean ± SD, or n (%); a p value was calculated by T test for continuous variable; b p value was calculated by chi-square test for category variable.
Table 2. Bivariate correlations between TMI and blood pressure.
VariableMSD123456789
1. TMI (Wave 1)12.72 1.691.000
2. TMI (Wave 2)12.79 1.790.631 *1.000
3. TMI (Wave 3)12.93 1.810.555 *0.745 *1.000
4. SBP (Wave 1)102.0812.480.013 *0.002 0.003 1.000
5. SBP (Wave 2)110.3812.250.044 *0.048 *0.039 *0.300 *1.000
6. SBP (Wave 3)115.0411.870.065 *0.051 *0.058 *0.229 *0.337 *1.000
7. DBP (Wave 1)65.328.610.012 *0.011 *0.007 *0.587 *0.195 *0.145 *1.000
8. DBP (Wave 2)69.048.720.026 *0.041 *0.052 *0.192 *0.585 *0.187 *0.174 *1.000
9. DBP (Wave 3)72.028.310.025 *0.018 *0.048 *0.131 *0.241 *0.517 *0.123 *0.249 *1.000
* p < 0.001; M, Mean; SD, Standard deviation; TMI, tri-ponderal mass index; SBP, systolic blood pressure; DBP, diastolic blood pressure.
Table 3. Model fit and model comparisons.
Variables χ2dfCFITLIRMSEASRMRComparison∆χ2∆df
SBPModel 1 a9050.29200.9660.9230.058 (0.057–0.059)0.032
Model 2 b6954.08180.9740.9340.054 (0.053–0.055)0.019M1–M22096.21 **2
Model 3 c8723.44180.9670.9170.060 (0.059–0.062)0.030M1–M3326.85 **2
Model 4 d6638.67160.9750.9290.056 (0.055–0.057)0.018M1–M42411.62 **4
DBPModel 1 a6349.27200.9710.9360.049 (0.048–0.050)0.022
Model 2 b5717.17180.9740.9360.049 (0.048–0.050)0.016M1–M2632.10 **2
Model 3 c6003.29180.9730.9320.050 (0.049–0.051)0.020M1–M3345.98 **2
Model 4 d5374.45160.9760.9320.050 (0.049–0.051)0.015M1–M4974.82 **4
a stability mode; b stability model with cross-lagged paths from TMI to BP; c stability model with cross-lagged paths BP to TMI; d full cross-lagged model; ** p < 0.01; TMI, tri-ponderal mass index; SBP, systolic blood pressure; DBP, diastolic blood pressure; BP, blood pressure; CFI, comparative fit index; TLI, Tucker--Lewis index; SRMR, standardized root mean residual; RMSEA, root mean square error of approximation.
Publisher’s Note: MDPI stays neutral with regard to jurisdictional claims in published maps and institutional affiliations.

