
Association between Dietary Diversity Changes and Cognitive Impairment among Older People: Findings from a Nationwide Cohort Study

 ,
,
Abstract
:1. Introduction
2. Methods
2.1. Study Setting
2.2. Assessment of DDS
2.3. Assessment of DDS Change Patterns
2.4. Ascertainment of Cognitive Impairment
2.5. Ascertainment of Covariates
2.6. Statistical Analysis
3. Results
3.1. Baseline Characteristics
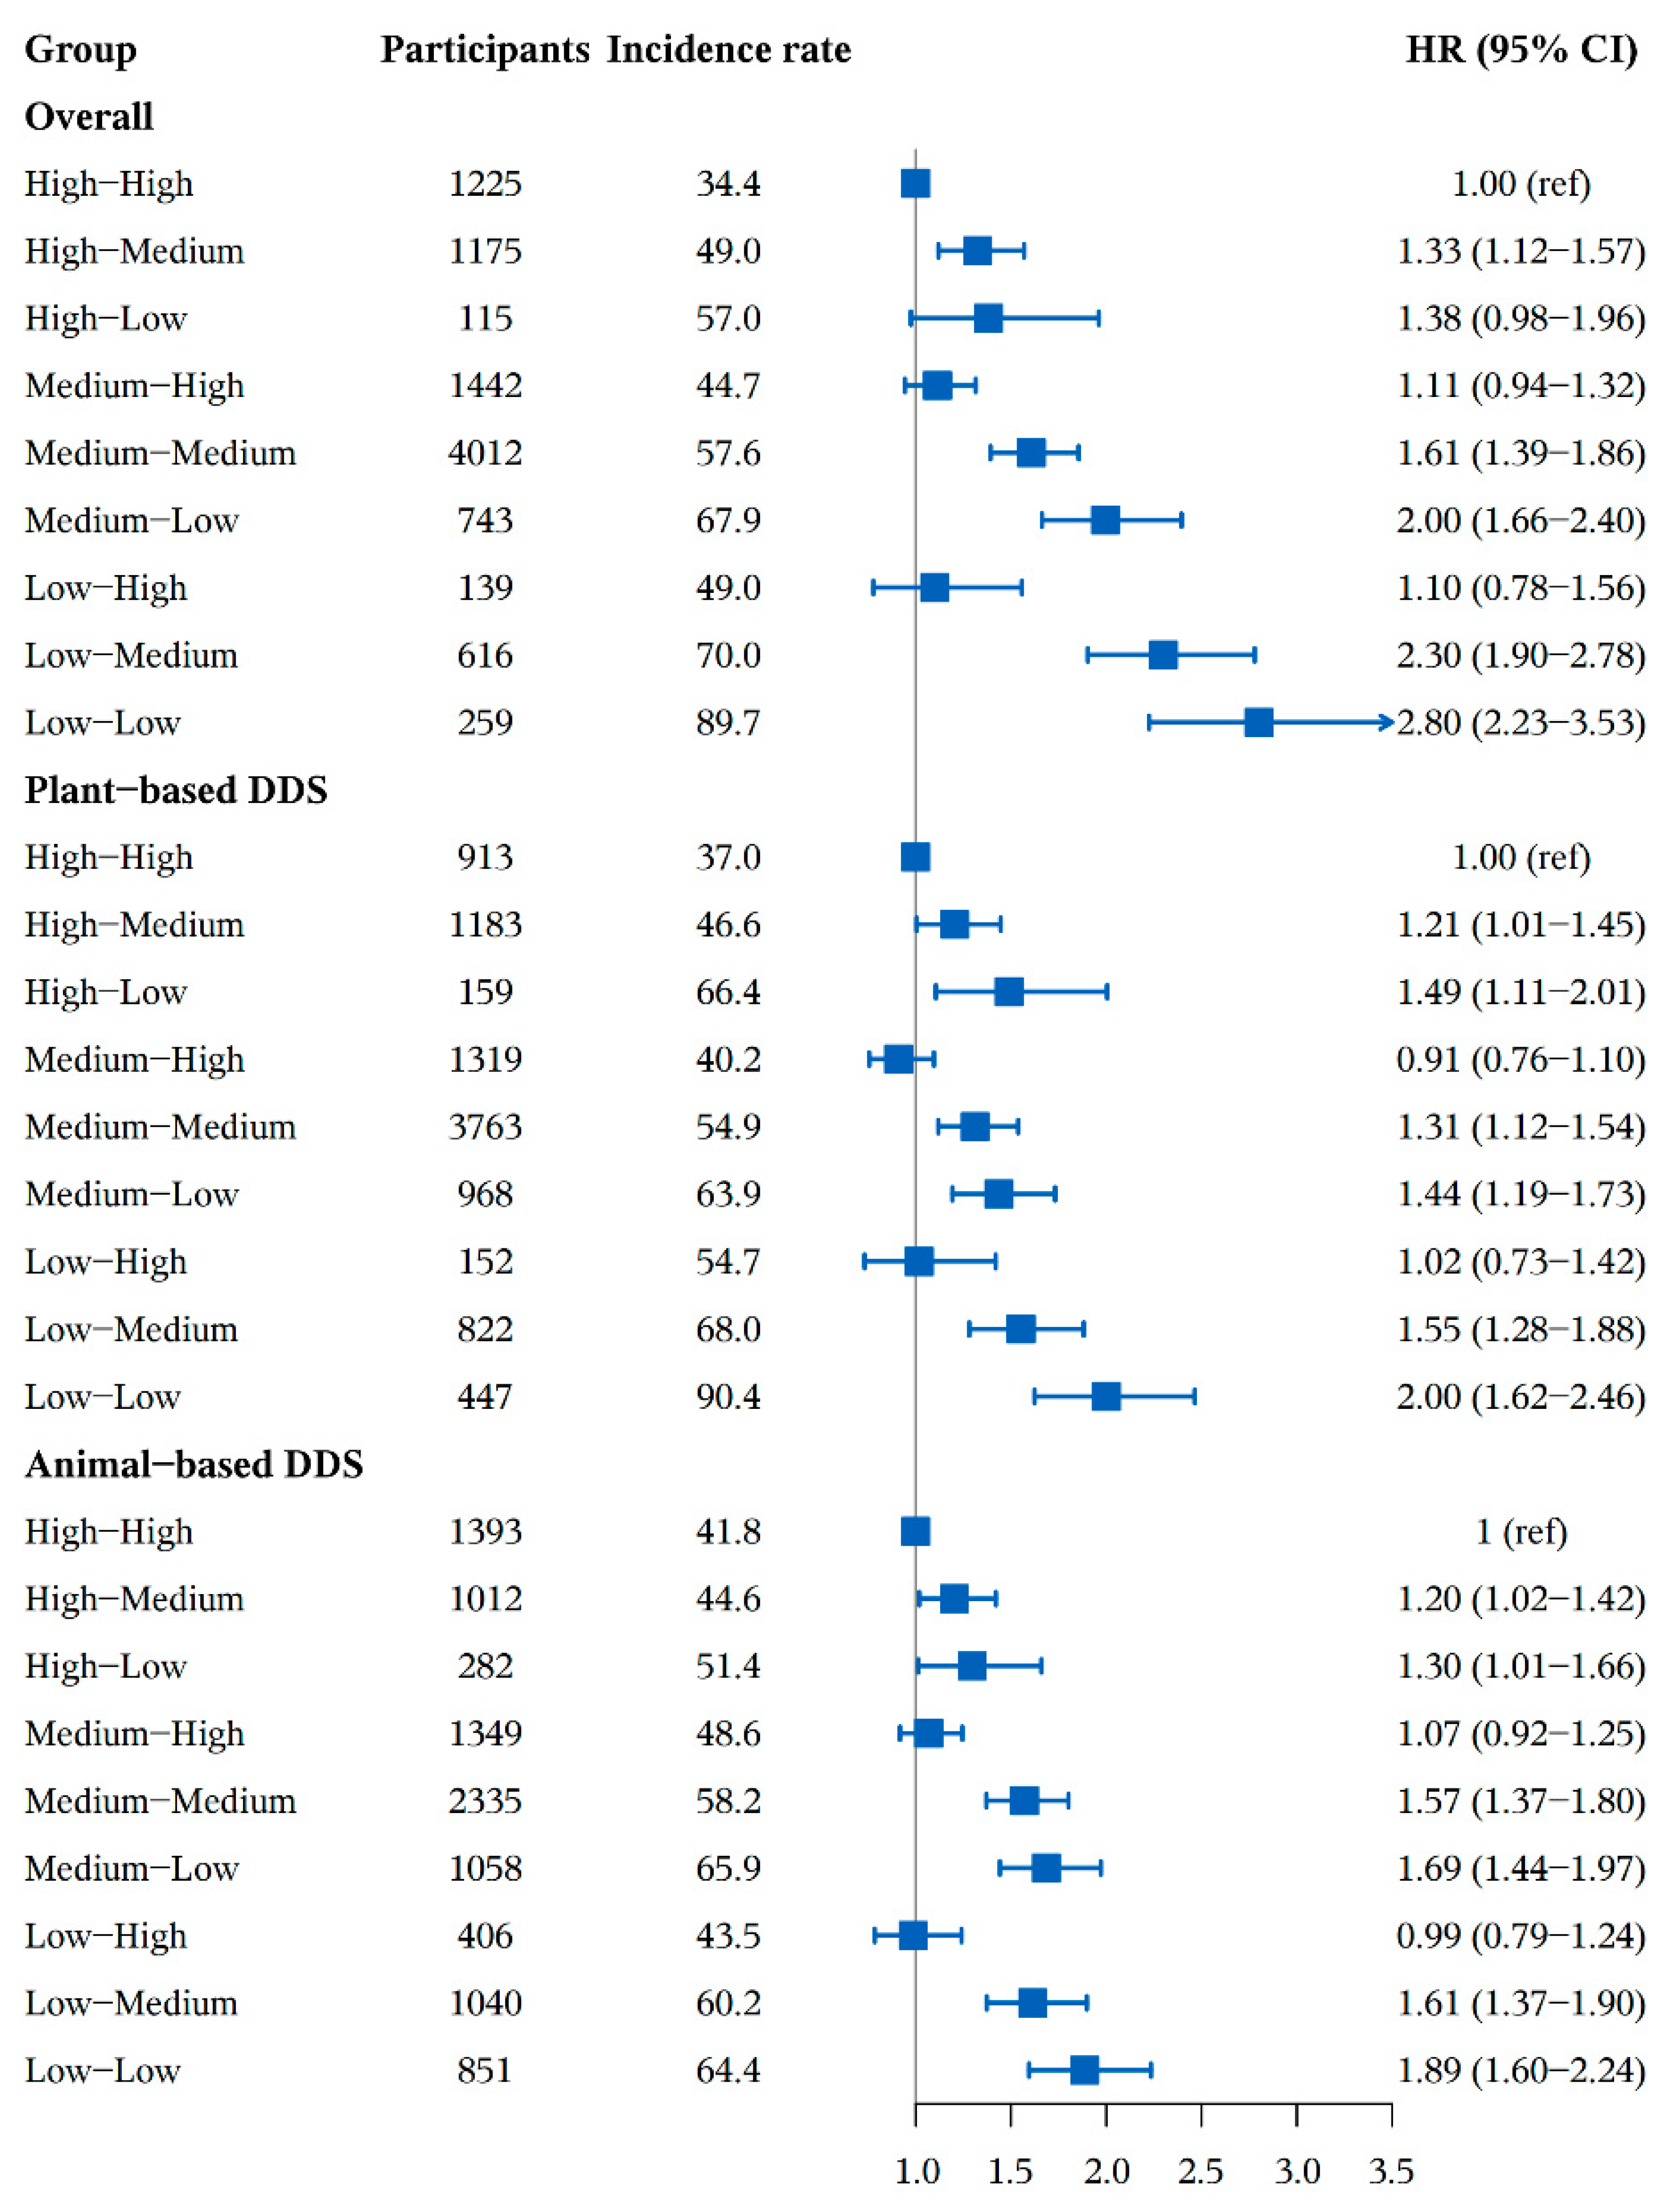
3.2. Association between DDS Change Patterns and Cognitive Impairment
3.3. Subgroup and Sensitivity Analyses
4. Discussion
5. Conclusions
Supplementary Materials
Author Contributions
Funding
Institutional Review Board Statement
Informed Consent Statement
Data Availability Statement
Acknowledgments
Conflicts of Interest
References
- Gallagher, M.; Okonkwo, O.C.; Resnick, S.M.; Jagust, W.J.; Benzinger, T.L.S.; Rapp, P.R. What are the threats to successful brain and cognitive aging? Neurobiol. Aging 2019, 83, 130–134. [Google Scholar] [CrossRef] [PubMed]
- Shah, H.; Albanese, E.; Duggan, C.; Rudan, I.; Langa, K.M.; Carrillo, M.C.; Chan, K.Y.; Joanette, Y.; Prince, M.; Rossor, M.; et al. Research priorities to reduce the global burden of dementia by 2025. Lancet Neurol. 2016, 15, 1285–1294. [Google Scholar] [CrossRef]
- Carey, R.M.; Muntner, P.; Bosworth, H.B.; Whelton, P.K. Prevention and Control of Hypertension: JACC Health Promotion Series. J. Am. Coll. Cardiol. 2018, 72, 1278–1293. [Google Scholar] [CrossRef] [PubMed]
- Zheng, Y.; Ley, S.H.; Hu, F.B. Global aetiology and epidemiology of type 2 diabetes mellitus and its complications. Nat. Rev. Endocrinol. 2018, 14, 88–98. [Google Scholar] [CrossRef]
- Scarmeas, N.; Anastasiou, C.A.; Yannakoulia, M. Nutrition and prevention of cognitive impairment. Lancet Neurol. 2018, 17, 1006–1015. [Google Scholar] [CrossRef]
- Ding, M.; Li, J.; Qi, L.; Ellervik, C.; Zhang, X.; Manson, J.E.; Stampfer, M.; Chavarro, J.E.; Rexrode, K.M.; Kraft, P.; et al. Associations of dairy intake with risk of mortality in women and men: Three prospective cohort studies. BMJ 2019, 367, l6204. [Google Scholar] [CrossRef] [Green Version]
- Hu, Y.; Ding, M.; Sampson, L.; Willett, W.C.; Manson, J.E.; Wang, M.; Rosner, B.; Hu, F.B.; Sun, Q. Intake of whole grain foods and risk of type 2 diabetes: Results from three prospective cohort studies. BMJ 2020, 370, m2206. [Google Scholar] [CrossRef]
- Guasch-Ferré, M.; Liu, X.; Malik, V.S.; Sun, Q.; Willett, W.C.; Manson, J.E.; Rexrode, K.M.; Li, Y.; Hu, F.B.; Bhupathiraju, S.N. Nut Consumption and Risk of Cardiovascular Disease. J. Am. Coll. Cardiol. 2017, 70, 2519–2532. [Google Scholar] [CrossRef]
- Guasch-Ferré, M.; Liu, G.; Li, Y.; Sampson, L.; Manson, J.E.; Salas-Salvadó, J.; Martínez-González, M.A.; Stampfer, M.J.; Willett, W.C.; Sun, Q.; et al. Olive Oil Consumption and Cardiovascular Risk in U.S. Adults. J. Am. Coll. Cardiol. 2020, 75, 1729–1739. [Google Scholar] [CrossRef]
- Liu, G.; Guasch-Ferré, M.; Hu, Y.; Li, Y.; Hu, F.B.; Rimm, E.B.; Manson, J.E.; Rexrode, K.M.; Sun, Q. Nut Consumption in Relation to Cardiovascular Disease Incidence and Mortality Among Patients With Diabetes Mellitus. Circ. Res. 2019, 124, 920–929. [Google Scholar] [CrossRef]
- Baden, M.Y.; Liu, G.; Satija, A.; Li, Y.; Sun, Q.; Fung, T.T.; Rimm, E.B.; Willett, W.C.; Hu, F.B.; Bhupathiraju, S.N. Changes in Plant-Based Diet Quality and Total and Cause-Specific Mortality. Circulation 2019, 140, 979–991. [Google Scholar] [CrossRef] [PubMed]
- Chen, Z.; Drouin-Chartier, J.P.; Li, Y.; Baden, M.Y.; Manson, J.E.; Willett, W.C.; Voortman, T.; Hu, F.B.; Bhupathiraju, S.N. Changes in Plant-Based Diet Indices and Subsequent Risk of Type 2 Diabetes in Women and Men: Three U.S. Prospective Cohorts. Diabetes Care 2021, 44, 663–671. [Google Scholar] [CrossRef] [PubMed]
- Hu, E.A.; Steffen, L.M.; Coresh, J.; Appel, L.J.; Rebholz, C.M. Adherence to the Healthy Eating Index-2015 and Other Dietary Patterns May Reduce Risk of Cardiovascular Disease, Cardiovascular Mortality, and All-Cause Mortality. J. Nutr. 2020, 150, 312–321. [Google Scholar] [CrossRef] [PubMed]
- Estrella, M.L.; Durazo-Arvizu, R.A.; Mattei, J.; Mossavar-Rahmani, Y.; Perreira, K.M.; Siega-Riz, A.M.; Sotres-Alvarez, D.; González, H.M.; Gallo, L.C.; Daviglus, M.L. Alternate Healthy Eating Index is Positively Associated with Cognitive Function Among Middle-Aged and Older Hispanics/Latinos in the HCHS/SOL. J. Nutr. 2020, 150, 1478–1487. [Google Scholar] [CrossRef]
- Schulpen, M.; van den Brandt, P.A. Mediterranean diet adherence and risk of colorectal cancer: The prospective Netherlands Cohort Study. Eur. J. Epidemiol. 2020, 35, 25–35. [Google Scholar] [CrossRef] [Green Version]
- Shan, Z.; Li, Y.; Baden, M.Y.; Bhupathiraju, S.N.; Wang, D.D.; Sun, Q.; Rexrode, K.M.; Rimm, E.B.; Qi, L.; Willett, W.C.; et al. Association Between Healthy Eating Patterns and Risk of Cardiovascular Disease. JAMA Intern. Med. 2020, 180, 1090–1100. [Google Scholar] [CrossRef]
- Struijk, E.A.; Hagan, K.A.; Fung, T.T.; Hu, F.B.; Rodríguez-Artalejo, F.; Lopez-Garcia, E. Diet quality and risk of frailty among older women in the Nurses’ Health Study. Am. J. Clin. Nutr. 2020, 111, 877–883. [Google Scholar] [CrossRef]
- Ma, Y.; Yang, W.; Simon, T.G.; Smith-Warner, S.A.; Fung, T.T.; Sui, J.; Chong, D.; VoPham, T.; Meyerhardt, J.A.; Wen, D.; et al. Dietary Patterns and Risk of Hepatocellular Carcinoma Among U.S. Men and Women. Hepatology 2019, 70, 577–586. [Google Scholar] [CrossRef]
- Wu, J.; Song, X.; Chen, G.C.; Neelakantan, N.; van Dam, R.M.; Feng, L.; Yuan, J.M.; Pan, A.; Koh, W.P. Dietary pattern in midlife and cognitive impairment in late life: A prospective study in Chinese adults. Am. J. Clin. Nutr. 2019, 110, 912–920. [Google Scholar] [CrossRef] [Green Version]
- Shannon, O.M.; Stephan, B.C.M.; Granic, A.; Lentjes, M.; Hayat, S.; Mulligan, A.; Brayne, C.; Khaw, K.T.; Bundy, R.; Aldred, S.; et al. Mediterranean diet adherence and cognitive function in older UK adults: The European Prospective Investigation into Cancer and Nutrition-Norfolk (EPIC-Norfolk) Study. Am. J. Clin. Nutr. 2019, 110, 938–948. [Google Scholar] [CrossRef]
- Mattei, J.; Bigornia, S.J.; Sotos-Prieto, M.; Scott, T.; Gao, X.; Tucker, K.L. The Mediterranean Diet and 2-Year Change in Cognitive Function by Status of Type 2 Diabetes and Glycemic Control. Diabetes Care 2019, 42, 1372–1379. [Google Scholar] [CrossRef] [PubMed] [Green Version]
- Keenan, T.D.; Agrón, E.; Mares, J.A.; Clemons, T.E.; van Asten, F.; Swaroop, A.; Chew, E.Y. Adherence to a Mediterranean diet and cognitive function in the Age-Related Eye Disease Studies 1 & 2. Alzheimers Dement. 2020, 16, 831–842. [Google Scholar] [CrossRef] [PubMed]
- Berendsen, A.A.M.; Kang, J.H.; van de Rest, O.; Feskens, E.J.M.; de Groot, L.; Grodstein, F. The Dietary Approaches to Stop Hypertension Diet, Cognitive Function, and Cognitive Decline in American Older Women. J. Am. Med. Dir. Assoc. 2017, 18, 427–432. [Google Scholar] [CrossRef] [PubMed]
- Haring, B.; Wu, C.; Mossavar-Rahmani, Y.; Snetselaar, L.; Brunner, R.; Wallace, R.B.; Neuhouser, M.L.; Wassertheil-Smoller, S. No Association between Dietary Patterns and Risk for Cognitive Decline in Older Women with 9-Year Follow-Up: Data from the Women’s Health Initiative Memory Study. J. Acad. Nutr. Diet. 2016, 116, 921–930. [Google Scholar] [CrossRef] [PubMed] [Green Version]
- Lourida, I.; Kuźma, E.; Llewelyn, D.J. Healthy Diet and Risk of Dementia in Older Adults—Reply. JAMA 2019, 322, 2444–2445. [Google Scholar] [CrossRef] [PubMed]
- Zheng, J.; Zhou, R.; Li, F.; Chen, L.; Wu, K.; Huang, J.; Liu, H.; Huang, Z.; Xu, L.; Yuan, Z.; et al. Association between dietary diversity and cognitive impairment among the oldest-old: Findings from a nationwide cohort study. Clin. Nutr. 2021, 40, 1452–1462. [Google Scholar] [CrossRef] [PubMed]
- Dominguez, L.J.; Barbagallo, M. Nutritional prevention of cognitive decline and dementia. Acta Biomed. 2018, 89, 276–290. [Google Scholar] [CrossRef]
- Nooyens, A.C.J.; Yildiz, B.; Hendriks, L.G.; Bas, S.; van Boxtel, M.P.J.; Picavet, H.S.J.; Boer, J.M.A.; Verschuren, W.M.M. Adherence to dietary guidelines and cognitive decline from middle age: The Doetinchem Cohort Study. Am. J. Clin. Nutr. 2021, 114, 871–881. [Google Scholar] [CrossRef]
- Lehtisalo, J.; Levälahti, E.; Lindström, J.; Hänninen, T.; Paajanen, T.; Peltonen, M.; Antikainen, R.; Laatikainen, T.; Strandberg, T.; Soininen, H.; et al. Dietary changes and cognition over 2 years within a multidomain intervention trial—The Finnish Geriatric Intervention Study to Prevent Cognitive Impairment and Disability (FINGER). Alzheimer’s Dement. 2019, 15, 410–417. [Google Scholar] [CrossRef]
- Rouen, P.A.; Wallace, B.R. The 2015–2020 Dietary Guidelines: Overview and Implications for Nursing Practice. Home Healthc. Now. 2017, 35, 72–82. [Google Scholar] [CrossRef]
- Zeng, Y.; Feng, Q.; Hesketh, T.; Christensen, K.; Vaupel, J.W. Survival, disabilities in activities of daily living, and physical and cognitive functioning among the oldest-old in China: A cohort study. Lancet 2017, 389, 1619–1629. [Google Scholar] [CrossRef]
- Liu, D.; Zhang, X.R.; Li, Z.H.; Zhang, Y.J.; Lv, Y.B.; Wang, Z.H.; Shen, D.; Chen, P.L.; Zhong, W.F.; Huang, Q.M.; et al. Association of dietary diversity changes and mortality among older people: A prospective cohort study. Clin. Nutr. 2021, 40, 2620–2629. [Google Scholar] [CrossRef] [PubMed]
- Zhao, W.H.; Huang, Z.P.; Zhang, X.; Li, H.E.; Willett, W.; Wang, J.L.; Hasegawa, K.; Chen, J.S. Reproducibility and Validity of a Chinese Food Frequency Questionnaire. Biomed. Environ. Sci. BES 2010, 23, 1–38. [Google Scholar] [CrossRef]
- Zhao, W.; Hasegawa, K.; Chen, J. The use of food-frequency questionnaires for various purposes in China. Public. Health Nutr. 2002, 5, 829–833. [Google Scholar] [CrossRef] [PubMed] [Green Version]
- Kant, A.K.; Schatzkin, A.; Harris, T.B.; Ziegler, R.G.; Block, G. Dietary diversity and subsequent mortality in the First National Health and Nutrition Examination Survey Epidemiologic Follow-up Study. Am. J. Clin. Nutr. 1993, 57, 434–440. [Google Scholar] [CrossRef] [PubMed]
- Katzman, R.; Zhang, M.Y.; Ya, Q.; Wang, Z.Y.; Liu, W.T.; Yu, E.; Wong, S.C.; Salmon, D.P.; Grant, I. A Chinese version of the Mini-Mental State Examination; impact of illiteracy in a Shanghai dementia survey. J. Clin. Epidemiol. 1988, 41, 971–978. [Google Scholar] [CrossRef]
- Cui, G.H.; Yao, Y.H.; Xu, R.F.; Tang, H.D.; Jiang, G.X.; Wang, Y.; Wang, G.; Chen, S.D.; Cheng, Q. Cognitive impairment using education-based cutoff points for CMMSE scores in elderly Chinese people of agricultural and rural Shanghai China. Acta Neurol. Scand. 2011, 124, 361–367. [Google Scholar] [CrossRef]
- Katz, S.; Ford, A.B.; Moskowitz, R.W.; Jackson, B.A.; Jaffe, M.W. The index of ADL: A standardized measure of biological and psychosocial function. JAMA 1963, 185, 914–919. [Google Scholar] [CrossRef]
- Cano-Ibáñez, N.; Gea, A.; Martínez-González, M.A.; Salas-Salvadó, J.; Corella, D.; Zomeño, M.D.; Romaguera, D.; Vioque, J.; Aros, F.; Wärnberg, J. Dietary diversity and nutritional adequacy among an older Spanish population with metabolic syndrome in the PREDIMED-plus study: A cross-sectional analysis. Nutrients 2019, 11, 958. [Google Scholar] [CrossRef] [Green Version]
- Sultana, M.; Hasan, T.; Shaheen, N. Energy and Nutrient Intake and Dietary Diversity Among Female Residential Students of Bangladesh. Curr. Res. Nutr. Food Sci. 2019, 7, 244. [Google Scholar] [CrossRef]
- Cipriani, G.; Carlesi, C.; Lucetti, C.; Danti, S.; Nuti, A. Eating Behaviors and Dietary Changes in Patients With Dementia. Am. J. Alzheimers Dis. Other Demen. 2016, 31, 706–716. [Google Scholar] [CrossRef] [PubMed]
- United States Department of Agriculture. Scientific Report of the 2015 Dietary Guidelines Advisory Committee; United States Department of Agriculture: Washington, DC, USA, 2015. [Google Scholar]
- U. S. Department of Health and Human Services, U.S.D.o.A. 2015–2020 Dietary Guidelines for Americans, 8th ed.; U.S. Department of Health and Human Services, United States Department of Agriculture: Washington, DC, USA, 2015. [Google Scholar]
- Fernandez, M.L.; Raheem, D.; Ramos, F.; Carrascosa, C.; Saraiva, A.; Raposo, A. Highlights of Current Dietary Guidelines in Five Continents. Int. J. Env. Res. Public. Health 2021, 18, 2814. [Google Scholar] [CrossRef] [PubMed]
- Krebs-Smith, S.M.; Pannucci, T.E.; Subar, A.F.; Kirkpatrick, S.I.; Lerman, J.L.; Tooze, J.A.; Wilson, M.M.; Reedy, J. Update of the Healthy Eating Index: HEI-2015. J. Acad. Nutr. Diet. 2018, 118, 1591–1602. [Google Scholar] [CrossRef] [PubMed] [Green Version]
- Montagnese, C.; Santarpia, L.; Buonifacio, M.; Nardelli, A.; Caldara, A.R.; Silvestri, E.; Contaldo, F.; Pasanisi, F. European food-based dietary guidelines: A comparison and update. Nutrition 2015, 31, 908–915. [Google Scholar] [CrossRef] [PubMed]
- Rhee, J.J.; Cho, E.; Willett, W.C. Energy adjustment of nutrient intakes is preferable to adjustment using body weight and physical activity in epidemiological analyses. Public Health Nutr. 2014, 17, 1054–1060. [Google Scholar] [CrossRef] [Green Version]
- Zhang, P.D.; Lv, Y.B.; Li, Z.H.; Yin, Z.X.; Li, F.R.; Wang, J.N.; Zhang, X.R.; Zhou, J.H.; Wu, X.B.; Duan, J.; et al. Age, Period, and Cohort Effects on Activities of Daily Living, Physical Performance, and Cognitive Functioning Impairment Among the Oldest-Old in China. J. Gerontol. A Biol. Sci. Med. Sci. 2020, 75, 1214–1221. [Google Scholar] [CrossRef]
- Yin, Z.; Fei, Z.; Qiu, C.; Brasher, M.S.; Kraus, V.B.; Zhao, W.; Shi, X.; Zeng, Y. Dietary Diversity and Cognitive Function among Elderly People: A Population-Based Study. J. Nutr. Health Aging 2017, 21, 1089–1094. [Google Scholar] [CrossRef]
- Lam, F.M.; Huang, M.Z.; Liao, L.R.; Chung, R.C.; Kwok, T.C.; Pang, M.Y. Physical exercise improves strength, balance, mobility, and endurance in people with cognitive impairment and dementia: A systematic review. J. Physiother. 2018, 64, 4–15. [Google Scholar] [CrossRef]
- Zhang, Q.; Wu, Y.; Han, T.; Liu, E. Changes in Cognitive Function and Risk Factors for Cognitive Impairment of the Elderly in China: 2005–2014. Int. J. Env. Res. Public. Health 2019, 16, 2847. [Google Scholar] [CrossRef] [Green Version]
- Jakes, R.W.; Day, N.E.; Luben, R.; Welch, A.; Bingham, S.; Mitchell, J.; Hennings, S.; Rennie, K.; Wareham, N.J. Adjusting for energy intake--what measure to use in nutritional epidemiological studies? Int. J. Epidemiol. 2004, 33, 1382–1386. [Google Scholar] [CrossRef] [Green Version]


| Variables | Total | DDS Change Patterns from Baseline to First Follow Up | ||||||||
|---|---|---|---|---|---|---|---|---|---|---|
| High-High | High-Medium | High-Low | Medium-High | Medium-Medium | Medium-Low | Low-High | Low-Medium | Low-Low | ||
| Number of participants | 9726 (100.0) | 1225 (12.6) | 1175 (12.1) | 115 (1.2) | 1442 (14.8) | 4012 (41.3) | 743 (7.6) | 139 (1.4) | 616 (6.3) | 259 (2.7) |
| Age in years, mean (SD) | 80.0 (10.1) | 76.2 (9.6) | 78.6 (10.2) | 80.2 (10.6) | 78.6 (10.1) | 81.2 (10.0) | 82.3 (9.7) | 80.1 (10.0) | 82.2 (9.4) | 83.9 (9.4) |
| Age group in years | ||||||||||
| 65–79 | 4237 (43.6) | 767 (62.6) | 601 (51.2) | 52 (45.2) | 719 (49.9) | 1536 (38.3) | 249 (33.5) | 54 (38.9) | 190 (30.8) | 69 (26.6) |
| 80–89 | 3614 (37.2) | 318 (26.0) | 371 (31.6) | 39 (33.9) | 487 (33.8) | 1617 (40.3) | 319 (42.9) | 57 (41.0) | 289 (46.9) | 117 (45.2) |
| 90–99 | 1449 (14.9) | 116 (9.5) | 157 (13.4) | 17 (14.8) | 179 (12.4) | 658 (16.4) | 132 (17.8) | 23 (16.6) | 113 (18.3) | 54 (20.9) |
| ≥100 | 426 (4.4) | 24 (2.0) | 46 (3.9) | 7 (6.1) | 57 (4.0) | 201 (5.0) | 43 (5.8) | 5 (3.6) | 24 (3.9) | 19 (7.3) |
| Male | 4644 (47.8) | 748 (61.1) | 625 (53.2) | 38 (33.0) | 772 (53.5) | 1826 (45.5) | 264 (35.5) | 57 (41.0) | 239 (38.8) | 75 (29.0) |
| Urban Residence | 2338 (24.0) | 405 (33.1) | 311 (26.5) | 19 (16.5) | 376 (26.1) | 907 (22.6) | 135 (18.2) | 26 (18.7) | 123 (20.0) | 36 (13.9) |
| Education level | ||||||||||
| No schooling | 5328 (54.8) | 435 (35.5) | 562 (47.8) | 69 (60.0) | 685 (47.5) | 2334 (58.2) | 508 (68.4) | 97 (69.8) | 429 (69.6) | 209 (80.7) |
| ≤6 years | 3316 (34.1) | 512 (41.8) | 450 (38.3) | 34 (29.6) | 539 (37.4) | 1333 (33.2) | 210 (28.3) | 35 (25.2) | 157 (25.5) | 46 (17.8) |
| >6 years | 1082 (11.1) | 278 (22.7) | 163 (13.9) | 12 (10.4) | 218 (15.1) | 345 (8.6) | 25 (3.4) | 7 (5.0) | 30 (4.9) | 4 (1.5) |
| Occupation | ||||||||||
| Worker | 2707 (27.9) | 273 (22.3) | 252 (21.5) | 19 (16.5) | 343 (23.8) | 1178 (29.4) | 251 (33.8) | 31 (22.3) | 246 (39.9) | 114 (44.0) |
| Farmer | 4483 (46.1) | 543 (44.3) | 589 (50.2) | 71 (61.7) | 710 (49.3) | 1838 (45.9) | 331 (44.6) | 86 (61.9) | 223 (36.2) | 92 (35.5) |
| Others | 2529 (26.0) | 409 (33.4) | 333 (28.4) | 25 (21.7) | 388 (26.9) | 991 (24.7) | 161 (21.7) | 22 (15.8) | 147 (23.9) | 53 (20.5) |
| Source of income | ||||||||||
| Pension | 2084 (21.4) | 504 (41.1) | 317 (27.0) | 16 (13.9) | 391 (27.1) | 690 (17.2) | 66 (8.9) | 23 (16.6) | 63 (10.2) | 14 (5.4) |
| Other | 7642 (78.6) | 721 (58.9) | 858 (73.0) | 99 (86.1) | 1051 (72.9) | 3322 (82.8) | 677 (91.1) | 116 (83.5) | 553 (89.8) | 245 (94.6) |
| In marriage | 4330 (44.5) | 764 (62.4) | 618 (52.6) | 47 (40.9) | 741 (51.4) | 1583 (39.5) | 234 (31.5) | 65 (46.8) | 203 (33.0) | 75 (29.0) |
| Living pattern | ||||||||||
| Living with family members | 8166 (84.0) | 1099 (89.7) | 1040 (88.5) | 98 (85.2) | 1249 (86.6) | 3334 (83.1) | 569 (76.6) | 110 (79.7) | 477 (77.4) | 190 (73.4) |
| Alone | 1325 (13.6) | 109 (8.9) | 116 (9.9) | 15 (13.0) | 160 (11.1) | 556 (13.9) | 154 (20.7) | 25 (18.1) | 123 (20.0) | 67 (25.9) |
| At nursing home | 234 (2.4) | 17 (1.4) | 19 (1.6) | 2 (1.7) | 33 (2.3) | 122 (3.0) | 20 (2.7) | 3 (2.2) | 16 (2.6) | 2 (0.8) |
| Tobacco smoking | ||||||||||
| Current smoker | 2295 (23.6) | 343 (28.0) | 305 (26.0) | 24 (20.9) | 373 (25.9) | 899 (22.4) | 136 (18.3) | 31 (22.3) | 135 (21.9) | 49 (19.1) |
| Former smoker | 1310 (13.5) | 216 (17.6) | 166 (14.1) | 10 (8.7) | 226 (15.7) | 513 (12.8) | 82 (11.0) | 14 (10.1) | 68 (11.0) | 15 (5.8) |
| Nonsmoker | 6114 (62.9) | 666 (54.4) | 703 (59.9) | 81 (70.4) | 842 (58.4) | 2597 (64.8) | 525 (70.7) | 94 (67.6) | 413 (67.1) | 193 (75.1) |
| Alcohol drinking | ||||||||||
| Current drinker | 2391 (24.6) | 400 (32.7) | 336 (28.6) | 24 (20.9) | 368 (25.5) | 915 (22.8) | 158 (21.3) | 31 (22.3) | 124 (20.1) | 35 (13.7) |
| Former drinker | 870 (9.0) | 106 (8.7) | 96 (8.2) | 7 (6.1) | 157 (10.9) | 364 (9.1) | 60 (8.1) | 12 (8.6) | 52 (8.4) | 16 (6.3) |
| Nondrinker | 6454 (66.4) | 719 (58.7) | 743 (63.2) | 84 (73.0) | 916 (63.6) | 2727 (68.1) | 525 (70.7) | 96 (69.1) | 440 (71.4) | 204 (80.0) |
| Regular exercises | 3586 (36.9) | 604 (49.3) | 531 (45.2) | 42 (36.5) | 581 (40.3) | 1400 (34.9) | 200 (26.9) | 32 (23.0) | 144 (23.4) | 52 (20.1) |
| Use of artificial denture | 2951 (30.4) | 478 (39.0) | 401 (34.1) | 29 (25.2) | 510 (35.4) | 1120 (27.9) | 186 (25.1) | 43 (30.9) | 134 (21.8) | 50 (19.3) |
| BMI, mean (SD), kg/m | 21.8 (4.6) | 22.7 (4.5) | 22.3 (4.6) | 21.5 (4.0) | 21.7 (4.1) | 21.7 (4.7) | 21.8 (4.7) | 20.9 (4.0) | 21.2 (4.4) | 21.4 (4.8) |
| Chronic diseases | ||||||||||
| Hypertension | 1643 (17.0) | 246 (20.2) | 198 (17.0) | 13 (11.4) | 261 (18.2) | 632 (15.9) | 115 (15.6) | 24 (17.3) | 110 (17.9) | 44 (17.0) |
| Diabetes | 193 (2.0) | 37 (3.1) | 27 (2.3) | 1 (0.9) | 41 (2.9) | 65 (1.6) | 8 (1.1) | 3 (2.2) | 9 (1.5) | 2 (0.8) |
| Heart diseases | 774 (8.0) | 124 (10.2) | 93 (8.0) | 7 (6.1) | 136 (9.5) | 273 (6.9) | 55 (7.5) | 9 (6.5) | 60 (9.8) | 17 (6.6) |
| Cerebrovascular diseases | 343 (3.6) | 48 (4.0) | 49 (4.2) | 2 (1.8) | 64 (4.5) | 122 (3.1) | 23 (3.1) | 10 (7.2) | 18 (2.9) | 7 (2.7) |
| Respiratory diseases | 991 (10.3) | 131 (10.8) | 107 (9.2) | 13 (11.4) | 163 (11.3) | 397 (10.0) | 78 (10.6) | 10 (7.2) | 70 (11.4) | 22 (8.5) |
| Digestive system diseases | 493 (5.1) | 53 (4.4) | 60 (5.2) | 8 (7.0) | 77 (5.4) | 198 (5.0) | 36 (4.9) | 8 (5.8) | 41 (6.7) | 12 (4.7) |
| Cancer | 23 (0.2) | 7 (0.6) | 3 (0.3) | 0 (0.0) | 3 (0.2) | 8 (0.2) | 0 (0.0) | 0 (0.0) | 2 (0.3) | 0 (0.0) |
| ADL disabled | 762 (7.8) | 62 (5.1) | 80 (6.8) | 9 (7.8) | 108 (7.5) | 340 (8.5) | 78 (10.5) | 9 (6.5) | 53 (8.6) | 23 (8.9) |
| Eye diseases | 1035 (10.7) | 106 (8.7) | 111 (9.5) | 12 (10.5) | 142 (9.9) | 465 (11.7) | 79 (10.7) | 18 (13.0) | 79 (12.9) | 23 (8.9) |
| Arthritis | 1708 (17.6) | 218 (17.8) | 201 (17.1) | 27 (23.5) | 245 (17.0) | 695 (17.3) | 139 (18.7) | 24 (17.3) | 114 (18.5) | 45 (17.4) |
| Foods | DDS Change Patterns from Baseline to First Follow Up | ||||||||
|---|---|---|---|---|---|---|---|---|---|
| Frequent-Frequent | Frequent-Occasional | Frequent-Rare | Occasional-Frequent | Occasional-Occasional | Occasional-Rare | Rare-Frequent | Rare-Occasional | Rare-Rare | |
| Garlic | |||||||||
| No of cognitive impairment/person years | 217/5865 | 223/4611 | 150/2846 | 254/5885 | 466/9033 | 436/6709 | 159/3225 | 365/6085 | 535/8064 |
| Incidence rate | 37.0 | 48.4 | 52.7 | 43.2 | 51.6 | 65.0 | 49.3 | 60.0 | 66.3 |
| HR (95%CI) | 1 (ref) | 1.28 (1.06–1.55) | 1.30 (1.05–1.60) | 0.94 (0.78–1.13) | 1.18 (1.00–1.40) | 1.66 (1.41–1.96) | 1.03 (0.83–1.26) | 1.26 (1.06–1.50) | 1.46 (1.24–1.72) |
| Fresh fruit | |||||||||
| No of cognitive impairment/person years | 377/9201 | 246/5357 | 136/2651 | 318/6543 | 687/11117 | 366/5984 | 106/2186 | 306/4943 | 263/4343 |
| Incidence rate | 41.0 | 45.9 | 51.3 | 48.6 | 61.8 | 61.2 | 48.5 | 61.9 | 60.6 |
| HR (95%CI) | 1 (ref) | 1.13 (0.96–1.33) | 1.04 (0.85–1.27) | 1.21 (1.04–1.42) | 1.77 (1.54–2.02) | 1.44 (1.24–1.68) | 1.22 (0.98–1.52) | 1.54 (1.31–1.82) | 1.41 (1.19–1.68) |
| Tea | |||||||||
| No of cognitive impairment/person years | 447/10003 | 132/2617 | 254/4899 | 168/3121 | 81/1839 | 242/3773 | 221/4501 | 215/3689 | 1045/17883 |
| Incidence rate | 44.7 | 50.4 | 51.9 | 53.8 | 44.0 | 64.1 | 49.1 | 58.3 | 58.4 |
| HR (95%CI) | 1 (ref) | 1.12 (0.92–1.36) | 0.99 (0.84–1.15) | 1.00 (0.84–1.20) | 0.86 (0.68–1.10) | 1.21 (1.03–1.42) | 0.86 (0.73–1.02) | 1.21 (1.02–1.43) | 0.96 (0.85–1.08) |
| Fresh vegetables | |||||||||
| No of cognitive impairment/person years | 2089/41855 | 242/3778 | 71/894 | 249/3835 | 59/870 | 26/300 | 45/559 | 14/139 | 10/94 |
| Incidence rate | 49.9 | 64.1 | 79.4 | 64.9 | 67.8 | 86.6 | 80.5 | 100.5 | 106.0 |
| HR (95%CI) | 1 (ref) | 1.20 (1.05–1.37) | 1.03 (0.81–1.31) | 1.15 (1.00–1.31) | 1.37 (1.06–1.78) | 1.62 (1.10–2.40) | 1.09 (0.81–1.48) | 2.43 (1.43–4.15) | 2.65 (1.41–4.96) |
| Preserved vegetables | |||||||||
| No of cognitive impairment/person years | 292/6751 | 237/4706 | 239/4441 | 237/4816 | 310/5804 | 368/6437 | 189/3933 | 284/5161 | 649/10278 |
| Incidence rate | 43.3 | 50.4 | 53.8 | 49.2 | 53.4 | 57.2 | 48.1 | 55.0 | 63.1 |
| HR (95%CI) | 1 (ref) | 1.22 (1.03–1.45) | 1.15 (0.97–1.36) | 0.97 (0.81–1.15) | 1.20 (1.02–1.41) | 1.12 (0.96–1.31) | 0.91 (0.75–1.09) | 1.15 (0.97–1.36) | 1.18 (1.02–1.36) |
| Beans | |||||||||
| No of cognitive impairment/person years | 481/11407 | 358/7210 | 114/2214 | 496/9217 | 726/11303 | 240/3936 | 97/2050 | 182/3213 | 111/1775 |
| Incidence rate | 42.2 | 49.7 | 51.5 | 53.8 | 64.2 | 61.0 | 47.3 | 56.6 | 62.5 |
| HR (95%CI) | 1 (ref) | 1.30 (1.13–1.49) | 1.18 (0.96–1.45) | 1.25 (1.10–1.42) | 1.68 (1.48–1.90) | 1.52 (1.29–1.79) | 1.03 (0.82–1.29) | 1.51 (1.26–1.82) | 1.44 (1.16–1.79) |
| Fish | |||||||||
| No of cognitive impairment/person years | 269/6540 | 215/4846 | 101/1720 | 275/5924 | 728/13423 | 391/6268 | 95/1973 | 346/5728 | 385/5904 |
| Incidence rate | 41.1 | 44.4 | 58.7 | 46.4 | 54.2 | 62.4 | 48.2 | 60.4 | 65.2 |
| HR (95%CI) | 1 (ref) | 1.17 (0.98–1.40) | 1.44 (1.14–1.81) | 0.93 (0.78–1.11) | 1.34 (1.15–1.55) | 1.40 (1.19–1.64) | 0.87 (0.68–1.10) | 1.27 (1.07–1.50) | 1.41 (1.19–1.68) |
| Meat | |||||||||
| No of cognitive impairment/person years | 724/15434 | 306/5349 | 78/1587 | 434/8495 | 559/9567 | 245/3699 | 109/2301 | 176/3178 | 174/2714 |
| Incidence rate | 46.9 | 57.2 | 49.1 | 51.1 | 58.4 | 66.2 | 47.4 | 55.4 | 64.1 |
| HR (95%CI) | 1 (ref) | 1.46 (1.27–1.67) | 1.14 (0.90–1.44) | 0.96 (0.85–1.08) | 1.36 (1.21–1.53) | 1.38 (1.19–1.61) | 0.85 (0.69–1.04) | 1.06 (0.89–1.27) | 1.26 (1.06–1.51) |
| Eggs | |||||||||
| No of cognitive impairment/person years | 758/15832 | 307/6074 | 78/1931 | 438/8396 | 568/9080 | 204/3285 | 125/2480 | 192/3112 | 135/2135 |
| Incidence rate | 47.9 | 50.5 | 40.4 | 52.2 | 62.6 | 62.1 | 50.4 | 61.7 | 63.2 |
| HR (95%CI) | 1 (ref) | 1.11 (0.97–1.28) | 0.91 (0.72–1.15) | 0.98 (0.86–1.10) | 1.43 (1.27–1.61) | 1.39 (1.18–1.63) | 1.03 (0.85–1.26) | 1.45 (1.22–1.71) | 1.32 (1.09–1.61) |
| Subgroups | DDS Change Patterns from Baseline to First Follow Up | p for Interaction | ||||||||
|---|---|---|---|---|---|---|---|---|---|---|
| High-High | High-Medium | High-Low | Medium-High | Medium-Medium | Medium-Low | Low-High | Low-Medium | Low-Low | ||
| Age (years) | ||||||||||
| 65~79 | 1 (ref) | 1.20 (0.89–1.63) | 1.11 (0.55–2.24) | 0.81 (0.58–1.11) | 0.92 (0.70–1.21) | 1.09 (0.74–1.62) | 0.59 (0.21–1.62) | 1.11 (0.72–1.71) | 1.32 (0.73–2.39) | 0.00 |
| 80~ | 1 (ref) | 1.34 (1.09–1.64) | 1.37 (0.91–2.05) | 1.21 (1.00–1.48) | 1.74 (1.47–2.07) | 2.18 (1.76–2.69) | 1.17 (0.80–1.71) | 2.44 (1.96–3.04) | 3.14 (2.43–4.07) | |
| Sex | ||||||||||
| Male | 1 (ref) | 1.43 (1.13–1.82) | 1.85 (0.99–3.45) | 1.26 (0.99–1.60) | 1.72 (1.40–2.12) | 2.54 (1.92–3.37) | 1.44 (0.82–2.51) | 2.48 (1.84–3.33) | 4.47 (3.06–6.51) | 0.10 |
| Female | 1 (ref) | 1.22 (0.96–1.55) | 1.19 (0.78–1.83) | 1.03 (0.82–1.30) | 1.49 (1.22–1.82) | 1.71 (1.34–2.18) | 0.87 (0.55–1.38) | 2.04 (1.59–2.62) | 2.23 (1.66–3.00) | |
| Marital status | ||||||||||
| Married | 1 (ref) | 1.07 (0.82–1.41) | 1.12 (0.56–2.24) | 0.93 (0.71–1.23) | 1.12 (0.88–1.42) | 1.13 (0.80–1.61) | 0.73 (0.37–1.41) | 1.48 (1.04–2.10) | 2.14 (1.37–3.34) | 0.75 |
| Not married | 1 (ref) | 1.02 (0.82–1.27) | 0.84 (0.56–1.27) | 0.85 (0.68–1.05) | 0.94 (0.78–1.14) | 1.02 (0.81–1.28) | 0.96 (0.63–1.44) | 1.12 (0.88–1.42) | 1.09 (0.82–1.44) | |
| Tobacco smoking | ||||||||||
| Current or former smoker | 1 (ref) | 1.02 (0.77–1.35) | 0.68 (0.36–1.28) | 0.80 (0.61–1.05) | 0.97 (0.77–1.23) | 1.15 (0.83–1.58) | 1.13 (0.61–2.07) | 1.27 (0.91–1.77) | 1.93 (1.24–3.02) | 0.29 |
| Non-smoker | 1 (ref) | 1.06 (0.85–1.31) | 1.07 (0.70–1.63) | 0.93 (0.75–1.15) | 1.04 (0.86–1.25) | 1.13 (0.90–1.42) | 0.92 (0.60–1.41) | 1.28 (1.01–1.63) | 1.28 (0.96–1.70) | |
| Alcohol drinking | ||||||||||
| Current or former drinker | 1 (ref) | 0.95 (0.72–1.25) | 0.82 (0.44–1.55) | 0.79 (0.60–1.05) | 0.89 (0.70–1.13) | 0.88 (0.64–1.23) | 0.79 (0.41–1.52) | 0.99 (0.71–1.39) | 1.48 (0.96–2.29) | 0.45 |
| Non-drinker | 1 (ref) | 1.08 (0.87–1.34) | 1.04 (0.68–1.59) | 0.93 (0.75–1.15) | 1.10 (0.91–1.32) | 1.25 (0.99–1.57) | 1.01 (0.67–1.53) | 1.48 (1.16–1.88) | 1.35 (1.02–1.80) | |
| Regular exercises | ||||||||||
| Yes | 1 (ref) | 1.00 (0.77–1.29) | 0.79 (0.46–1.35) | 0.87 (0.67–1.12) | 1.14 (0.91–1.43) | 1.39 (1.01–1.90) | 1.15 (0.56–2.38) | 1.60 (1.12–2.29) | 2.04 (1.26–3.30) | 0.00 |
| No | 1 (ref) | 1.01 (0.81–1.27) | 1.05 (0.66–1.68) | 0.83 (0.67–1.03) | 0.90 (0.74–1.09) | 0.96 (0.76–1.21) | 0.83 (0.56–1.24) | 1.12 (0.88–1.42) | 1.18 (0.89–1.56) | |
| Use of artificial denture | ||||||||||
| Yes | 1 (ref) | 1.05 (0.79–1.39) | 1.60 (0.82–3.12) | 1.02 (0.78–1.34) | 1.17 (0.92–1.49) | 1.24 (0.86–1.79) | 1.29 (0.64–2.57) | 1.54 (1.03–2.29) | 1.03 (0.55–1.92) | 0.92 |
| No | 1 (ref) | 1.02 (0.82–1.27) | 0.78 (0.51–1.18) | 0.81 (0.66–1.01) | 0.95 (0.79–1.14) | 1.04 (0.83–1.30) | 0.85 (0.57–1.28) | 1.19 (0.94–1.50) | 1.37 (1.05–1.79) | |
| ADL disabled | ||||||||||
| Yes | 1 (ref) | 0.80 (0.48–1.31) | 1.64 (0.69–3.90) | 0.71 (0.44–1.15) | 0.72 (0.47–1.09) | 0.95 (0.57–1.58) | 0.34 (0.10–1.16) | 1.11 (0.66–1.89) | 1.44 (0.75–2.77) | 0.04 |
| No | 1 (ref) | 1.08 (0.90–1.30) | 0.84 (0.57–1.24) | 0.90 (0.75–1.08) | 1.07 (0.91–1.25) | 1.09 (0.89–1.34) | 0.98 (0.68–1.41) | 1.26 (1.03–1.56) | 1.30 (1.01–1.68) | |
Publisher’s Note: MDPI stays neutral with regard to jurisdictional claims in published maps and institutional affiliations. |
© 2022 by the authors. Licensee MDPI, Basel, Switzerland. This article is an open access article distributed under the terms and conditions of the Creative Commons Attribution (CC BY) license (https://creativecommons.org/licenses/by/4.0/).
Share and Cite
Liu, D.; Zhang, W.-T.; Wang, J.-H.; Shen, D.; Zhang, P.-D.; Li, Z.-H.; Chen, P.-L.; Zhang, X.-R.; Huang, Q.-M.; Zhong, W.-F.; et al. Association between Dietary Diversity Changes and Cognitive Impairment among Older People: Findings from a Nationwide Cohort Study. Nutrients 2022, 14, 1251. https://doi.org/10.3390/nu14061251
Liu D, Zhang W-T, Wang J-H, Shen D, Zhang P-D, Li Z-H, Chen P-L, Zhang X-R, Huang Q-M, Zhong W-F, et al. Association between Dietary Diversity Changes and Cognitive Impairment among Older People: Findings from a Nationwide Cohort Study. Nutrients. 2022; 14(6):1251. https://doi.org/10.3390/nu14061251
Chicago/Turabian StyleLiu, Dan, Wen-Ting Zhang, Jia-Hui Wang, Dong Shen, Pei-Dong Zhang, Zhi-Hao Li, Pei-Liang Chen, Xi-Ru Zhang, Qing-Mei Huang, Wen-Fang Zhong, and et al. 2022. "Association between Dietary Diversity Changes and Cognitive Impairment among Older People: Findings from a Nationwide Cohort Study" Nutrients 14, no. 6: 1251. https://doi.org/10.3390/nu14061251
APA StyleLiu, D., Zhang, W.-T., Wang, J.-H., Shen, D., Zhang, P.-D., Li, Z.-H., Chen, P.-L., Zhang, X.-R., Huang, Q.-M., Zhong, W.-F., Shi, X.-M., & Mao, C. (2022). Association between Dietary Diversity Changes and Cognitive Impairment among Older People: Findings from a Nationwide Cohort Study. Nutrients, 14(6), 1251. https://doi.org/10.3390/nu14061251