
A Consistency Model for Identifying the Effects of n-3 and n-6 Fatty Acids on Lipoproteins in Dialysis Patients

 and
and 
Abstract
1. Introduction
2. Methods
2.1. Study Selection Criteria
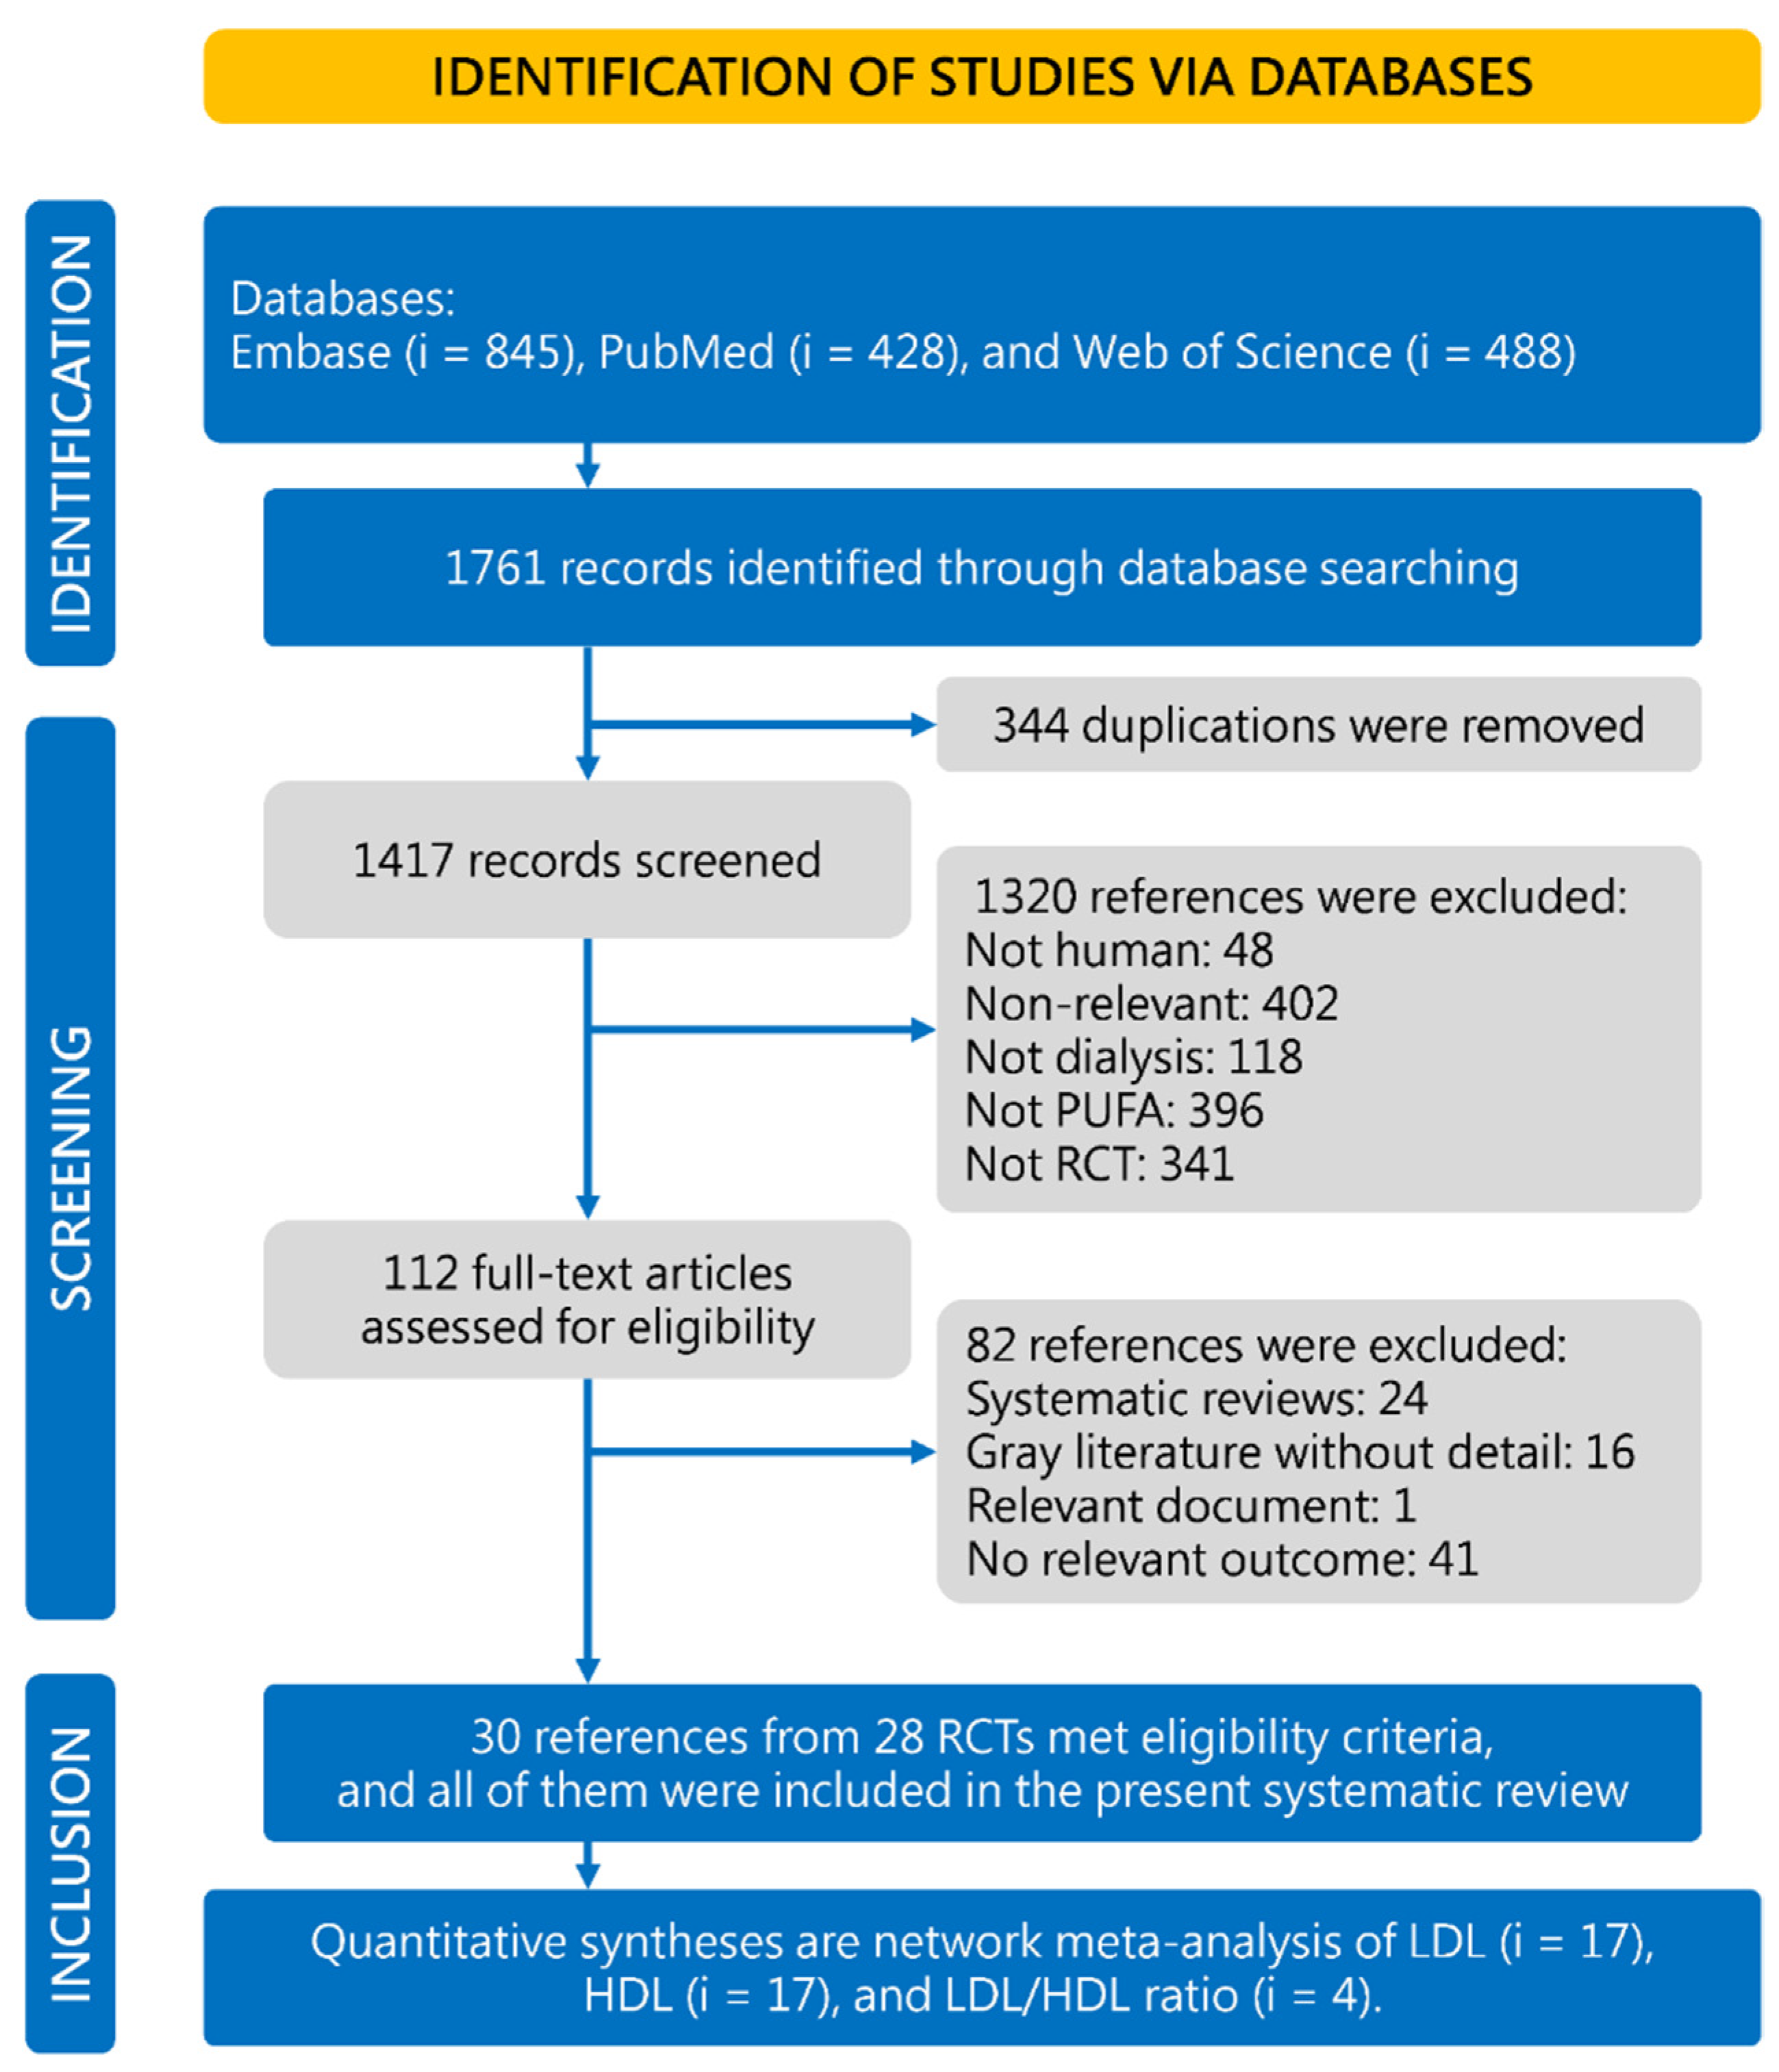
2.2. Search Strategy and Study Selection
2.3. Data Extraction and Quality Assessment
2.4. Evidence Synthesis and Statistical Analysis
2.5. Confidence Rating for Network Meta-Analysis
3. Results
3.1. Characteristics and Quality of the Included Studies
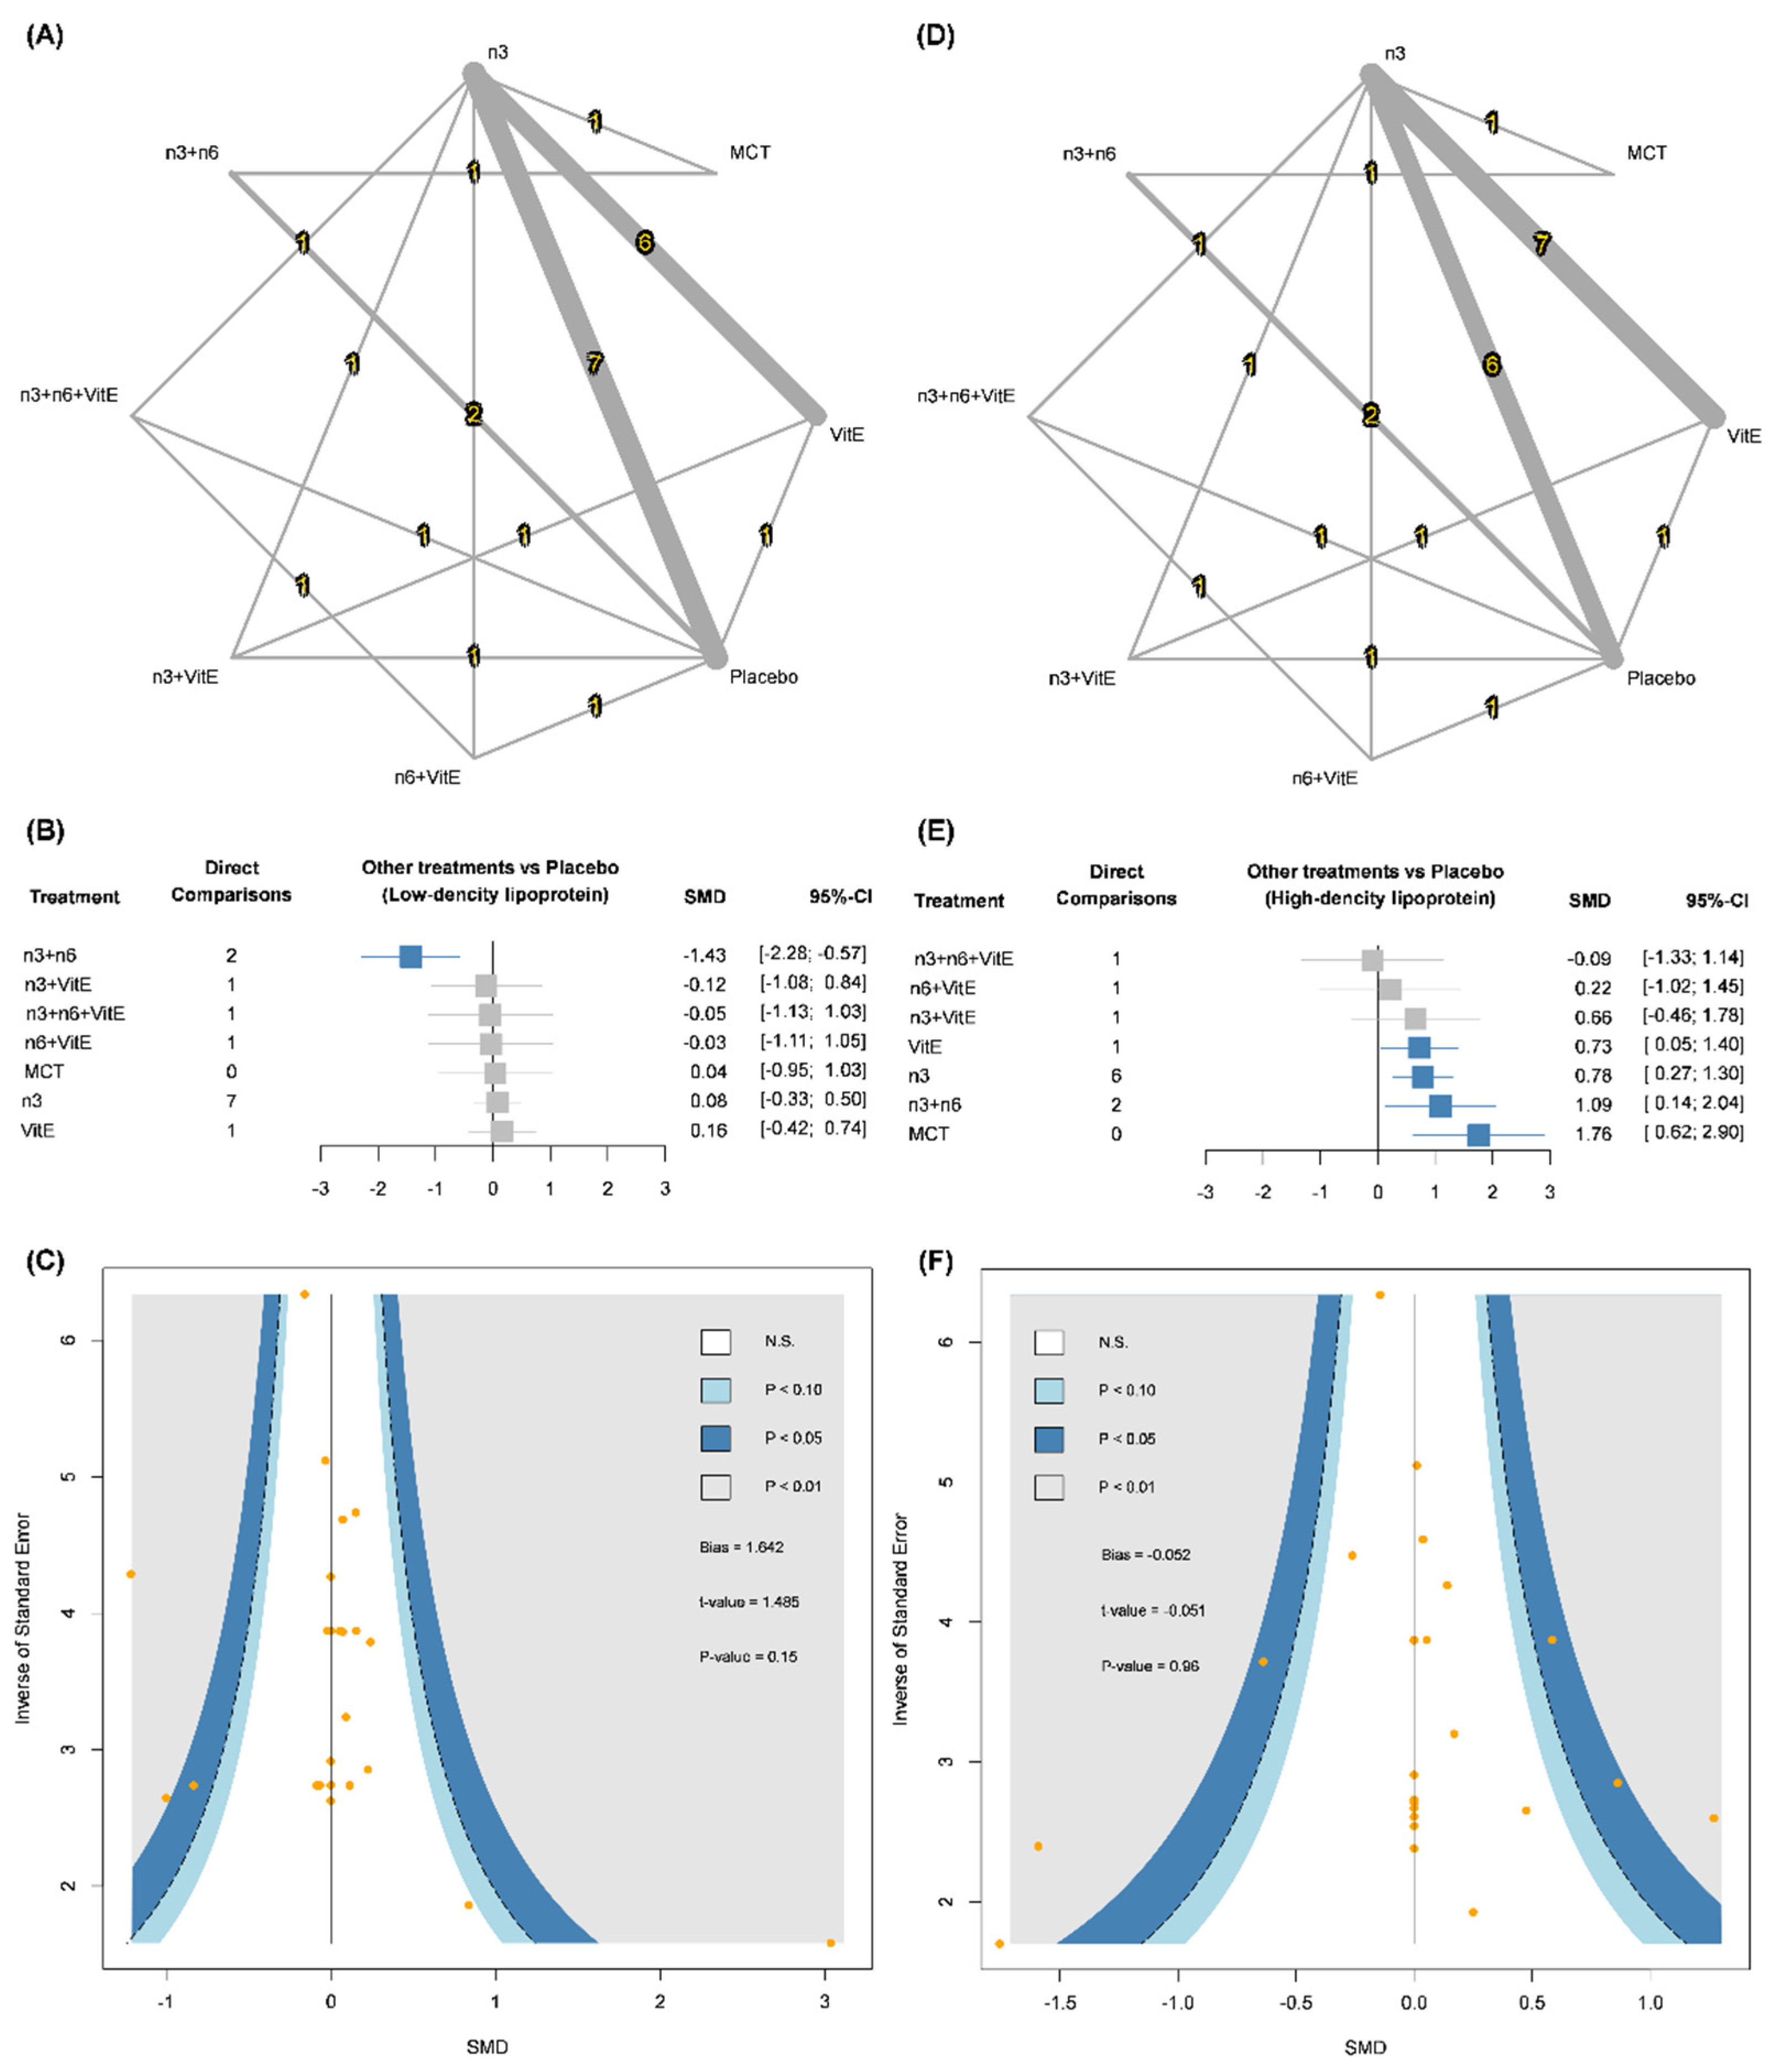
3.2. Low-Density Lipoprotein (LDL)
3.3. High-Density Lipoprotein (HDL)
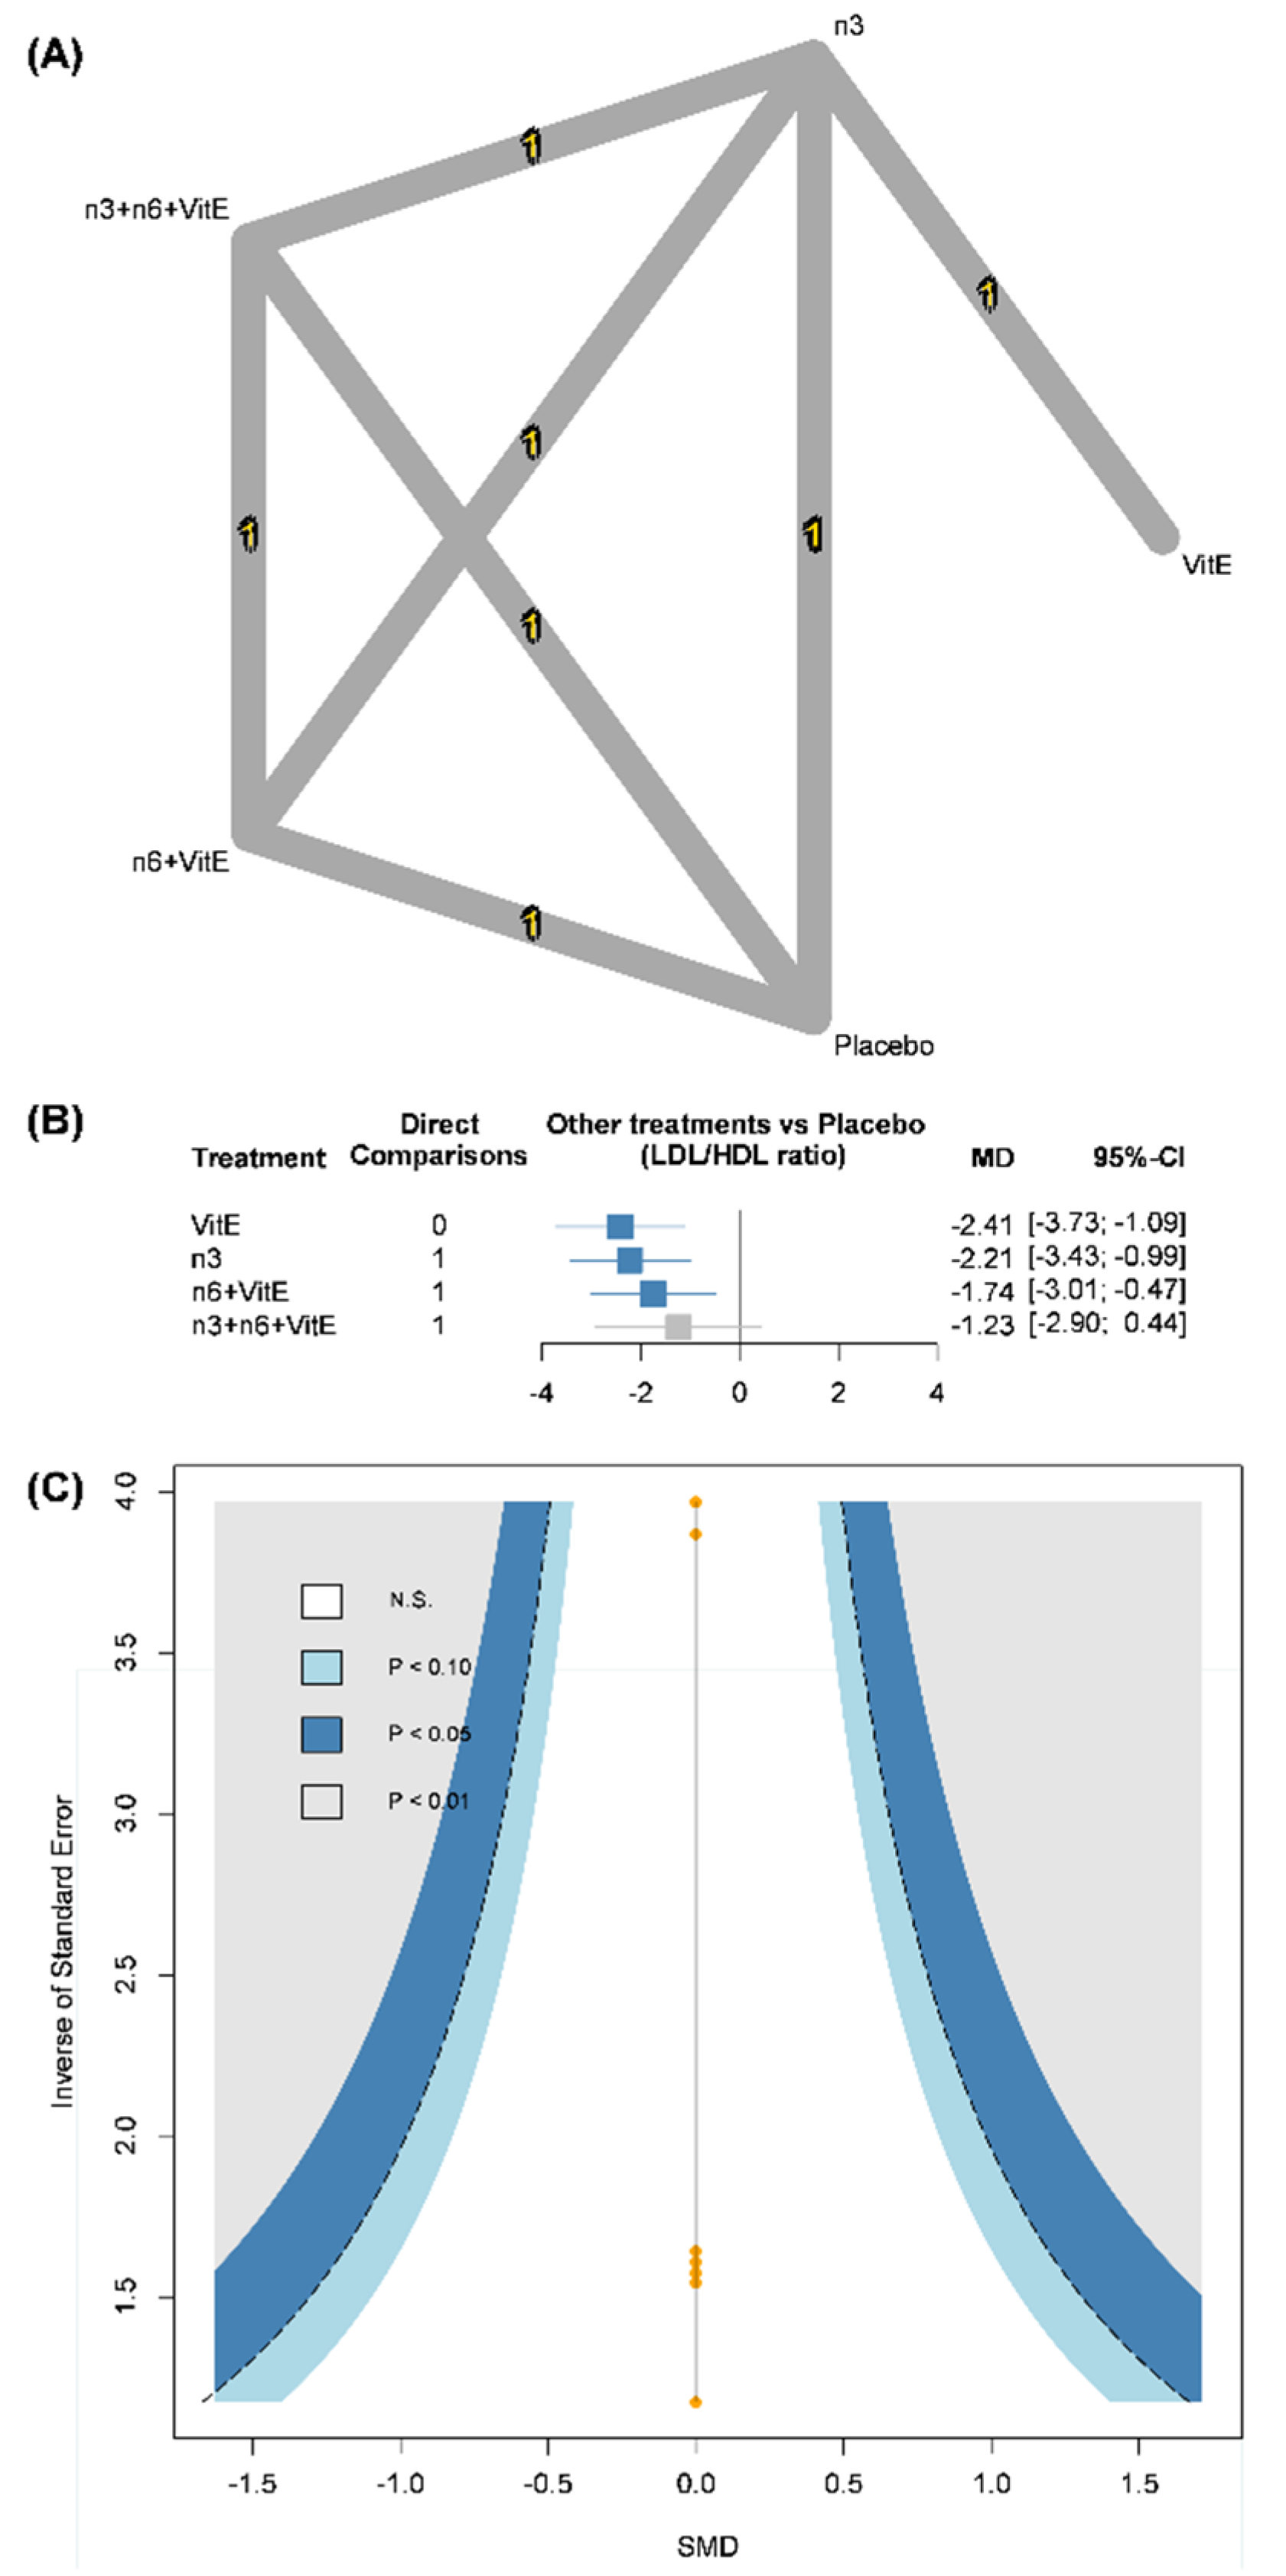
3.4. Low-Density Lipoprotein/High-Density Lipoprotein (LDL/HDL) Ratio
4. Discussion
Limitations
5. Conclusions
Supplementary Materials
Author Contributions
Funding
Institutional Review Board Statement
Informed Consent Statement
Data Availability Statement
Acknowledgments
Conflicts of Interest
References
- Alani, H.; Tamimi, A.; Tamimi, N. Cardiovascular co-morbidity in chronic kidney disease: Current knowledge and future research needs. World J. Nephrol. 2014, 3, 156–168. [Google Scholar] [CrossRef] [PubMed]
- Go, A.S.; Chertow, G.M.; Fan, D.; McCulloch, C.E.; Hsu, C.-Y. Chronic Kidney Disease and the Risks of Death, Cardiovascular Events, and Hospitalization. N. Engl. J. Med. 2004, 351, 1296–1305. [Google Scholar] [CrossRef] [PubMed]
- Linton, M.R.F.; Yancey, P.G.; Davies, S.S.; Jerome, W.G.; Linton, E.F.; Song, W.L.; Doran, A.C.; Vickers, K.C. The Role of Lipids and Lipoproteins in Atherosclerosis. In Endotext; Feingold, K.R., Anawalt, B., Boyce, A., Chrousos, G., Dungan, K., Grossman, A., Hershman, J.M., Kaltsas, G., Koch, C., Kopp, P., et al., Eds.; MDText.com, Inc.: South Dartmouth, MA, USA, 2000. [Google Scholar]
- Upadhyay, A.; Earley, A.; Lamont, J.L.; Haynes, S.; Wanner, C.; Balk, E.M. Lipid-Lowering Therapy in Persons with Chronic Kidney Disease: A Systematic Review and Meta-Analysis. Ann. Intern. Med. 2012, 157, 251–262. [Google Scholar] [CrossRef] [PubMed]
- Kennard, A.; Singer, R. Lipid lowering in renal disease. Aust. Prescr. 2017, 40, 141–146. [Google Scholar] [CrossRef] [PubMed]
- Palmer, S.C.; Navaneethan, S.D.; Craig, J.C.; Johnson, D.W.; Perkovic, V.; Nigwekar, S.U.; Hegbrant, J.; Strippoli, G.F. HMG CoA reductase inhibitors (statins) for dialysis patients. Cochrane Database Syst. Rev. 2013, 9, CD004289. [Google Scholar] [CrossRef] [PubMed]
- Aung, T.; Halsey, J.; Kromhout, D.; Gerstein, H.C.; Marchioli, R.; Tavazzi, L.; Geleijnse, J.M.; Rauch, B.; Ness, A.; Galan, P.; et al. Associations of Omega-3 Fatty Acid Supplement Use with Cardiovascular Disease Risks: Meta-Analysis of 10 Trials Involving 77917 Individuals. JAMA Cardiol. 2018, 3, 225–234. [Google Scholar] [CrossRef] [PubMed]
- An, W.S.; Lee, S.M.; Son, Y.K.; Kim, S.E.; Kim, K.H.; Han, J.Y.; Bae, H.R.; Rha, S.H.; Park, Y. Omega-3 fatty acid supplementation increases 1,25-dihydroxyvitamin D and fetuin-A levels in dialysis patients. Nutr. Res. 2012, 32, 495–502. [Google Scholar] [CrossRef] [PubMed]
- Asemi, Z.; Soleimani, A.; Bahmani, F.; Shakeri, H.; Mazroii, N.; Abedi, F.; Fallah, M.; Mohammadi, A.A.; Esmaillzadeh, A. Effect of the omega-3 fatty acid plus vitamin E supplementation on subjective global assessment score, glucose metabolism, and lipid concentrations in chronic hemodialysis patients. Mol. Nutr. Food Res. 2015, 60, 390–398. [Google Scholar] [CrossRef] [PubMed]
- Ateya, A.M.; Sabri, N.A.; El Hakim, I.; Shaheen, S.M. Effect of Omega-3 Fatty Acids on Serum Lipid Profile and Oxidative Stress in Pediatric Patients on Regular Hemodialysis: A Randomized Placebo-Controlled Study. J. Ren. Nutr. 2017, 27, 169–174. [Google Scholar] [CrossRef] [PubMed]
- Bowden, R.G.; Jitomir, J.; Wilson, R.L.; Gentile, M. Effects of Omega-3 Fatty Acid Supplementation on Lipid Levels in Endstage Renal Disease Patients. J. Ren. Nutr. 2009, 19, 259–266. [Google Scholar] [CrossRef]
- Khosla, P.; Daud, M.; Tubie, B.; Adams, J.; Quainton, T.; Osia, R.; Kaur, D.; Sheyman, M. Effects of protein and omega-3 supplementation, provided during regular dialysis sessions, on nutritional and inflammatory indices in hemodialysis patients. Vasc. Health Risk Manag. 2012, 8, 187–195. [Google Scholar] [CrossRef] [PubMed]
- de Mattos, A.M.; da Costa, J.A.C.; Jordao, A.A.; Chiarello, P.G. Omega-3 Fatty Acid Supplementation Is Associated with Oxidative Stress and Dyslipidemia, but Does Not Contribute to Better Lipid and Oxidative Status on Hemodialysis Patients. J. Ren. Nutr. 2017, 27, 333–339. [Google Scholar] [CrossRef] [PubMed]
- Donnelly, S.M.; Ali, M.A.M.; Churchill, D.N. Effect of N-3 Fatty-Acids from Fish Oil on Hemostasis, Blood-Pressure, and Lipid Profile of Dialysis Patients. J. Am. Soc. Nephrol. 1992, 2, 1634–1639. [Google Scholar] [CrossRef] [PubMed]
- Ewers, B.; Riserus, U.; Marckmann, P. Effects of Unsaturated Fat Dietary Supplements on Blood Lipids, and on Markers of Malnutrition and Inflammation in Hemodialysis Patients. J. Ren. Nutr. 2009, 19, 401–411. [Google Scholar] [CrossRef] [PubMed]
- Gharekhani, A.; Dashti-Khavidaki, S.; Lessan-Pezeshki, M.; Khatami, M.-R. Potential Effects of Omega-3 Fatty Acids on Insulin Resistance and Lipid Profile in Maintenance Hemodialysis Patients: A Randomized Placebo-Controlled Trial. Iran. J. Kidney Dis. 2016, 10, 310–318. [Google Scholar]
- Jabbari, M.; Khoshnevis, T.; Jenabi, A.; Yousefi, F. The Effect of Omega-3 Supplement on Serum Lipid Profile in Patients Undergoing Hemodialysis: A Randomized Clinical Trial. Romanian J. Intern. Med. 2016, 54, 222–227. [Google Scholar] [CrossRef] [PubMed][Green Version]
- Mortazavi, M.; Kajbaf, M.H.; Khorvash, F.; Shahidi, S.; Moeinzadeh, F.; Farajzadegan, Z.; Tirani, S.A. Does Omega-3 supplementation decrease carotid intima-media thickening in hemodialysis patients? J. Res. Pharm. Pr. 2016, 5, 252–256. [Google Scholar] [CrossRef] [PubMed]
- Khajehdehi, P. Lipid-lowering effect of polyunsaturated fatty acids in hemodialysis patients. J. Ren. Nutr. 2000, 10, 191–195. [Google Scholar] [CrossRef] [PubMed]
- Soltani, S.K.; Jamaluddin, R.; Tabibi, H.; Yusof, B.N.M.; Atabak, S.; Loh, S.; Rahmani, L. Effects of flaxseed consumption on systemic inflammation and serum lipid profile in hemodialysis patients with lipid abnormalities. Hemodial. Int. 2012, 17, 275–281. [Google Scholar] [CrossRef] [PubMed]
- Tayebi-Khosroshahi, H.; Dehgan, R.; Asl, B.H.; Safaian, A.; Panahi, F.; Estakhri, R.; Purasgar, B. Effect of omega-3 supplementation on serum level of homocysteine in hemodialysis patients. Iran. J. Kidney Dis. 2013, 7, 479–484. [Google Scholar] [PubMed]
- Kooshki, A.; Taleban, F.A.; Tabibi, H.; Hedayati, M. Effects of Omega-3 Fatty Acids on Serum Lipids, Lipoprotein (a), and Hematologic Factors in Hemodialysis Patients. Ren. Fail. 2011, 33, 892–898. [Google Scholar] [CrossRef] [PubMed]
- Lee, S.M.; Son, Y.K.; Kim, S.E.; An, W.S. The Effects of Omega-3 Fatty Acid on Vitamin D Activation in Hemodialysis Patients: A Pilot Study. Mar. Drugs 2015, 13, 741–755. [Google Scholar] [CrossRef] [PubMed]
- Lemos, J.R.; de Alencastro, M.G.; Konrath, A.V.; Cargnin, M.; Manfro, R.C. Flaxseed oil supplementation decreases C-reactive protein levels in chronic hemodialysis patients. Nutr. Res. 2012, 32, 921–927. [Google Scholar] [CrossRef] [PubMed]
- Mirfatahi, M.; Imani, H.; Tabibi, H.; Nasrollahi, A.; Hedayati, M. Effects of Flaxseed Oil on Serum Bone Turnover Markers in Hemodialysis Patients: A Randomized Controlled Trial. Iran. J. Kidney Dis. 2018, 12, 215–222. [Google Scholar]
- Mirfatahi, M.; Tabibi, H.; Nasrollahi, A.; Hedayati, M.; Taghizadeh, M. Effect of flaxseed oil on serum systemic and vascular inflammation markers and oxidative stress in hemodialysis patients: A randomized controlled trial. Int. Urol. Nephrol. 2016, 48, 1335–1341. [Google Scholar] [CrossRef] [PubMed]
- Moeinzadeh, F.; Shahidi, S.; Mortazavi, M.; Dolatkhah, S.; Kajbaf, M.; Javanmard, S.H.; Moghtaderi, A. Effects of Omega-3 Fatty Acid Supplementation on Serum Biomarkers, Inflammatory Agents, and Quality of Life of Patients on Hemodialysis. Iran. J. Kidney Dis. 2016, 10, 381–387. [Google Scholar]
- Taheri, S.; Keyvandarian, N.; Mortazavi, M.; Hosseini, S.M.; Naini, A.E. Effect of Omega-3 fatty acids on blood pressure and serum lipids in continuous ambulatory peritoneal dialysis patients. J. Res. Pharm. Pr. 2015, 4, 135–141. [Google Scholar] [CrossRef]
- Omrani, H.R.; Pasdar, Y.; Raisi, D.; Najafi, F.; Esfandiari, A. The effect of omega-3 on serum lipid profile in hemodialysis patients. J. Ren. Inj. Prev. 2015, 4, 68–72. [Google Scholar] [CrossRef]
- Rantanen, J.M.; Riahi, S.; Johansen, M.B.; Schmidt, E.B.; Christensen, J.H. Effects of Marine n-3 Polyunsaturated Fatty Acids on Heart Rate Variability and Heart Rate in Patients on Chronic Dialysis: A Randomized Controlled Trial. Nutrients 2018, 10, 1313. [Google Scholar] [CrossRef] [PubMed]
- Saifullah, A.; Watkins, B.; Saha, C.; Li, Y.; Moe, S.M.; Friedman, A.N. Oral fish oil supplementation raises blood omega-3 levels and lowers C-reactive protein in haemodialysis patients a pilot study. Nephrol. Dial. Transplant. 2007, 22, 3561–3567. [Google Scholar] [CrossRef] [PubMed]
- Sørensen, G.V.; Svensson, M.; Strandhave, C.; Schmidt, E.B.; Jørgensen, K.A.; Christensen, J.H. The Effect of n-3 Fatty Acids on Small Dense Low-Density Lipoproteins in Patients With End-Stage Renal Disease: A Randomized Placebo-Controlled Intervention Study. J. Ren. Nutr. 2015, 25, 376–380. [Google Scholar] [CrossRef] [PubMed]
- Svensson, M.; Frøbert, O.; Schmidt, E.B.; A Jørgensen, K.; Simonsen, U.; Christensen, J.H. The effect of n-3 fatty acids on levels of methylarginines in patients with end-stage renal disease. J. Nephrol. 2010, 23, 459–464. [Google Scholar] [PubMed]
- Svensson, M.; Schmidt, E.B.; Jørgensen, K.A.; Christensen, J.H. N-3 Fatty Acids as Secondary Prevention against Cardiovascular Events in Patients Who Undergo Chronic Hemodialysis: A Randomized, Placebo-Controlled Intervention Trial. Clin. J. Am. Soc. Nephrol. 2006, 1, 780–786. [Google Scholar] [CrossRef] [PubMed]
- Svensson, M.; Schmidt, E.B.; Jørgensen, K.A.; Christensen, J.H. The Effect of n-3 Fatty Acids on Heart Rate Variability in Patients Treated With Chronic Hemodialysis. J. Ren. Nutr. 2007, 17, 243–249. [Google Scholar] [CrossRef]
- Svensson, M.; Schmidt, E.B.; Jorgensen, K.A.; Christensen, J.H. The effect of n-3 fatty acids on lipids and lipoproteins in patients treated with chronic haemodialysis: A randomized placebo-controlled intervention study. Nephrol. Dial. Transplant. 2008, 23, 2918–2924. [Google Scholar] [CrossRef] [PubMed]
- Taziki, O.; Lessan-Pezeshki, M.; Akha, O.; Vasheghani, F. The effect of low dose omega-3 on plasma lipids in hemodialysis patients. Saudi J. Kidney Dis. Transplant. 2007, 18, 571–576. [Google Scholar]
- Chi, H.; Lin, X.; Huang, H.; Zheng, X.; Li, T.; Zou, Y. Omega-3 Fatty Acid Supplementation on Lipid Profiles in Dialysis Patients: Meta-analysis. Arch. Med. Res. 2014, 45, 469–477. [Google Scholar] [CrossRef]
- Xu, T.; Sun, Y.; Sun, W.; Yao, L.; Sun, L.; Liu, L.; Ma, J.; Wang, L. Effect of omega-3 fatty acid supplementation on serum lipids and vascular inflammation in patients with end-stage renal disease: A meta-analysis. Sci. Rep. 2016, 6, 39346. [Google Scholar] [CrossRef]
- Wu, P.-K.; Yeh, S.-C.; Li, S.-J.; Kang, Y.-N. Efficacy of Polyunsaturated Fatty Acids on Inflammatory Markers in Patients Undergoing Dialysis: A Systematic Review with Network Meta-Analysis of Randomized Clinical Trials. Int. J. Mol. Sci. 2019, 20, 3645. [Google Scholar] [CrossRef]
- Beavers, K.M.; Beavers, D.P.; Bowden, R.G.; Wilson, R.L.; Gentile, M. Effect of Over-the-Counter Fish-Oil Administration on Plasma Lp(a) Levels in an End-Stage Renal Disease Population. J. Ren. Nutr. 2009, 19, 443–449. [Google Scholar] [CrossRef]
- Begum, R.; A Belury, M.; Burgess, J.R.; Peck, L.W. Supplementation with n-3 and n-6 polyunsaturated fatty acids: Effects on lipoxygenase activity and clinical symptoms of pruritus in hemodialysis patients. J. Ren. Nutr. 2004, 14, 233–241. [Google Scholar] [CrossRef]
- Poulia, K.-A.; Panagiotakos, D.B.; Tourlede, E.; Rezou, A.; Stamatiadis, D.; Boletis, J.; Zampelas, A. Omega-3 Fatty Acids Supplementation Does Not Affect Serum Lipids in Chronic Hemodialysis Patients. J. Ren. Nutr. 2011, 21, 479–484. [Google Scholar] [CrossRef] [PubMed]
- Kunutsor, S.K.; Zaccardi, F.; Karppi, J.; Kurl, S.; Laukkanen, J.A. Is High Serum LDL/HDL Cholesterol Ratio an Emerging Risk Factor for Sudden Cardiac Death? Findings from the KIHD Study. J. Atheroscler. Thromb. 2017, 24, 600–608. [Google Scholar] [CrossRef] [PubMed]
- Yokokawa, H.; Yasumura, S.; Tanno, K.; Ohsawa, M.; Onoda, T.; Itai, K.; Sakata, K.; Kawamura, K.; Tanaka, F.; Yoshida, Y.; et al. Serum Low-Density Lipoprotein to High-Density Lipoprotein Ratio as a Predictor of Future Acute Myocardial Infarction Among Men in a 2.7-Year Cohort Study of a Japanese Northern Rural Population. J. Atheroscler. Thromb. 2011, 18, 89–98. [Google Scholar] [CrossRef] [PubMed]
- Hutton, B.; Salanti, G.; Caldwell, D.M.; Chaimani, A.; Schmid, C.H.; Cameron, C.; Ioannidis, J.P.A.; Straus, S.; Thorlund, K.; Jansen, J.P.; et al. The PRISMA Extension Statement for Reporting of Systematic Reviews Incorporating Network Meta-analyses of Health Care Interventions: Checklist and Explanations. Ann. Intern. Med. 2015, 162, 777–784. [Google Scholar] [CrossRef] [PubMed]
- Hozo, S.P.; Djulbegovic, B.; Hozo, I. Estimating the mean and variance from the median, range, and the size of a sample. BMC Med. Res. Methodol. 2005, 5, 13. [Google Scholar] [CrossRef]
- Ruperto, M.; Rodríguez-Mendiola, N.; Díaz-Domínguez, M.; Giménez-Moyano, S.; García-Bermejo, M.L.; Fernández-Lucas, M. Effect of Oral Administration of Docohexanoic Acid on Anemia and Inflammation in Hemodialysis Patients: A Randomized Controlled Clinical Trial. Clin. Nutr. ESPEN 2021, 41, 129–135. [Google Scholar] [CrossRef]
- Baigent, C.; Burbury, K.; Wheeler, D. Premature cardiovascular disease in chronic renal failure. Lancet 2000, 356, 147–152. [Google Scholar] [CrossRef]
- Beatriz, B.; Pastor, M.C.; Bonal, J.; Foraster, A.; Romero, R. Oxidative Stress, Inflammation and Cardiovascular Mortality in Haemodialysis—Role of Seniority and Intravenous Ferrotherapy: Analysis at 4 Years of Follow-Up. Nephrol. Dial. Transplant. 2005, 21, 984–990. [Google Scholar]
- Mikolasevic, I.; Žutelija, M.; Mavrinac, V.; Orlic, L. Dyslipidemia in patients with chronic kidney disease: Etiology and management. Int. J. Nephrol. Renov. Dis. 2017, 10, 35–45. [Google Scholar] [CrossRef]
- Kumar, S.; Bogle, R.; Banerjee, D. Why do young people with chronic kidney disease die early? World J. Nephrol. 2014, 3, 143–155. [Google Scholar] [CrossRef] [PubMed]
- Maki, K.C.; Eren, F.; E Cassens, M.; Dicklin, M.R.; Davidson, M.H. ω-6 Polyunsaturated Fatty Acids and Cardiometabolic Health: Current Evidence, Controversies, and Research Gaps. Adv. Nutr. Int. Rev. J. 2018, 9, 688–700. [Google Scholar] [CrossRef] [PubMed]
- Hooper, L.; Al-Khudairy, L.; Abdelhamid, A.; Rees, K.; Brainard, J.S.; Brown, T.J.; Ajabnoor, S.; O’Brien, A.T.; E Winstanley, L.; Donaldson, D.H.; et al. Omega-6 fats for the primary and secondary prevention of cardiovascular disease. Cochrane Database Syst. Rev. 2018, 7, CD011094. [Google Scholar] [CrossRef] [PubMed]
- Makni, M.; Fetoui, H.; Gargouri, N.; Garoui, E.M.; Jaber, H.; Makni, J.; Boudawara, T.; Zeghal, N. Hypolipidemic and hepatoprotective effects of flax and pumpkin seed mixture rich in ω-3 and ω-6 fatty acids in hypercholesterolemic rats. Food Chem. Toxicol. 2008, 46, 3714–3720. [Google Scholar] [CrossRef] [PubMed]
- Mensink, R.P.; World Health Organization. Effects of Saturated Fatty Acids on Serum Lipids and Lipoproteins: A Systematic Review and Regression Analysis. 2016. Available online: https://apps.who.int/iris/handle/10665/246104 (accessed on 29 January 2022).
- Panth, N.; A Abbott, K.; Dias, C.B.; Wynne, K.; Garg, M.L. Differential effects of medium- and long-chain saturated fatty acids on blood lipid profile: A systematic review and meta-analysis. Am. J. Clin. Nutr. 2018, 108, 675–687. [Google Scholar] [CrossRef]
- Arunima, S.; Rajamohan, T. Virgin coconut oil improves hepatic lipid metabolism in rats—Compared with copra oil, olive oil and sunflower oil. Indian J. Exp. Biol. 2012, 50, 802–809. [Google Scholar]
- Lee, E.-J.; Oh, H.; Kang, B.G.; Kang, M.-K.; Kim, D.Y.; Kim, Y.-H.; Lee, J.Y.; Ji, J.G.; Lim, S.S.; Kang, Y.-H. Lipid-Lowering Effects of Medium-Chain Triglyceride-Enriched Coconut Oil in Combination with Licorice Extracts in Experimental Hyperlipidemic Mice. J. Agric. Food Chem. 2018, 66, 10447–10457. [Google Scholar] [CrossRef] [PubMed]
- Mune, M.; Yukawa, S.; Kishino, M.; Otani, H.; Kimura, K.; Nishikawa, O.; Takahashi, T.; Kodama, N.; Saika, Y.; Yamada, Y. Effect of Vitamin E on Lipid Metabolism and Atherosclerosis in Esrd Patients. Kidney Int. 1999, 56, S126–S129. [Google Scholar] [CrossRef]
- de Mattos, A.M.; Marino, L.V.; Ovidio, P.P.; Jordão, A.A.; Almeida, C.C.; Chiarello, P.G. Protein Oxidative Stress and Dyslipidemia in Dialysis Patients. Ther. Apher. Dial. 2012, 16, 68–74. [Google Scholar] [CrossRef]
- Wratten, M.L.; Galaris, D.; Tetta, C.; Sevanian, A. Evolution of Oxidative Stress and Inflammation During Hemodialysis and Their Contribution to Cardiovascular Disease. Antioxid. Redox Signal. 2002, 4, 935–944. [Google Scholar] [CrossRef]
- Huang, J.; Yi, B.; Li, A.-M.; Zhang, H. Effects of vitamin E-coated dialysis membranes on anemia, nutrition and dyslipidemia status in hemodialysis patients: A meta-analysis. Ren. Fail. 2015, 37, 398–407. [Google Scholar] [CrossRef] [PubMed]
- Mafra, D.; Santos, F.R.; Lobo, J.C.; Grosso, D.D.M.; Barreira, A.L.; Velarde, L.G.C.; Abdalla, D.S.P.; Leite, M. Alpha-tocopherol supplementation decreases electronegative low-density lipoprotein concentration [LDL(-)] in haemodialysis patients. Nephrol. Dial. Transplant. 2009, 24, 1587–1592. [Google Scholar] [CrossRef] [PubMed]
- Saglimbene, V.M.; Wong, G.; van Zwieten, A.; Palmer, S.C.; Ruospo, M.; Natale, P.; Campbell, K.; Teixeira-Pinto, A.; Craig, J.C.; Strippoli, G.F. Effects of omega-3 polyunsaturated fatty acid intake in patients with chronic kidney disease: Systematic review and meta-analysis of randomized controlled trials. Clin. Nutr. 2020, 39, 358–368. [Google Scholar] [CrossRef] [PubMed]


| Lead Author | Location | Inclusion Year | Treatments | No. of Patients | Mean Age (Years) | Sex (M/F) | Dialysis Period (Years) | Relevant Outcome |
|---|---|---|---|---|---|---|---|---|
| An | Korea | 2010 | 1. n-3 | 23 a | 56.7 | 12/11 | 3.42 | HDL d and |
| [8] | 2. Placebo | 20 a | 58.1 | 8/12 | 4.31 | LDL d | ||
| Asemi | Iran | 2014 | 1. n-3 | 30 b | 55.2 | 20/10 | 3.6 | HDL and |
| [9] | 2. Vit E (αT) | 30 b | 61.2 | 20/10 | 3.5 | LDL | ||
| 3. n-3 + Vit E (αT) | 30 b | 54.9 | 20/10 | 3.4 | ||||
| 4. Placebo | 30 b | 59.9 | 20/10 | 3.4 | ||||
| Ateya | Egypt | 2015 | 1. n-3 | 25 b | 14.7 | 14/11 | NR | HDL d and |
| [10] | 2. Vit E | 24 b | 14.6 | 13/11 | NR | LDL d | ||
| Bowden | USA | NR | 1. n-3 | 44 b | 59.3 | 25/19 | 1.83 | HDL d and |
| [11] | 2. n-3 + Vit E (Corn oil) | 43 b | 60.8 | 20/23 | 2.39 | LDL d | ||
| Daud | USA | NR | 1. n-3 | 31 b | 59 | 20/11 | 3.6 | LDL/HDL |
| [12] | 2. Vit E (Olive oil) | 32 b | 58 | 12/20 | 3.3 | |||
| de Mattos | Brazil | 2012 to | 1. n-3 | 43 b | 52.7 | 27/16 | 5.49 | HDL and |
| [13] | 2013 | 2. Placebo (Soybean oil) | 45 b | 51.3 | 30/15 | 3.63 | LDL | |
| Donnely | Canada | NR | 1. n-3 + Vit E | 16 a | 51 | 12/4 | NR | HDL |
| [14] | 2. Vit E (Olive oil) | 16 a | 51 | 12/4 | NR | |||
| Ewers | Den- | 2007 | 1. n-3 | 40 b | 64.6 | 30/10 | NR | HDL and |
| [15] | mark | 2. Placebo (NS) | 40 b | 64.6 | 30/10 | NR | LDL | |
| Gharekhani | Iran | NR | 1. n-3 | 25 b | 56.8 | 12/13 | 5 | HDL d and |
| [16] | 2. Placebo (Paraffin) | 20 b | 57.2 | 8/12 | 6 | LDL d | ||
| Jabbari | Iran | NR | 1. n-3 | 57 b | 64.58 | 42/15 | 24 | HDL e and |
| [17] | 2. Placebo | 60 b | 61.05 | 33/27 | 12 | LDL e | ||
| Kajbaf | Iran | NR | 1. n-3 | 26 b | 57.76 | 17/9 | NR | HDL d and |
| [18] | 2. Placebo | 26 b | 58.34 | 19/7 | NR | LDL d | ||
| Khajehdeh | Iran | NR | 1. n-3 | 15 b | 32.7 | 8/7 | 2.19 | HDL, |
| [19] | 2. n-3 + Vit E (Corn oil) | 15 b | 33.6 | 8/7 | 2.46 | LDL, and | ||
| 3. n-3 + n-6 (Sesame oil) | 15 b | 32.3 | 8/7 | 2.83 | LDL/HDL | |||
| 4. Placebo | 15 b | 31.1 | 7/8 | 2.21 | ||||
| Khalatbari | Malaysia | NR | 1. n-3 + n-6 (flaxseed) | 15 b | 54 | 10/5 | 2.58 | HDL and |
| [20] | 2. Placebo | 15 b | 54.5 | 6/9 | 2.83 | LDL | ||
| Khorsro- | Iran | NR | 1. n-3 | 44 b | 51.5 | 32/12 | NR | HDL and |
| shahi [21] | 2. Placebo (Soft pill) | 44 b | 48.6 | 31/13 | NR | LDL | ||
| Kooshki | Iran | NR | 1. n-3 | 17 b | 50 | 10/7 | 1.75 | HDL and |
| [22] | 2. Placebo | 17 b | 50 | 11/6 | 2.3 | LDL | ||
| Lee | Korea | 2012 | 1. n-3 | 8 b | 60 | 2/6 | NR | HDL and |
| [23] | 2. Vit E (Olive oil) | 7 b | 64.4 | 3/4 | NR | LDL | ||
| Lemos | Brazil | NR | 1. n-3 + n-6 + Vit E (flaxseed oil and αT) | 70 b | 55.7 | 39/31 | 2.4 | HDL d and |
| [24] | 2. Placebo + Vit E (Mineral oil and αT) | 75 b | 58.3 | 46/29 | 2.9 | LDL d | ||
| Mirfatahi | Iran | 2014 to | 1. n-3 + n-6 (flaxseed oil) | 17 b | 68 | 12/5 | 4.4 | HDL and |
| [25] | 2015 | 2. MCTs | 17 b | 59 | 10/7 | 4.6 | LDL | |
| Moeinzadeh | Iran | NR | 1. n-3 | 26 b | 57.76 | 17/9 | NR | HDL d and |
| [27] | 2. Placebo | 26 b | 58.34 | 19/7 | NR | LDL d | ||
| Naini | Iran | 2012 | 1. n-3 | 45 c | 57.7 | 24/21 | NR | LDL |
| [28] | 2. Placebo | 45 c | 59.3 | 27/18 | NR | |||
| Omrani | Iran | 2013 to | 1. n-3 | 29 b | 55 | 16/13 | NR | HDL f and |
| [29] | 2014 | 2. Vit E | 29 b | 56 | 19/10 | NR | LDL f | |
| Rantanen | Den- | 2014 to | 1. n-3 | 56 a | 64.2 | 37/19 | 1 | HDL and |
| [30] | mark | 2016 | 2. Vit E (Olive oil) | 56 a | 60.5 | 37/19 | 2.2 | LDL |
| Ruperto | Spain | 2018 | 1. n-3 | 21 b | 66 | 16/5 | Overall: | HDL and |
| 2. Placebo | 21 b | 68 | 13/8 | 7.5 | LDL | |||
| Saifullah | USA | 2006 | 1. n-3 + n-6 + Vit E | 15 b | 58 | 11/4 | NR | HDL g and |
| [31] | 2. n-3 + n-6 + Vit E | 8 b | 57 | 7/1 | NR | LDL g | ||
| Sorensen | Den- | NR | 1. n-3 | 81 b | 66 | 53/28 | 3 | HDL and |
| [32] | mark | 2. Vit E (Olive oil) | 80 b | 68 | 51/29 | 2.17 | LDL | |
| Svensson | Den- | NR | 1. n-3 | 28 b | 60 | 16/12 | NR | HDL and |
| [35] | mark | 2. Vit E (Olive oil) | 30 b | 58 | 23/7 | NR | LDL | |
| Svensson | Den- | 2002 to | 1. n-3 | 103 b | 66 | 69/34 | 3.7 | HDL and |
| [36] | mark | 2003 | 2. Vit E (Olive oil) | 103 b | 68 | 54/39 | 3.7 | LDL |
| Taziki | Iran | NR | 1. n-3 | 15 b | 47 | 5/10 | 3 | HDL and |
| [37] | 2. Placebo (NS) | 18 b | 59.5 | 6/12 | 3.5 | LDL |
| Low-Density Lipoprotein | |||||||
| MCT | |||||||
| −0.04 (−1.01; 0.92) | n-3 | ||||||
| 1.47 (0.48; 2.45) | 1.51 (0.61; 2.42) | n-3 + n-6 | |||||
| 0.09 (−1.34; 1.52) | 0.13 (−0.95; 1.21) | −1.38 (−2.74; −0.01) | n-3 + n-6 + VitE | ||||
| 0.16 (−1.17; 1.49) | 0.20 (−0.74; 1.14) | −1.31 (−2.58; −0.04) | 0.07 (−1.34; 1.48) | n-3 + VitE | |||
| 0.07 (−1.36; 1.50) | 0.12 (−0.96; 1.20) | −1.39 (−2.76; −0.03) | −0.02 (−1.24; 1.21) | −0.08 (−1.49; 1.32) | n-6 + VitE | ||
| 0.04 (−0.95; 1.03) | 0.08 (−0.33; 0.50) | −1.43 (−2.28; −0.57) | −0.05 (−1.13; 1.03) | −0.12 (−1.08; 0.84) | −0.03 (−1.11; 1.05) | Placebo | |
| −0.12 (−1.18; 0.94) | −0.08 (−0.53; 0.38) | −1.59 (−2.59; −0.59) | −0.21 (−1.37; 0.96) | −0.28 (−1.24; 0.69) | −0.19 (−1.36; 0.97) | −0.16 (−0.74; 0.42) | Vitamin E |
| High-Density Lipoprotein | |||||||
| MCT | |||||||
| 0.98 (−0.13; 2.09) | n-3 | ||||||
| 0.67 (−0.46; 1.80) | −0.31 (−1.34; 0.72) | n-3 + n-6 | |||||
| 1.85 (0.22; 3.48) | 0.87 (−0.36; 2.11) | 1.18 (−0.36; 2.72) | n-3 + n-6 + VitE | ||||
| 1.10 (−0.43; 2.63) | 0.12 (−0.96; 1.21) | 0.43 (−1.01; 1.88) | −0.75 (−2.37; 0.87) | n-3 + VitE | |||
| 1.54 (−0.08; 3.17) | 0.57 (−0.67; 1.80) | 0.87 (−0.66; 2.41) | −0.31 (−1.70; 1.09) | 0.44 (−1.17; 2.06) | n-6 + VitE | ||
| 1.76 (0.62; 2.90) | 0.78 (0.27; 1.30) | 1.09 (0.14; 2.04) | −0.09 (−1.33; 1.14) | 0.66 (−0.46; 1.78) | 0.22 (−1.02; 1.45) | Placebo | |
| 1.03 (−0.17; 2.24) | 0.05 (−0.44; 0.54) | 0.36 (−0.76; 1.48) | −0.82 (−2.14; 0.50) | −0.07 (−1.19; 1.05) | −0.51 (−1.83; 0.81) | −0.73 (−1.40; −0.05) | Vitamin E |
| Within-Study | Confidence | ||||||
|---|---|---|---|---|---|---|---|
| Outcome and Comparison | Bias | Reporting Bias | Indirectness | Imprecision | Heterogeneity | Incoherence | Rating |
| LDL | |||||||
| n-3 + n-6 vs. Placebo | Major concerns | Low risk | No concerns | No concerns | Some concerns | No concerns | Very low |
| n-3 + n-6 vs. MCT | Some concerns | Low risk | No concerns | No concerns | Some concerns | No concerns | Low |
| n-3 + n-6 vs. VitE | Some concerns | Low risk | No concerns | No concerns | Some concerns | No concerns | Low |
| n-3 + n-6 vs. n-3 | Some concerns | Low risk | No concerns | No concerns | Some concerns | No concerns | Low |
| n-3 + n-6 vs. n-3 + VitE | Some concerns | Low risk | No concerns | Some concerns | No concerns | No concerns | Low |
| n-3 + n-6 vs. n-6 + VitE | Major concerns | Low risk | No concerns | Some concerns | No concerns | No concerns | Very low |
| n-3 + n-6 vs. n-3 + n-6 + VitE | Major concerns | Low risk | No concerns | Some concerns | No concerns | No concerns | Very low |
| HDL | |||||||
| MCT vs. Placebo | Some concerns | Low risk | No concerns | No concerns | Some concerns | Major concerns | Very low |
| VitE vs. Placebo | Some concerns | Low risk | No concerns | No concerns | Some concerns | No concerns | Low |
| n-3 vs. Placebo | Some concerns | Low risk | No concerns | No concerns | Some concerns | No concerns | Low |
| n-3 + n-6 vs. Placebo | Major concerns | Low risk | No concerns | No concerns | Some concerns | Major concerns | Very low |
| LDL/HDL ratio | |||||||
| Vitamin E vs. Placebo | Major concerns | Low risk | No concerns | N/A a | N/A a | No concerns | Low |
| n-3 vs. Placebo | Major concerns | Low risk | No concerns | N/A a | N/A a | No concerns | Low |
| n-6 + VitE vs. Placebo | Major concerns | Low risk | No concerns | N/A a | N/A a | No concerns | Low |
Publisher’s Note: MDPI stays neutral with regard to jurisdictional claims in published maps and institutional affiliations. |
© 2022 by the authors. Licensee MDPI, Basel, Switzerland. This article is an open access article distributed under the terms and conditions of the Creative Commons Attribution (CC BY) license (https://creativecommons.org/licenses/by/4.0/).
Share and Cite
Chang, K.-Y.; Chen, Y.-C.; Yeh, S.-C.; Kao, C.-C.; Cheng, C.-Y.; Kang, Y.-N.; Huang, C.-W. A Consistency Model for Identifying the Effects of n-3 and n-6 Fatty Acids on Lipoproteins in Dialysis Patients. Nutrients 2022, 14, 1250. https://doi.org/10.3390/nu14061250
Chang K-Y, Chen Y-C, Yeh S-C, Kao C-C, Cheng C-Y, Kang Y-N, Huang C-W. A Consistency Model for Identifying the Effects of n-3 and n-6 Fatty Acids on Lipoproteins in Dialysis Patients. Nutrients. 2022; 14(6):1250. https://doi.org/10.3390/nu14061250
Chicago/Turabian StyleChang, Ke-Yu, Yi-Chun Chen, Shu-Ching Yeh, Chih-Chin Kao, Chung-Yi Cheng, Yi-No Kang, and Chih-Wei Huang. 2022. "A Consistency Model for Identifying the Effects of n-3 and n-6 Fatty Acids on Lipoproteins in Dialysis Patients" Nutrients 14, no. 6: 1250. https://doi.org/10.3390/nu14061250
APA StyleChang, K.-Y., Chen, Y.-C., Yeh, S.-C., Kao, C.-C., Cheng, C.-Y., Kang, Y.-N., & Huang, C.-W. (2022). A Consistency Model for Identifying the Effects of n-3 and n-6 Fatty Acids on Lipoproteins in Dialysis Patients. Nutrients, 14(6), 1250. https://doi.org/10.3390/nu14061250