
Low Adherence to the Mediterranean Diet Is Associated with Poor Socioeconomic Status and Younger Age: A Cross-Sectional Analysis of the EpiDoC Cohort

 , , ,
, , ,  and
and
Abstract
:1. Introduction
2. Materials and Methods
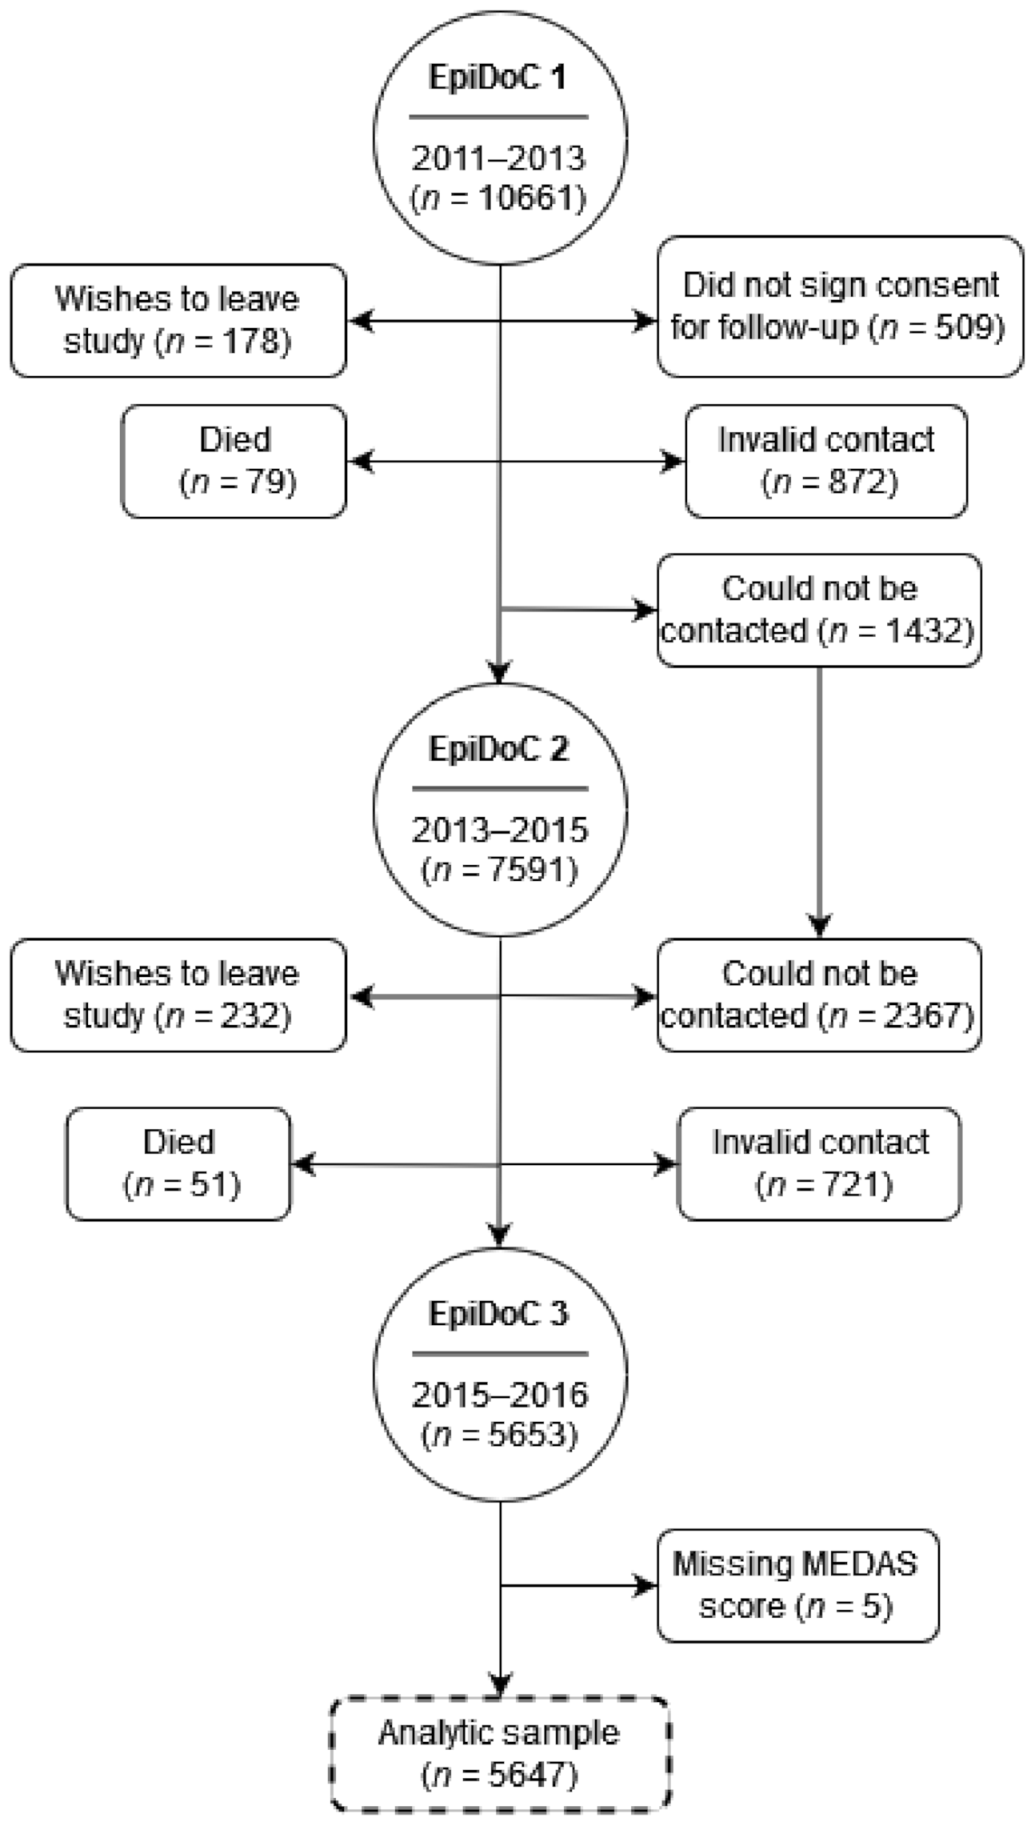
2.1. Study Design and Participants
2.2. Data Collection
2.3. Mediterranean Diet
2.4. Sociodemographic, Lifestyle and Health Variables
2.5. Statistical Analyses
3. Results
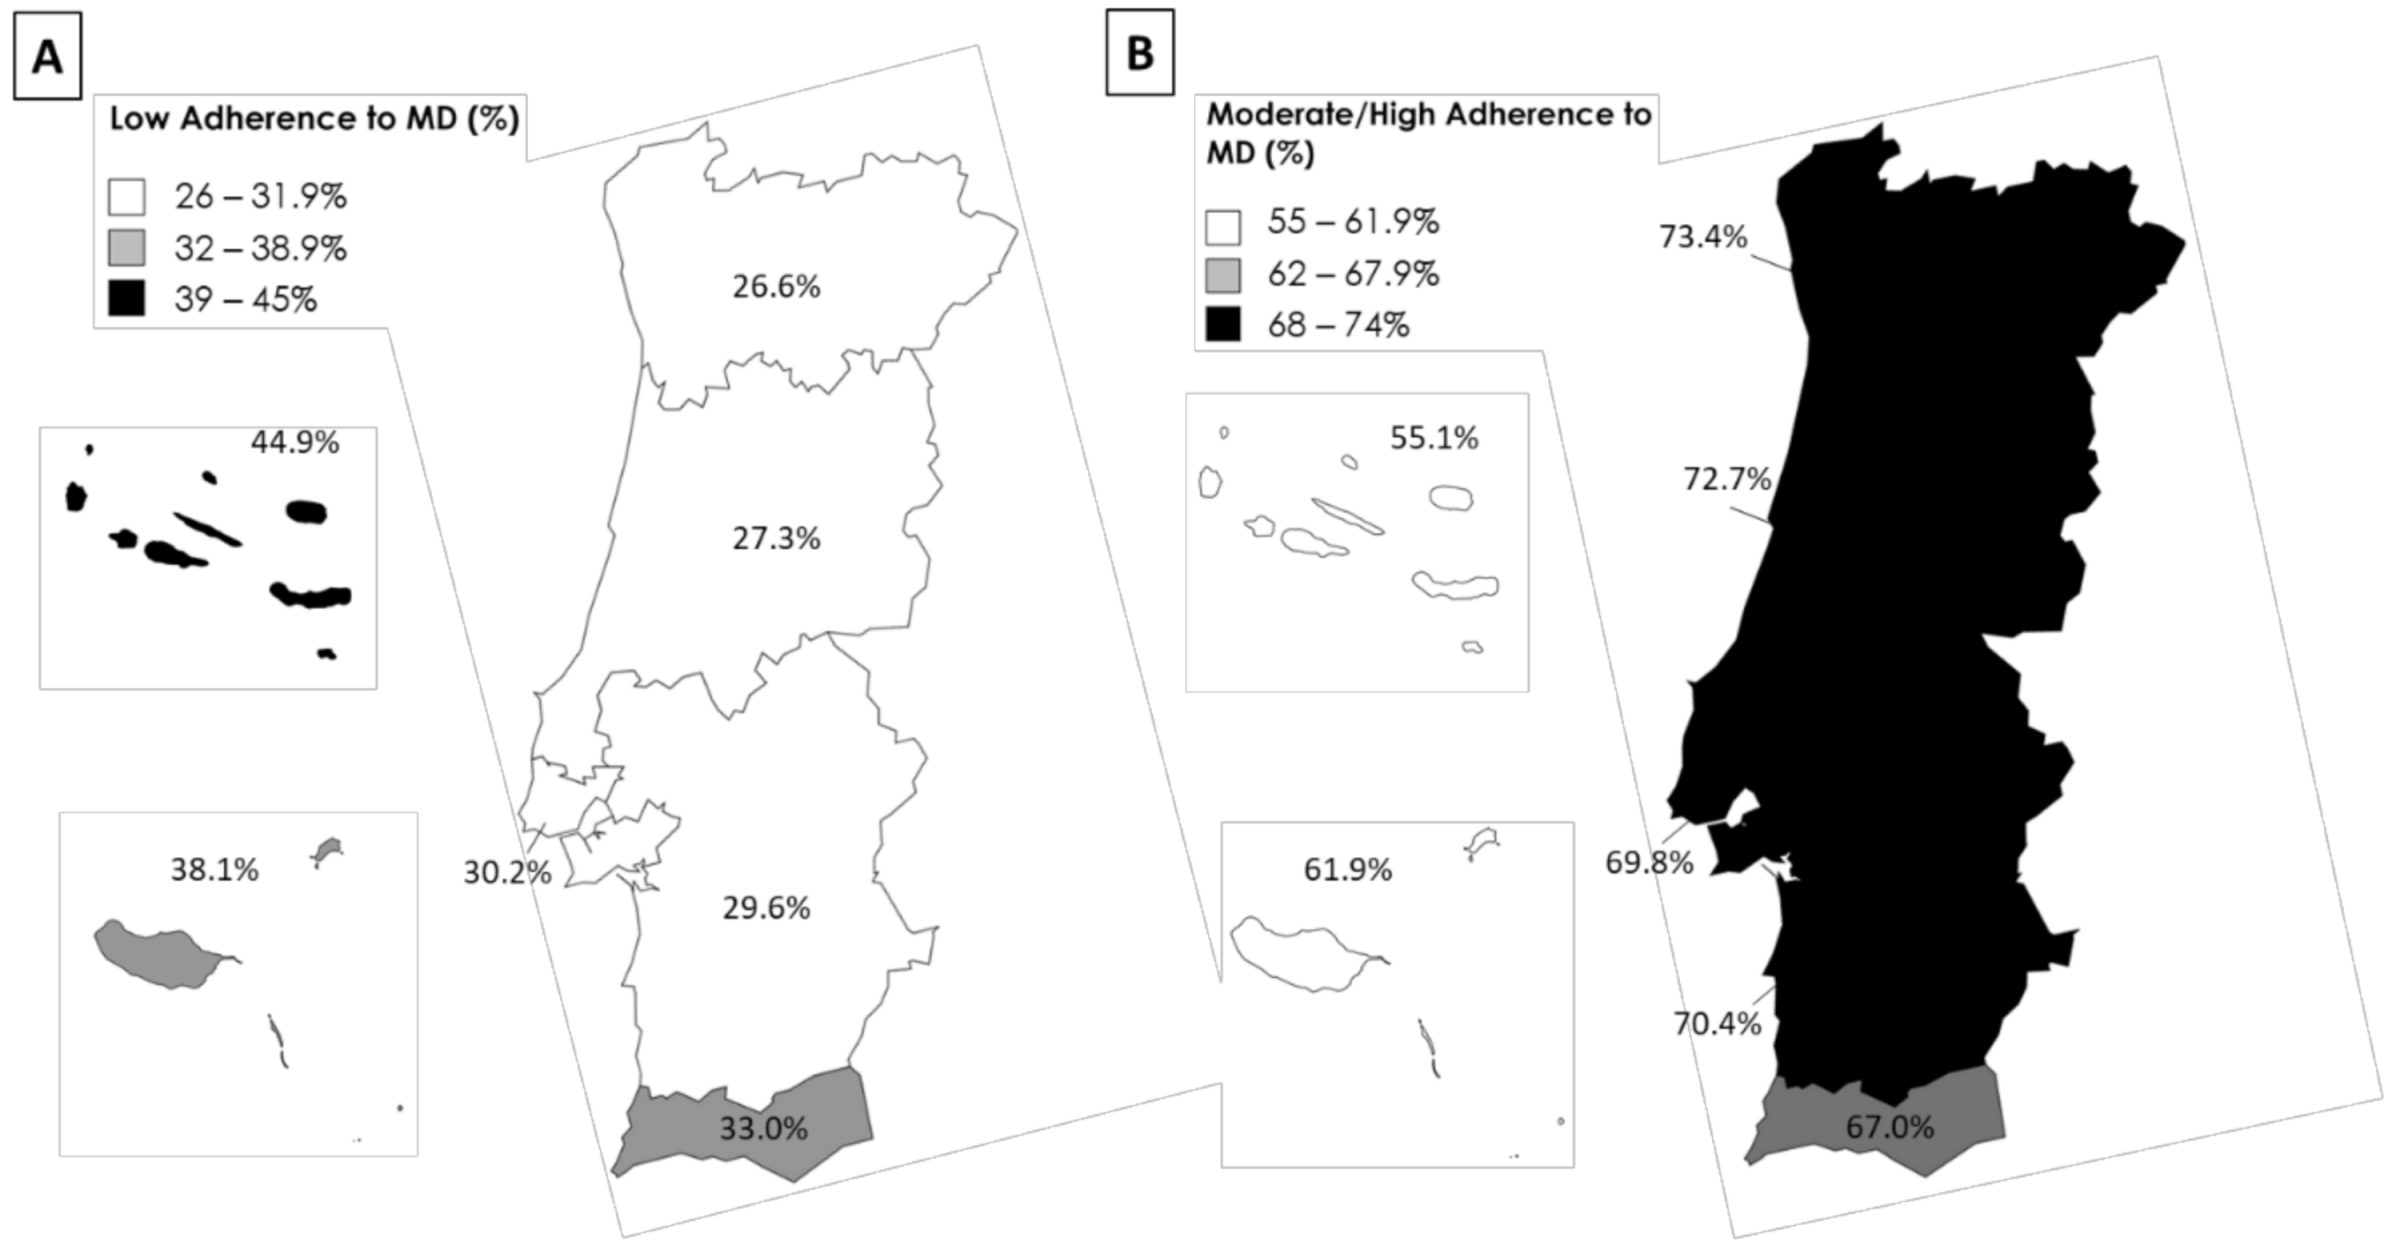
3.1. Adherence to the Mediterranean Diet in Portugal
3.2. Sociodemographic, Lifestyle and Health Characteristics Are Associated with a Low Adherence to the Mediterranean Diet in Portugal
3.3. Low Income Is Associated with a Low Adherence to the Mediterranean Diet
4. Discussion
5. Conclusions
Author Contributions
Funding
Institutional Review Board Statement
Informed Consent Statement
Data Availability Statement
Conflicts of Interest
References
- Direção-Geral da Saúde; Direção de Serviços de Informação e Análise. A Saúde dos Portugueses 2016; Direção-Geral da Saúde: Lisbon, Portugal, 2017.
- Lopes, C.; Torres, D.; Oliveira, A.; Severo, M.; Alarcão, V.; Guiomar, S.; Mota, J.; Teixeira, P.; Rodrigues, S.; Lobato, L.; et al. Inquérito Alimentar Nacional e de Atividade Física IAN-AF 2015–2016; Relatório de resultados; Universidade do Porto: Lisbon, Portugal, 2017. [Google Scholar]
- Gregorio, M.J.; Rodrigues, A.M.; Eusebio, M.; Sousa, R.D.; Dias, S.; Andre, B.; Gronning, K.; Coelho, P.S.; Mendes, J.M.; Graca, P.; et al. Dietary Patterns Characterized by High Meat Consumption Are Associated with Other Unhealthy Life Styles and Depression Symptoms. Front. Nutr. 2017, 4, 25. [Google Scholar] [CrossRef] [PubMed] [Green Version]
- Barreto, M.; Gaio, V.; Kislaya, I.; Antunes, L.; Rodrigues, A.P.; Silva, A.C.; Vargas, P.; Prokopenko, T.; Santos, A.J.; Namorado, S.; et al. 1° Inquérito Nacional de Saúde com Exame Físico (INSEF 2015): Estado de Saúde; Instituto Nacional de Saúde Doutor Ricardo Jorge: Lisbon, Portugal, 2016. [Google Scholar]
- Institute for Health Metrics and Evaluation (IHME). Global Burden of Disease Study 2019 (GBD 2019) Results. Available online: http://ghdx.healthdata.org/gbd-results-tool (accessed on 5 May 2021).
- Willett, W.C.; Sacks, F.; Trichopoulou, A.; Drescher, G.; Ferro-Luzzi, A.; Helsing, E.; Trichopoulos, D. Mediterranean diet pyramid: A cultural model for healthy eating. Am. J. Clin. Nutr. 1995, 61, 1402S–1406S. [Google Scholar] [CrossRef] [PubMed]
- Serra-Majem, L.; Ferro-Luzzi, A.; Bellizzi, M.; Salleras, L. Nutrition policies in Mediterranean Europe. Nutr. Rev. 1997, 55, S42–S57. [Google Scholar] [CrossRef] [PubMed]
- Rodrigues, S.S.; Caraher, M.; Trichopoulou, A.; de Almeida, M.D. Portuguese households’ diet quality (adherence to Mediterranean food pattern and compliance with WHO population dietary goals): Trends, regional disparities and socioeconomic determinants. Eur. J. Clin. Nutr. 2008, 62, 1263–1272. [Google Scholar] [CrossRef] [PubMed] [Green Version]
- Bach-Faig, A.; Berry, E.M.; Lairon, D.; Reguant, J.; Trichopoulou, A.; Dernini, S.; Medina, F.X.; Battino, M.; Belahsen, R.; Miranda, G.; et al. Mediterranean diet pyramid today. Science and cultural updates. Public Health Nutr. 2011, 14, 2274–2284. [Google Scholar] [CrossRef] [Green Version]
- Freitas, A.d.; Bernardes, J.P.; Mateus, M.P.; Braz, N. Dimensions of Mediterranean Diet: World Cultural Heritage; Universidade do Algarve: Faro, Portugal, 2015; ISBN 978-989-8472-74-8. [Google Scholar]
- Guasch-Ferré, M.; Salas-Salvadó, J.; Ros, E.; Estruch, R.; Corella, D.; Fitó, M.; Martínez-González, M.A.; for the PREDIMED Investigators. The PREDIMED trial, Mediterranean diet and health outcomes: How strong is the evidence? Nutr. Metab. Cardiovasc. Dis. 2017, 27, 624–632. [Google Scholar] [CrossRef] [Green Version]
- Grosso, G.; Mistretta, A.; Frigiola, A.; Gruttadauria, S.; Biondi, A.; Basile, F.; Vitaglione, P.; D’Orazio, N.; Galvano, F. Mediterranean diet and cardiovascular risk factors: A systematic review. Crit. Rev. Food Sci. Nutr. 2014, 54, 593–610. [Google Scholar] [CrossRef]
- Ginter, E.; Simko, V. Recent data on Mediterranean diet, cardiovascular disease, cancer, diabetes and life expectancy. Bratisl. Lek. Listy 2015, 116, 346–348. [Google Scholar] [CrossRef] [PubMed] [Green Version]
- Ros, E.; Martinez-Gonzalez, M.A.; Estruch, R.; Salas-Salvado, J.; Fito, M.; Martinez, J.A.; Corella, D. Mediterranean diet and cardiovascular health: Teachings of the PREDIMED study. Adv. Nutr. 2014, 5, 330S–336S. [Google Scholar] [CrossRef] [Green Version]
- Estruch, R.; Ros, E.; Salas-Salvadó, J.; Covas, M.I.; Corella, D.; Arós, F.; Gómez-Gracia, E.; Ruiz-Gutiérrez, V.; Fiol, M.; Lapetra, J.; et al. Primary Prevention of Cardiovascular Disease with a Mediterranean Diet Supplemented with Extra-Virgin Olive Oil or Nuts. N. Engl. J. Med. 2018, 378, e34. [Google Scholar] [CrossRef] [PubMed]
- Di Daniele, N.; Noce, A.; Vidiri, M.F.; Moriconi, E.; Marrone, G.; Annicchiarico-Petruzzelli, M.; D’Urso, G.; Tesauro, M.; Rovella, V.; De Lorenzo, A. Impact of Mediterranean diet on metabolic syndrome, cancer and longevity. Oncotarget 2017, 8, 8947–8979. [Google Scholar] [CrossRef] [PubMed] [Green Version]
- Martínez-González, M.A.; Gea, A.; Ruiz-Canela, M. The Mediterranean Diet and Cardiovascular Health. Circ. Res. 2019, 124, 779–798. [Google Scholar] [CrossRef] [PubMed]
- Salas-Salvadó, J.; Becerra-Tomás, N.; García-Gavilán, J.F.; Bulló, M.; Barrubés, L. Mediterranean Diet and Cardiovascular Disease Prevention: What Do We Know? Prog. Cardiovasc. Dis. 2018, 61, 62–67. [Google Scholar] [CrossRef]
- Sofi, F.; Abbate, R.; Gensini, G.F.; Casini, A. Accruing evidence on benefits of adherence to the Mediterranean diet on health: An updated systematic review and meta-analysis. Am. J. Clin. Nutr. 2010, 92, 1189–1196. [Google Scholar] [CrossRef] [PubMed] [Green Version]
- Grosso, G.; Buscemi, S.; Galvano, F.; Mistretta, A.; Marventano, S.; La Vela, V.; Drago, F.; Gangi, S.; Basile, F.; Biondi, A. Mediterranean diet and cancer: Epidemiological evidence and mechanism of selected aspects. BMC Surg. 2013, 13 (Suppl. S2), S14. [Google Scholar] [CrossRef] [PubMed] [Green Version]
- Koloverou, E.; Esposito, K.; Giugliano, D.; Panagiotakos, D. The effect of Mediterranean diet on the development of type 2 diabetes mellitus: A meta-analysis of 10 prospective studies and 136,846 participants. Metab. Clin. Exp. 2014, 63, 903–911. [Google Scholar] [CrossRef] [PubMed]
- Esposito, K.; Kastorini, C.M.; Panagiotakos, D.B.; Giugliano, D. Mediterranean diet and metabolic syndrome: An updated systematic review. Rev. Endocr. Metab. Disord. 2013, 14, 255–263. [Google Scholar] [CrossRef] [PubMed]
- Delgado-Lista, J.; Perez-Martinez, P.; Garcia-Rios, A.; Perez-Caballero, A.I.; Perez-Jimenez, F.; Lopez-Miranda, J. Mediterranean Diet and Cardiovascular Risk: Beyond Traditional Risk Factors. Crit. Rev. Food Sci. Nutr. 2016, 56, 788–801. [Google Scholar] [CrossRef] [PubMed]
- De Lorgeril, M.; Salen, P. Mediterranean diet in secondary prevention of CHD. Public Health Nutr. 2011, 14, 2333–2337. [Google Scholar] [CrossRef] [PubMed] [Green Version]
- Hardman, R.J.; Kennedy, G.; Macpherson, H.; Scholey, A.B.; Pipingas, A. Adherence to a Mediterranean-Style Diet and Effects on Cognition in Adults: A Qualitative Evaluation and Systematic Review of Longitudinal and Prospective Trials. Front. Nutr. 2016, 3, 22. [Google Scholar] [CrossRef] [PubMed] [Green Version]
- De Pergola, G.; D’Alessandro, A. Influence of Mediterranean Diet on Blood Pressure. Nutrients 2018, 10, 1700. [Google Scholar] [CrossRef] [PubMed] [Green Version]
- Sofi, F.; Cesari, F.; Abbate, R.; Gensini, G.F.; Casini, A. Adherence to Mediterranean diet and health status: Meta-analysis. BMJ 2008, 337, a1344. [Google Scholar] [CrossRef] [Green Version]
- Petersson, S.D.; Philippou, E. Mediterranean Diet, Cognitive Function, and Dementia: A Systematic Review of the Evidence. Adv. Nutr. 2016, 7, 889–904. [Google Scholar] [CrossRef] [PubMed] [Green Version]
- Vilarnau, C.; Stracker, D.M.; Funtikov, A.; da Silva, R.; Estruch, R.; Bach-Faig, A. Worldwide adherence to Mediterranean Diet between 1960 and 2011. Eur. J. Clin. Nutr. 2019, 72, 83–91. [Google Scholar] [CrossRef] [PubMed]
- Pereira-da-Silva, L.; Pinto, E. Low Adherence to Mediterranean Diet in Portugal: Pregnant Women Nutrition in Portugal and its Repercussions. Acta Med. Port. 2016, 29, 658–666. [Google Scholar] [CrossRef] [PubMed] [Green Version]
- Grosso, G.; Marventano, S.; Giorgianni, G.; Raciti, T.; Galvano, F.; Mistretta, A. Mediterranean diet adherence rates in Sicily, southern Italy. Public Health Nutr. 2014, 17, 2001–2009. [Google Scholar] [CrossRef] [PubMed]
- Bonaccio, M.; Bonanni, A.E.; Di Castelnuovo, A.; De Lucia, F.; Donati, M.B.; de Gaetano, G.; Iacoviello, L. Low income is associated with poor adherence to a Mediterranean diet and a higher prevalence of obesity: Cross-sectional results from the Moli-sani study. BMJ Open 2012, 2, e001685. [Google Scholar] [CrossRef] [PubMed] [Green Version]
- Bonaccio, M.; Di Castelnuovo, A.; Bonanni, A.; Costanzo, S.; De Lucia, F.; Persichillo, M.; Zito, F.; Donati, M.B.; de Gaetano, G.; Iacoviello, L. Decline of the Mediterranean diet at a time of economic crisis. Results from the Moli-sani study. Nutr. Metab. Cardiovasc. Dis. NMCD 2014, 24, 853–860. [Google Scholar] [CrossRef] [PubMed]
- Veronese, N.; Notarnicola, M.; Cisternino, A.M.; Inguaggiato, R.; Guerra, V.; Reddavide, R.; Donghia, R.; Rotolo, O.; Zinzi, I.; Leandro, G.; et al. Trends in adherence to the Mediterranean diet in South Italy: A cross sectional study. Nutr. Metab. Cardiovasc. Dis. NMCD 2020, 30, 410–417. [Google Scholar] [CrossRef] [PubMed]
- Archero, F.; Ricotti, R.; Solito, A.; Carrera, D.; Civello, F.; Di Bella, R.; Bellone, S.; Prodam, F. Adherence to the Mediterranean Diet among School Children and Adolescents Living in Northern Italy and Unhealthy Food Behaviors Associated to Overweight. Nutrients 2018, 10, 1322. [Google Scholar] [CrossRef] [PubMed] [Green Version]
- Gregorio, M.J.; Rodrigues, A.M.; Graca, P.; de Sousa, R.D.; Dias, S.S.; Branco, J.C.; Canhao, H. Food Insecurity Is Associated with Low Adherence to the Mediterranean Diet and Adverse Health Conditions in Portuguese Adults. Front. Public Health 2018, 6, 38. [Google Scholar] [CrossRef] [PubMed]
- Naska, A.; Trichopoulou, A. Back to the future: The Mediterranean diet paradigm. Nutr. Metab. Cardiovasc. Dis. NMCD 2014, 24, 216–219. [Google Scholar] [CrossRef]
- Rodrigues, A.M.; Gouveia, N.; da Costa, L.P.; Eusebio, M.; Ramiro, S.; Machado, P.; Mourao, A.F.; Silva, I.; Laires, P.; Sepriano, A.; et al. EpiReumaPt- the study of rheumatic and musculoskeletal diseases in Portugal: A detailed view of the methodology. Acta Reumatol. Port. 2015, 40, 110–124. [Google Scholar]
- Laires, P.A.; Canhão, H.; Araújo, D.; Fonseca, J.E.; Machado, P.; Mourão, A.F.; Ramiro, S.; Romeu, J.C.; Santos, M.J.; Silva, I.; et al. CoReumaPt protocol: The Portuguese cohort of rheumatic diseases. Acta Reumatol. Port. 2012, 37, 18–24. [Google Scholar] [PubMed]
- World Medical Association. World Medical Association Declaration of Helsinki Ethical Principles for Medical Research Involving Human Subjects. JAMA 2013, 310, 2191–2194. [Google Scholar] [CrossRef] [PubMed] [Green Version]
- Gregório, M.J.; Rodrigues, A.M.; Salvador, C.; Dias, S.S.; de Sousa, R.D.; Mendes, J.M.; Coelho, P.S.; Branco, J.C.; Lopes, C.; Martínez-González, M.A.; et al. Validation of the Telephone-Administered Version of the Mediterranean Diet Adherence Screener (MEDAS) Questionnaire. Nutrients 2020, 12, 1511. [Google Scholar] [CrossRef] [PubMed]
- Gregório, M.J.; Nogueira, P.J.; Graça, P. The first validation of the Household Food Insecurity Scale in a sample of the Portuguese population. In Desigualdades Sociais No Acesso a uma Alimentação Saudável: Um Estudo na População Portuguesa; Gregório, M.J., Ed.; Faculty of Nutrition and Food Sciences of University of Porto: Porto, Portugal, 2014. [Google Scholar]
- Ferreira, P.L.; Ferreira, L.N.; Pereira, L.N. Contribution for the validation of the Portuguese version of EQ-5D. Acta Med. Port. 2013, 26, 664–675. [Google Scholar] [CrossRef] [PubMed]
- Schröder, H.; Fitó, M.; Estruch, R.; Martínez-González, M.A.; Corella, D.; Salas-Salvadó, J.; Lamuela-Raventós, R.; Ros, E.; Salaverría, I.; Fiol, M.; et al. A Short Screener Is Valid for Assessing Mediterranean Diet Adherence among Older Spanish Men and Women. J. Nutr. 2011, 141, 1140–1145. [Google Scholar] [CrossRef] [PubMed] [Green Version]
- Gregório, M.J.; Graça, P.; Costa, A.; Nogueira, P.J. Time and regional perspective of food insecurity during the economic crisis in Portugal, 2011–2013. Saúde Soc. 2014, 23, 13–27. [Google Scholar] [CrossRef]
- Gregório, M.J.; Graça, P.; Nogueira, P.J.; Gomes, S.; Santos, C.A.; Boavida, J. Proposta metodológica para a avaliação da insegurança alimentar em Portugal. Rev. Nutr. 2012, 21, 4–11. [Google Scholar]
- Ferreira, L.N.; Ferreira, P.L.; Pereira, L.N.; Oppe, M. EQ-5D Portuguese population norms. Qual. Life Res. 2014, 23, 425–430. [Google Scholar] [CrossRef]
- Ferreira, L.N.; Ferreira, P.L.; Pereira, L.N.; Oppe, M. The valuation of the EQ-5D in Portugal. Qual. Life Res. 2014, 23, 413–423. [Google Scholar] [CrossRef] [PubMed]
- World Health Organization. Physical Status: The Use and Interpretation of Anthropometry Report of a WHO Expert Committee; WHO Technical Report Series 854; World Health Organization: Geneve, Switzerland, 1995.
- Ferreira-Pêgo, C.; Rodrigues, J.; Costa, A.; Sousa, B. Adherence to the Mediterranean diet in Portuguese university students: Adesão à Dieta Mediterrânea em estudantes universitários Portugueses. J. Biomed. Biopharm. Res. 2019, 16, 41–49. [Google Scholar] [CrossRef]
- Gregório, M.J.; Sousa, S.M.d.; Chkoniya, V.; Graça, P. Estudo de Adesão ao Padrão Alimentar Mediterrânico; Direção-Geral da Saúde: Lisbon, Portugal, 2020; p. 9. ISBN 978-972-675-311-7.
- Bach-Faig, A.; Fuentes-Bol, C.; Ramos, D.; Carrasco, J.L.; Roman, B.; Bertomeu, I.F.; Cristià, E.; Geleva, D.; Serra-Majem, L. The Mediterranean diet in Spain: Adherence trends during the past two decades using the Mediterranean Adequacy Index. Public Health Nutr. 2011, 14, 622–628. [Google Scholar] [CrossRef] [PubMed] [Green Version]
- León-Muñoz, L.M.; Guallar-Castillón, P.; Graciani, A.; López-García, E.; Mesas, A.E.; Aguilera, M.T.; Banegas, J.R.; Rodríguez-Artalejo, F. Adherence to the Mediterranean diet pattern has declined in Spanish adults. J. Nutr. 2012, 142, 1843–1850. [Google Scholar] [CrossRef] [PubMed] [Green Version]
- Kyriacou, A.; Evans, J.M.; Economides, N.; Kyriacou, A. Adherence to the Mediterranean diet by the Greek and Cypriot population: A systematic review. Eur. J. Public Health 2015, 25, 1012–1018. [Google Scholar] [CrossRef] [PubMed] [Green Version]
- Tognon, G.; Hebestreit, A.; Lanfer, A.; Moreno, L.A.; Pala, V.; Siani, A.; Tornaritis, M.; De Henauw, S.; Veidebaum, T.; Molnár, D.; et al. Mediterranean diet, overweight and body composition in children from eight European countries: Cross-sectional and prospective results from the IDEFICS study. Nutr. Metab. Cardiovasc. Dis. NMCD 2014, 24, 205–213. [Google Scholar] [CrossRef] [PubMed]
- Bonaccio, M.; Bes-Rastrollo, M.; de Gaetano, G.; Iacoviello, L. Challenges to the Mediterranean diet at a time of economic crisis. Nutr. Metab. Cardiovasc. Dis. NMCD 2016, 26, 1057–1063. [Google Scholar] [CrossRef] [PubMed]
- Lopez, C.N.; Martinez-Gonzalez, M.A.; Sanchez-Villegas, A.; Alonso, A.; Pimenta, A.M.; Bes-Rastrollo, M. Costs of Mediterranean and western dietary patterns in a Spanish cohort and their relationship with prospective weight change. J. Epidemiol. Community Health 2009, 63, 920–927. [Google Scholar] [CrossRef] [PubMed]
- Schröder, H.; Marrugat, J.; Covas, M.I. High monetary costs of dietary patterns associated with lower body mass index: A population-based study. Int. J. Obes. 2006, 30, 1574–1579. [Google Scholar] [CrossRef] [PubMed] [Green Version]
- Tong, T.Y.N.; Imamura, F.; Monsivais, P.; Brage, S.; Griffin, S.J.; Wareham, N.J.; Forouhi, N.G. Dietary cost associated with adherence to the Mediterranean diet, and its variation by socio-economic factors in the UK Fenland Study. Br. J. Nutr. 2018, 119, 685–694. [Google Scholar] [CrossRef] [Green Version]
- Petrovic, D.; de Mestral, C.; Bochud, M.; Bartley, M.; Kivimäki, M.; Vineis, P.; Mackenbach, J.; Stringhini, S. The contribution of health behaviors to socioeconomic inequalities in health: A systematic review. Prev. Med. 2018, 113, 15–31. [Google Scholar] [CrossRef] [PubMed] [Green Version]
- Méjean, C.; Droomers, M.; van der Schouw, Y.T.; Sluijs, I.; Czernichow, S.; Grobbee, D.E.; Bueno-de-Mesquita, H.B.; Beulens, J.W. The contribution of diet and lifestyle to socioeconomic inequalities in cardiovascular morbidity and mortality. Int. J. Cardiol. 2013, 168, 5190–5195. [Google Scholar] [CrossRef] [PubMed]
- Black, C.; Moon, G.; Baird, J. Dietary inequalities: What is the evidence for the effect of the neighbourhood food environment? Health Place 2014, 27, 229–242. [Google Scholar] [CrossRef] [PubMed] [Green Version]
- Martikainen, P.; Brunner, E.; Marmot, M. Socioeconomic differences in dietary patterns among middle-aged men and women. Soc. Sci. Med. 2003, 56, 1397–1410. [Google Scholar] [CrossRef]
- Dowler, E. Inequalities in diet and physical activity in Europe. Public Health Nutr. 2001, 4, 701–709. [Google Scholar] [CrossRef] [Green Version]
- Velhinho, A.R.; Perelman, J. Socioeconomic Inequalities in Food Consumption: A Cross-Sectional Study in Portuguese Adults. Port. J. Public Health 2021, 39, 11–20. [Google Scholar] [CrossRef]
- Galilea-Zabalza, I.; Buil-Cosiales, P.; Salas-Salvadó, J.; Toledo, E.; Ortega-Azorín, C.; Díez-Espino, J.; Vázquez-Ruiz, Z.; Zomeño, M.D.; Vioque, J.; Martínez, J.A.; et al. Mediterranean diet and quality of life: Baseline cross-sectional analysis of the PREDIMED-PLUS trial. PLoS ONE 2018, 13, e0198974. [Google Scholar] [CrossRef] [PubMed] [Green Version]
- Veronese, N.; Stubbs, B.; Noale, M.; Solmi, M.; Luchini, C.; Maggi, S. Adherence to the Mediterranean diet is associated with better quality of life: Data from the Osteoarthritis Initiative. Am. J. Clin. Nutr. 2016, 104, 1403–1409. [Google Scholar] [CrossRef]
- Portugal. Ministry of Health. National Institute of Health Dr Ricardo Jorge. Reduction of Salt (Sodium) in Bread and Its Contribution to the Decrease of Blood Pressure in Portugal; Health Impact Assessment Pilot Study: Final Report; Teresa Caldas de Almeida, Luciana Costa: Lisbon, Portugal, 2020. [Google Scholar]
- Goiana-da-Silva, F.; Nunes, A.M.; Miraldo, M.; Bento, A.; Breda, J.; Araújo, F.F. Using Pricing Policies to Promote Public Health: The Sugar Sweetened Beverages Taxation Experience in Portugal. Acta Med. Port. 2018, 31, 191–195. [Google Scholar] [CrossRef] [Green Version]
- Graça, P.; Gregório, M.J.; Freitas, M.G. A Decade of Food and Nutrition Policy in Portugal (2010–2020). Port. J. Public Health 2020, 38, 94–118. [Google Scholar] [CrossRef]
- Governo da República Portuguesa. Governo quer Promover Dieta Mediterrânica Através da sua Integração nas Ementas Escolares. Available online: https://www.portugal.gov.pt/pt/gc21/comunicacao/noticia?i=20170509-mafdr-dieta-mediterranica (accessed on 2 March 2022).
- Grosso, G. The Mediterranean diet as a sustainable dietetic model. Eur. J. Public Health 2018, 28. [Google Scholar] [CrossRef]

| All (n = 5647) | Low Adherence to MD (n = 1545) | Moderate/High Adherence to MD (n = 4102) | Non-Adjusted OR (95% CI) | Adjusted OR (95% CI) * | |
|---|---|---|---|---|---|
| Socioeconomic and demographic | |||||
| Sex, n (%) | |||||
| Women | 3607 (52.5) | 921 (45.6) | 2686 (55.3) | 0.78 (0.69–0.88) | 0.75 (0.66–0.86) |
| Age, years, n (%) | |||||
| 18–29 | 355 (15.4) | 152 (19.7) | 203 (13.6) | 1 (ref.) | 1 (ref.) |
| 30–39 | 605 (19.1) | 204 (25.0) | 401 (16.7) | 0.68 (0.52–0.89) | 0.64 (0.48–0.85) |
| 40–49 | 1049 (18.3) | 295 (17.4) | 754 (18.6) | 0.52 (0.41–0.67) | 0.44 (0.33–0.57) |
| 50–59 | 1143 (15.9) | 283 (13.1) | 860 (17.0) | 0.44 (0.34–0.56) | 0.33 (0.25–0.43) |
| 60–69 | 1112 (13.7) | 241 (10.9) | 871 (14.9) | 0.37 (0.29–0.48) | 0.29 (0.21–0.40) |
| 70–74 | 491 (6.7) | 107 (3.3) | 384 (8.1) | 0.37 (0.28–0.50) | 0.29 (0.19–0.43) |
| ≥75 | 892 (10.9) | 263 (10.6) | 629 (11.1) | 0.56 (0.43–0.72) | 0.45 (0.31–0.65) |
| Education, years, n (%) | |||||
| 0–4 | 2203 (27.4) | 607 (24.6) | 1596 (28.5) | 1.61 (1.34–1.94) | 2.63 (2.09–3.32) |
| 5–9 | 1335 (23.1) | 410 (28.4) | 925 (20.9) | 1.87 (1.54–2.29) | 2.41 (1.95–2.99) |
| 10–12 | 1128 (27.7) | 338 (30.2) | 790 (26.7) | 1.81 (1.48–2.22) | 1.78 (1.44–2.20) |
| >12 | 967 (21.8) | 185 (16.8) | 782 (23.8) | 1 (ref.) | 1 (ref.) |
| NUTS II, n (%) | |||||
| North | 1659 (36.5) | 380 (33.7) | 1279 (37.6) | 1 (ref.) | 1 (ref.) |
| Center | 1086 (23.2) | 268 (22.0) | 818 (23.7) | 1.10 (0.92–1.32) | 1.15 (0.95–1.38) |
| Lisbon | 1131 (24.8) | 303 (26.0) | 828 (24.3) | 1.23 (1.03–1.47) | 1.45 (1.21–1.75) |
| Alentejo | 320 (7.2) | 87 (7.4) | 233 (7.1) | 1.26 (0.95–1.64) | 1.40 (1.06–1.85) |
| Algarve | 183 (3.7) | 56 (4.3) | 127 (3.5) | 1.48 (1.06–2.06) | 1.59 (1.11–2.24) |
| Azores | 657 (2.2) | 254 (3.4) | 403 (1.7) | 2.12 (1.75–2.58) | 2.19 (1.79–2.68) |
| Madeira | 611 (2.4) | 197 (3.2) | 414 (2.1) | 1.60 (1.30–1.96) | 1.81 (1.46–2.24) |
| Employment status, n (%) | |||||
| Employed full/part-time | 2444 (53.0) | 700 (57.2) | 1744 (51.4) | 1 (ref.) | 1 (ref.) |
| Unpaid household worker | 450 (4.7) | 116 (4.9) | 334 (4.7) | 0.87 (0.69–1.08) | 0.83 (0.63–1.09) |
| Retired | 2007 (26.4) | 472 (18.4) | 1535 (29.6) | 0.77 (0.67–0.88) | 0.75 (0.59–0.95) |
|
Unemployed/Student/Temporary incapacity to work | 706 (15.9) | 226 (19.5) | 480 (14.4) | 1.17 (0.98–1.40) | 1.03 (0.85–1.25) |
| Income perception, n (%) | |||||
| Able to live comfortably with present income | 1027 (22.8) | 238 (21.6) | 789 (23.2) | 1 (ref.) | 1 (ref.) |
| Able to live with present income | 2293 (43.2) | 583 (42.4) | 1710 (43.5) | 1.13 (0.95–1.34) | 1.13 (0.94–1.37) |
| Finding it difficult with present income | 1565 (25.0) | 459 (25.8) | 1106 (24.6) | 1.38 (1.15–1.65) | 1.42 (1.16–1.74) |
| Finding it very difficult with present income | 675 (9.1) | 201 (10.2) | 474 (8.6) | 1.41 (1.13–1.75) | 1.48 (1.16–1.91) |
| Food security status, n (%) | |||||
| Food security | 4151 (80.7) | 1024 (77.9) | 3127 (81.8) | 1 (ref.) | 1 (ref.) |
| Low food insecurity | 959 (14.1) | 274 (19.0) | 676 (13.8) | 1.24 (1.06–1.45) | 1.18 (1.00–1.40) |
| Moderate food insecurity | 286 (3.5) | 101 (6.6) | 185 (3.1) | 1.67 (1.29–2.14) | 1.72 (1.31–2.24) |
| Severe food insecurity | 144 (1.8) | 61(4.5) | 83 (1.4) | 2.24 (1.60–3.14) | 2.27 (1.58–3.23) |
| Lifestyle | |||||
| Body Mass Index, kg/m2, n (%) | |||||
| Underweight | 88 (2.1) | 27 (2.9) | 61 (1.8) | 1.25 (0.78–1.97) | 1.25 (0.76–2.01) |
| Normal weight | 2009 (44.5) | 525 (46.1) | 1484 (43.9) | 1 (ref.) | 1 (ref.) |
| Overweight | 2098 (37.7) | 504 (34.6) | 1594 (38.8) | 0.89 (0.78–1.03) | 0.92 (0.79–1.07) |
| Obesity | 979 (15.7) | 280 (16.3) | 699 (15.5) | 1.13 (0.95–1.34) | 1.22 (1.01–1.46) |
| Alcohol intake, n (%) | |||||
| Never | 1945 (30.6) | 577 (31.3) | 1368 (30.3) | 1 (ref.) | 1 (ref.) |
| Daily | 1565 (29.7) | 268 (19.0) | 1297 (33.9) | 0.49 (0.42–0.58) | 0.42 (0.35–0.51) |
| Occasionally | 2020 (39.6) | 616 (49.7) | 1404 (35.7) | 1.04 (0.91–1.19) | 0.97 (0.84–1.13) |
| Smoking habits, n (%) | |||||
| Never smoked | 3150 (57.3) | 883 (54.4) | 2627 (58.5) | 1 (ref.) | 1 (ref.) |
| Past smoker | 1149 (21.1) | 276 (18.2) | 873 (22.3) | 0.94 (0.80–1.10) | 0.91 (0.77–1.09) |
| Smokes daily/occasionally | 876 (21.5) | 300 (27.4) | 576 (19.3) | 1.55 (1.32–1.82) | 1.33 (1.11–1.59) |
| Physical activity, n (%) | |||||
| Regularly | 2370 (44.2) | 474 (35) | 1896 (47.9) | 0.52 (0.45–0.58) | 0.53 (0.46–0.60) |
| Quality of life | |||||
| EQ-5D-3L, mean (±SD) | 0.7 (0.3) | 0.8 (±0.3) | 0.8 (±0.3) | 0.56 (0.47–0.67) | 0.48 (0.38–0.59) |
| Healthcare resources consumption | |||||
| Was hospitalized since last contact, n (%) | 737 (11.0) | 195 (9.9) | 542 (11.5) | 0.95 (0.80–1.13) | 0.99 (0.82–1.19) |
| Went to medical appointments in hospitals since last contact, n (%) | 2043 (43.1) | 532 (37.0) | 1511 (45.5) | 0.94 (0.82–1.07) | 0.94 (0.82–1.08) |
| Went to medical appointments in primary health care centers since last contact, n (%) | 4126 (91.9) | 1073 (90.5) | 3053 (92.5) | 0.71 (0.57–0.88) | 0.82 (0.65–1.05) |
| Number of medical appointments in public sector since last contact, mean (±SD) | 3.57 (4.1) | 3.2 (±3.4) | 3.7 (±4.3) | 0.98 (0.96–0.99) | 0.98 (0.97–1.00) |
| Number of medical appointments in private sector since last contact, mean (±SD) | 1.35 (3.4) | 1.2 (±4.0) | 1.4 (±3.1) | 0.96 (0.94–0.98) | 0.98 (0.95–1.00) |
| Chronic disease management | |||||
| Reduction in medication due to economic constraints, n (%) | 496 (6.0) | 156 (6.0) | 340 (6.1) | 1.25 (1.02–1.52) | 1.30 (1.06–1.61) |
| Reduction in medical appointments due to economic constraints, n (%) | 516 (6.4) | 146 (6.1) | 370 (6.5) | 1.05 (0.86–1.29) | 1.03 (0.83–1.26) |
| MEDAS score, mean (±SD) | 6.64 (2.1) | 4.1 (1.0) | 7.7 (1.5) | - | - |
| All (n = 5561) | Able to Live Comfortably with Present Income (n = 1027) | Able to Live with Present Income (n = 2293) | Finding It Difficult with Present Income (n = 1566) | Finding It Very Difficult with Present Income (n = 675) | |
|---|---|---|---|---|---|
| Individual MEDAS items, n (%) | |||||
| Olive oil as principal source of fat for cooking | 4897 (87.4) | 925 (87.7) | 2051 (89.8) | 1341 (83.6) | 580 (85.6) |
| Olive oil (>4 Tbsp per day) | 1109 (21.9) | 258 (26.5) | 501 (23.0) | 259 (17.1) | 91 (18.2) |
| Vegetables (≥2 servings per day) | 1266 (21.4) | 274 (22.9) | 537 (22.1) | 311 (18.8) | 144 (21.9) |
| Fruit (≥3 units per day) | 1770 (29.7) | 385 (30.6) | 825 (32.4) | 415 (27.5) | 145 (20.8) |
| Red meat, hamburgers or sausages (<1 serving per day) | 4131 (67.7) | 730 (66.1) | 1677 (65.9) | 1199 (71.3) | 525 (70.1) |
| Butter, margarine or cream (<1 per day) | 3851 (68.4) | 693 (70.2) | 1553 (66.9) | 1105 (68.6) | 500 (70.1) |
| Carbonated and/or sugar-sweetened beverages (<1 per day) | 4745 (82.6) | 863 (79.0) | 1966 (83.4) | 1334 (84.1) | 582 (83.5) |
| Wine (≥7 glasses per week) | 1250 (23.6) | 209 (20.1) | 561 (23.9) | 347 (25.7) | 133 (25.5) |
| Pulses (≥3 servings per week) | 1340 (24.5) | 295 (24.5) | 575 (23.2) | 335 (20.8) | 135 (22.3) |
| Fish/seafood (≥3 servings per week) | 3106 (57.7) | 674 (66.3) | 1334 (58.3) | 803 (53.9) | 295 (44.1) |
| Commercial (not homemade) pastries (<2 servings per week) | 3494 (59.9) | 576 (54.2) | 1403 (60.6) | 1015 (60.2) | 500 (69.4) |
| Nuts (≥3 servings per week) | 753 (15.1) | 246 (25.1) | 313 (14.1) | 149 (11.3) | 45 (5.4) |
| Preference to consume chicken, turkey or rabbit meat instead of beef, pork, hamburger or sausages | 3442 (61.1) | 652 (61.0) | 1412 (60.5) | 972 (62.9) | 406 (59.5) |
| Boiled vegetables, pasta, rice or other dishes with a sauce of tomato, garlic, onion or leeks sautéed in olive oil (≥2 times per week) | 2341 (47.6) | 499 (53.9) | 982 (48.9) | 609 (41.7) | 251 (41.9) |
| Able to Live with Present Income (n = 2293) | Finding It Difficult with Present Income (n = 1566) | Finding It Very Difficult with Present Income (n = 675) | ||||
|---|---|---|---|---|---|---|
| Non-Adjusted OR (95% CI) | Adjusted OR (95% CI) * | Non-adjusted OR (95% CI) | Adjusted OR (95% CI) * | Non-Adjusted OR (95% CI) | Adjusted OR (95% CI) * | |
| Individual MEDAS items | ||||||
| Olive oil as principal source of fat for cooking | 0.96 (0.75–1.22) | 1.01 (0.78–1.32) | 0.68 (0.52–0.86) | 0.73 (0.55–0.96) | 0.70 (0.51–0.94) | 0.79 (0.56–1.11) |
| Olive oil (>4 Tbsp per day) | 0.84 (0.70–0.99) | 0.94 (0.79–1.13) | 0.59 (0.49–0.72) | 0.75 (0.60–0.93) | 0.46 (0.36–0.60) | 0.65 (0.48–0.86) |
| Vegetables (≥2 servings per day) | 0.84 (0.71–0.99) | 0.88 (0.74–1.06) | 0.68 (0.57–0.82) | 0.74 (0.60–0.91) | 0.74 (0.59–0.94) | 0.82 (0.64–1.07) |
| Fruit (≥3 units per day) | 0.94 (0.80–1.09) | 0.90 (0.76–1.06) | 0.60 (0.51–0.71) | 0.55 (0.46–0.67) | 0.45 (0.36–0.57) | 0.41 (0.32–0.52) |
| Red meat, hamburgers or sausages (<1 serving per day) | 1.11 (0.94–1.30) | 1.05 (0.88–1.25) | 1.34 (1.12–1.61) | 1.12 (0.91–1.36) | 1.41 (1.13–1.78) | 1.03 (0.80–1.33) |
| Butter, margarine or cream (<1 per day) | 1.01 (0.86–1.18) | 0.98 (0.83–1.16) | 1.18 (0.99–140) | 1.09 (0.90–1.32) | 1.37 (1.10–1.70) | 1.22 (0.96–1.55) |
| Carbonated and/or sugar-sweetened beverages (<1 per day) | 1.14 (0.92–1.39) | 1.10 (0.88–1.37) | 1.11 (0.89–1.38) | 0.97 (0.76–1.24) | 1.17 (0.89–1.55) | 0.92 (0.67–1.26) |
| Wine (≥7 glasses per week) | 1.27 (1.06–1.52) | 0.95 (0.77–1.18) | 1.12 (0.92–1.36) | 0.84 (0.66–1.07) | 0.96 (0.75–1.22) | 0.72 (0.53–0.97) |
| Pulses (≥3 servings per week) | 0.83 (0.70–0.98) | 0.88 (0.74–1.05) | 0.68 (0.57–0.81) | 0.73 (0.60–0.89) | 0.62 (0.49–0.78) | 0.66 (0.51–0.85) |
| Fish/seafood (≥3 servings per week) | 0.72 (0.62–0.84) | 0.81 (0.69–0.96) | 0.55 (0.47–0.65) | 0.65 (0.54–0.78) | 0.40 (0.33–0.49) | 0.49 (0.39–0.61) |
| Commercial (not homemade) pastries (<2 servings per week) | 1.23 (1.06–1.43) | 1.03 (0.88–1.21) | 1.46 (1.24–1.71) | 1.09 (0.91–1.30) | 2.22 (1.80–2.74) | 1.51 (1.19–1.91) |
| Nuts (≥3 servings per week) | 0.50 (0.42–0.60) | 0.69 (0.57–0.85) | 0.33 (0.27–0.42) | 0.58 (0.45–0.74) | 0.23 (0.16–0.31) | 0.49 (0.34–0.71) |
| Preference to consume chicken, turkey or rabbit meat instead of beef, pork, hamburger or sausages | 0.91 (0.78–1.06) | 0.97 (0.82–1.14) | 0.94 (0.80–1.11) | 0.96 (0.80–1.15) | 0.84 (0.69–1.03) | 0.82 (0.67–1.03) |
| Boiled vegetables, pasta, rice or other dishes with a sauce of tomato, garlic, onion or leeks sautéed in olive oil (≥2 times per week) | 0.79 (0.68–0.91) | 0.92 (0.79–1.08) | 0.68 (0.58–0.79) | 0.87 (0.73–1.04) | 0.62 (0.51–0.76) | 0.87 (0.70–1.09) |
Publisher’s Note: MDPI stays neutral with regard to jurisdictional claims in published maps and institutional affiliations. |
© 2022 by the authors. Licensee MDPI, Basel, Switzerland. This article is an open access article distributed under the terms and conditions of the Creative Commons Attribution (CC BY) license (https://creativecommons.org/licenses/by/4.0/).
Share and Cite
Mendonça, N.; Gregório, M.J.; Salvador, C.; Henriques, A.R.; Canhão, H.; Rodrigues, A.M. Low Adherence to the Mediterranean Diet Is Associated with Poor Socioeconomic Status and Younger Age: A Cross-Sectional Analysis of the EpiDoC Cohort. Nutrients 2022, 14, 1239. https://doi.org/10.3390/nu14061239
Mendonça N, Gregório MJ, Salvador C, Henriques AR, Canhão H, Rodrigues AM. Low Adherence to the Mediterranean Diet Is Associated with Poor Socioeconomic Status and Younger Age: A Cross-Sectional Analysis of the EpiDoC Cohort. Nutrients. 2022; 14(6):1239. https://doi.org/10.3390/nu14061239
Chicago/Turabian StyleMendonça, Nuno, Maria João Gregório, Clara Salvador, Ana Rita Henriques, Helena Canhão, and Ana M. Rodrigues. 2022. "Low Adherence to the Mediterranean Diet Is Associated with Poor Socioeconomic Status and Younger Age: A Cross-Sectional Analysis of the EpiDoC Cohort" Nutrients 14, no. 6: 1239. https://doi.org/10.3390/nu14061239
APA StyleMendonça, N., Gregório, M. J., Salvador, C., Henriques, A. R., Canhão, H., & Rodrigues, A. M. (2022). Low Adherence to the Mediterranean Diet Is Associated with Poor Socioeconomic Status and Younger Age: A Cross-Sectional Analysis of the EpiDoC Cohort. Nutrients, 14(6), 1239. https://doi.org/10.3390/nu14061239