
Association of Dietary Intakes and Genetically Determined Serum Concentrations of Mono and Poly Unsaturated Fatty Acids on Chronic Kidney Disease: Insights from Dietary Analysis and Mendelian Randomization


Abstract
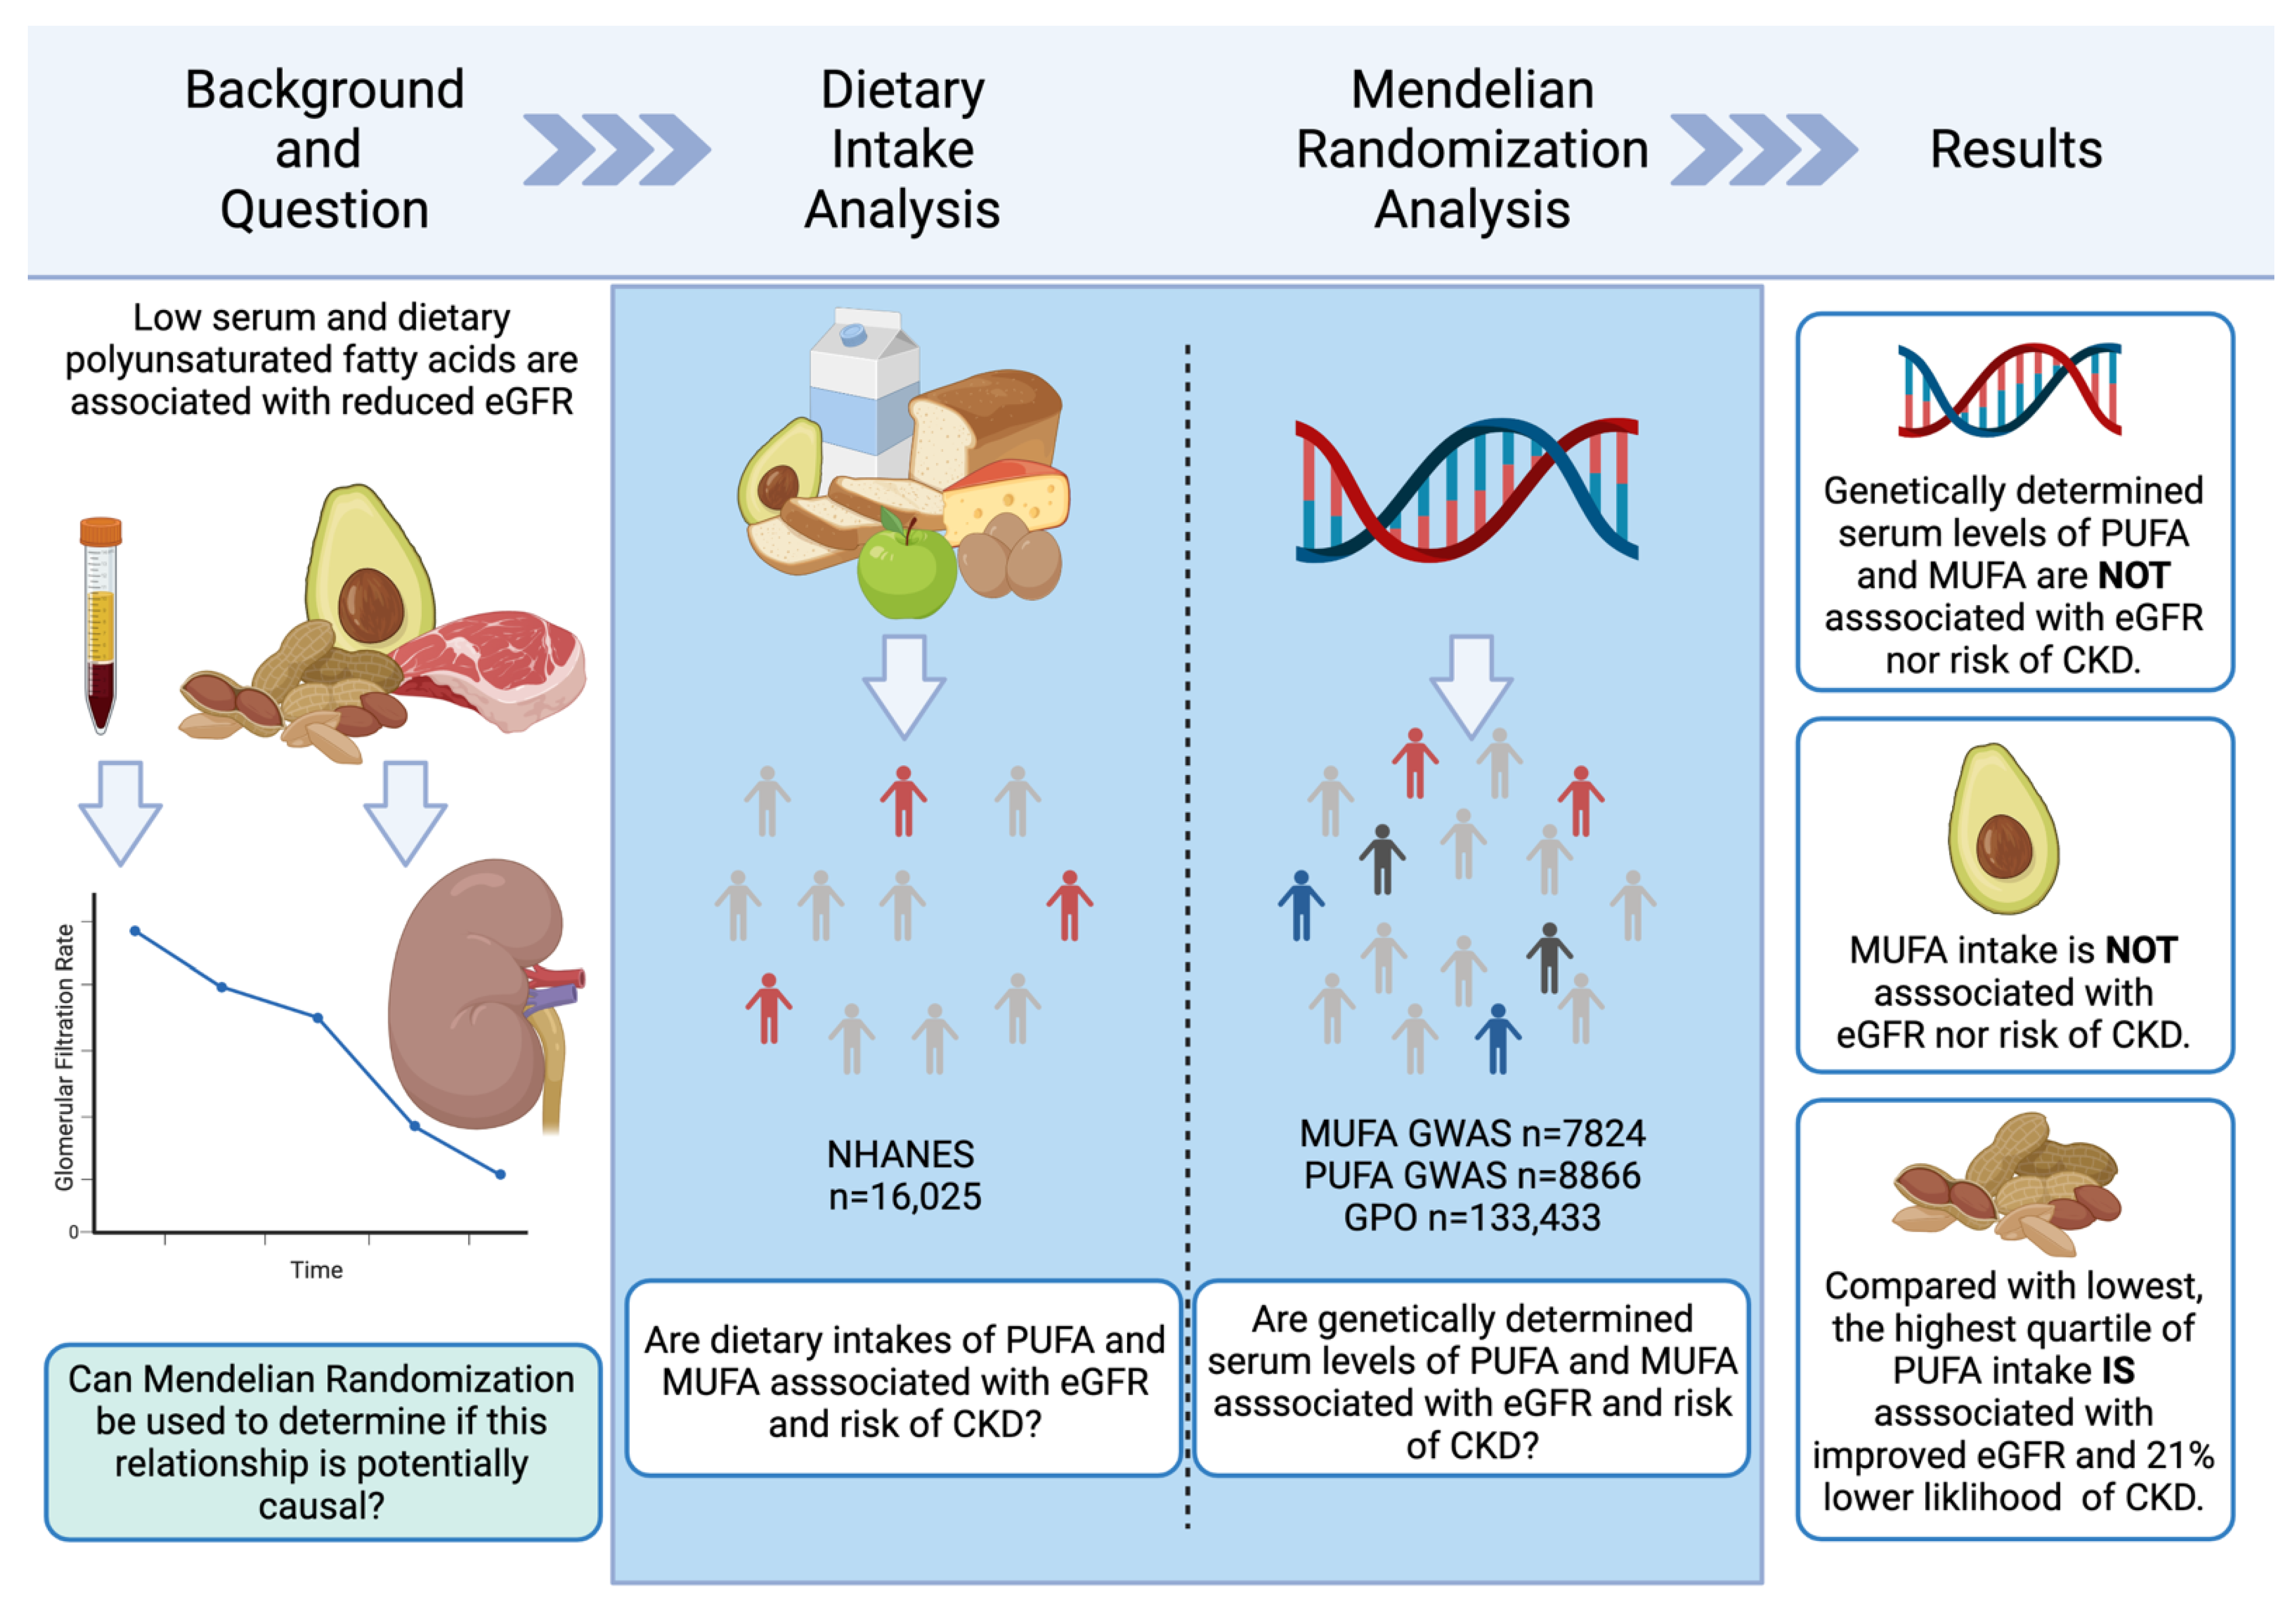
:1. Introduction
2. Materials and Methods
2.1. National Survey
2.1.1. Population
2.1.2. Dietary Intake
2.1.3. Statistical Analysis
2.2. Mendelian Randomization
2.2.1. Study Design
2.2.2. Genetic Predictors of Exposures
2.2.3. Genetic Predictors of Outcomes
2.2.4. Statistics
2.2.5. Sensitivity Analysis
3. Results
3.1. Dietary Intake
3.2. Mendelian Randomization
3.2.1. MUFAs
3.2.2. PUFAs
4. Discussion
5. Conclusions
Supplementary Materials
Author Contributions
Funding
Institutional Review Board Statement
Informed Consent Statement
Data Availability Statement
Conflicts of Interest
References
- Eckardt, K.U.; Coresh, J.; Devuyst, O.; Johnson, R.J.; Kottgen, A.; Levey, A.S.; Levin, A. Evolving importance of kidney disease: From subspecialty to global health burden. Lancet 2013, 382, 158–169. [Google Scholar] [CrossRef] [Green Version]
- Hill, N.R.; Fatoba, S.T.; Oke, J.L.; Hirst, J.A.; O’Callaghan, C.A.; Lasserson, D.S.; Hobbs, F.D. Global Prevalence of Chronic Kidney Disease—A Systematic Review and Meta-Analysis. PLoS ONE 2016, 11, e0158765. [Google Scholar] [CrossRef] [PubMed] [Green Version]
- Levey, A.S.; Eckardt, K.U.; Tsukamoto, Y.; Levin, A.; Coresh, J.; Rossert, J.; De Zeeuw, D.; Hostetter, T.H.; Lameire, N.; Eknoyan, G. Definition and classification of chronic kidney disease: A position statement from Kidney Disease: Improving Global Outcomes (KDIGO). Kidney Int. 2005, 67, 2089–2100. [Google Scholar] [CrossRef] [PubMed] [Green Version]
- Iwai, T.; Miyazaki, M.; Yamada, G.; Nakayama, M.; Yamamoto, T.; Satoh, M.; Sato, H.; Ito, S. Diabetes mellitus as a cause or comorbidity of chronic kidney disease and its outcomes: The Gonryo study. Clin. Exp. Nephrol. 2018, 22, 328–336. [Google Scholar] [CrossRef] [PubMed]
- Pugliese, G.; Penno, G.; Natali, A.; Barutta, F.; Di Paolo, S.; Reboldi, G.; Gesualdo, L.; De Nicola, L. Diabetic kidney disease: New clinical and therapeutic issues. Joint position statement of the Italian Diabetes Society and the Italian Society of Nephrology on “The natural history of diabetic kidney disease and treatment of hyperglycemia in patients with type 2 diabetes and impaired renal function”. J. Nephrol. 2020, 33, 9–35. [Google Scholar] [CrossRef] [PubMed] [Green Version]
- Kramer, H.J.; Nguyen, Q.D.; Curhan, G.; Hsu, C.Y. Renal insufficiency in the absence of albuminuria and retinopathy among adults with type 2 diabetes mellitus. JAMA 2003, 289, 3273–3277. [Google Scholar] [CrossRef] [PubMed] [Green Version]
- Seccia, T.M.; Caroccia, B.; Calo, L.A. Hypertensive nephropathy. Moving from classic to emerging pathogenetic mechanisms. J. Hypertens 2017, 35, 205–212. [Google Scholar] [CrossRef] [PubMed]
- Rao, M.V.; Qiu, Y.; Wang, C.; Bakris, G. Hypertension and CKD: Kidney Early Evaluation Program (KEEP) and National Health and Nutrition Examination Survey (NHANES), 1999–2004. Am. J. Kidney Dis. 2008, 51, S30–S37. [Google Scholar] [CrossRef] [PubMed] [Green Version]
- Kim, Y.J.; Hwang, S.D.; Oh, T.J.; Kim, K.M.; Jang, H.C.; Kimm, H.; Kim, H.C.; Jee, S.H.; Lim, S. Association Between Obesity and Chronic Kidney Disease, Defined by Both Glomerular Filtration Rate and Albuminuria, in Korean Adults. Metab. Syndr. Relat. Disord. 2017, 15, 416–422. [Google Scholar] [CrossRef] [PubMed]
- Garofalo, C.; Borrelli, S.; Minutolo, R.; Chiodini, P.; De Nicola, L.; Conte, G. A systematic review and meta-analysis suggests obesity predicts onset of chronic kidney disease in the general population. Kidney Int. 2017, 91, 1224–1235. [Google Scholar] [CrossRef]
- Gansevoort, R.T.; Correa-Rotter, R.; Hemmelgarn, B.R.; Jafar, T.H.; Heerspink, H.J.; Mann, J.F.; Matsushita, K.; Wen, C.P. Chronic kidney disease and cardiovascular risk: Epidemiology, mechanisms, and prevention. Lancet 2013, 382, 339–352. [Google Scholar] [CrossRef]
- Herzog, C.A.; Asinger, R.W.; Berger, A.K.; Charytan, D.M.; Diez, J.; Hart, R.G.; Eckardt, K.U.; Kasiske, B.L.; McCullough, P.A.; Passman, R.S.; et al. Cardiovascular disease in chronic kidney disease. A clinical update from Kidney Disease: Improving Global Outcomes (KDIGO). Kidney Int. 2011, 80, 572–586. [Google Scholar] [CrossRef] [PubMed] [Green Version]
- Matsushita, K.; van der Velde, M.; Astor, B.C.; Woodward, M.; Levey, A.S.; de Jong, P.E.; Coresh, J.; Gansevoort, R.T. Association of estimated glomerular filtration rate and albuminuria with all-cause and cardiovascular mortality in general population cohorts: A collaborative meta-analysis. Lancet 2010, 375, 2073–2081. [Google Scholar] [CrossRef] [PubMed] [Green Version]
- Wu, C.K.; Yang, C.Y.; Tsai, C.T.; Chiu, F.C.; Huang, Y.T.; Lee, J.K.; Cheng, C.L.; Lin, L.Y.; Lin, J.W.; Hwang, J.J.; et al. Association of low glomerular filtration rate and albuminuria with peripheral arterial disease: The National Health and Nutrition Examination Survey, 1999–2004. Atherosclerosis 2010, 209, 230–234. [Google Scholar] [CrossRef] [PubMed]
- Lauretani, F.; Semba, R.D.; Bandinelli, S.; Miller, E.R., 3rd; Ruggiero, C.; Cherubini, A.; Guralnik, J.M.; Ferrucci, L. Plasma polyunsaturated fatty acids and the decline of renal function. Clin. Chem. 2008, 54, 475–481. [Google Scholar] [CrossRef] [PubMed] [Green Version]
- Dos Santos, A.L.T.; Duarte, C.K.; Santos, M.; Zoldan, M.; Almeida, J.C.; Gross, J.L.; Azevedo, M.J.; Lichtenstein, A.H.; Zelmanovitz, T. Low linolenic and linoleic acid consumption are associated with chronic kidney disease in patients with type 2 diabetes. PLoS ONE 2018, 13, e0195249. [Google Scholar] [CrossRef] [PubMed] [Green Version]
- Yuzbashian, E.; Asghari, G.; Mirmiran, P.; Hosseini, F.S.; Azizi, F. Associations of dietary macronutrients with glomerular filtration rate and kidney dysfunction: Tehran lipid and glucose study. J. Nephrol. 2015, 28, 173–180. [Google Scholar] [CrossRef] [PubMed]
- Cardenas, C.; Bordiu, E.; Bagazgoitia, J.; Calle-Pascual, A.L. Polyunsaturated fatty acid consumption may play a role in the onset and regression of microalbuminuria in well-controlled type 1 and type 2 diabetic people: A 7-year, prospective, population-based, observational multicenter study. Diabetes Care 2004, 27, 1454–1457. [Google Scholar] [CrossRef] [Green Version]
- Calder, P.C. Dietary modification of inflammation with lipids. Proc. Nutr. Soc. 2002, 61, 345–358. [Google Scholar] [CrossRef]
- Ferrucci, L.; Cherubini, A.; Bandinelli, S.; Bartali, B.; Corsi, A.; Lauretani, F.; Martin, A.; Andres-Lacueva, C.; Senin, U.; Guralnik, J.M. Relationship of plasma polyunsaturated fatty acids to circulating inflammatory markers. J. Clin. Endocrinol. Metab. 2006, 91, 439–446. [Google Scholar] [CrossRef]
- Smith, G.D.; Ebrahim, S. ‘Mendelian randomization’: Can genetic epidemiology contribute to understanding environmental determinants of disease? Int. J. Epidemiol. 2003, 32, 1–22. [Google Scholar] [CrossRef] [PubMed] [Green Version]
- Plotnikov, D.; Guggenheim, J.A. Mendelian randomisation and the goal of inferring causation from observational studies in the vision sciences. Ophthalmic Physiol. Opt. 2019, 39, 11–25. [Google Scholar] [CrossRef] [PubMed] [Green Version]
- National Heallth and Nutrition Examination Survey, National Center for Health Statistics. Available online: http://www.cdc.gov/nchs/nhanes.htm (accessed on 31 March 2020).
- Needham, B.L.; Adler, N.; Gregorich, S.; Rehkopf, D.; Lin, J.; Blackburn, E.H.; Epel, E.S. Socioeconomic status, health behavior, and leukocyte telomere length in the National Health and Nutrition Examination Survey, 1999–2002. Soc. Sci. Med. 2013, 85, 1–8. [Google Scholar] [CrossRef] [PubMed] [Green Version]
- Remer, T. Influence of nutrition on acid-base balance--metabolic aspects. Eur. J. Nutr. 2001, 40, 214–220. [Google Scholar] [CrossRef] [PubMed]
- Mazidi, M.; Michos, E.D.; Banach, M. The association of telomere length and serum 25-hydroxyvitamin D levels in US adults: The National Health and Nutrition Examination Survey. Arch. Med. Sci. 2017, 13, 61–65. [Google Scholar] [CrossRef] [PubMed] [Green Version]
- National Health and Nutrition Examination Survey, Laboratory Procedures Manual. Available online: http://www.cdc.gov/NCHS/data/nhanes/nhanes_09_10/CRP_F_met.pdf (accessed on 13 August 2019).
- Selvin, E.; Manzi, J.; Stevens, L.A.; Van Lente, F.; Lacher, D.A.; Levey, A.S.; Coresh, J. Calibration of serum creatinine in the National Health and Nutrition Examination Surveys (NHANES) 1988–1994, 1999–2004. Am. J. Kidney Dis. 2007, 50, 918–926. [Google Scholar] [CrossRef] [PubMed]
- Chavers, B.M.; Simonson, J.; Michael, A.F. A solid phase fluorescent immunoassay for the measurement of human urinary albumin. Kidney Int. 1984, 25, 576–578. [Google Scholar] [CrossRef] [PubMed] [Green Version]
- Ahluwalia, N.; Andreeva, V.A.; Kesse-Guyot, E.; Hercberg, S. Dietary patterns, inflammation and the metabolic syndrome. Diabetes Metab. 2013, 39, 99–110. [Google Scholar] [CrossRef] [PubMed]
- Ahluwalia, N.; Dwyer, J.; Terry, A.; Moshfegh, A.; Johnson, C. Update on NHANES Dietary Data: Focus on Collection, Release, Analytical Considerations, and Uses to Inform Public Policy. Adv. Nutr. 2016, 7, 121–134. [Google Scholar] [CrossRef] [Green Version]
- Moshfegh, A.J.; Rhodes, D.G.; Baer, D.J.; Murayi, T.; Clemens, J.C.; Rumpler, W.V.; Paul, D.R.; Sebastian, R.S.; Kuczynski, K.J.; Ingwersen, L.A.; et al. The US Department of Agriculture Automated Multiple-Pass Method reduces bias in the collection of energy intakes. Am. J. Clin. Nutr. 2008, 88, 324–332. [Google Scholar] [CrossRef]
- National Center for Health Statistics. Analytic and Reporting Guidelines. Available online: http://www.cdc.gov/nchs/data/nhanes/nhanes0304/nhanesanalyticguidelinesdec2005.pdf (accessed on 31 March 2020).
- Nwankwo, T.; Yoon, S.S.; Burt, V.; Gu, Q. Hypertension among adults in the United States: National Health and Nutrition Examination Survey, 2011–2012. NCHS Data Brief 2013, 133, 1–8. [Google Scholar]
- Slinker, B.K.; Glantz, S.A. Multiple regression for physiological data analysis: The problem of multicollinearity. Am. J. Physiol. 1985, 249, R1–R12. [Google Scholar] [CrossRef] [PubMed]
- Bowden, J.; Davey Smith, G.; Haycock, P.C.; Burgess, S. Consistent Estimation in Mendelian Randomization with Some Invalid Instruments Using a Weighted Median Estimator. Genet. Epidemiol. 2016, 40, 304–314. [Google Scholar] [CrossRef] [PubMed] [Green Version]
- Shin, S.Y.; Fauman, E.B.; Petersen, A.K.; Krumsiek, J.; Santos, R.; Huang, J.; Arnold, M.; Erte, I.; Forgetta, V.; Yang, T.P.; et al. An atlas of genetic influences on human blood metabolites. Nat. Genet. 2014, 46, 543–550. [Google Scholar] [CrossRef] [PubMed] [Green Version]
- Lemaitre, R.N.; Tanaka, T.; Tang, W.; Manichaikul, A.; Foy, M.; Kabagambe, E.K.; Nettleton, J.A.; King, I.B.; Weng, L.C.; Bhattacharya, S.; et al. Genetic loci associated with plasma phospholipid n-3 fatty acids: A meta-analysis of genome-wide association studies from the CHARGE Consortium. PLoS Genet. 2011, 7, e1002193. [Google Scholar] [CrossRef] [PubMed] [Green Version]
- Pattaro, C.; Teumer, A.; Gorski, M.; Chu, A.Y.; Li, M.; Mijatovic, V.; Garnaas, M.; Tin, A.; Sorice, R.; Li, Y.; et al. Genetic associations at 53 loci highlight cell types and biological pathways relevant for kidney function. Nat. Commun. 2016, 7, 10023. [Google Scholar] [CrossRef] [PubMed]
- Bowden, J.; Davey Smith, G.; Burgess, S. Mendelian randomization with invalid instruments: Effect estimation and bias detection through Egger regression. Int. J. Epidemiol. 2015, 44, 512–525. [Google Scholar] [CrossRef] [PubMed] [Green Version]
- Burgess, S.; Bowden, J.; Fall, T.; Ingelsson, E.; Thompson, S.G. Sensitivity Analyses for Robust Causal Inference from Mendelian Randomization Analyses with Multiple Genetic Variants. Epidemiology 2017, 28, 30–42. [Google Scholar] [CrossRef] [PubMed] [Green Version]
- Bowden, J.; Del Greco, M.F.; Minelli, C.; Davey Smith, G.; Sheehan, N.; Thompson, J. A framework for the investigation of pleiotropy in two-sample summary data Mendelian randomization. Stat. Med. 2017, 36, 1783–1802. [Google Scholar] [CrossRef] [PubMed] [Green Version]
- Thomas, G.; Sehgal, A.R.; Kashyap, S.R.; Srinivas, T.R.; Kirwan, J.P.; Navaneethan, S.D. Metabolic syndrome and kidney disease: A systematic review and meta-analysis. Clin. J. Am. Soc. Nephrol. 2011, 6, 2364–2373. [Google Scholar] [CrossRef] [PubMed] [Green Version]
- Rashidbeygi, E.; Safabakhsh, M.; Delshad Aghdam, S.; Mohammed, S.H.; Alizadeh, S. Metabolic syndrome and its components are related to a higher risk for albuminuria and proteinuria: Evidence from a meta-analysis on 10,603,067 subjects from 57 studies. Diabetes Metab. Syndr. 2019, 13, 830–843. [Google Scholar] [CrossRef] [PubMed]
- Di Daniele, N.; Noce, A.; Vidiri, M.F.; Moriconi, E.; Marrone, G.; Annicchiarico-Petruzzelli, M.; D’Urso, G.; Tesauro, M.; Rovella, V.; De Lorenzo, A. Impact of Mediterranean diet on metabolic syndrome, cancer and longevity. Oncotarget 2017, 8, 8947–8979. [Google Scholar] [CrossRef] [PubMed] [Green Version]
- Babio, N.; Toledo, E.; Estruch, R.; Ros, E.; Martinez-Gonzalez, M.A.; Castaner, O.; Bullo, M.; Corella, D.; Aros, F.; Gomez-Gracia, E.; et al. Mediterranean diets and metabolic syndrome status in the PREDIMED randomized trial. CMAJ 2014, 186, E649–E657. [Google Scholar] [CrossRef] [Green Version]
- Mach, F.; Baigent, C.; Catapano, A.L.; Koskinas, K.C.; Casula, M.; Badimon, L.; Chapman, M.J.; De Backer, G.G.; Delgado, V.; Ference, B.A.; et al. 2019 ESC/EAS Guidelines for the management of dyslipidaemias: Lipid modification to reduce cardiovascular risk: The Task Force for the management of dyslipidaemias of the European Society of Cardiology (ESC) and European Atherosclerosis Society (EAS). Eur. Heart J. 2019, 41, 111–188. [Google Scholar] [CrossRef]
- Mensink, R.P.; Zock, P.L.; Kester, A.D.; Katan, M.B. Effects of dietary fatty acids and carbohydrates on the ratio of serum total to HDL cholesterol and on serum lipids and apolipoproteins: A meta-analysis of 60 controlled trials. Am. J. Clin. Nutr. 2003, 77, 1146–1155. [Google Scholar] [CrossRef] [PubMed]
- Riserus, U.; Willett, W.C.; Hu, F.B. Dietary fats and prevention of type 2 diabetes. Prog. Lipid Res. 2009, 48, 44–51. [Google Scholar] [CrossRef] [Green Version]
- Mozaffarian, D. Dietary and Policy Priorities for Cardiovascular Disease, Diabetes, and Obesity: A Comprehensive Review. Circulation 2016, 133, 187–225. [Google Scholar] [CrossRef]
- Rasmussen, B.M.; Vessby, B.; Uusitupa, M.; Berglund, L.; Pedersen, E.; Riccardi, G.; Rivellese, A.A.; Tapsell, L.; Hermansen, K. Effects of dietary saturated, monounsaturated, and n-3 fatty acids on blood pressure in healthy subjects. Am. J. Clin. Nutr. 2006, 83, 221–226. [Google Scholar] [CrossRef]
- Farvid, M.S.; Ding, M.; Pan, A.; Sun, Q.; Chiuve, S.E.; Steffen, L.M.; Willett, W.C.; Hu, F.B. Dietary linoleic acid and risk of coronary heart disease: A systematic review and meta-analysis of prospective cohort studies. Circulation 2014, 130, 1568–1578. [Google Scholar] [CrossRef]
- Kielar, M.L.; Jeyarajah, D.R.; Zhou, X.J.; Lu, C.Y. Docosahexaenoic acid ameliorates murine ischemic acute renal failure and prevents increases in mRNA abundance for both TNF-alpha and inducible nitric oxide synthase. J. Am. Soc. Nephrol. 2003, 14, 389–396. [Google Scholar] [CrossRef] [Green Version]
- De Caterina, R.; Caprioli, R.; Giannessi, D.; Sicari, R.; Galli, C.; Lazzerini, G.; Bernini, W.; Carr, L.; Rindi, P. n-3 fatty acids reduce proteinuria in patients with chronic glomerular disease. Kidney Int. 1993, 44, 843–850. [Google Scholar] [CrossRef] [PubMed] [Green Version]
- Cicero, A.F.; Derosa, G.; Di Gregori, V.; Bove, M.; Gaddi, A.V.; Borghi, C. Omega 3 polyunsaturated fatty acids supplementation and blood pressure levels in hypertriglyceridemic patients with untreated normal-high blood pressure and with or without metabolic syndrome: A retrospective study. Clin. Exp. Hypertens 2010, 32, 137–144. [Google Scholar] [CrossRef] [PubMed]
- Svensson, M.; Schmidt, E.B.; Jorgensen, K.A.; Christensen, J.H. The effect of n-3 fatty acids on lipids and lipoproteins in patients treated with chronic haemodialysis: A randomized placebo-controlled intervention study. Nephrol. Dial. Transplant. 2008, 23, 2918–2924. [Google Scholar] [CrossRef] [PubMed] [Green Version]
- Abeywardena, M.Y.; Head, R.J. Longchain n-3 polyunsaturated fatty acids and blood vessel function. Cardiovasc. Res. 2001, 52, 361–371. [Google Scholar] [CrossRef]
- Smith, G.D.; Lawlor, D.A.; Harbord, R.; Timpson, N.; Day, I.; Ebrahim, S. Clustered environments and randomized genes: A fundamental distinction between conventional and genetic epidemiology. PLoS Med. 2007, 4, e352. [Google Scholar] [CrossRef] [PubMed] [Green Version]
- Medina-Remón, A.; Kirwan, R.; Lamuela-Raventós, R.M.; Estruch, R. Dietary patterns and the risk of obesity, type 2 diabetes mellitus, cardiovascular diseases, asthma, and neurodegenerative diseases. Crit. Rev. Food Sci. Nutr. 2018, 58, 262–296. [Google Scholar] [CrossRef] [PubMed]
- Ajjarapu, A.S.; Hinkle, S.N.; Li, M.; Francis, E.C.; Zhang, C. Dietary Patterns and Renal Health Outcomes in the General Population: A Review Focusing on Prospective Studies. Nutrients 2019, 11, 1877. [Google Scholar] [CrossRef] [Green Version]
- Hawkins, M.S.; Sevick, M.A.; Richardson, C.R.; Fried, L.F.; Arena, V.C.; Kriska, A.M. Association between physical activity and kidney function: National Health and Nutrition Examination Survey. Med. Sci. Sports Exerc. 2011, 43, 1457–1464. [Google Scholar] [CrossRef]
- Qi, L. Mendelian randomization in nutritional epidemiology. Nutr. Rev. 2009, 67, 439–450. [Google Scholar] [CrossRef] [PubMed] [Green Version]
- Hodson, L.; Skeaff, C.M.; Fielding, B.A. Fatty acid composition of adipose tissue and blood in humans and its use as a biomarker of dietary intake. Prog. Lipid Res. 2008, 47, 348–380. [Google Scholar] [CrossRef]
- Linseisen, J.; Welch, A.A.; Ocke, M.; Amiano, P.; Agnoli, C.; Ferrari, P.; Sonestedt, E.; Chajes, V.; Bueno-de-Mesquita, H.B.; Kaaks, R.; et al. Dietary fat intake in the European Prospective Investigation into Cancer and Nutrition: Results from the 24-h dietary recalls. Eur. J. Clin. Nutr. 2009, 63 (Suppl. S4), S61–S80. [Google Scholar] [CrossRef] [PubMed] [Green Version]
- Toledo, E.; Hu, F.B.; Estruch, R.; Buil-Cosiales, P.; Corella, D.; Salas-Salvado, J.; Covas, M.I.; Aros, F.; Gomez-Gracia, E.; Fiol, M.; et al. Effect of the Mediterranean diet on blood pressure in the PREDIMED trial: Results from a randomized controlled trial. BMC Med. 2013, 11, 207. [Google Scholar] [CrossRef] [PubMed] [Green Version]
- Alkhatib, A.; Tsang, C.; Tuomilehto, J. Olive Oil Nutraceuticals in the Prevention and Management of Diabetes: From Molecules to Lifestyle. Int. J. Mol. Sci. 2018, 19, 2024. [Google Scholar] [CrossRef] [PubMed] [Green Version]
- Degirolamo, C.; Rudel, L.L. Dietary monounsaturated fatty acids appear not to provide cardioprotection. Curr. Atheroscler. Rep. 2010, 12, 391–396. [Google Scholar] [CrossRef] [PubMed] [Green Version]
- Lopez, S.; Bermudez, B.; Montserrat-de la Paz, S.; Jaramillo, S.; Abia, R.; Muriana, F.J. Virgin Olive Oil and Hypertension. Curr. Vasc. Pharmacol. 2016, 14, 323–329. [Google Scholar] [CrossRef] [PubMed] [Green Version]
- Zong, G.; Li, Y.; Sampson, L.; Dougherty, L.W.; Willett, W.C.; Wanders, A.J.; Alssema, M.; Zock, P.L.; Hu, F.B.; Sun, Q. Monounsaturated fats from plant and animal sources in relation to risk of coronary heart disease among US men and women. Am. J. Clin. Nutr. 2018, 107, 445–453. [Google Scholar] [CrossRef] [PubMed]
- Huang, X.; Lindholm, B.; Stenvinkel, P.; Carrero, J.J. Dietary fat modification in patients with chronic kidney disease: N-3 fatty acids and beyond. J. Nephrol. 2013, 26, 960–974. [Google Scholar] [CrossRef]

| Characteristics | Overall | With CKD | Without CKD | p-Value | |
|---|---|---|---|---|---|
| Sex | Men (%) | 48.8 | 37.7 | 49.2 | <0.001 |
| Women (%) | 51.2 | 62.2 | 50.9 | ||
| Age (years), mean (± SEM) | 45.8 ± 0.1 | 69.1 ± 0.2 | 44.6 ± 0.2 | <0.001 | |
| Race/Ethnicity | White (non-Hispanic) (%) | 68.4 | 82.9 | 68.6 | <0.001 |
| Non-Hispanic Black (%) | 11.5 | 8.1 | 11.2 | ||
| Mexican-American (%) | 8.1 | 2.5 | 9.0 | ||
| Other Hispanic (%) | 5.2 | 3.0 | 5.4 | ||
| Body mass index (kg/m2) | 28.5 ± 0.1 | 29.1 ± 0.1 | 28.7 ± 0.1 | <0.001 | |
| Serum Triglycerides (mg/dL) | 155.8 ± 3.0 | 179.3 ± 3.9 | 152.3 ± 2.3 | <0.001 | |
| Serum Total cholesterol(mg/dL) | 196.6 ± 0.7 | 192.9 ± 1.0 | 196.5 ± 0.8 | 0.096 | |
| Serum High density lipoprotein (mg/dL) | 53.0 ± 0.5 | 53.2 ± 0.4 | 53.1 ± 0.2 | 0.483 | |
| Serum CRP (mg/dL) | 0.33 ± 0.03 | 0.55 ± 0.02 | 0.29 ± 0.01 | <0.001 | |
| Fasting blood glucose (mg/dL) | 99.3 ± 0.2 | 113.1 ± 0.8 | 97.6 ± 0.3 | <0.001 | |
| Hypertension (%) | 15.4 | 34.7 | 13.7 | <0.001 | |
| Diabetes (%) | 8.9 | 21.5 | 7.8 | <0.001 | |
| MUFA intake(gm/d) | 27.3 ± 0.6 | 25.6 ± 0.9 | 27.9 ± 0.6 | <0.001 | |
| PUFA intake(gm/d) | 15.6 ± 0.8 | 14.9 ± 1.1 | 16.1 ± 0.4 | <0.001 | |
| Variables | Quartiles of Monounsaturated Fatty Acid (MUFA) Consumption (gm) | Quartiles of Polyunsaturated Fatty Acid (PUFA) Consumption (gm) | ||||||||
| 1 | 2 | 3 | 4 | p-Value a | 1 | 2 | 3 | 4 | p-Value a | |
| Median (25th–75th) | 11.4 (8.4–14.0) | 20.9 (18.7–23.0) | 30.5 (27.6–33.5) | 47.1 (41.5–56.2) | 6.2 (4.4–7.7) | 11.7 (10.4–13.0) | 17.6 (16.0–19.6) | 28.8 (24.8–35.9) | ||
| Serum Creatinine (mg/dL) | 0.79 ± 0.001 | 0.81 ± 0.003 | 0.78 ± 0.001 | 0.81 ± 0.001 | 0.186 | 0.91 ± 0.03 | 0.83 ± 0.04 | 0.81 ± 0.05 | 0.76 ± 0.06 | <0.001 |
| Log Urea Albumin (ug/mL) | 2.16 ± 0.01 | 2.20 ± 0.02 | 2.19 ± 0.01 | 2.10 ± 0.01 | 0.415 | 2.23 ± 0.01 | 2.17 ± 0.03 | 2.08 ± 0.01 | 2.04 ± 0.02 | <0.001 |
| Glomerular filtration rate (mL/min/1.73 m²) | 84.5 ± 0.36 | 89.6 ± 0.30 | 85.4 ± 0.41 | 86.1 ± 0.37 | 0.359 | 86.3 ± 0.5 | 90.2 ± 0.5 | 91.4 ± 0.3 | 96.2 ± 0.5 | <0.001 |
| Log Albumin-Creatinine Ratio (mg/dL) | 2.10 ± 0.01 | 2.11 ± 0.01 | 2.10 ± 0.02 | 2.09 ± 0.01 | 0.635 | 2.17 ± 0.01 | 2.12 ± 0.03 | 2.11 ± 0.01 | 2.04 ± 0.02 | <0.001 |
| Likelihood of CKD with Different Models | ||||||
|---|---|---|---|---|---|---|
| Variables | Age, sex, race, poverty to income ratio | Age, sex, race, poverty to income ratio, alcohol intake, energy intake, smoking, physical activity, fasting blood glucose, systolic and diastolic blood pressure, HTN, and DM | Age, sex, race, poverty to income ratio, alcohol intake, energy intake, smoking, physical activity, fasting blood glucose, systolic and diastolic blood pressure, HTN, DM, TG and HDL, and CRP | |||
| Odds Ratio | Lower Bound- Upper Bound | Odds Ratio | Lower Bound- Upper Bound | Odds Ratio | Lower Bound- Upper Bound | |
| MUFA (Q2) | 1.06 | (0.62–1.49 | 0.85 | (0.61–1.17) | 0.76 | (0.55–1.09) |
| MUFA (Q3) | 1.10 | (0.58–2.13) | 0.96 | (0.40–2.13) | 0.88 | (0.35–2.61) |
| MUFA (Q4) | 0.98 | (0.50–1.90) | 1.02 | (0.29–3.96) | 0.96 | (0.40–2.13) |
| PUFA (Q2) | 1.01 | (0.69–1.43) | 1.02 | (0.76–1.28) | 0.97 | (0.78–1.20) |
| PUFA (Q3) | 0.76 | (0.69–0.83) | 0.81 | (0.78–0.86) | 0.85 | (0.61–1.17) |
| PUFA (Q4) | 0.60 | (0.40–0.81) | 0.73 | (0.65–0.84) | 0.79 | (0.68–0.88) |
Publisher’s Note: MDPI stays neutral with regard to jurisdictional claims in published maps and institutional affiliations. |
© 2022 by the authors. Licensee MDPI, Basel, Switzerland. This article is an open access article distributed under the terms and conditions of the Creative Commons Attribution (CC BY) license (https://creativecommons.org/licenses/by/4.0/).
Share and Cite
Mazidi, M.; Kengne, A.P.; Siervo, M.; Kirwan, R. Association of Dietary Intakes and Genetically Determined Serum Concentrations of Mono and Poly Unsaturated Fatty Acids on Chronic Kidney Disease: Insights from Dietary Analysis and Mendelian Randomization. Nutrients 2022, 14, 1231. https://doi.org/10.3390/nu14061231
Mazidi M, Kengne AP, Siervo M, Kirwan R. Association of Dietary Intakes and Genetically Determined Serum Concentrations of Mono and Poly Unsaturated Fatty Acids on Chronic Kidney Disease: Insights from Dietary Analysis and Mendelian Randomization. Nutrients. 2022; 14(6):1231. https://doi.org/10.3390/nu14061231
Chicago/Turabian StyleMazidi, Mohsen, Andre P. Kengne, Mario Siervo, and Richard Kirwan. 2022. "Association of Dietary Intakes and Genetically Determined Serum Concentrations of Mono and Poly Unsaturated Fatty Acids on Chronic Kidney Disease: Insights from Dietary Analysis and Mendelian Randomization" Nutrients 14, no. 6: 1231. https://doi.org/10.3390/nu14061231
APA StyleMazidi, M., Kengne, A. P., Siervo, M., & Kirwan, R. (2022). Association of Dietary Intakes and Genetically Determined Serum Concentrations of Mono and Poly Unsaturated Fatty Acids on Chronic Kidney Disease: Insights from Dietary Analysis and Mendelian Randomization. Nutrients, 14(6), 1231. https://doi.org/10.3390/nu14061231