
Compliance with Gluten Free Diet Is Associated with Better Quality of Life in Celiac Disease

 , ,
, ,
Abstract
:1. Introduction
2. Materials and Methods
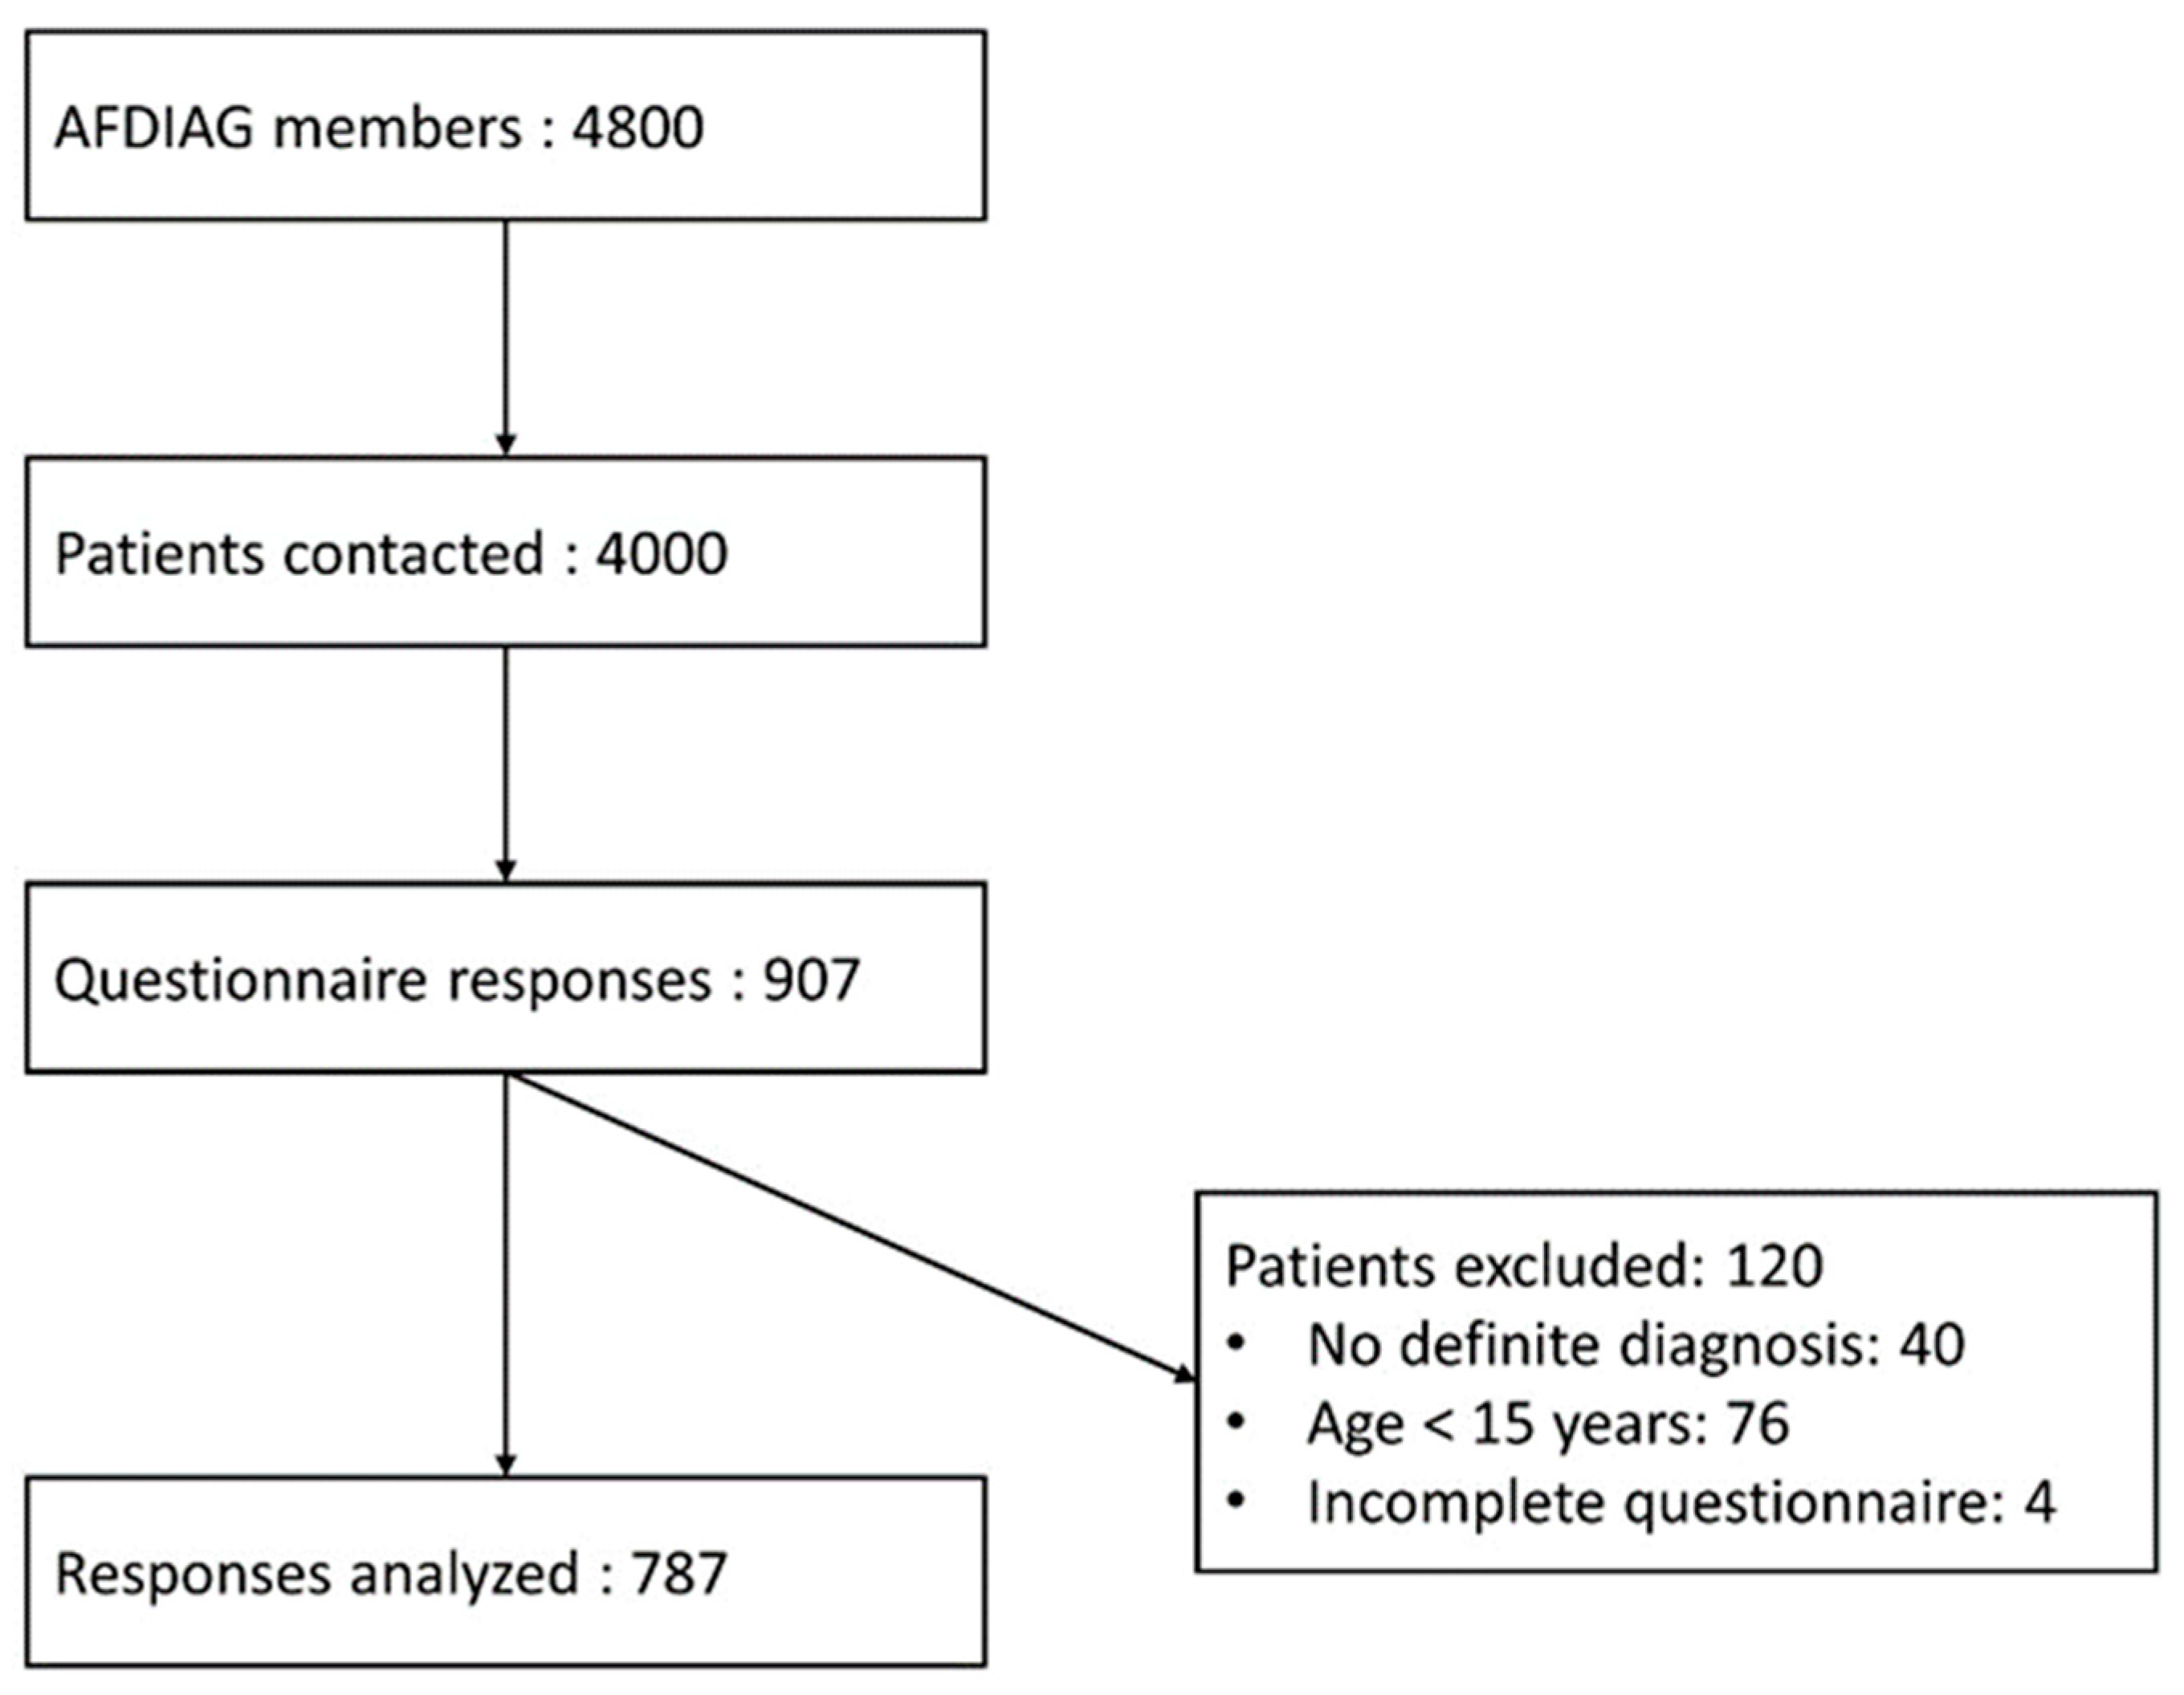
2.1. Study Design and Patients
2.2. Questionnaires
2.3. Analysis
3. Results
3.1. Patient Characteristics and QOL
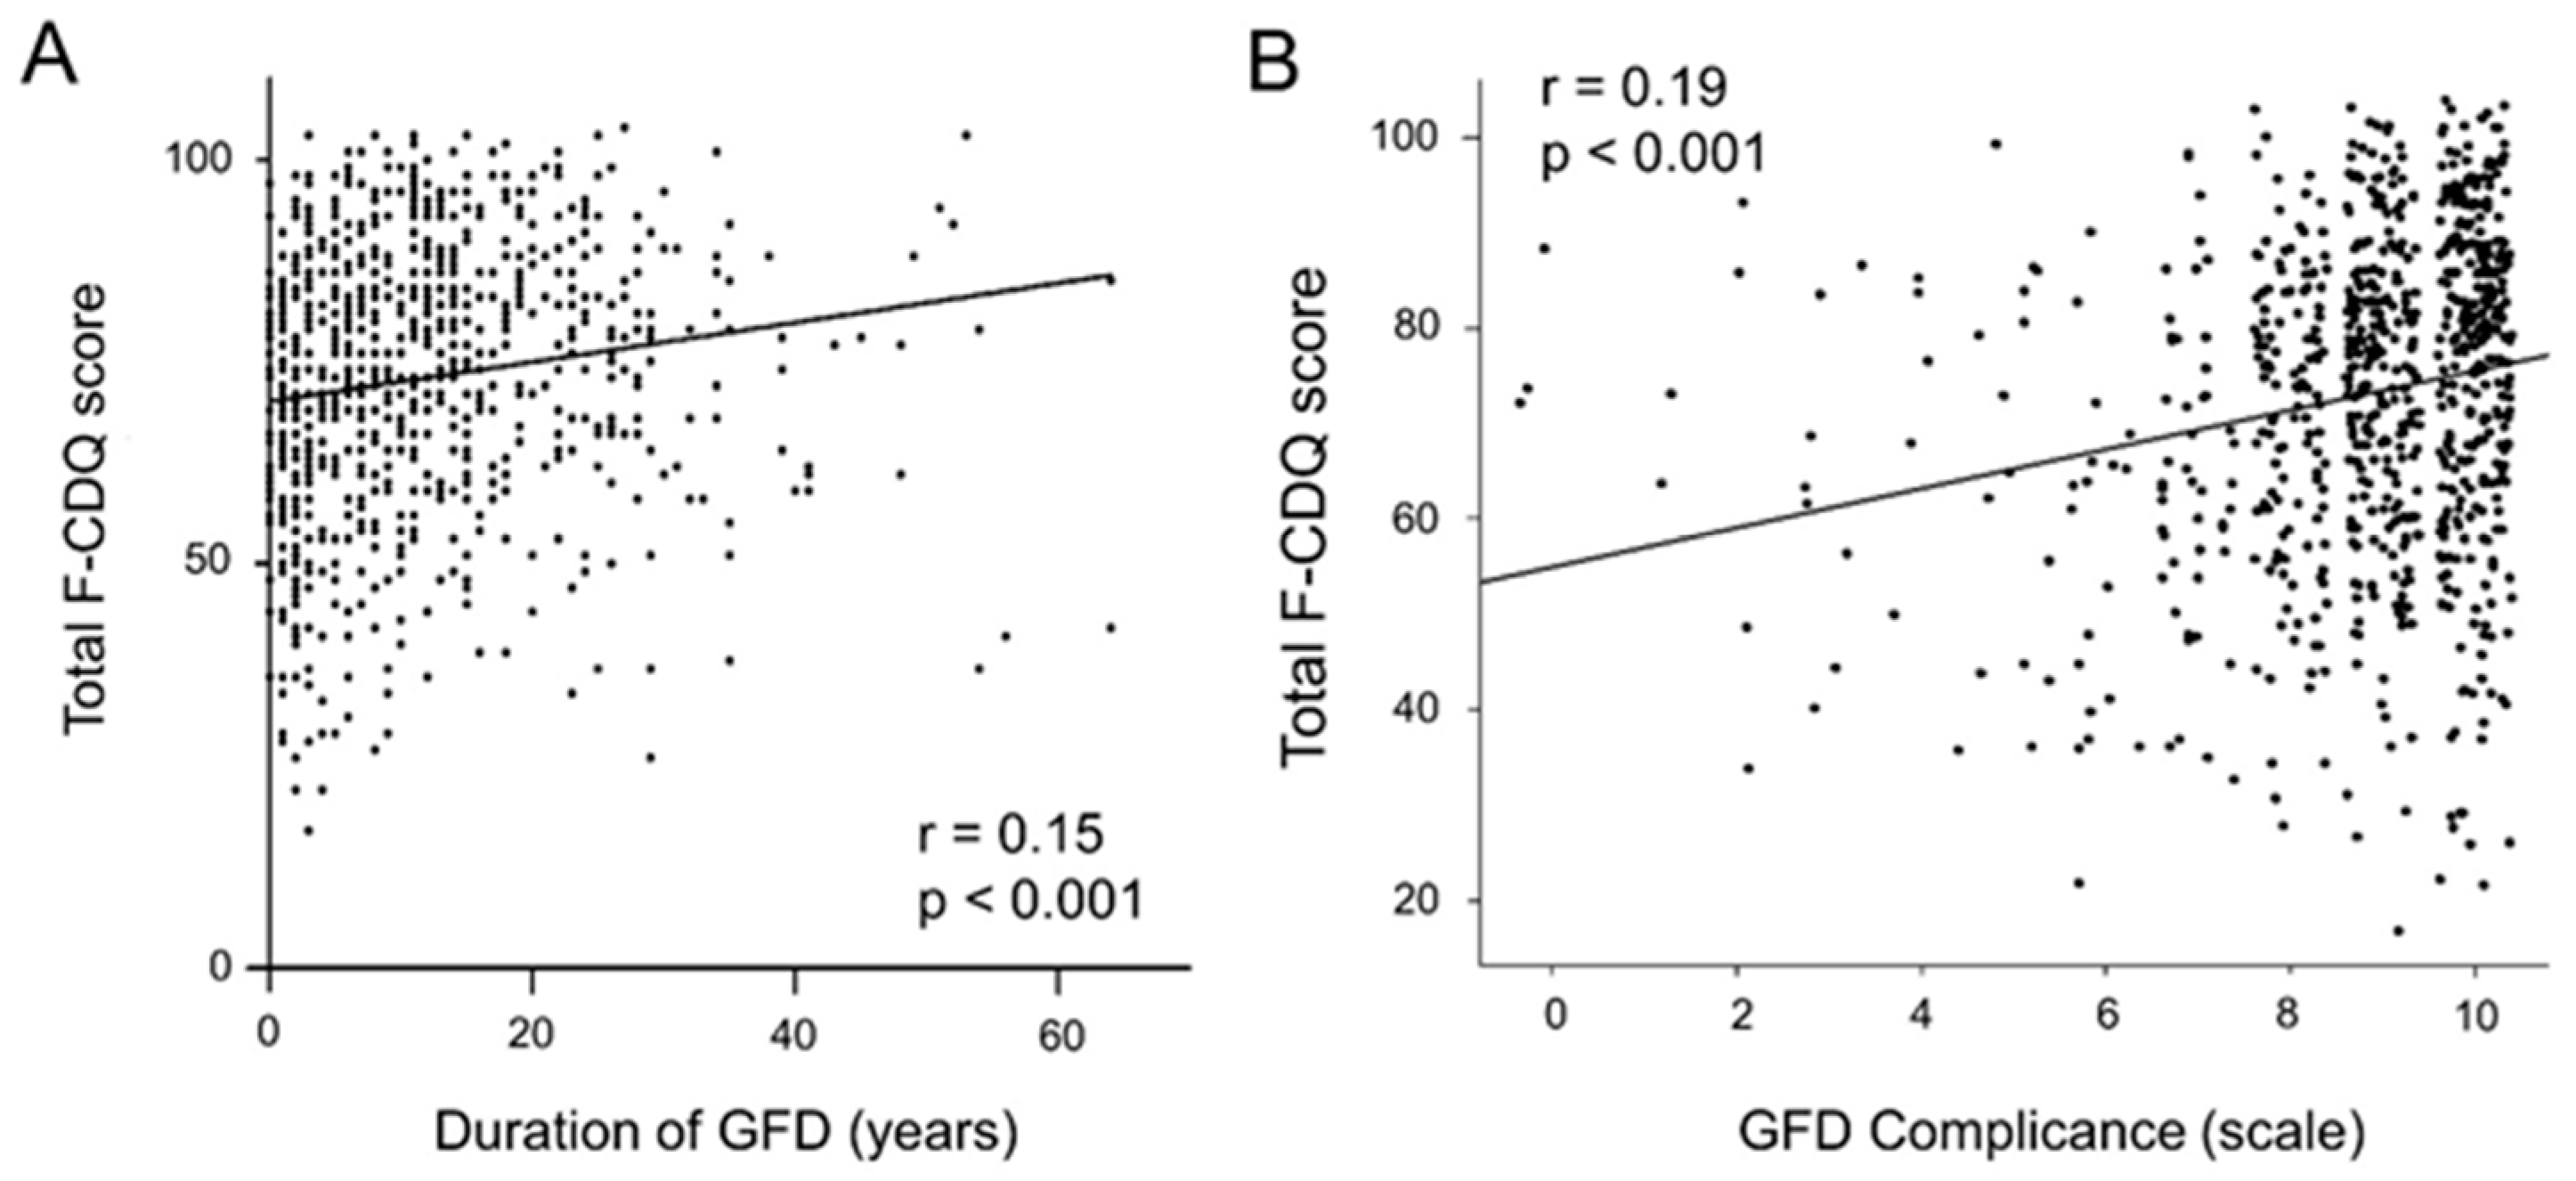
3.2. Correlation between Patient and Disease Characteristics and Total F-CDQ Score
3.3. Correlation between Patient or Disease Characteristics and Subdomains of F-CDQ Score
3.4. Multivariate Analysis of Factors Associated with QOL of CD Patients
3.5. Factors Related to GFD Compliance
4. Discussion
5. Conclusions
Author Contributions
Funding
Informed Consent Statement
Data Availability Statement
Acknowledgments
Conflicts of Interest
References
- James, S.P. National Institutes of Health Consensus Development Conference Statement on Celiac Disease, June 28–30, 2004. Gastroenterology 2005, 128, S1–S9. [Google Scholar] [CrossRef] [PubMed]
- Lebwohl, B.; Rubio-Tapia, A. Epidemiology, Presentation, and Diagnosis of Celiac Disease. Gastroenterology 2021, 160, 63–75. [Google Scholar] [CrossRef] [PubMed]
- Aziz, I.; Evans, K.E.; Papageorgiou, V.; Sanders, D.S. Are patients with coeliac disease seeking alternative therapies to a gluten-free diet? J. Gastrointest. Liver Dis. 2011, 20, 27–31. [Google Scholar] [CrossRef]
- Shah, S.; Akbari, M.; Vanga, R.; Kelly, C.P.; Hansen, J.; Theethira, T.; Tariq, S.; Dennis, M.; Leffler, D.A. Patient perception of treatment burden is high in celiac disease compared with other common conditions. Am. J. Gastroenterol. 2014, 109, 1304–1311. [Google Scholar] [CrossRef] [PubMed] [Green Version]
- Felce, D.; Perry, J. Quality of life: Its definition and measurement. Res. Dev. Disabil. 1995, 16, 51–74. [Google Scholar] [CrossRef]
- Eisen, G.M.; Locke, G.R.; Provenzale, D. Health-related quality of life: A primer for gastroenterologists. Am. J. Gastroenterol. 1999, 94, 2017–2021. [Google Scholar] [CrossRef]
- Al-Toma, A.; Volta, U.; Auricchio, R.; Castillejo, G.; Sanders, D.S.; Cellier, C.; Mulder, C.J.; Lundin, K.E. European Society for the Study of Coeliac Disease (ESsCD) guideline for coeliac disease and other gluten-related disorders. United Eur. Gastroenterol. J. 2019, 7, 583–613. [Google Scholar] [CrossRef] [PubMed]
- Häuser, W.; Gold, J.; Stein, J.; Caspary, W.F.; Stallmach, A. Health-related quality of life in adult coeliac disease in Germany: Results of a national survey. Eur. J. Gastroenterol. Hepatol. 2006, 18, 747–754. [Google Scholar] [CrossRef] [PubMed]
- Häuser, W.; Stallmach, A.; Caspary, W.F.; Stein, J. Predictors of reduced health-related quality of life in adults with coeliac disease. Aliment. Pharmacol. Ther. 2007, 25, 569–578. [Google Scholar] [CrossRef]
- Van de Water, J.M.W.; Mulder, C.J.J. Celiac disease: Assessment of quality of life. Nat. Rev. Gastroenterol. Hepatol. 2009, 6, 204–205. [Google Scholar] [CrossRef] [PubMed]
- Kurppa, K.; Collin, P.; Mäki, M.; Kaukinen, K. Celiac disease and health-related quality of life. Expert Rev. Gastroenterol. Hepatol. 2011, 5, 83–90. [Google Scholar] [CrossRef] [PubMed]
- Jenaro, C.; Verdugo, M.A.; Caballo, C.; Balboni, G.; Lachapelle, Y.; Otrebski, W.; Schalock, R.L. Cross-cultural study of person-centred quality of life domains and indicators: A replication. J. Intellect. Disabil. Res. 2005, 49, 734–739. [Google Scholar] [CrossRef] [PubMed]
- Pouchot, J.; Despujol, C.; Malamut, G.; Ecosse, E.; Coste, J.; Cellier, C. Validation of a French Version of the Quality of Life “Celiac Disease Questionnaire”. PLoS ONE 2014, 9, e96346. [Google Scholar] [CrossRef] [PubMed] [Green Version]
- Häuser, W.; Gold, J.; Stallmach, A.; Caspary, W.F.; Stein, J. Development and validation of the Celiac Disease Questionnaire (CDQ), a disease-specific health-related quality of life measure for adult patients with celiac disease. J. Clin. Gastroenterol. 2007, 41, 157–166. [Google Scholar] [CrossRef] [PubMed]
- Tibshirani, R. Regression Shrinkage and Selection via the Lasso. J. R. Stat. Soc. Ser. B (Methodol.) 1996, 58, 267–288. [Google Scholar] [CrossRef]
- Violato, M.; Gray, A. The impact of diagnosis on health-related quality of life in people with coeliac disease: A UK population-based longitudinal perspective. BMC Gastroenterol. 2019, 19, 68. [Google Scholar] [CrossRef] [PubMed]
- Marsilio, I.; Canova, C.; D’Odorico, A.; Ghisa, M.; Zingone, L.; Lorenzon, G.; Savarino, E.V.; Zingone, F. Quality-of-Life Evaluation in Coeliac Patients on a Gluten-Free Diet. Nutrients 2020, 12, 2981. [Google Scholar] [CrossRef] [PubMed]
- King, J.A.; Jeong, J.; Underwood, F.E.; Quan, J.; Panaccione, N.; Windsor, J.W.; Coward, S.; deBruyn, J.; Ronksley, P.E.; Shaheen, A.A.; et al. Incidence of Celiac Disease Is Increasing Over Time: A Systematic Review and Meta-analysis. Am. J. Gastroenterol. 2020, 115, 507–525. [Google Scholar] [CrossRef] [PubMed]
- Katz, K.D.; Rashtak, S.; Lahr, B.D.; Melton, L.J., III; Krause, P.K.; Maggi, K.; Talley, N.J.; Murray, J.A. Screening for celiac disease in a North American population: Sequential serology and gastrointestinal symptoms. Am. J. Gastroenterol. 2011, 106, 1333–1339. [Google Scholar] [CrossRef] [PubMed] [Green Version]
- Lebwohl, B.; Tennyson, C.A.; Holub, J.L.; Lieberman, D.A.; Neugut, A.I.; Green, P.H. Sex and racial disparities in duodenal biopsy to evaluate for celiac disease. Gastrointest. Endosc. 2012, 76, 779–785. [Google Scholar] [CrossRef] [PubMed] [Green Version]
- Selleski, N.; Zandonadi, R.P.; Milde, L.B.; Gandolfi, L.; Pratesi, R.; Häuser, W.; Uenishi, R.H.; Nakano, E.Y.; Pratesi, C.B. Evaluation of Quality of Life of Adult Patients with Celiac Disease in Argentina: From Questionnaire Validation to Assessment. Int. J. Environ. Res. Public Health 2020, 17, 7051. [Google Scholar] [CrossRef]
- Harnett, J.E.; Myers, S.P. Quality of life in people with ongoing symptoms of coeliac disease despite adherence to a strict gluten-free diet. Sci. Rep. 2020, 10, 1144. [Google Scholar] [CrossRef] [Green Version]
- Oka, P.; Parr, H.; Barberio, B.; Black, C.J.; Savarino, E.V.; Ford, A.C. Global prevalence of irritable bowel syndrome according to Rome III or IV criteria: A systematic review and meta-analysis. Lancet Gastroenterol. Hepatol. 2020, 5, 908–917. [Google Scholar] [CrossRef]
- Cossu, G.; Carta, M.G.; Contu, F.; Mela, Q.; Demelia, L.; Elli, L.; Dell’Osso, B. Coeliac disease and psychiatric comorbidity: Epidemiology, pathophysiological mechanisms, quality-of-life, and gluten-free diet effects. Int. Rev. Psychiatry 2017, 29, 489–503. [Google Scholar] [CrossRef]
- Fera, T.; Cascio, B.; Angelini, G.; Martini, S.; Guidetti, C.S. Affective disorders and quality of life in adult coeliac disease patients on a gluten-free diet. Eur. J. Gastroenterol. Hepatol. 2003, 15, 1287–1292. [Google Scholar] [CrossRef] [PubMed]
- Zarkadas, M.; Cranney, A.; Case, S.; Molloy, M.; Switzer, C.; Graham, I.D.; Butzner, J.D.; Rashid, M.; Warren, R.E.; Burrows, V. The impact of a gluten-free diet on adults with coeliac disease: Results of a national survey. J. Hum. Nutr. Diet 2006, 19, 41–49. [Google Scholar] [CrossRef] [PubMed]
- Cranney, A.; Zarkadas, M.; Graham, I.D.; Butzner, J.D.; Rashid, M.; Warren, R.; Molloy, M.; Case, S.; Burrows, V.; Switzer, C. The Canadian Celiac Health Survey. Dig. Dis. Sci. 2007, 52, 1087–1095. [Google Scholar] [CrossRef]
- Roos, S.; Kärner, A.; Hallert, C. Psychological well-being of adult coeliac patients treated for 10 years. Dig. Liver Dis. 2006, 38, 177–180. [Google Scholar] [CrossRef]
- Tontini, G.E.; Rondonotti, E.; Saladino, V.; Saibeni, S.; De Franchis, R.; Vecchi, M. Impact of gluten withdrawal on health-related quality of life in celiac subjects: An observational case-control study. Digestion 2010, 82, 221–228. [Google Scholar] [CrossRef]
- Nachman, F.; del Campo, M.P.; González, A.; Corzo, L.; Vázquez, H.; Sfoggia, C.; Smecuol, E.; Sánchez, M.I.; Niveloni, S.; Sugai, E.; et al. Long-term deterioration of quality of life in adult patients with celiac disease is associated with treatment noncompliance. Dig. Liver Dis. 2010, 42, 685–691. [Google Scholar] [CrossRef]
- Borghini, R.; Di Tola, M.; Salvi, E.; Isonne, C.; Puzzono, M.; Marino, M.; Donato, G.; Picarelli, A. Impact of gluten-free diet on quality of life in celiac patients. Acta Gastroenterol. Belg. 2016, 79, 447–453. [Google Scholar] [PubMed]
- Wagner, G.; Berger, G.; Sinnreich, U.; Grylli, V.; Schober, E.; Huber, W.D.; Karwautz, A. Quality of life in adolescents with treated coeliac disease: Influence of compliance and age at diagnosis. J. Pediatr. Gastroenterol. Nutr. 2008, 47, 555–561. [Google Scholar] [CrossRef] [PubMed]
- Zauli, D.; Grassi, A.; Granito, A.; Foderaro, S.; De Franceschi, L.; Ballardini, G.; Bianchi, F.B.; Volta, U. Prevalence of silent coeliac disease in atopics. Dig. Liver Dis. 2000, 32, 775–779. [Google Scholar] [CrossRef]
- Cervio, E.; Volta, U.; Verri, M.; Boschi, F.; Pastoris, O.; Granito, A.; Barbara, G.; Parisi, C.; Felicani, C.; Tonini, M.; et al. Sera of patients with celiac disease and neurologic disorders evoke a mitochondrial-dependent apoptosis in vitro. Gastroenterology 2007, 133, 195–206. [Google Scholar] [CrossRef] [PubMed]
- Volta, U.; De Giorgio, R.; Granito, A.; Stanghellini, V.; Barbara, G.; Avoni, P.; Liguori, R.; Petrolini, N.; Fiorini, E.; Montagna, P.; et al. Anti-ganglioside antibodies in coeliac disease with neurological disorders. Dig. Liver Dis. 2006, 38, 183–187. [Google Scholar] [CrossRef] [PubMed]
- Pengiran Tengah, D.S.N.A.; Wills, A.J.; Holmes, G.K.T. Neurological complications of coeliac disease. Postgrad. Med. J. 2002, 78, 393–398. [Google Scholar] [CrossRef] [PubMed]
- Casellas, F.; Rodrigo, L.; Vivancos, J.L.; Riestra, S.; Pantiga, C.; Baudet, J.S.; Junquera, F.; Diví, V.P.; Abadia, C.; Papo, M.; et al. Factors that impact health-related quality of life in adults with celiac disease: A multicenter study. World J. Gastroenterol. 2008, 14, 46–52. [Google Scholar] [CrossRef] [PubMed] [Green Version]
- Hallert, C.; Sandlund, O.; Broqvist, M. Perceptions of health-related quality of life of men and women living with coeliac disease. Scand J. Caring Sci. 2003, 17, 301–307. [Google Scholar] [CrossRef] [PubMed]
- Barratt, S.M.; Leeds, J.S.; Sanders, D.S. Quality of life in Coeliac Disease is determined by perceived degree of difficulty adhering to a gluten-free diet, not the level of dietary adherence ultimately achieved. J. Gastrointest. Liver Dis. 2011, 20, 241–245. [Google Scholar]

| Patients | n (%) or Median [IQR] |
|---|---|
| Sociodemographic characteristics | |
| Age (years) | 49 [36; 60] |
| Female | 638 (81%) |
| Lifestyle | |
| Urban | 476 (60%) |
| Rural | 312 (40%) |
| Socio-professional category | |
| Employee | 222 (28%) |
| Executive | 178 (23%) |
| Retired | 173 (22%) |
| Intermediate profession | 59 (8%) |
| Student | 56 (7%) |
| No activity | 47 (6%) |
| Self-employed worker | 36 (5%) |
| Worker | 12 (2%) |
| Farmer | 4 (1%) |
| Characteristics related to celiac disease | |
| Age at diagnosis (years) | 38 [25; 47] |
| Mode of diagnosis | |
| Biopsies | 236 (30%) |
| Antibodies | 34 (4%) |
| Both | 517 (66%) |
| Family history of celiac disease | 127 (16%) |
| Frequency of follow-up | |
| >1 visit per year | 164 (21%) |
| 1 visit per year | 333 (42%) |
| <1 visit per year | 217 (28%) |
| Never | 73 (9%) |
| Duration of the gluten-free diet (years) | 10 [3; 16] |
| Gluten-free diet compliance in the past 6 months | |
| VAS ≤ 5/10 | 37 (5%) |
| 6 ≤ VAS ≤ 8/10 | 194 (25%) |
| VAS ≥ 9/10 | 556 (71%) |
| n (%) | |
|---|---|
| Purchase of specifically labeled gluten-free products | 716 (91%) |
| Purchase of gluten-free products on the internet | 229 (29%) |
| Purchase of gluten-free products in organic stores | 584 (74%) |
| Purchase of gluten-free products at the supermarket | 632 (80%) |
| Gluten-free substitutes liked | |
| Yes | 330 (42%) |
| Moderately | 419 (53%) |
| No | 38 (5%) |
| Use of restaurants/bakeries that offer only gluten-free products | 200 (25%) |
| Trust in restaurants offering gluten-free and gluten-containing products | 478 (61%) |
| Trust in bakeries offering gluten-free and gluten-containing products | 140 (18%) |
| Pearson’s r (IC 95%) or Mean (± SD) | p-Value | ||
|---|---|---|---|
| Sociodemographic characteristics | |||
| Age (years) | 0.04 (−0.03; 0.10) | 0.31 | |
| Gender | Female | 71.9 (±17.2) | <0.001 |
| Male | 77.2 (±16.3) | - | |
| Lifestyle | Urban | 72.6 (±16.9) | 0.55 |
| Rural | 73.4 (±17.4) | - | |
| Socio-professional category | Employee | 70.8 (±17.9) | 0.017 |
| Executive | 74.1 (±16.4) | - | |
| Retired | 75.4 (±15.6) | - | |
| Intermediate profession | 74.7 (±13.5) | - | |
| Student | 77.2 (±15.7) | - | |
| No activity | 64.4 (±21.9) | - | |
| Self-employer worker | 69.9 (±18.0) | - | |
| Worker | 73.2 (±20.1) | - | |
| Farmer | 64.7 (±13.3) | - | |
| Characteristics related to celiac disease | |||
| Age at diagnosis | −0.06 (−0.13; 0.01) | 0.08 | |
| Family History | Yes | 71.9 (±15.8) | 0.46 |
| No | 73.1 (±17.4) | - | |
| Follow-up frequency | >1 visit per year | 67.0 (±17.5) | <0.001 |
| 1 visit per year | 72.9 (±17.2) | - | |
| <1 visit per year | 76.1 (±15.4) | - | |
| Never | 76.8 (±17.2) | - | |
| Gluten-free diet | |||
| Duration of GFD | 0.15 (0.08; 0.21) | <0.001 | |
| Gluten-free diet compliance | VAS ≤ 5/10 | 67.0 (±18.4) | <0.001 |
| 6 ≤ VAS ≤ 8/10 | 67.9 (±16.6) | - | |
| VAS ≥ 9/10 | 75.1 (±16.7) | - | |
| Gluten-free substitutes liked | Yes | 76.2 (±16.9) | <0.001 |
| Moderately | 71.3 (±16.6) | - | |
| No | 61.5 (±17.7) | - | |
| GFD-specific restaurant/bakeries | No | 73.0 (±17.2) | 0.78 |
| Yes | 72.6 (±16.8) | - | |
| Trust in GFD-non-specific restaurants | Yes | 76.2 (±16.1) | <0.001 |
| No | 67.9 (±17.5) | - | |
| Trust in GFD-non-specific bakeries | Yes | 78.5 (±15.6) | <0.001 |
| No | 71.7 (±17.2) | - | |
| Gastrointestinal Symptoms | p-Value | Social | p-Value | Emotions | p-Value | Worries | p-Value | ||
|---|---|---|---|---|---|---|---|---|---|
| Age (years) | −0.09 (−0.16; −0.02) | <0.01 | 0.11 (0.04; 0.18) | <0.01 | 0.02 (−0.05; 0.09) | 0.57 | 0.07 (0.004; 0.14) | 0.037 | |
| Gender | Female | 75.2 (±19.7) | 0.016 | 81.2 (±20.4) | 0.069 | 61.3 (±21.3) | <0.001 | 69.9 (±21.4) | 0.021 |
| Male | 79.3 (±18.2) | - | 84.5 (±20.1) | - | 70.6 (±20.5) | - | 74.3 (±20.2) | - | |
| Socio-professional category | Employee | 74.1 (±20.2) | <0.01 | 79.6 (±21.4) | <0.01 | 60.8 (±22.0) | 0.019 | 68.9 (±20.7) | <0.01 |
| Executive | 79.1 (±19.1) | - | 82.0 (±20.1) | - | 64.1 (±20.8) | - | 71.1 (±21.2) | - | |
| Retired | 73.6 (±19.1) | - | 87.6 (±15.9) | - | 66.6 (±21.0) | - | 73.9 (±20.9) | - | |
| Intermediate profession | 82.0 (±15.9) | - | 81.7 (±18.3) | - | 62.0 (±20.2) | - | 73.1 (±16.4) | - | |
| Student | 79.6 (±18.4) | - | 85.1 (±17.1) | - | 68.1 (±19.6) | - | 76.0 (±19.4) | - | |
| No activity | 69.5 (±22.6) | - | 71.4 (±26.7) | - | 54.4 (±24.1) | - | 62.3 (±25.4) | - | |
| Self-employer worker | 74.7 (±17.5) | - | 78.7 (±23.1) | - | 61.3 (±19.2) | - | 65.0 (±25.2) | - | |
| Worker | 80.6 (±17.6) | - | 76.9 (±27.7) | - | 59.4 (±26.5) | - | 75.8 (±21.3) | - | |
| Farmer | 83.1 (±22.1) | - | 66.9 (±17.1) | - | 56.2 (±17.9) | - | 52.5 (±12.4) | - | |
| Age at diagnosis | −0.09 (−0.16; −0.02) | 0.01 | −0.02 (−0.09; 0.04) | 0.48 | −0.04(−0.11; 0.03) | 0.3 | −0.06 (−0.13; 0.01) | 0.10 | |
| Follow-up frequency | >1 visit per year | 70.6 (±21.8) | <0.001 | 75.9 (±21.3) | <0.001 | 56.7 (±20.9) | <0.001 | 64.9 (±21.0) | <0.001 |
| 1 visit per year | 76.2 (±19.0) | - | 81.6 (±20.7) | - | 63.4 (±22.2) | - | 70.3 (±20.7) | - | |
| <1 visit per year | 78.5 (±18.0) | - | 85.3 (±17.8) | - | 66.3 (±19.8) | - | 74.2 (±20.9) | - | |
| Never | 79.8 (±17.8) | - | 86.0 (±21.2) | - | 66.0 (±21.4) | - | 75.7 (±22.4) | - | |
| Duration of GFD | −0.003 (−0.07; 0.07) | 0.91 | 0.20 (0.14; 0.27) | <0.001 | 0.09 (0.02; 0.16) | 0.15 | 0.57 (0.52; 0.61) | <0.001 | |
| GFD compliance (+0.1) | 0.18 (0.11; 0.25) | <0.001 | 0.11 (0.04; 0.18) | <0.001 | 0.21 (0.14; 0.28) | <0.001 | 0.13 (0.06; 0.20) | <0.001 | |
| Gluten-free substitutes liked | Yes | 78.0 (±19.8) | <0.01 | 85.4 (±19.4) | <0.001 | 66.3 (±21.4) | <0.001 | 75.3 (±20.6) | <0.001 |
| Moderately | 75.3 (±18.8) | - | 80.2 (±20.0) | - | 61.3 (±20.8) | - | 68.5 (±20.7) | - | |
| No | 67.2 (±21.9) | - | 68.4 (±24.8) | - | 53.8 (±23.7) | - | 56.6 (±22.4) | - | |
| Trust in GFD-non-specific restaurants | Yes | 78.1 (±18.7) | <0.001 | 85.9 (±18.8) | <0.001 | 66.1 (±20.8) | <0.001 | 74.5 (±19.7) | <0.001 |
| No | 72.7 (±20.2) | - | 75.5 (±21.1) | - | 58.3 (±21.5) | - | 65.0 (±22.2) | - | |
| Trust in GFD-non-specific bakeries | Yes | 80.0 (±19.2) | <0.001 | 89.3 (±16.8) | <0.001 | 68.2 (±20.2) | <0.001 | 76.6 (±19.4) | <0.001 |
| No | 75.1 (±19.5) | - | 80.2 (±20.7) | - | 61.9 (±21.6) | - | 69.5 (±21.4) | - | |
| Coefficients (95%CI) | p-Value | Global p-Value | ||
|---|---|---|---|---|
| Age (years) | −0.01 (−0.13; 0.10) | 0.81 | 0.81 | |
| Gender | Male vs. Female | 4.06 (1.22; 6.91) | <0.01 | <0.01 |
| Family History | Yes vs. No | −1.16 (−4.14; 1.82) | 0.44 | 0.44 |
| Socio-professional category | Executive vs. Employee | 2.91 (−0.170; 5.99) | 0.064 | 0.054 |
| Retired vs. Employee | 2.14 (−1.95; 6.24) | 0.3 | - | |
| Intermediate profession vs. Employee | 3.24 (−1.27; 7.75) | 0.16 | - | |
| Student vs. Employee | 4.10 (−1.38; 9.58) | 0.14 | - | |
| No activity vs. Employee | −5.38 (−10.3; −0.47) | 0.032 | - | |
| Self-employer worker vs. Employee | 0.549 (−4.99; 6.09) | 0.85 | - | |
| Worker vs. Employee | 0.504 (−8.69; 9.70) | 0.91 | - | |
| Farmer vs. Employee | −2.77 (−18.2; 12.7) | 0.72 | - | |
| Follow-up visits | <1 visit/y vs. 1 visit/y | 3.44 (0.74; 6.15) | 0.013 | <0.001 |
| >1 visit/y vs. 1 visit/y | −4.35 (−7.29; −1.41) | <0.01 | - | |
| Never vs. 1 visit/y | 4.69 (0.69; 8.69) | 0.021 | - | |
| Duration of GFD (years) | 0.12 (0.003; 0.230) | 0.044 | 0.044 | |
| GFD compliance (+0.1) | 0.21 (0.14; 0.28) | <0.001 | <0.001 | |
| Gluten-free restaurant | Yes vs. No | −1.35 (−3.94; 1.23) | 0.3 | 0.3 |
| Gluten-free substitutes liked | Yes vs. Moderately | 4.05 (1.75; 6.35) | <0.001 | <0.001 |
| No vs. Moderately | −5.85 (−11.1; −0.59) | 0.029 | - | |
| Trust in GFD-non-specific restaurants | Yes vs. No | 5.73 (3.36; 8.09) | <0.001 | <0.001 |
| Trust in GFD-non-specific bakeries | Yes vs. No | 4.54 (1.53; 7.56) | <0.01 | <0.01 |
Publisher’s Note: MDPI stays neutral with regard to jurisdictional claims in published maps and institutional affiliations. |
© 2022 by the authors. Licensee MDPI, Basel, Switzerland. This article is an open access article distributed under the terms and conditions of the Creative Commons Attribution (CC BY) license (https://creativecommons.org/licenses/by/4.0/).
Share and Cite
Enaud, R.; Tetard, C.; Dupuis, R.; Laharie, D.; Lamireau, T.; Zerbib, F.; Rivière, P.; Shili-Mismoudi, S.; Poullenot, F. Compliance with Gluten Free Diet Is Associated with Better Quality of Life in Celiac Disease. Nutrients 2022, 14, 1210. https://doi.org/10.3390/nu14061210
Enaud R, Tetard C, Dupuis R, Laharie D, Lamireau T, Zerbib F, Rivière P, Shili-Mismoudi S, Poullenot F. Compliance with Gluten Free Diet Is Associated with Better Quality of Life in Celiac Disease. Nutrients. 2022; 14(6):1210. https://doi.org/10.3390/nu14061210
Chicago/Turabian StyleEnaud, Raphaël, Candice Tetard, Raphaël Dupuis, David Laharie, Thierry Lamireau, Frank Zerbib, Pauline Rivière, Sarah Shili-Mismoudi, and Florian Poullenot. 2022. "Compliance with Gluten Free Diet Is Associated with Better Quality of Life in Celiac Disease" Nutrients 14, no. 6: 1210. https://doi.org/10.3390/nu14061210
APA StyleEnaud, R., Tetard, C., Dupuis, R., Laharie, D., Lamireau, T., Zerbib, F., Rivière, P., Shili-Mismoudi, S., & Poullenot, F. (2022). Compliance with Gluten Free Diet Is Associated with Better Quality of Life in Celiac Disease. Nutrients, 14(6), 1210. https://doi.org/10.3390/nu14061210