
Low Adherence to the EAT-Lancet Sustainable Reference Diet in the Brazilian Population: Findings from the National Dietary Survey 2017–2018

 ,
,  , , and
Abstract
:1. Introduction
2. Materials and Methods
2.1. Study Population
2.2. Individual Food Consumption
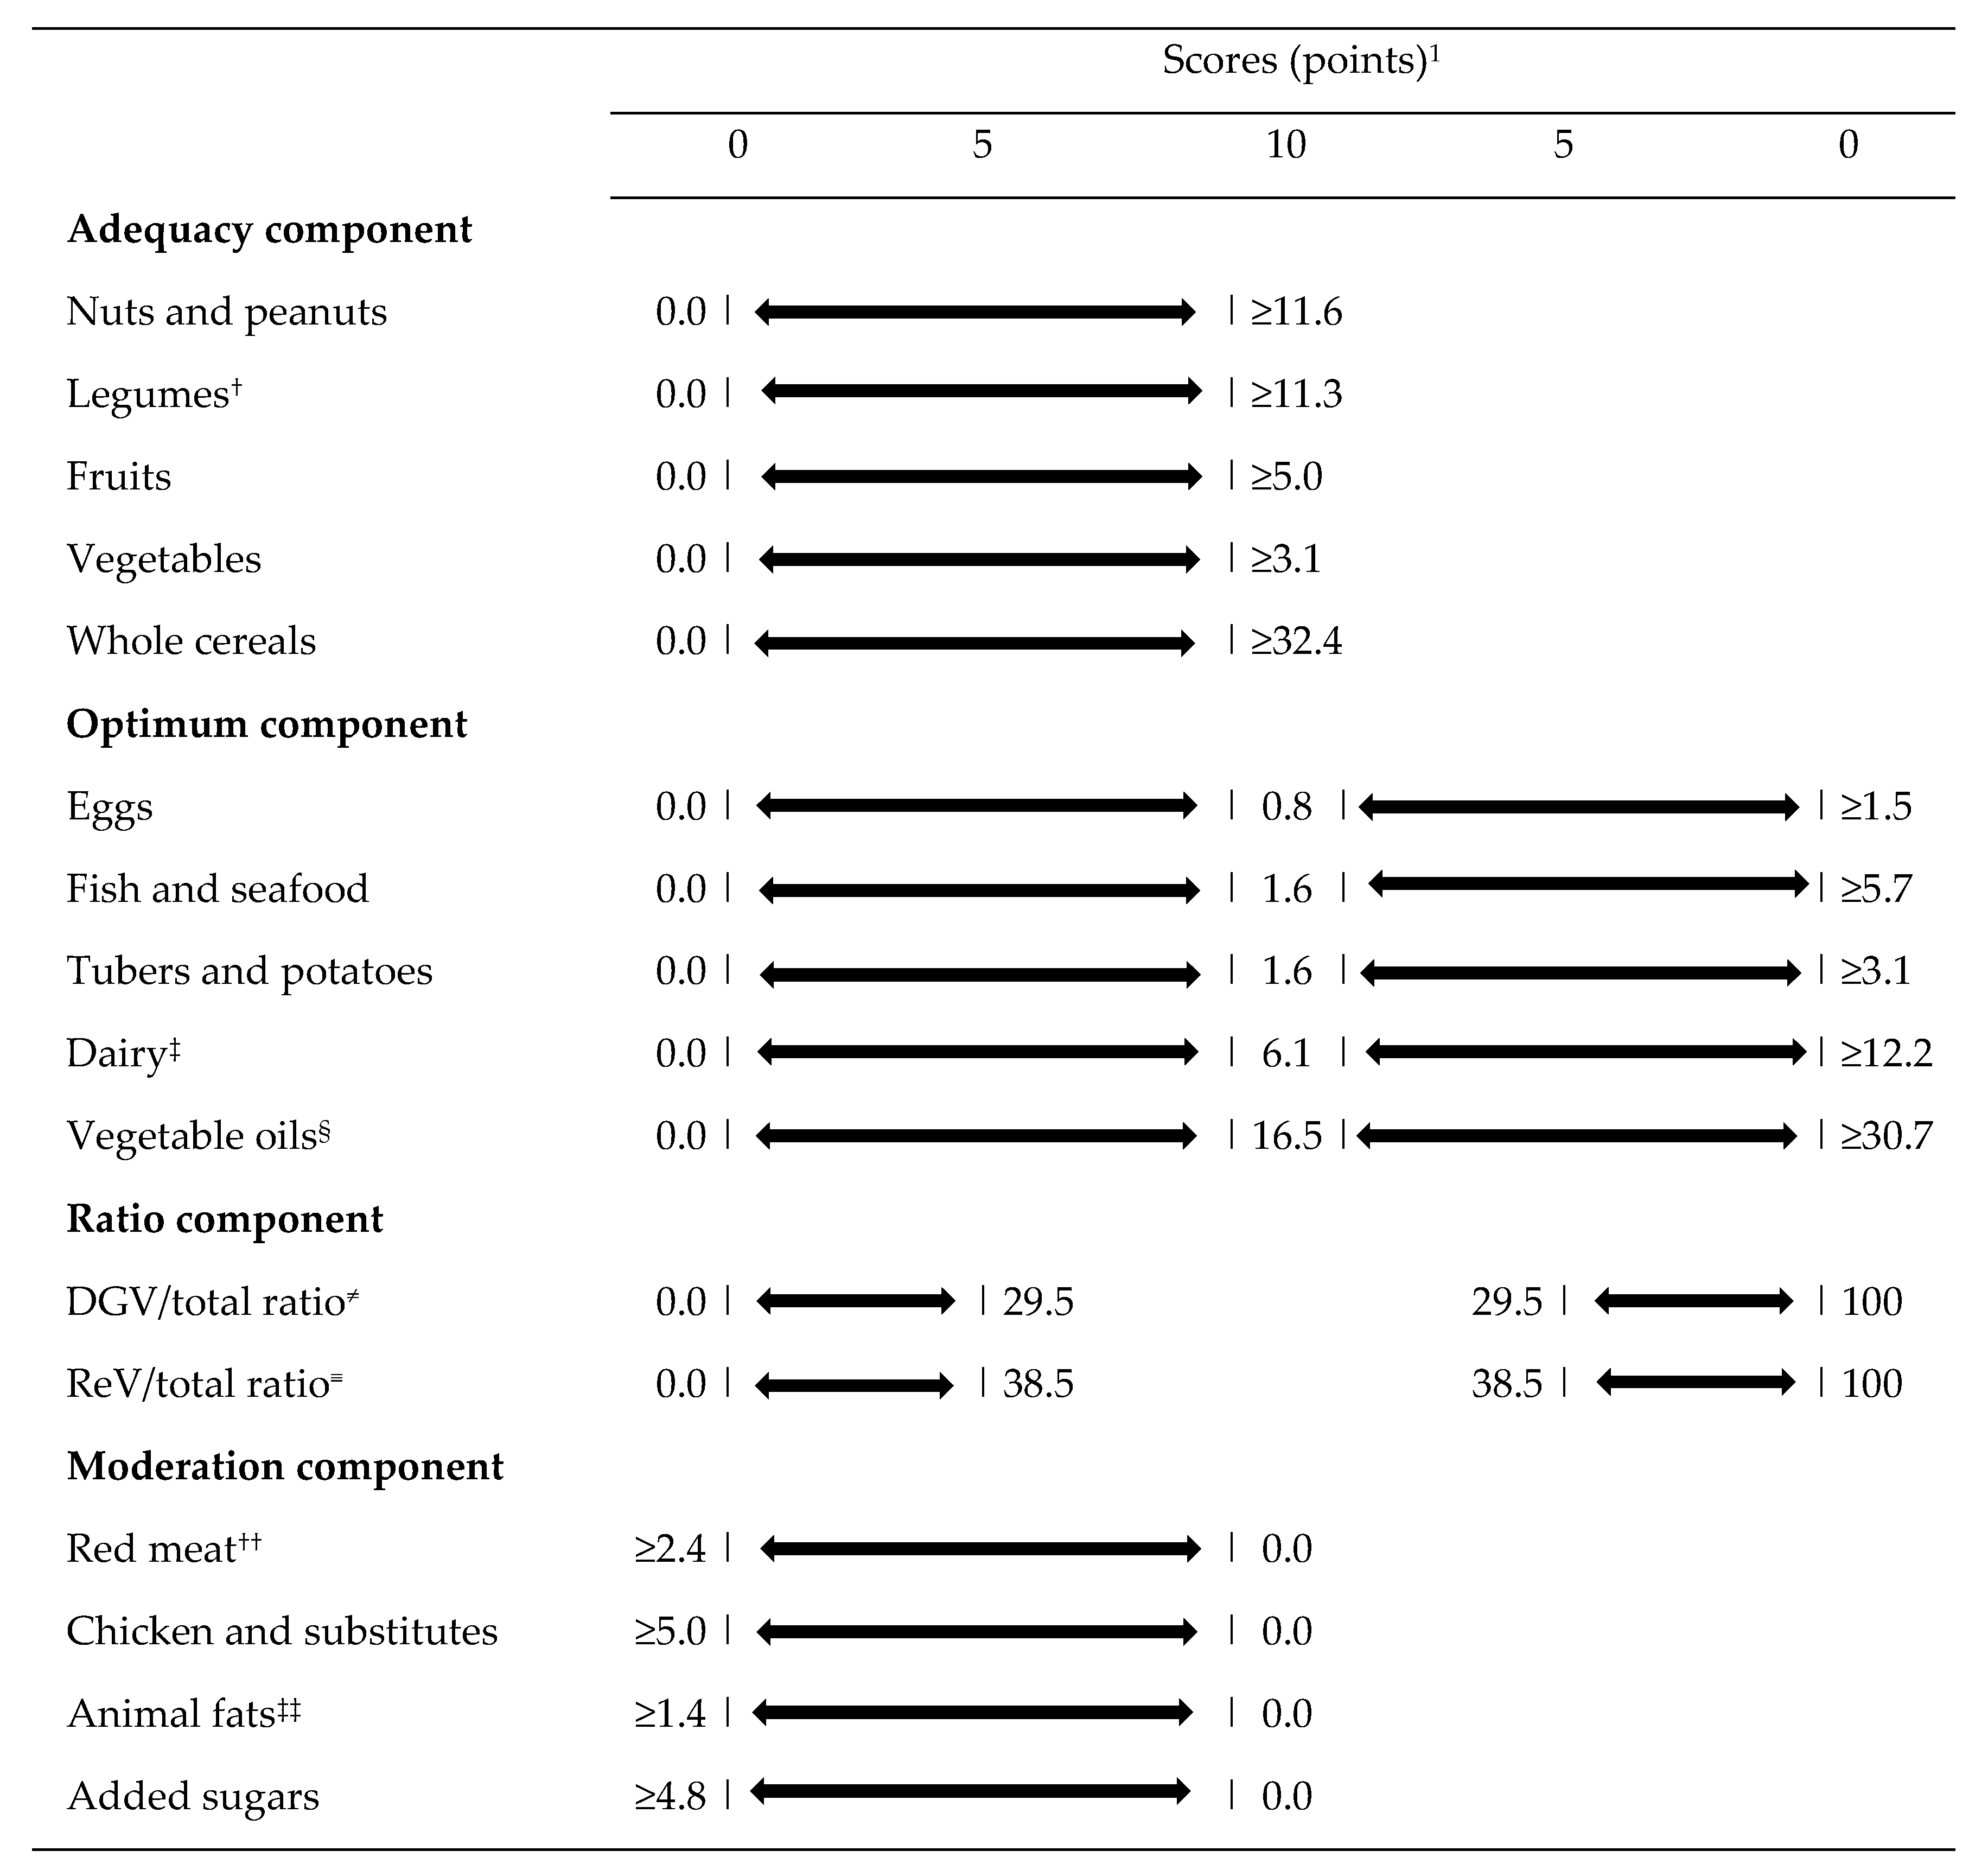
2.3. Planetary Health Diet Index (PHDI) Computation
2.4. Covariates
2.5. Data Analyses
3. Results
4. Discussion
5. Conclusions
Supplementary Materials
Author Contributions
Funding
Institutional Review Board Statement
Informed Consent Statement
Data Availability Statement
Acknowledgments
Conflicts of Interest
References
- Fanzo, J. Healthy and Sustainable Diets and Food Systems: The Key to Achieving Sustainable Development Goal 2? Food Ethics 2019, 4, 159–174. [Google Scholar] [CrossRef]
- Food and Agriculture Organization of the United Nations (FAO); World Health Organization (WHO). Sustainable Healthy Diets—Guiding Principles; Food and Agriculture Organization: Rome, Italy, 2019. [Google Scholar]
- Willett, W.; Rockström, J.; Loken, B.; Springmann, M.; Lang, T.; Vermeulen, S.; Garnett, T.; Tilman, D.; DeClerck, F.; Wood, A.; et al. Food in the Anthropocene: The EAT–Lancet Commission on Healthy Diets from Sustainable Food Systems. Lancet 2019, 393, 447–492. [Google Scholar] [CrossRef]
- Springmann, M.; Wiebe, K.; Mason-D’Croz, D.; Sulser, T.B.; Rayner, M.; Scarborough, P. Health and Nutritional Aspects of Sustainable Diet Strategies and Their Association with Environmental Impacts: A Global Modelling Analysis with Country-Level Detail. Lancet Planet Health 2018, 2, e451–e461. [Google Scholar] [CrossRef] [Green Version]
- Mozaffarian, D.; Rosenberg, I.; Uauy, R. History of Modern Nutrition Science—Implications for Current Research, Dietary Guidelines, and Food Policy. BMJ 2018, 361, k2392. [Google Scholar] [CrossRef] [Green Version]
- Fransen, H.P.; Ocké, M.C. Indices of Diet Quality. Curr. Opin. Clin. Nutr. Metab. Care. 2008, 11, 559–565. [Google Scholar] [CrossRef]
- Tepper, S.; Geva, D.; Shahar, D.R.; Shepon, A.; Mendelsohn, O.; Golan, M.; Adler, D.; Golan, R. The SHED Index: A Tool for Assessing a Sustainable HEalthy Diet. Eur. J. Nutr. 2021, 60, 3897–3909. [Google Scholar] [CrossRef]
- Cacau, L.T.; De Carli, E.; de Carvalho, A.M.; Lotufo, P.A.; Moreno, L.A.; Bensenor, I.M.; Marchioni, D.M. Development and Validation of an Index Based on Eat-Lancet Recommendations: The Planetary Health Diet Index. Nutrients 2021, 13, 1698. [Google Scholar] [CrossRef]
- Cacau, L.T.; Marchioni, D.M. The Planetary Health Diet Index Scores Proportionally and Considers the Intermediate Values of the EAT-Lancet Reference Diet. Am. J. Clin. Nutr. 2022. [Google Scholar] [CrossRef]
- Cacau, L.T.; Benseñor, I.M.; Goulart, A.C.; Cardoso, L.O.; Lotufo, P.A.; Moreno, L.A.; Marchioni, D.M. Adherence to the Planetary Health Diet Index and Obesity Indicators in the Brazilian Longitudinal Study of Adult Health (ELSA-Brasil). Nutrients 2021, 13, 3691. [Google Scholar] [CrossRef]
- Instituto Brasileiro de Geografia e Estatística. Pesquisa de Orçamentos Familiares 2017–2018: Análise Do Consumo Alimentar Pessoal No Brasil; IBGE: Rio de Janeiro, Brazil, 2020.
- Instituto Brasileiro de Geografia e Estatística. Pesquisa de Orçamentos Familiares 2017–2018: Avaliação Nutricional Da Disponibiliade Domiciliar de Alimentos No Brasil; IBGE: Rio de Janeiro, Brazil, 2020.
- Rodrigues, R.M.; de Carli, E.; Araújo, M.C.; Junior, E.V.; Marchioni, D.M.L.; Bezerra, I.N.; Souza, A.d.M.; Yokoo, E.M.; Pereira, R.A.; Sichieri, R. Limitations in the Comparison of the Brazilian National Dietary Surveys of 2008–2009 and 2017–2018. Rev Saúde Pública 2021, 55, 1–10. [Google Scholar] [CrossRef]
- Instituto Brasileiro de Geografia e Estatística (IBGE). Pesquisa de Orçamentos Familiares 2008–2009: Tabela de Medidas Referidas Para Os Alimentos Consumidos No Brasil; IBGE: Rio de Janeiro, Brazil, 2011.
- Fisberg, R.M.; Villar, B.S. Manual de Receitas e Medidas Caseiras Para Calculo de Inqueritos Alimentares: Manual Elaborado Para Auxiliar o Processamento de Dados de Inqueritos Alimentares; Signus: São Paulo, Brazil, 2002. [Google Scholar]
- Pinheiro, A.B.V.; Lacerda, E.M.d.A.; Benzecry, E.H.; Gomes, M.C.d.S.; Costa, V.M. Tabela Para Avaliação de Consumo Alimentar Em Medidas Caseiras; Atheneu: Rio de Janeiro, Brazil, 2005. [Google Scholar]
- Giuntini, E.B.; Coelho, K.S.; Grande, F.; Marchioni, D.M.L.; De Carli, E.; Sichieri, R.; Pereira, R.A.; Purgatto, E.; Franco, B.D.G.M.; Lajolo, F.M.; et al. 12th IFDC 2017 Special Issue–Brazilian Nutrient Intake Evaluation Database: An Essential Tool for Estimating Nutrient Intake Data. J. Food Compost. Anal. 2019, 83, 103286. [Google Scholar] [CrossRef]
- Schmidt, M.I.; Duncan, B.B.; Mill, J.G.; Lotufo, P.A.; Chor, D.; Barreto, S.M.; Aquino, E.M.; Passos, V.M.A.; Matos, S.M.; Molina, M.d.C.B.; et al. Cohort Profile: Longitudinal Study of Adult Health (ELSA-Brasil). Int. J. Epidemiol. 2015, 44, 68–75. [Google Scholar] [CrossRef] [Green Version]
- Aquino, E.M.L.; Barreto, S.M.; Bensenor, I.M.; Carvalho, M.S.; Chor, D.; Duncan, B.B.; Lotufo, P.A.; Mill, J.G.; Molina, M.D.C.; Mota, E.L.A.; et al. Brazilian Longitudinal Study of Adult Health (ELSA-Brasil): Objectives and Design. Am. J. Epidemiol. 2012, 175, 315–324. [Google Scholar] [CrossRef] [Green Version]
- Chor, D.; Cardoso, L.O.; Nobre, A.A.; Griep, R.H.; Fonseca, M.d.J.M.; Giatti, L.; Bensenor, I.; del Carmen Bisi Molina, M.; Aquino, E.M.L.; Diez-Roux, A.; et al. Association between Perceived Neighbourhood Characteristics, Physical Activity and Diet Quality: Results of the Brazilian Longitudinal Study of Adult Health (ELSA-Brasil). BMC Public Health 2016, 16, 751. [Google Scholar] [CrossRef] [Green Version]
- Souza, J.P.M.; Lima, M.M.; Horta, P.M. Diet Quality among the Brazilian Population and Associated Socioeconomic and Demographic Factors: Analysis from the National Dietary Survey 2008–2009. J. Acad Nutr. Diet. 2019, 119, 1866–1874. [Google Scholar] [CrossRef]
- Verly Junior, E.; Marchioni, D.M.; Araujo, M.C.; de Carli, E.; Oliveira, D.C.R.S.d.; Yokoo, E.M.; Sichieri, R.; Pereira, R.A. Evolution of Energy and Nutrient Intake in Brazil between 2008–2009 and 2017–2018. Rev. Saúde Pública 2021, 55, 1–22. [Google Scholar] [CrossRef]
- Verly Junior, E.; Carvalho, A.M.d.; Fisberg, R.M.; Marchioni, D.M.L. Adherence to the Food Guide for the Brazilian Population. Rev. Saúde Pública 2013, 47, 1021–1027. [Google Scholar] [CrossRef]
- Carvalho, A.M.d.; Selem, S.S.d.C.; Miranda, A.M.; Marchioni, D.M. Excessive Red and Processed Meat Intake: Relations with Health and Environment in Brazil. Br. J. Nutr. 2016, 115, 2011–2016. [Google Scholar] [CrossRef] [Green Version]
- Carvalho, A.M.d.; César, C.L.G.; Fisberg, R.M.; Marchioni, D.M.L. Excessive Meat Consumption in Brazil: Diet Quality and Environmental Impacts. Public Health Nutr. 2013, 16, 1893–1899. [Google Scholar] [CrossRef] [Green Version]
- Travassos, G.F.; Antônio da Cunha, D.; Coelho, A.B. The Environmental Impact of Brazilian Adults’ Diet. J. Clean. Prod. 2020, 272, 122622. [Google Scholar] [CrossRef]
- Giulietti, A.M.; Harley, R.M.; Queiroz, L.P.; Wanderley, M.d.G.L.; van den Berg, C. Biodiversity and Conservation of Plants in Brazil. Conserv. Biol. 2005, 19, 632–639. [Google Scholar] [CrossRef]
- Khoury, C.K.; Bjorkman, A.D.; Dempewolf, H.; Ramirez-Villegas, J.; Guarino, L.; Jarvis, A.; Rieseberg, L.H.; Struik, P.C. Increasing Homogeneity in Global Food Supplies and the Implications for Food Security. Proc. Natl. Acad. Sci. USA 2014, 111, 4001–4006. [Google Scholar] [CrossRef] [Green Version]
- Scott, C. Sustainably Sourced Junk Food? Big Food and the Challenge of Sustainable Diets. Glob. Environ. Politics 2018, 18, 93–113. [Google Scholar] [CrossRef]
- Seconda, L.; Baudry, J.; Pointereau, P.; Lacour, C.; Langevin, B.; Hercberg, S.; Lairon, D.; Allès, B.; Kesse-Guyot, E. Development and Validation of an Individual Sustainable Diet Index in the NutriNet-Santé Study Cohort. Br. J. Nutr. 2019, 121, 1166–1177. [Google Scholar] [CrossRef] [Green Version]
- Knuppel, A.; Papier, K.; Key, T.J.; Travis, R.C. EAT-Lancet Score and Major Health Outcomes: The EPIC-Oxford Study. Lancet 2019, 394, 213–214. [Google Scholar] [CrossRef] [Green Version]
- Stubbendorff, A.; Sonestedt, E.; Ramne, S.; Drake, I.; Hallström, E.; Ericson, U. Development of an EAT-Lancet Index and Its Relation to Mortality in a Swedish Population. Am. J. Clin. Nutr. 2022, 115, 705–716. [Google Scholar] [CrossRef] [PubMed]
- Shamah-Levy, T.; Gaona-Pineda, E.; Mundo-Rosas, V.; Gómez-Humarán, I.; Rodríguez-Ramírez, S. Asociación de Un Índice de Dieta Saludable y Sostenible Con Sobrepeso y Obesidad En Adultos Mexicanos. Salud Publica Mex. 2020, 62, 745–753. [Google Scholar] [CrossRef]
- Seconda, L.; Egnell, M.; Julia, C.; Touvier, M.; Hercberg, S.; Pointereau, P.; Lairon, D.; Allès, B.; Kesse-Guyot, E. Association between Sustainable Dietary Patterns and Body Weight, Overweight, and Obesity Risk in the NutriNet-Santé Prospective Cohort. Am. J. Clin. Nutr. 2020, 112, 138–149. [Google Scholar] [CrossRef]
- Sharma, M.; Kishore, A.; Roy, D.; Joshi, K. A Comparison of the Indian Diet with the EAT-Lancet Reference Diet. BMC Public Health 2020, 20, 812. [Google Scholar] [CrossRef] [PubMed]
- Mello, A.V.d.; Pereira, J.L.; Leme, A.C.B.; Goldbaum, M.; Cesar, C.L.G.; Fisberg, R.M. Social Determinants, Lifestyle and Diet Quality: A Population-Based Study from the 2015 Health Survey of São Paulo, Brazil. Public Health Nutr. 2020, 23, 1766–1777. [Google Scholar] [CrossRef] [PubMed]
- Pires, R.K.; Luft, V.C.; Araújo, M.C.; Bandoni, D.; Molina, M.d.C.; Chor, D.; Cardoso, L.d.O. Critical Analysis of the Revised Diet Quality Index for the Brazilian Population (DQI-R): Its Application in ELSA-Brasil. Cien Saude Colet. 2020, 25, 703–713. [Google Scholar] [CrossRef] [Green Version]
- Kovalskys, I.; Cavagnari, B.M.; Zonis, L.N.; Favieri, A.L.; Guajardo, V.; Gerardi, A.; Fisberg, M. Poverty as a Determinant of Food Quality in Argentina. Results of the Argentine Study of Nutrition and Health (EANS). Nutr. Hosp. 2020, 37, 114–122. [Google Scholar] [CrossRef] [PubMed]
- Gorgulho, B.M.; Pot, G.K.; Sarti, F.M.; Marchioni, D.M. Main Meal Quality in Brazil and United Kingdom: Similarities and Differences. Appetite 2017, 111, 151–157. [Google Scholar] [CrossRef]
- Drewnowski, A. Analysing the Affordability of the EAT–Lancet Diet. Lancet Glob. Health 2020, 8, e6–e7. [Google Scholar] [CrossRef]
- Bai, Y.; Herforth, A.; Masters, W.A. Global Variation in the Cost of a Nutrient-Adequate Diet by Population Group: An Observational Study. Lancet Planet Health 2022, 6, e19–e28. [Google Scholar] [CrossRef]
- Hirvonen, K.; Bai, Y.; Headey, D.; Masters, W.A. Affordability of the EAT–Lancet Reference Diet: A Global Analysis. Lancet Glob. Health 2020, 8, e59–e66. [Google Scholar] [CrossRef] [Green Version]
- Verly Junior, E.; Oliveira, D.C.R.S.; Sichieri, R. Cost of Healthy and Culturally Acceptable Diets in Brazil in 2009 and 2018. Rev. Saúde Pública 2021, 55, 1–11. [Google Scholar] [CrossRef]
- Verly, E., Jr.; de Carvalho, A.M.; Marchioni, D.M.L.; Darmon, N. The Cost of Eating More Sustainable Diets: A Nutritional and Environmental Diet Optimisation Study. Glob. Public Health 2021, 1–14. [Google Scholar] [CrossRef]
- Costa, D.V.P.; Lopes, M.S.; Mendonça, R.D.; Malta, D.C.; Freitas, P.P.; Lopes, A.C.S. Food Consumption Differences in Brazilian Urban and Rural Areas: The National Health Survey. Cienc. Saúde Colet. 2021, 26, 3805–3813. [Google Scholar] [CrossRef] [PubMed]
- Brazilian Research Network on Food and Nutrition Sovereignty and Security. Food Insecurity and COVID-19 in Brazil-National Survey of Food Insecurity in the Context of the COVID-19 Pandemic in Brazil; Brazilian Research Network on Food and Nutrition Sovereignty and Security; Rede PENSSAN: Rio de Janeiro, Brazil, 2021. [Google Scholar]
- Dodd, K.W.; Guenther, P.M.; Freedman, L.S.; Subar, A.F.; Kipnis, V.; Midthune, D.; Tooze, J.A.; Krebs-Smith, S.M. Statistical Methods for Estimating Usual Intake of Nutrients and Foods: A Review of the Theory. J. Am. Diet Assoc. 2006, 106, 1640–1650. [Google Scholar] [CrossRef]


| Variables | Total PHDI Score | |||
|---|---|---|---|---|
| Proportion (%) | Mean | 95% CI | ||
| Total | 100 | 45.9 | 45.6 | 46.1 |
| Sex | ||||
| Women | 52.1 | 46.3 | 46.0 | 46.6 |
| Men | 47.9 | 45.4 | 45.2 | 45.7 |
| Age group | ||||
| <19 years | 16.1 | 43.6 | 43.2 | 44.1 |
| 19–30 years | 20.3 | 44.4 | 43.9 | 44.9 |
| 31–45 years | 25.7 | 45.9 | 45.5 | 46.2 |
| 46–59 years | 20.2 | 47.1 | 46.7 | 47.5 |
| ≥60 years | 17.6 | 48.2 | 47.8 | 48.7 |
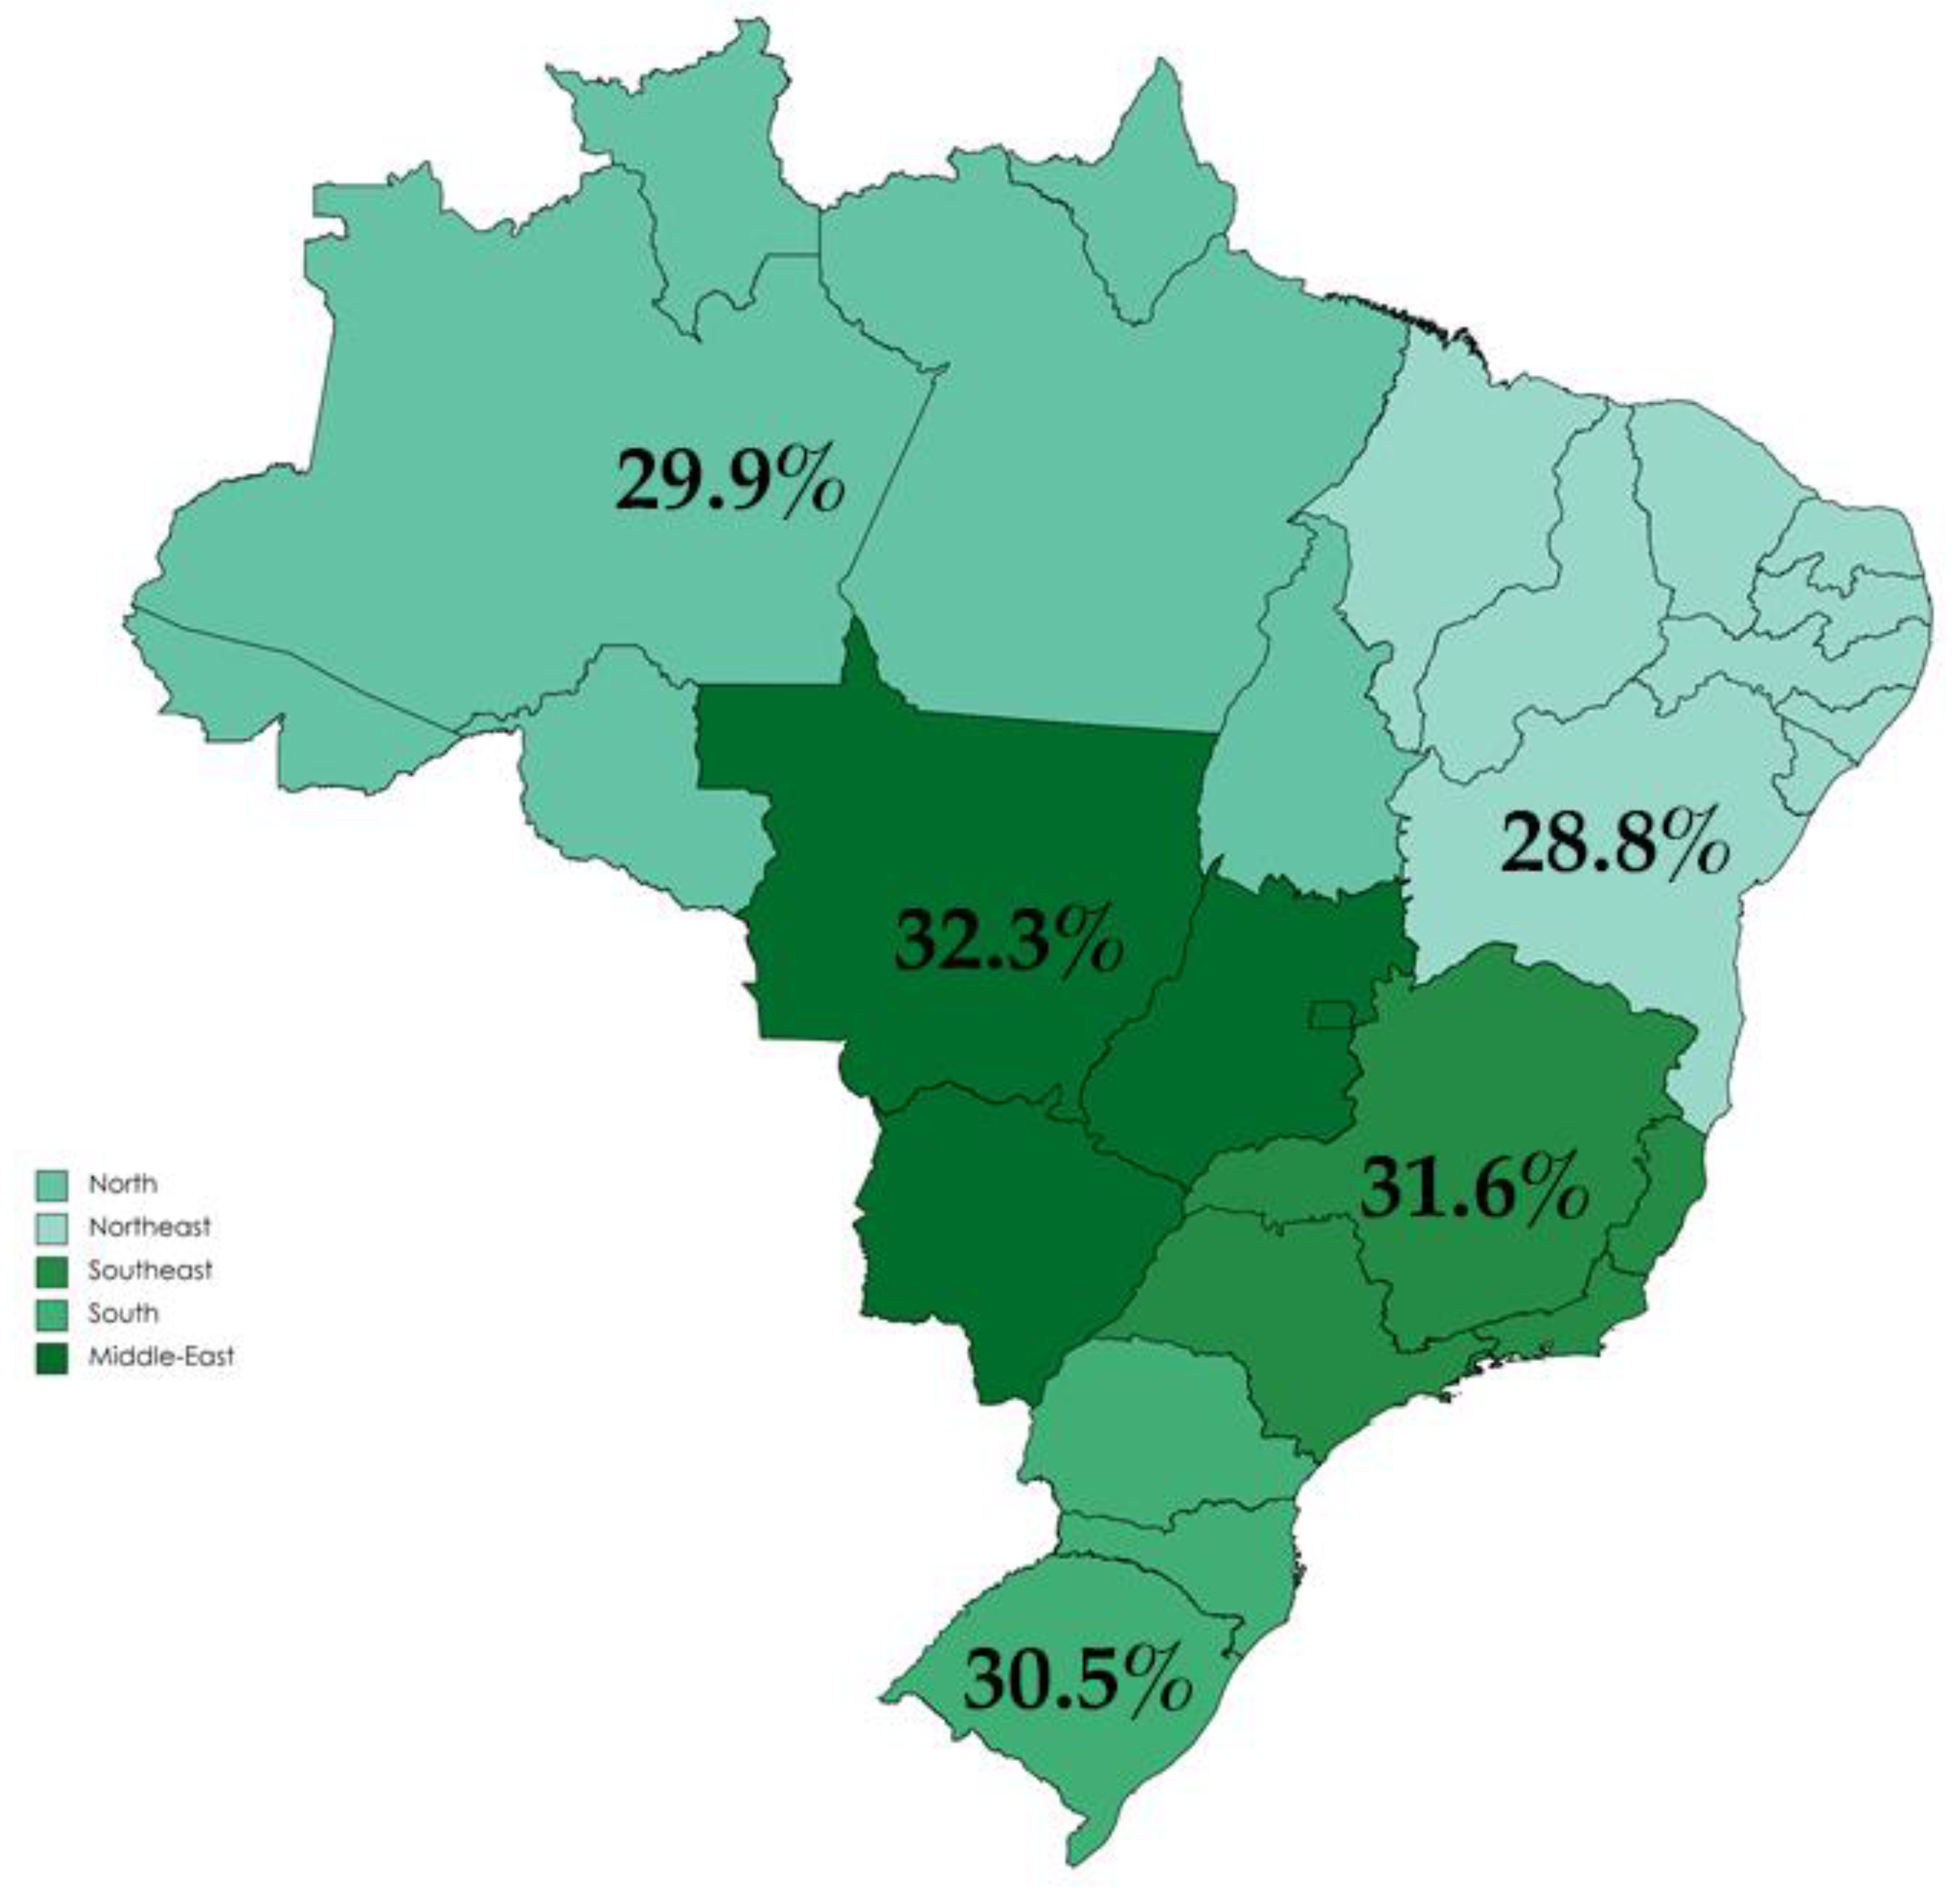
| Regions | ||||
| North | 8.2 | 44.9 | 44.2 | 45.5 |
| Northeast | 27.0 | 43.2 | 42.9 | 43.5 |
| Southeast | 42.6 | 47.4 | 46.9 | 47.9 |
| South | 14.5 | 45.7 | 45.1 | 46.2 |
| Middle-West | 7.7 | 48.4 | 47.7 | 49.0 |
| Per capita income | ||||
| 1st quartile | 21.4 | 44.5 | 44.0 | 44.9 |
| 2nd quartile | 22.8 | 45.5 | 45.0 | 45.9 |
| 3rd quartile | 25.5 | 46.4 | 45.9 | 46.8 |
| 4th quartile | 30.3 | 46.8 | 46.3 | 47.3 |
| Education in years | ||||
| ≤8 | 41.9 | 45.8 | 45.5 | 46.0 |
| 9–11 | 16.8 | 45.9 | 45.4 | 46.3 |
| ≥12 | 41.3 | 46.0 | 45.6 | 46.4 |
| Residence area | ||||
| Urban | 85.5 | 46.0 | 45.7 | 46.3 |
| Rural | 14.5 | 45.1 | 44.7 | 45.6 |
| BMI (kg/m2) | ||||
| Low | 2.6 | 44.7 | 43.4 | 46.1 |
| Adequate | 44.7 | 45.5 | 45.2 | 45.8 |
| Overweight | 47.8 | 46.3 | 46.0 | 46.6 |
| Obesity | 5.1 | 45.7 | 44.9 | 46.4 |
| PHDI Total Score | ||||||
|---|---|---|---|---|---|---|
| Men | Women | |||||
| Mean | 95% CI | Mean | 95% CI | |||
| Per capita income | ||||||
| 1st quartile | 44.2 | 43.7 | 44.7 | 44.7 | 44.2 | 45.1 |
| 2nd quartile | 45.0 | 44.4 | 45.6 | 45.9 | 45.4 | 46.4 |
| 3rd quartile | 46.1 | 45.5 | 46.6 | 46.7 | 46.2 | 47.3 |
| 4th quartile | 46.1 | 45.6 | 46.6 | 47.4 | 46.8 | 48.0 |
| Age group | ||||||
| <19 years | 43.3 | 42.8 | 43.9 | 43.9 | 43.3 | 44.6 |
| 19–30 years | 44.2 | 43.5 | 44.8 | 44.7 | 44.1 | 45.3 |
| 31–45 years | 45.4 | 44.9 | 45.9 | 46.3 | 45.8 | 46.7 |
| 45–59 years | 46.5 | 46.0 | 47.0 | 47.6 | 47.1 | 48.1 |
| ≥60 years | 48.0 | 47.5 | 48.6 | 48.4 | 47.8 | 49.0 |
| PHDI Components | Total | |||
|---|---|---|---|---|
| Maximum Points | Mean | 95% CI | ||
| Nuts and peanuts | 10 | 0.22 | 0.20 | 0.24 |
| Legumes | 10 | 4.98 | 4.89 | 5.07 |
| Fruits | 10 | 5.00 | 4.91 | 5.10 |
| Vegetables | 10 | 5.35 | 5.29 | 5.42 |
| Whole cereals | 10 | 0.24 | 0.22 | 0.26 |
| Eggs | 10 | 0.67 | 0.64 | 0.71 |
| Fish and seafood | 10 | 0.09 | 0.08 | 0.11 |
| Tubers and potatoes | 10 | 0.76 | 0.71 | 0.80 |
| Dairy | 10 | 2.55 | 2.49 | 2.61 |
| Vegetable oils | 10 | 5.63 | 5.58 | 5.68 |
| DGV/total ratio | 5 | 0.42 | 0.40 | 0.45 |
| ReV/total ratio | 5 | 1.63 | 1.59 | 1.67 |
| Red meat | 10 | 3.01 | 2.92 | 3.10 |
| Chicken and substitutes | 10 | 4.90 | 4.80 | 5.00 |
| Animal fats | 10 | 8.34 | 8.26 | 8.42 |
| Added sugars | 10 | 2.08 | 2.01 | 2.14 |
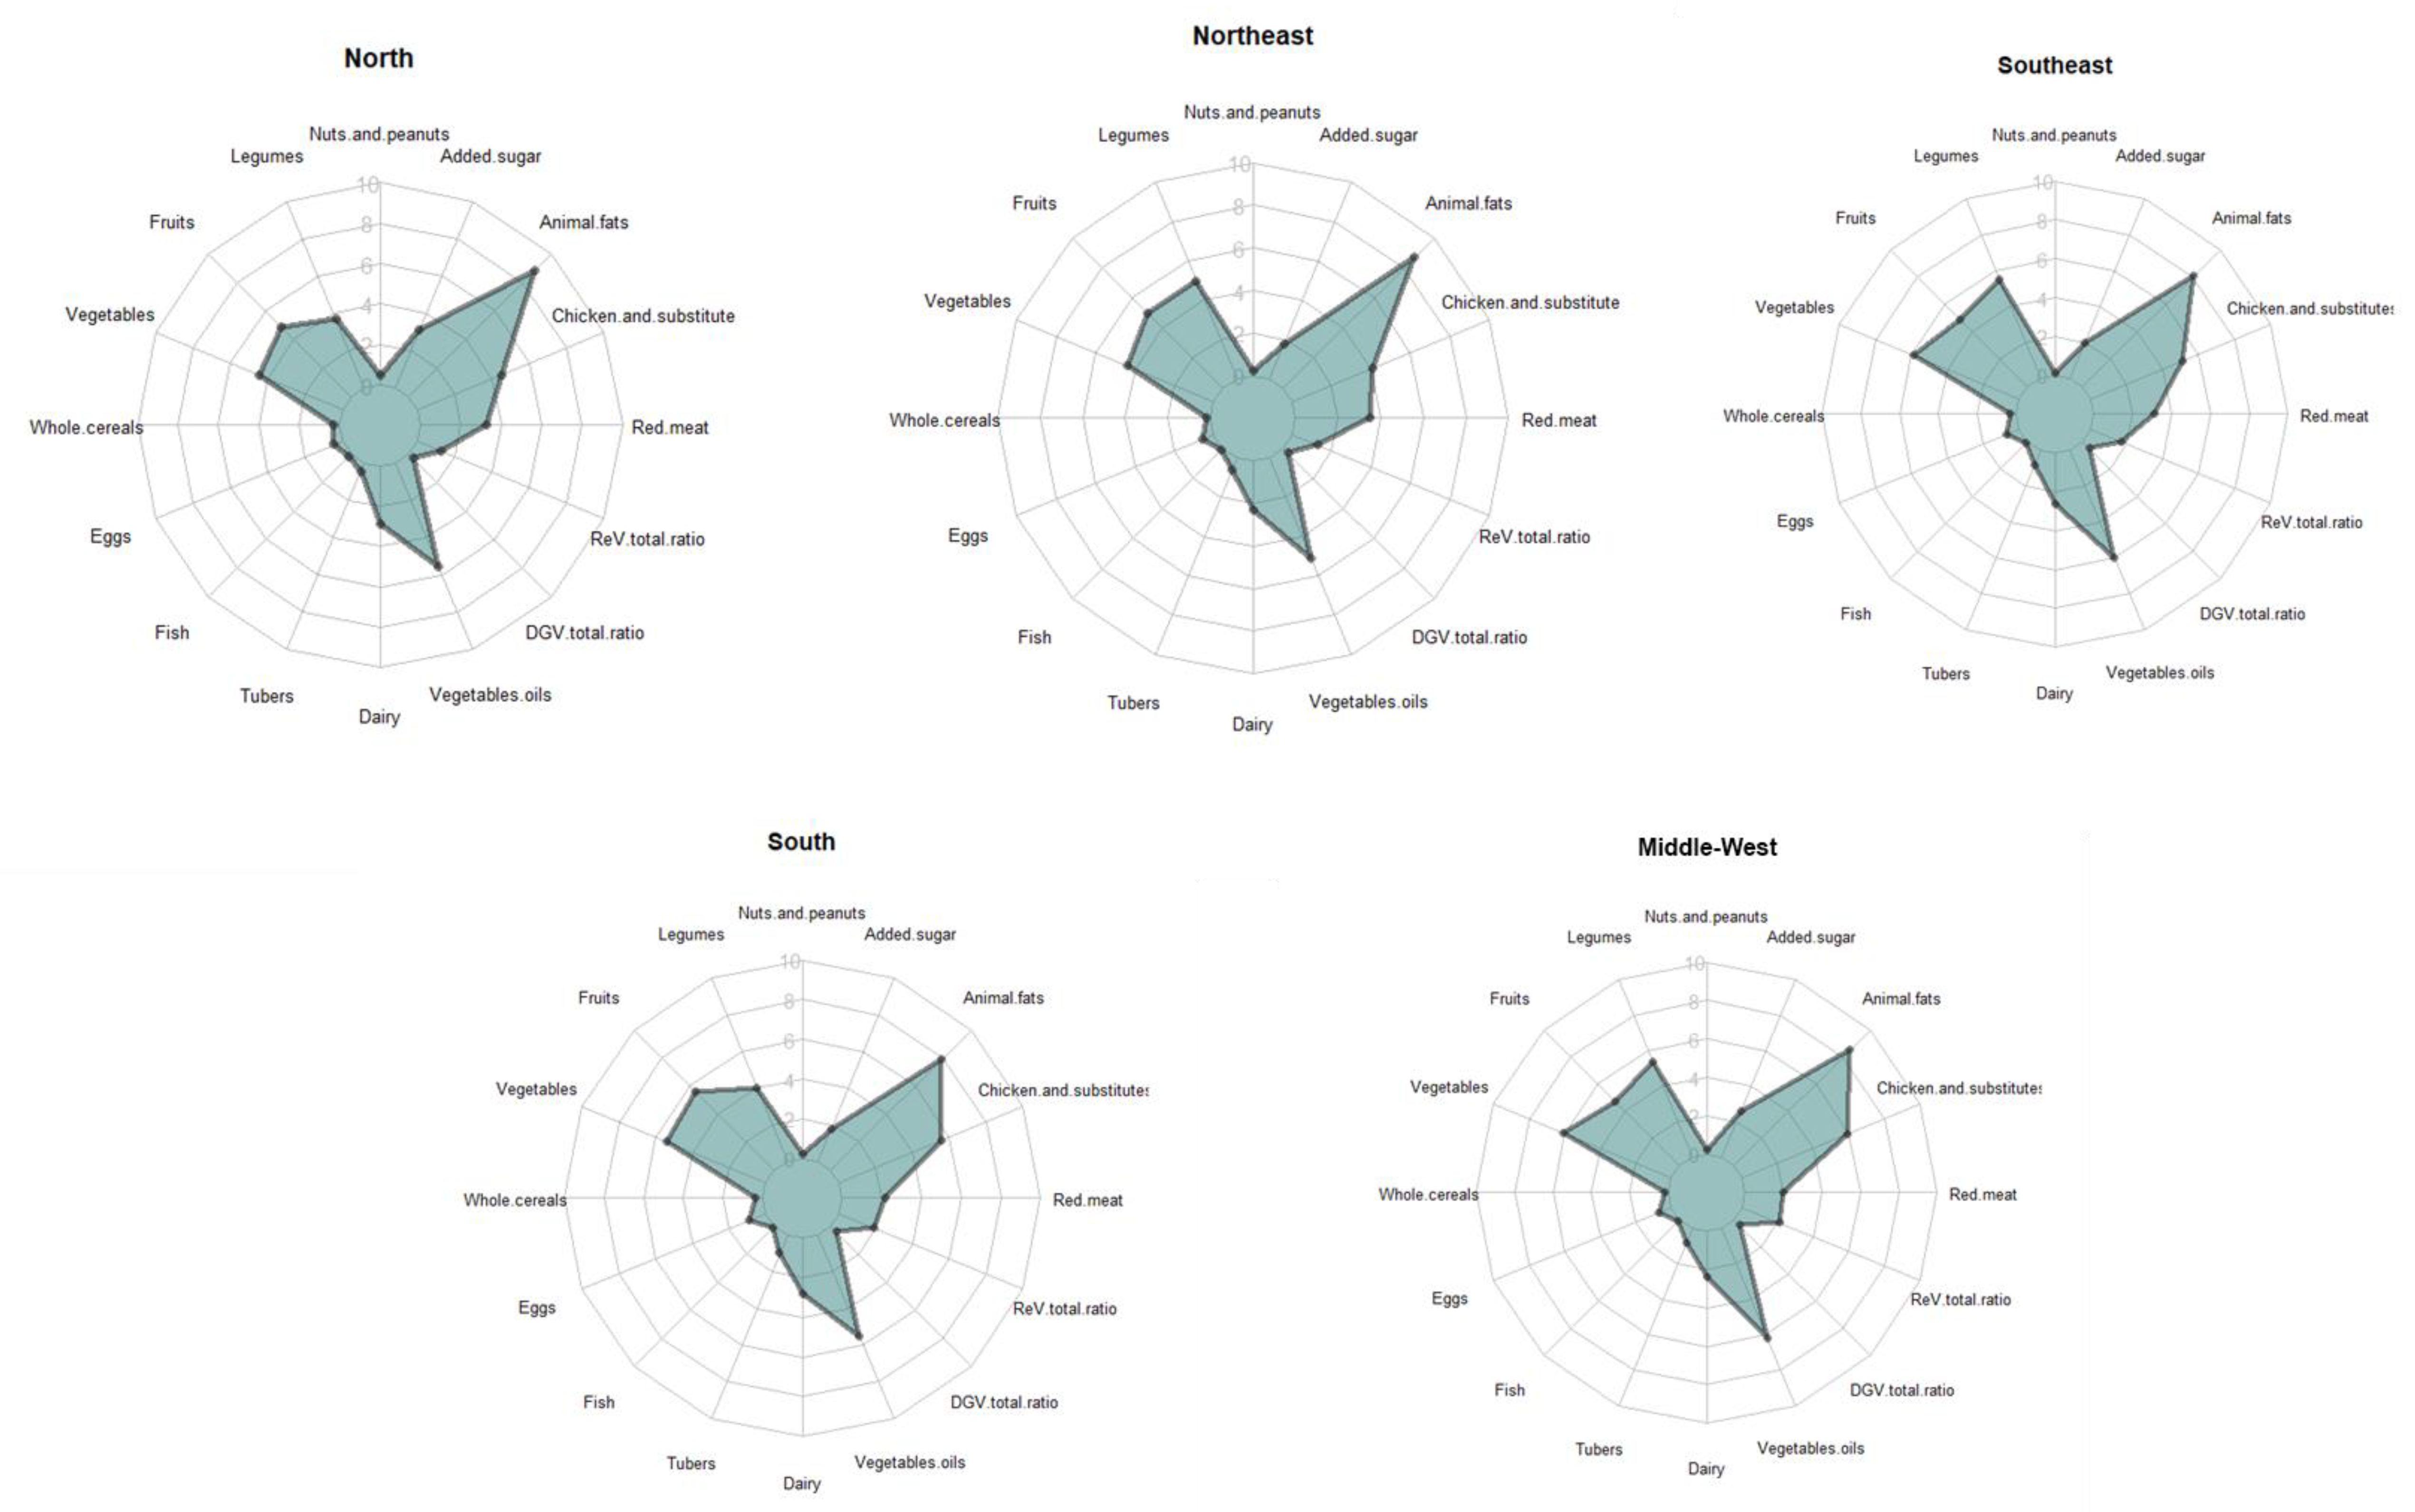
| PHDI Components | Total | North | Northeast | Southeast | South | Middle-West | ||||||
|---|---|---|---|---|---|---|---|---|---|---|---|---|
| Mean | 95% CI | Mean | 95% CI | Mean | 95% CI | Mean | 95% CI | Mean | 95% CI | Mean | 95% CI | |
| Nuts and peanuts | 1.16 | 1.04–1.27 | 2.21 | 1.70–2.72 | 1.52 | 1.31–1.72 | 0.75 | 0.57–0.93 | 1.00 | 0.76–1.24 | 1.33 | 0.84–1.82 |
| Legumes | 161.8 | 158.0–165.6 | 126.7 | 116.9–136.5 | 165.1 | 159.0–171.3 | 173.9 | 166.8–181.1 | 127.9 | 120.1–135.7 | 184.0 | 173.5–194.5 |
| Fruits | 87.3 | 84.5–90.1 | 101.7 | 90.4–113.0 | 98.6 | 94.0–103.1 | 75.3 | 70.5–80.0 | 98.0 | 91.1–105.0 | 78.2 | 71.2–85.3 |
| Vegetables | 92.3 | 90.5–94.2 | 70.0 | 65.0–75.0 | 66.4 | 64.3–68.4 | 102.3 | 98.9–105.7 | 112.4 | 106.4–118.3 | 114.7 | 109.2–120.3 |
| Whole cereals | 7.00 | 6.31–7.68 | 8.14 | 6.00–10.3 | 4.74 | 4.09–5.40 | 6.87 | 5.62–8.13 | 11.5 | 9.28–13.7 | 5.89 | 4.32–7.46 |
| Eggs | 16.4 | 15.8–17.0 | 14.2 | 12.4–16.1 | 19.4 | 18.3–20.4 | 15.0 | 14.0–16.1 | 16.3 | 15.1–17.4 | 15.5 | 14.0–17.1 |
| Fish and seafood | 17.9 | 16.6–19.1 | 54.1 | 47.0–61.2 | 25.1 | 22.6–27.6 | 9.52 | 7.76–11.3 | 11.2 | 8.32–14.0 | 12.7 | 9.31–16.1 |
| Tubers and potatoes | 43.4 | 41.7–45.1 | 56.8 | 52.1–61.5 | 52.1 | 48.7–55.5 | 34.1 | 31.3–36.8 | 48.5 | 44.0–53.0 | 40.5 | 35.9–45.1 |
| Dairy | 112.1 | 109.3–114.9 | 86.9 | 80.0–93.7 | 94.2 | 90.1–98.4 | 126.7 | 121.4–131.9 | 119.9 | 112.9–126.8 | 106.3 | 98.4–114.3 |
| Vegetable oils | 26.7 | 26.2–27.2 | 25.6 | 24.2–27.0 | 22.6 | 21.9–23.2 | 28.6 | 27.7–29.4 | 28.4 | 27.2–29.5 | 28.7 | 27.5–30.0 |
| Dark green vegetables | 4.54 | 4.15–4.92 | 2.06 | 1.49–2.63 | 1.49 | 1.31–1.67 | 6.50 | 5.70–7.30 | 6.16 | 5.11–7.20 | 3.97 | 3.27–4.67 |
| Red-orange vegetables | 35.3 | 34.3–36.4 | 24.4 | 21.8–27.0 | 23.9 | 22.7–25.1 | 38.2 | 26.2–40.2 | 47.8 | 44.8–50.8 | 47.9 | 44.7–51.2 |
| Red meat | 95.9 | 93.7–98.0 | 103.8 | 97.2–110.3 | 87.7 | 84.0–91.4 | 88.3 | 84.8–91.8 | 110.0 | 104.4–115.6 | 131.2 | 124.3–138.1 |
| Chicken and substitutes | 51.6 | 49.7–53.4 | 55.9 | 50.2–61.6 | 61.3 | 58.4–64.1 | 49.5 | 46.0–52.9 | 43.3 | 39.7–46.9 | 40.3 | 36.3–44.2 |
| Animal fats | 3.34 | 3.11–3.56 | 2.42 | 1.98–2.86 | 2.61 | 2.34–2.88 | 3.91 | 3.45–4.37 | 3.79 | 3.26–4.32 | 2.83 | 2.45–3.22 |
| Added sugars | 45.0 | 44.1–45.9 | 36.5 | 33.9–39.1 | 48.1 | 46.6–49.6 | 43.0 | 41.4–44.6 | 51.9 | 49.6–54.3 | 41.6 | 39.3–43.8 |
| Models | Overweight/Obesity | |
|---|---|---|
| OR | 95% CI | |
| Crude model | 1.006 | 1.003:1.008 |
| Adjusted model * | 1.002 | 0.999:1.004 |
Publisher’s Note: MDPI stays neutral with regard to jurisdictional claims in published maps and institutional affiliations. |
© 2022 by the authors. Licensee MDPI, Basel, Switzerland. This article is an open access article distributed under the terms and conditions of the Creative Commons Attribution (CC BY) license (https://creativecommons.org/licenses/by/4.0/).
Share and Cite
Marchioni, D.M.; Cacau, L.T.; De Carli, E.; Carvalho, A.M.d.; Rulli, M.C. Low Adherence to the EAT-Lancet Sustainable Reference Diet in the Brazilian Population: Findings from the National Dietary Survey 2017–2018. Nutrients 2022, 14, 1187. https://doi.org/10.3390/nu14061187
Marchioni DM, Cacau LT, De Carli E, Carvalho AMd, Rulli MC. Low Adherence to the EAT-Lancet Sustainable Reference Diet in the Brazilian Population: Findings from the National Dietary Survey 2017–2018. Nutrients. 2022; 14(6):1187. https://doi.org/10.3390/nu14061187
Chicago/Turabian StyleMarchioni, Dirce Maria, Leandro Teixeira Cacau, Eduardo De Carli, Aline Martins de Carvalho, and Maria Cristina Rulli. 2022. "Low Adherence to the EAT-Lancet Sustainable Reference Diet in the Brazilian Population: Findings from the National Dietary Survey 2017–2018" Nutrients 14, no. 6: 1187. https://doi.org/10.3390/nu14061187
APA StyleMarchioni, D. M., Cacau, L. T., De Carli, E., Carvalho, A. M. d., & Rulli, M. C. (2022). Low Adherence to the EAT-Lancet Sustainable Reference Diet in the Brazilian Population: Findings from the National Dietary Survey 2017–2018. Nutrients, 14(6), 1187. https://doi.org/10.3390/nu14061187