
Dietary-Derived Essential Nutrients and Amyotrophic Lateral Sclerosis: A Two-Sample Mendelian Randomization Study

Abstract
:1. Introduction
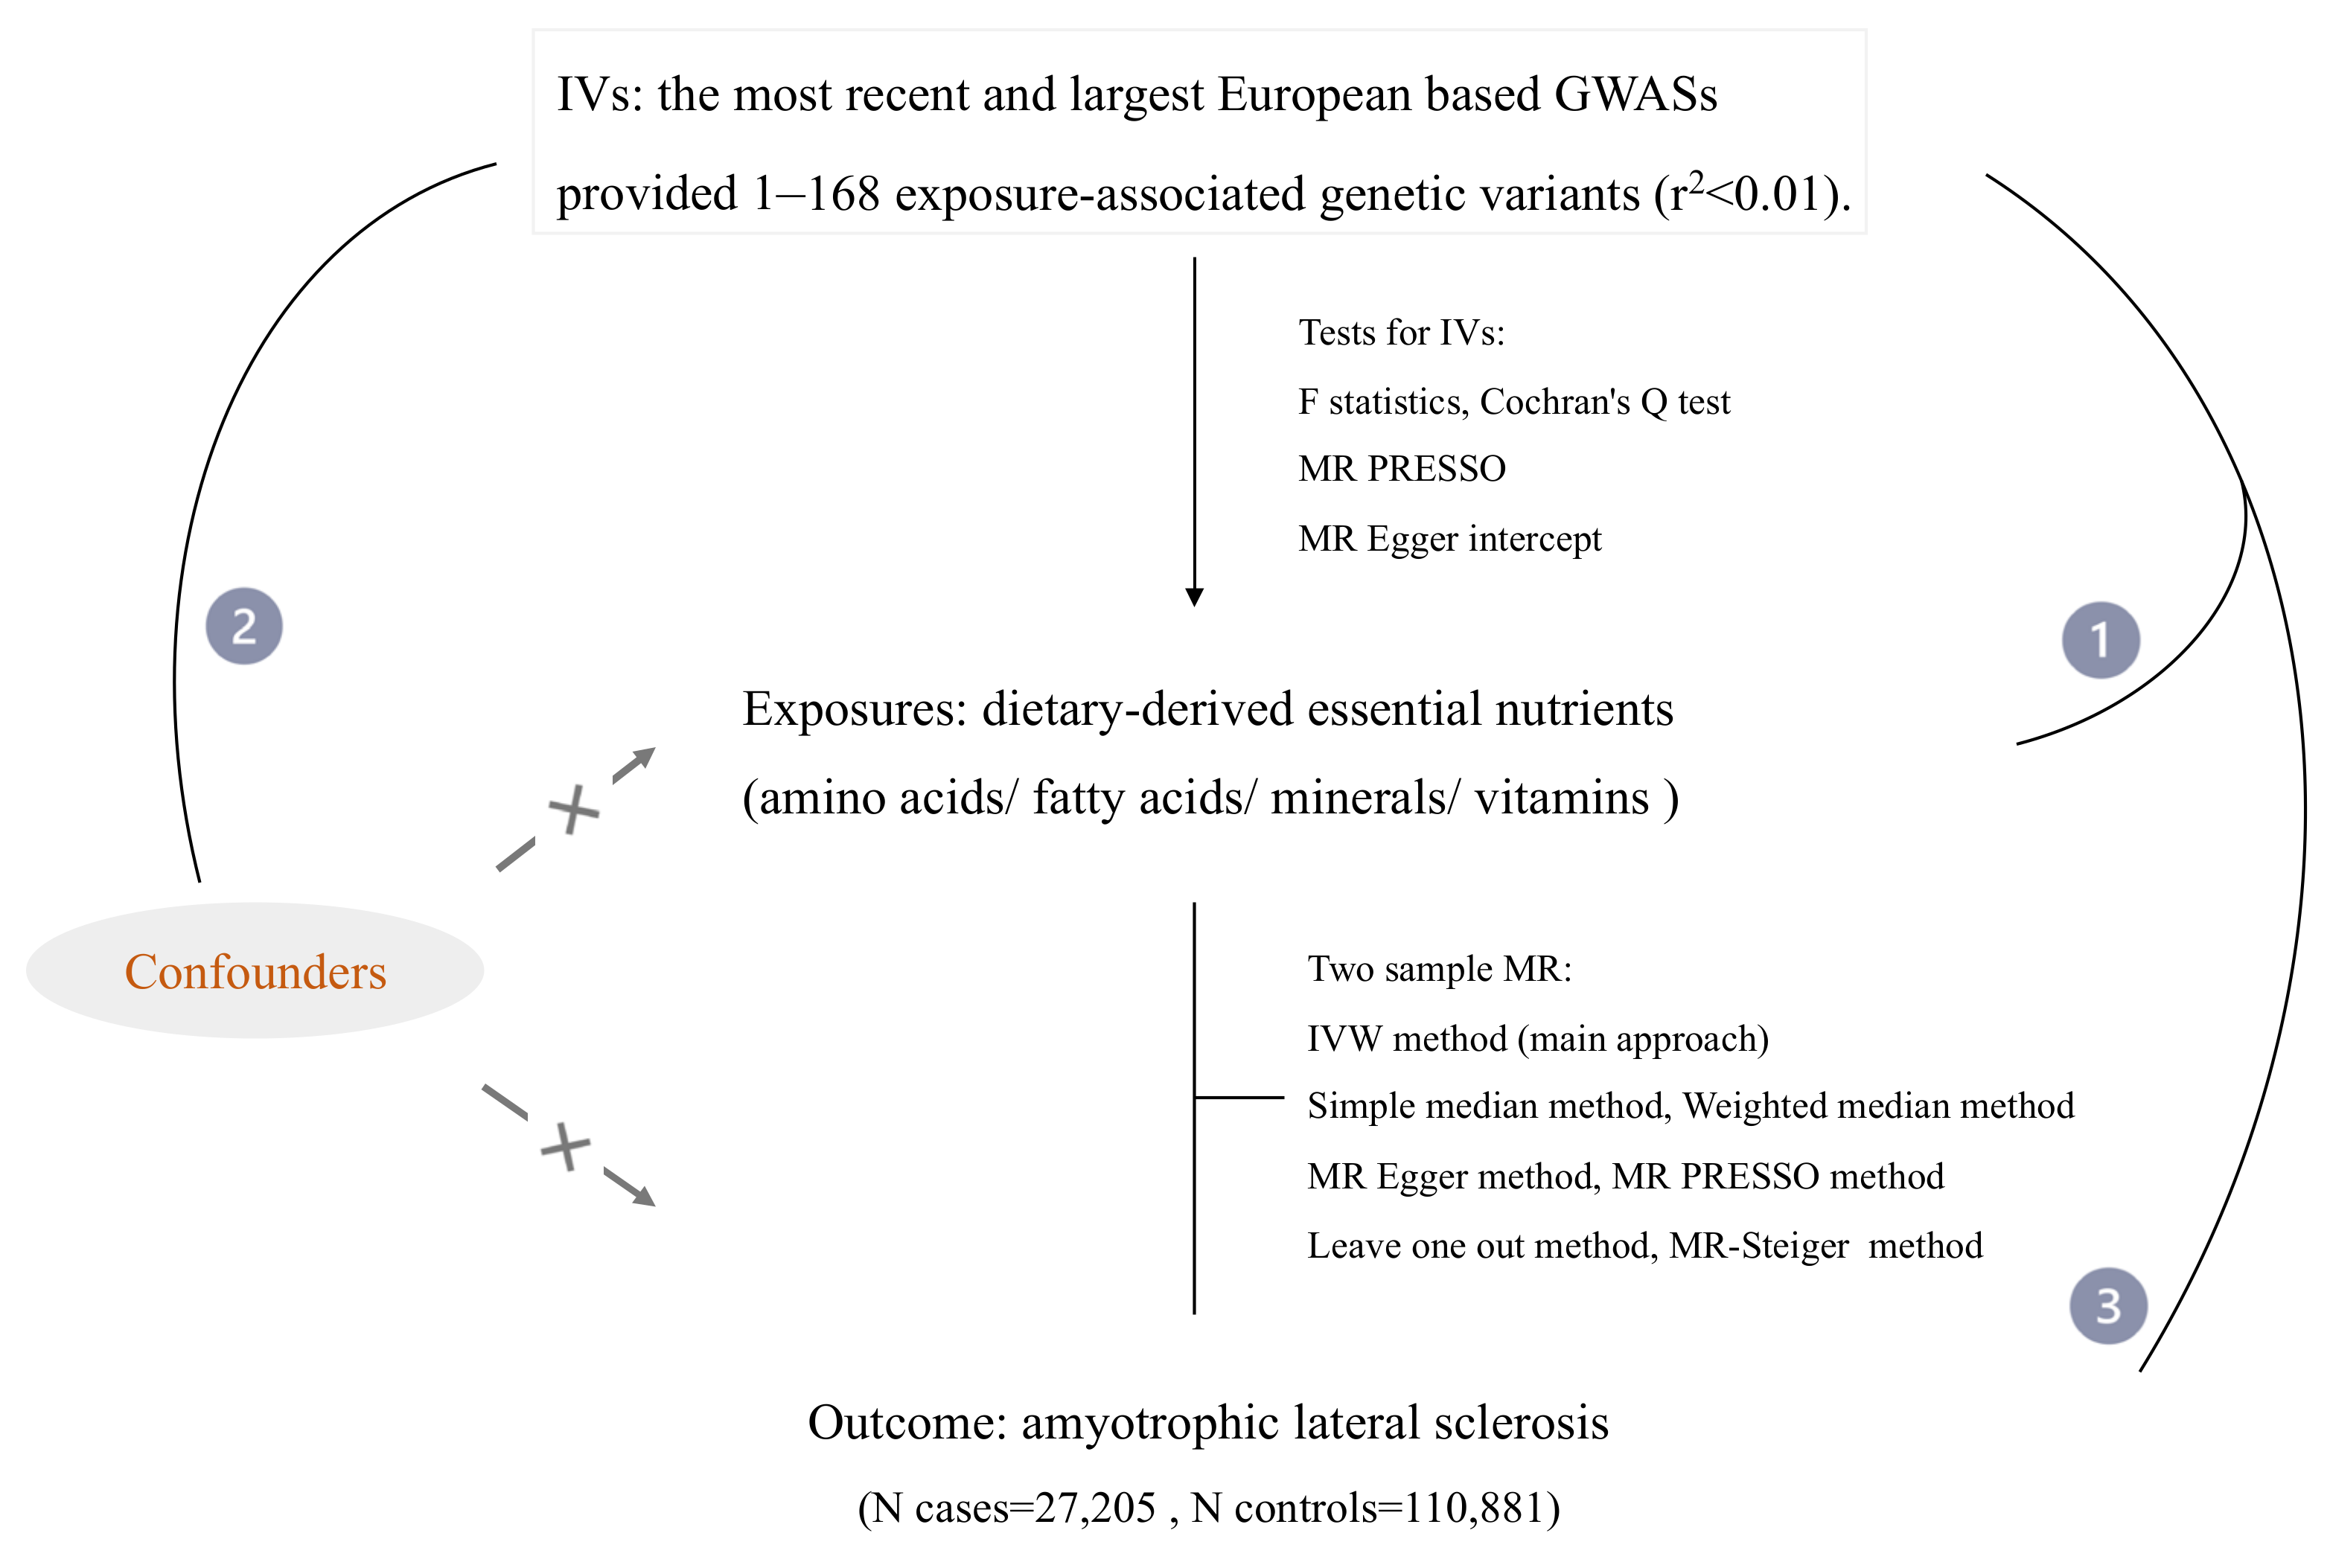
2. Materials and Methods
2.1. Data Collection and Selection of Instrumental Variables (IVs)
2.2. Mendelian Randomization
3. Results
4. Discussion
5. Conclusions
Supplementary Materials
Author Contributions
Funding
Institutional Review Board Statement
Informed Consent Statement
Data Availability Statement
Acknowledgments
Conflicts of Interest
References
- Oskarsson, B.; Gendron, T.F.; Staff, N.P. Amyotrophic Lateral Sclerosis: An Update for 2018. Mayo Clin. Proc. 2018, 93, 1617–1628. [Google Scholar] [CrossRef] [PubMed] [Green Version]
- Chia, R.; Chio, A.; Traynor, B.J. Novel genes associated with amyotrophic lateral sclerosis: Diagnostic and clinical implications. Lancet Neurol. 2018, 17, 94–102. [Google Scholar] [CrossRef]
- Miller, R.G.; Mitchell, J.D.; Moore, D.H. Riluzole for amyotrophic lateral sclerosis (ALS)/motor neuron disease (MND). Cochrane Database Syst. Rev. 2012, 65, CD001447. [Google Scholar] [CrossRef] [PubMed]
- Brown, R.H.; Al-Chalabi, A. Amyotrophic Lateral Sclerosis. N. Engl. J. Med. 2017, 377, 162–172. [Google Scholar] [CrossRef] [Green Version]
- Zhang, L.; Tang, L.; Huang, T.; Fan, D. Life Course Adiposity and Amyotrophic Lateral Sclerosis: A Mendelian Randomization Study. Ann. Neurol. 2020, 87, 434–441. [Google Scholar] [CrossRef]
- Ludolph, A.C.; Dorst, J.; Dreyhaupt, J.; Weishaupt, J.H.; Kassubek, J.; Weiland, U.; Meyer, T.; Petri, S.; Hermann, A.; Jordan, B.; et al. Effect of High-Caloric Nutrition on Survival in Amyotrophic Lateral Sclerosis. Ann. Neurol. 2020, 88, 646. [Google Scholar] [CrossRef]
- Hilt, Z.T.; Morrell, C.N. Essential Amino Acids-Essential in Arterial Thrombosis. Circulation 2020, 142, 65–67. [Google Scholar] [CrossRef]
- Gramlich, L.; Ireton-Jones, C.; Miles, J.M.; Morrison, M.; Pontes-Arruda, A. Essential Fatty Acid Requirements and Intravenous Lipid Emulsions. JPEN J. Parenter Enter. Nutr. 2019, 43, 697–707. [Google Scholar] [CrossRef] [Green Version]
- Shenkin, A. The key role of micronutrients. Clin. Nutr. 2006, 25, 1–13. [Google Scholar] [CrossRef]
- Wang, H.; O’Reilly, E.J.; Weisskopf, M.G.; Logroscino, G.; McCullough, M.L.; Schatzkin, A.; Kolonel, L.N.; Ascherio, A. Vitamin E intake and risk of amyotrophic lateral sclerosis: A pooled analysis of data from 5 prospective cohort studies. Am. J. Epidemiol. 2011, 173, 595–602. [Google Scholar] [CrossRef]
- Longnecker, M.P.; Kamel, F.; Umbach, D.M.; Munsat, T.L.; Shefner, J.M.; Lansdell, L.W.; Sandler, D.P. Dietary intake of calcium, magnesium and antioxidants in relation to risk of amyotrophic lateral sclerosis. Neuroepidemiology 2000, 19, 210–216. [Google Scholar] [CrossRef] [PubMed]
- Okamoto, K.; Kihira, T.; Kobashi, G.; Washio, M.; Sasaki, S.; Yokoyama, T.; Miyake, Y.; Sakamoto, N.; Inaba, Y.; Nagai, M. Fruit and vegetable intake and risk of amyotrophic lateral sclerosis in Japan. Neuroepidemiology 2009, 32, 251–256. [Google Scholar] [CrossRef] [PubMed]
- O’Reilly, E.J.; Bjornevik, K.; Furtado, J.D.; Kolonel, L.N.; Le Marchand, L.; McCullough, M.L.; Stevens, V.L.; Shadyab, A.H.; Snetselaar, L.; Manson, J.E.; et al. Prediagnostic plasma polyunsaturated fatty acids and the risk of amyotrophic lateral sclerosis. Neurology 2020, 94, e811–e819. [Google Scholar] [CrossRef] [PubMed]
- Fitzgerald, K.C.; O’Reilly, E.J.; Falcone, G.J.; McCullough, M.L.; Park, Y.; Kolonel, L.N.; Ascherio, A. Dietary omega-3 polyunsaturated fatty acid intake and risk for amyotrophic lateral sclerosis. JAMA Neurol. 2014, 71, 1102–1110. [Google Scholar] [CrossRef]
- Nadjar, Y.; Gordon, P.; Corcia, P.; Bensimon, G.; Pieroni, L.; Meininger, V.; Salachas, F. Elevated serum ferritin is associated with reduced survival in amyotrophic lateral sclerosis. PLoS ONE 2012, 7, e45034. [Google Scholar] [CrossRef]
- Zemla, B.; Zielonka, I.; Kolosza, Z. Tobacco smoking and exposure to dust and gas pollution in the place of work and lung cancer risk. Neoplasma 1988, 35, 135–143. [Google Scholar]
- Wang, M.; Liu, Z.; Sun, W.; Yuan, Y.; Jiao, B.; Zhang, X.; Shen, L.; Jiang, H.; Xia, K.; Tang, B.; et al. Association Between Vitamins and Amyotrophic Lateral Sclerosis: A Center-Based Survey in Mainland China. Front. Neurol. 2020, 11, 488. [Google Scholar] [CrossRef]
- Wang, Y.; Ye, S.; Chen, L.; Tang, L.; Fan, D. Loss of appetite in patients with amyotrophic lateral sclerosis is associated with weight loss and anxiety/depression. Sci. Rep. 2021, 11, 9119. [Google Scholar] [CrossRef]
- He, J.; Fu, J.; Zhao, W.; Ren, C.; Liu, P.; Chen, L.; Li, D.; Tang, L.; Zhou, L.; Zhang, Y.; et al. Hypermetabolism associated with worse prognosis of amyotrophic lateral sclerosis. J. Neurol. 2021, 269, 1447–1455. [Google Scholar] [CrossRef]
- Lee, K.; Lim, C.Y. Mendelian Randomization Analysis in Observational Epidemiology. J. Lipid Atheroscler. 2019, 8, 67–77. [Google Scholar] [CrossRef]
- Smith, G.D.; Timpson, N.; Ebrahim, S. Strengthening causal inference in cardiovascular epidemiology through Mendelian randomization. Ann. Med. 2008, 40, 524–541. [Google Scholar] [CrossRef] [PubMed]
- Kettunen, J.; Demirkan, A.; Wurtz, P.; Draisma, H.H.; Haller, T.; Rawal, R.; Vaarhorst, A.; Kangas, A.J.; Lyytikainen, L.P.; Pirinen, M.; et al. Genome-wide study for circulating metabolites identifies 62 loci and reveals novel systemic effects of LPA. Nat. Commun. 2016, 7, 11122. [Google Scholar] [CrossRef]
- Shin, S.Y.; Fauman, E.B.; Petersen, A.K.; Krumsiek, J.; Santos, R.; Huang, J.; Arnold, M.; Erte, I.; Forgetta, V.; Yang, T.P.; et al. An atlas of genetic influences on human blood metabolites. Nat. Genet. 2014, 46, 543–550. [Google Scholar] [CrossRef] [PubMed] [Green Version]
- Guan, W.; Steffen, B.T.; Lemaitre, R.N.; Wu, J.H.Y.; Tanaka, T.; Manichaikul, A.; Foy, M.; Rich, S.S.; Wang, L.; Nettleton, J.A.; et al. Genome-wide association study of plasma N6 polyunsaturated fatty acids within the cohorts for heart and aging research in genomic epidemiology consortium. Circ. Cardiovasc. Genet. 2014, 7, 321–331. [Google Scholar] [CrossRef] [PubMed] [Green Version]
- Lemaitre, R.N.; Tanaka, T.; Tang, W.; Manichaikul, A.; Foy, M.; Kabagambe, E.K.; Nettleton, J.A.; King, I.B.; Weng, L.C.; Bhattacharya, S.; et al. Genetic loci associated with plasma phospholipid n-3 fatty acids: A meta-analysis of genome-wide association studies from the CHARGE Consortium. PLoS Genet. 2011, 7, e1002193. [Google Scholar] [CrossRef] [PubMed] [Green Version]
- O’Seaghdha, C.M.; Wu, H.; Yang, Q.; Kapur, K.; Guessous, I.; Zuber, A.M.; Kottgen, A.; Stoudmann, C.; Teumer, A.; Kutalik, Z.; et al. Meta-analysis of genome-wide association studies identifies six new Loci for serum calcium concentrations. PLoS Genet. 2013, 9, e1003796. [Google Scholar] [CrossRef] [Green Version]
- Benyamin, B.; Esko, T.; Ried, J.S.; Radhakrishnan, A.; Vermeulen, S.H.; Traglia, M.; Gogele, M.; Anderson, D.; Broer, L.; Podmore, C.; et al. Novel loci affecting iron homeostasis and their effects in individuals at risk for hemochromatosis. Nat. Commun. 2014, 5, 4926. [Google Scholar] [CrossRef] [Green Version]
- Meyer, T.E.; Verwoert, G.C.; Hwang, S.J.; Glazer, N.L.; Smith, A.V.; van Rooij, F.J.; Ehret, G.B.; Boerwinkle, E.; Felix, J.F.; Leak, T.S.; et al. Genome-wide association studies of serum magnesium, potassium, and sodium concentrations identify six Loci influencing serum magnesium levels. PLoS Genet. 2010, 6, e1001045. [Google Scholar] [CrossRef] [Green Version]
- Kestenbaum, B.; Glazer, N.L.; Kottgen, A.; Felix, J.F.; Hwang, S.J.; Liu, Y.; Lohman, K.; Kritchevsky, S.B.; Hausman, D.B.; Petersen, A.K.; et al. Common genetic variants associate with serum phosphorus concentration. J. Am. Soc. Nephrol. 2010, 21, 1223–1232. [Google Scholar] [CrossRef] [Green Version]
- Cornelis, M.C.; Fornage, M.; Foy, M.; Xun, P.; Gladyshev, V.N.; Morris, S.; Chasman, D.I.; Hu, F.B.; Rimm, E.B.; Kraft, P.; et al. Genome-wide association study of selenium concentrations. Hum. Mol. Genet. 2015, 24, 1469–1477. [Google Scholar] [CrossRef] [Green Version]
- Evans, D.M.; Zhu, G.; Dy, V.; Heath, A.C.; Madden, P.A.; Kemp, J.P.; McMahon, G.; St Pourcain, B.; Timpson, N.J.; Golding, J.; et al. Genome-wide association study identifies loci affecting blood copper, selenium and zinc. Hum. Mol. Genet. 2013, 22, 3998–4006. [Google Scholar] [CrossRef] [PubMed] [Green Version]
- Sinnott-Armstrong, N.; Tanigawa, Y.; Amar, D.; Mars, N.; Benner, C.; Aguirre, M.; Venkataraman, G.R.; Wainberg, M.; Ollila, H.M.; Kiiskinen, T.; et al. Genetics of 35 blood and urine biomarkers in the UK Biobank. Nat. Genet. 2021, 53, 185–194. [Google Scholar] [CrossRef] [PubMed]
- D’Adamo, C.R.; D’Urso, A.; Ryan, K.A.; Yerges-Armstrong, L.M.; Semba, R.D.; Steinle, N.I.; Mitchell, B.D.; Shuldiner, A.R.; McArdle, P.F. A Common Variant in the SETD7 Gene Predicts Serum Lycopene Concentrations. Nutrients 2016, 8, 82. [Google Scholar] [CrossRef] [PubMed] [Green Version]
- Ferrucci, L.; Perry, J.R.; Matteini, A.; Perola, M.; Tanaka, T.; Silander, K.; Rice, N.; Melzer, D.; Murray, A.; Cluett, C.; et al. Common variation in the beta-carotene 15,15′-monooxygenase 1 gene affects circulating levels of carotenoids: A genome-wide association study. Am. J. Hum. Genet. 2009, 84, 123–133. [Google Scholar] [CrossRef] [PubMed] [Green Version]
- Hazra, A.; Kraft, P.; Lazarus, R.; Chen, C.; Chanock, S.J.; Jacques, P.; Selhub, J.; Hunter, D.J. Genome-wide significant predictors of metabolites in the one-carbon metabolism pathway. Hum. Mol. Genet. 2009, 18, 4677–4687. [Google Scholar] [CrossRef]
- Grarup, N.; Sulem, P.; Sandholt, C.H.; Thorleifsson, G.; Ahluwalia, T.S.; Steinthorsdottir, V.; Bjarnason, H.; Gudbjartsson, D.F.; Magnusson, O.T.; Sparso, T.; et al. Genetic architecture of vitamin B12 and folate levels uncovered applying deeply sequenced large datasets. PLoS Genet. 2013, 9, e1003530. [Google Scholar] [CrossRef] [PubMed] [Green Version]
- Zheng, J.S.; Luan, J.; Sofianopoulou, E.; Imamura, F.; Stewart, I.D.; Day, F.R.; Pietzner, M.; Wheeler, E.; Lotta, L.A.; Gundersen, T.E.; et al. Plasma Vitamin C and Type 2 Diabetes: Genome-Wide Association Study and Mendelian Randomization Analysis in European Populations. Diabetes Care 2021, 44, 98–106. [Google Scholar] [CrossRef]
- Manousaki, D.; Mitchell, R.; Dudding, T.; Haworth, S.; Harroud, A.; Forgetta, V.; Shah, R.L.; Luan, J.; Langenberg, C.; Timpson, N.J.; et al. Genome-wide Association Study for Vitamin D Levels Reveals 69 Independent Loci. Am. J. Hum. Genet. 2020, 106, 327–337. [Google Scholar] [CrossRef]
- Major, J.M.; Yu, K.; Wheeler, W.; Zhang, H.; Cornelis, M.C.; Wright, M.E.; Yeager, M.; Snyder, K.; Weinstein, S.J.; Mondul, A.; et al. Genome-wide association study identifies common variants associated with circulating vitamin E levels. Hum. Mol. Genet. 2011, 20, 3876–3883. [Google Scholar] [CrossRef]
- Long, T.; Hicks, M.; Yu, H.C.; Biggs, W.H.; Kirkness, E.F.; Menni, C.; Zierer, J.; Small, K.S.; Mangino, M.; Messier, H.; et al. Whole-genome sequencing identifies common-to-rare variants associated with human blood metabolites. Nat. Genet. 2017, 49, 568–578. [Google Scholar] [CrossRef] [PubMed]
- Van Rheenen, W.; van der Spek, R.A.A.; Bakker, M.K.; van Vugt, J.; Hop, P.J.; Zwamborn, R.A.J.; de Klein, N.; Westra, H.J.; Bakker, O.B.; Deelen, P.; et al. Common and rare variant association analyses in amyotrophic lateral sclerosis identify 15 risk loci with distinct genetic architectures and neuron-specific biology. Nat. Genet. 2021, 53, 1636–1648. [Google Scholar] [CrossRef]
- Alexander, T.A.; Machiela, M.J. LDpop: An interactive online tool to calculate and visualize geographic LD patterns. BMC Bioinform. 2020, 21, 14. [Google Scholar] [CrossRef]
- Shim, H.; Chasman, D.I.; Smith, J.D.; Mora, S.; Ridker, P.M.; Nickerson, D.A.; Krauss, R.M.; Stephens, M. A multivariate genome-wide association analysis of 10 LDL subfractions, and their response to statin treatment, in 1868 Caucasians. PLoS ONE 2015, 10, e0120758. [Google Scholar] [CrossRef] [Green Version]
- Palmer, T.M.; Lawlor, D.A.; Harbord, R.M.; Sheehan, N.A.; Tobias, J.H.; Timpson, N.J.; Davey Smith, G.; Sterne, J.A. Using multiple genetic variants as instrumental variables for modifiable risk factors. Stat. Methods Med. Res. 2012, 21, 223–242. [Google Scholar] [CrossRef] [Green Version]
- Verbanck, M.; Chen, C.Y.; Neale, B.; Do, R. Detection of widespread horizontal pleiotropy in causal relationships inferred from Mendelian randomization between complex traits and diseases. Nat. Genet. 2018, 50, 693–698. [Google Scholar] [CrossRef]
- Burgess, S.; Bowden, J.; Fall, T.; Ingelsson, E.; Thompson, S.G. Sensitivity Analyses for Robust Causal Inference from Mendelian Randomization Analyses with Multiple Genetic Variants. Epidemiology 2017, 28, 30–42. [Google Scholar] [CrossRef] [Green Version]
- Bowden, J.; Davey Smith, G.; Haycock, P.C.; Burgess, S. Consistent Estimation in Mendelian Randomization with Some Invalid Instruments Using a Weighted Median Estimator. Genet. Epidemiol. 2016, 40, 304–314. [Google Scholar] [CrossRef] [Green Version]
- Burgess, S.; Thompson, S.G. Interpreting findings from Mendelian randomization using the MR-Egger method. Eur. J. Epidemiol. 2017, 32, 377–389. [Google Scholar] [CrossRef] [Green Version]
- Hemani, G.; Zheng, J.; Elsworth, B.; Wade, K.H.; Haberland, V.; Baird, D.; Laurin, C.; Burgess, S.; Bowden, J.; Langdon, R.; et al. The MR-Base platform supports systematic causal inference across the human phenome. eLife 2018, 7, e34408. [Google Scholar] [CrossRef]
- Norheim, F.; Gjelstad, I.M.; Hjorth, M.; Vinknes, K.J.; Langleite, T.M.; Holen, T.; Jensen, J.; Dalen, K.T.; Karlsen, A.S.; Kielland, A.; et al. Molecular nutrition research: The modern way of performing nutritional science. Nutrients 2012, 4, 1898–1944. [Google Scholar] [CrossRef] [Green Version]
- Hussein, N.; Ah-Sing, E.; Wilkinson, P.; Leach, C.; Griffin, B.A.; Millward, D.J. Long-chain conversion of [13C]linoleic acid and alpha-linolenic acid in response to marked changes in their dietary intake in men. J. Lipid Res. 2005, 46, 269–280. [Google Scholar] [CrossRef] [Green Version]
- Nilsen, D.W.T.; Myhre, P.L.; Kalstad, A.; Schmidt, E.B.; Arnesen, H.; Seljeflot, I. Serum Levels of Dihomo-Gamma (gamma)-Linolenic Acid (DGLA) Are Inversely Associated with Linoleic Acid and Total Death in Elderly Patients with a Recent Myocardial Infarction. Nutrients 2021, 13, 3475. [Google Scholar] [CrossRef]
- Marangoni, F.; Agostoni, C.; Borghi, C.; Catapano, A.L.; Cena, H.; Ghiselli, A.; La Vecchia, C.; Lercker, G.; Manzato, E.; Pirillo, A.; et al. Dietary linoleic acid and human health: Focus on cardiovascular and cardiometabolic effects. Atherosclerosis 2020, 292, 90–98. [Google Scholar] [CrossRef] [Green Version]
- Sato, M.; Shibata, K.; Nomura, R.; Kawamoto, D.; Nagamine, R.; Imaizumi, K. Linoleic acid-rich fats reduce atherosclerosis development beyond its oxidative and inflammatory stress-increasing effect in apolipoprotein E-deficient mice in comparison with saturated fatty acid-rich fats. Br. J. Nutr. 2005, 94, 896–901. [Google Scholar] [CrossRef] [Green Version]
- Turpeinen, A.M.; Basu, S.; Mutanen, M. A high linoleic acid diet increases oxidative stress in vivo and affects nitric oxide metabolism in humans. Prostaglandins Leukot. Essent. Fat. Acids 1998, 59, 229–233. [Google Scholar] [CrossRef]
- Obrador, E.; Salvador, R.; Lopez-Blanch, R.; Jihad-Jebbar, A.; Valles, S.L.; Estrela, J.M. Oxidative Stress, Neuroinflammation and Mitochondria in the Pathophysiology of Amyotrophic Lateral Sclerosis. Antioxidants 2020, 9, 901. [Google Scholar] [CrossRef]
- Toborek, M.; Blanc, E.M.; Kaiser, S.; Mattson, M.P.; Hennig, B. Linoleic acid potentiates TNF-mediated oxidative stress, disruption of calcium homeostasis, and apoptosis of cultured vascular endothelial cells. J. Lipid Res. 1997, 38, 2155–2167. [Google Scholar] [CrossRef]
- Hensley, K.; Mhatre, M.; Mou, S.; Pye, Q.N.; Stewart, C.; West, M.; Williamson, K.S. On the relation of oxidative stress to neuroinflammation: Lessons learned from the G93A-SOD1 mouse model of amyotrophic lateral sclerosis. Antioxid. Redox Signal. 2006, 8, 2075–2087. [Google Scholar] [CrossRef]
- Chan, J.K.; McDonald, B.E.; Gerrard, J.M.; Bruce, V.M.; Weaver, B.J.; Holub, B.J. Effect of dietary alpha-linolenic acid and its ratio to linoleic acid on platelet and plasma fatty acids and thrombogenesis. Lipids 1993, 28, 811–817. [Google Scholar] [CrossRef]
- Wang, M.; Ma, L.J.; Yang, Y.; Xiao, Z.; Wan, J.B. n-3 Polyunsaturated fatty acids for the management of alcoholic liver disease: A critical review. Crit. Rev. Food Sci. Nutr. 2019, 59, S116–S129. [Google Scholar] [CrossRef]
- Torres, P.; Cacabelos, D.; Pairada, J.; Bauer, K.C.; Boada, J.; Fontdevila, L.; Rossi, C.; Povedano, M.; Ferrer, I.; Pamplona, R.; et al. Gender-Specific Beneficial Effects of Docosahexaenoic Acid Dietary Supplementation in G93A-SOD1 Amyotrophic Lateral Sclerosis Mice. Neurotherapeutics 2020, 17, 269–281. [Google Scholar] [CrossRef]
- Innes, J.K.; Calder, P.C. Omega-6 fatty acids and inflammation. Prostaglandins Leukot. Essent. Fat. Acids 2018, 132, 41–48. [Google Scholar] [CrossRef] [Green Version]
- Amini, S.; Jafarirad, S.; Amani, R. Postpartum depression and vitamin D: A systematic review. Crit. Rev. Food Sci. Nutr. 2019, 59, 1514–1520. [Google Scholar] [CrossRef]
- Camu, W.; Tremblier, B.; Plassot, C.; Alphandery, S.; Salsac, C.; Pageot, N.; Juntas-Morales, R.; Scamps, F.; Daures, J.P.; Raoul, C. Vitamin D confers protection to motoneurons and is a prognostic factor of amyotrophic lateral sclerosis. Neurobiol. Aging 2014, 35, 1198–1205. [Google Scholar] [CrossRef]
- Juntas-Morales, R.; Pageot, N.; Marin, G.; Dupuy, A.M.; Alphandery, S.; Labar, L.; Esselin, F.; Picot, M.C.; Camu, W. Low 25OH Vitamin D Blood Levels Are Independently Associated With Higher Amyotrophic Lateral Sclerosis Severity Scores: Results From a Prospective Study. Front. Neurol. 2020, 11, 363. [Google Scholar] [CrossRef]
- Rothstein, J.D. Excitotoxicity hypothesis. Neurology 1996, 47, S19–S25, discussion S26. [Google Scholar] [CrossRef]
- Jaiswal, M.K. Calcium, mitochondria, and the pathogenesis of ALS: The good, the bad, and the ugly. Front. Cell. Neurosci. 2013, 7, 199. [Google Scholar] [CrossRef] [Green Version]
- Ibi, M.; Sawada, H.; Nakanishi, M.; Kume, T.; Katsuki, H.; Kaneko, S.; Shimohama, S.; Akaike, A. Protective effects of 1 alpha,25-(OH)(2)D(3) against the neurotoxicity of glutamate and reactive oxygen species in mesencephalic culture. Neuropharmacology 2001, 40, 761–771. [Google Scholar] [CrossRef]
- Kajta, M.; Makarewicz, D.; Zieminska, E.; Jantas, D.; Domin, H.; Lason, W.; Kutner, A.; Lazarewicz, J.W. Neuroprotection by co-treatment and post-treating with calcitriol following the ischemic and excitotoxic insult in vivo and in vitro. Neurochem. Int. 2009, 55, 265–274. [Google Scholar] [CrossRef]
- Larsson, S.C.; Roos, P.M. Serum 25-hydroxyvitamin D in amyotrophic lateral sclerosis: Mendelian randomization study. Neurobiol. Aging 2020, 87, 140.e1–140.e3. [Google Scholar] [CrossRef]
- Jiang, X.; O’Reilly, P.F.; Aschard, H.; Hsu, Y.H.; Richards, J.B.; Dupuis, J.; Ingelsson, E.; Karasik, D.; Pilz, S.; Berry, D.; et al. Genome-wide association study in 79,366 European-ancestry individuals informs the genetic architecture of 25-hydroxyvitamin D levels. Nat. Commun. 2018, 9, 260. [Google Scholar] [CrossRef]
- Goncharova, P.S.; Davydova, T.K.; Popova, T.E.; Novitsky, M.A.; Petrova, M.M.; Gavrilyuk, O.A.; Al-Zamil, M.; Zhukova, N.G.; Nasyrova, R.F.; Shnayder, N.A. Nutrient Effects on Motor Neurons and the Risk of Amyotrophic Lateral Sclerosis. Nutrients 2021, 13, 3804. [Google Scholar] [CrossRef] [PubMed]
- Carrera-Julia, S.; Moreno, M.L.; Barrios, C.; de la Rubia Orti, J.E.; Drehmer, E. Antioxidant Alternatives in the Treatment of Amyotrophic Lateral Sclerosis: A Comprehensive Review. Front. Physiol. 2020, 11, 63. [Google Scholar] [CrossRef] [Green Version]
- Ascherio, A.; Weisskopf, M.G.; O’Reilly, E.J.; Jacobs, E.J.; McCullough, M.L.; Calle, E.E.; Cudkowicz, M.; Thun, M.J. Vitamin E intake and risk of amyotrophic lateral sclerosis. Ann. Neurol. 2005, 57, 104–110. [Google Scholar] [CrossRef]
- Veldink, J.H.; Kalmijn, S.; Groeneveld, G.J.; Wunderink, W.; Koster, A.; de Vries, J.H.; van der Luyt, J.; Wokke, J.H.; Van den Berg, L.H. Intake of polyunsaturated fatty acids and vitamin E reduces the risk of developing amyotrophic lateral sclerosis. J. Neurol. Neurosurg. Psychiatry 2007, 78, 367–371. [Google Scholar] [CrossRef] [Green Version]
- Willer, C.J.; Schmidt, E.M.; Sengupta, S.; Peloso, G.M.; Gustafsson, S.; Kanoni, S.; Ganna, A.; Chen, J.; Buchkovich, M.L.; Mora, S.; et al. Discovery and refinement of loci associated with lipid levels. Nat. Genet. 2013, 45, 1274–1283. [Google Scholar] [CrossRef] [PubMed] [Green Version]
- Bjornevik, K.; O’Reilly, E.J.; Berry, J.D.; Clish, C.B.; Jeanfavre, S.; Kato, I.; Kolonel, L.N.; Le Marchand, L.; McCullough, M.L.; Paganoni, S.; et al. Prediagnostic plasma branched-chain amino acids and the risk of amyotrophic lateral sclerosis. Neurology 2019, 92, e2081–e2088. [Google Scholar] [CrossRef] [Green Version]
- Peters, S.; Broberg, K.; Gallo, V.; Levi, M.; Kippler, M.; Vineis, P.; Veldink, J.; van den Berg, L.; Middleton, L.; Travis, R.C.; et al. Blood Metal Levels and Amyotrophic Lateral Sclerosis Risk: A Prospective Cohort. Ann. Neurol. 2021, 89, 125–133. [Google Scholar] [CrossRef]
- Traber, M.G.; Leonard, S.W.; Bobe, G.; Fu, X.; Saltzman, E.; Grusak, M.A.; Booth, S.L. Alpha-Tocopherol disappearance rates from plasma depend on lipid concentrations: Studies using deuterium-labeled collard greens in younger and older adults. Am. J. Clin. Nutr. 2015, 101, 752–759. [Google Scholar] [CrossRef] [PubMed] [Green Version]


| Exposures | Methods | No. SNPs | OR (95%CI) | p Value |
|---|---|---|---|---|
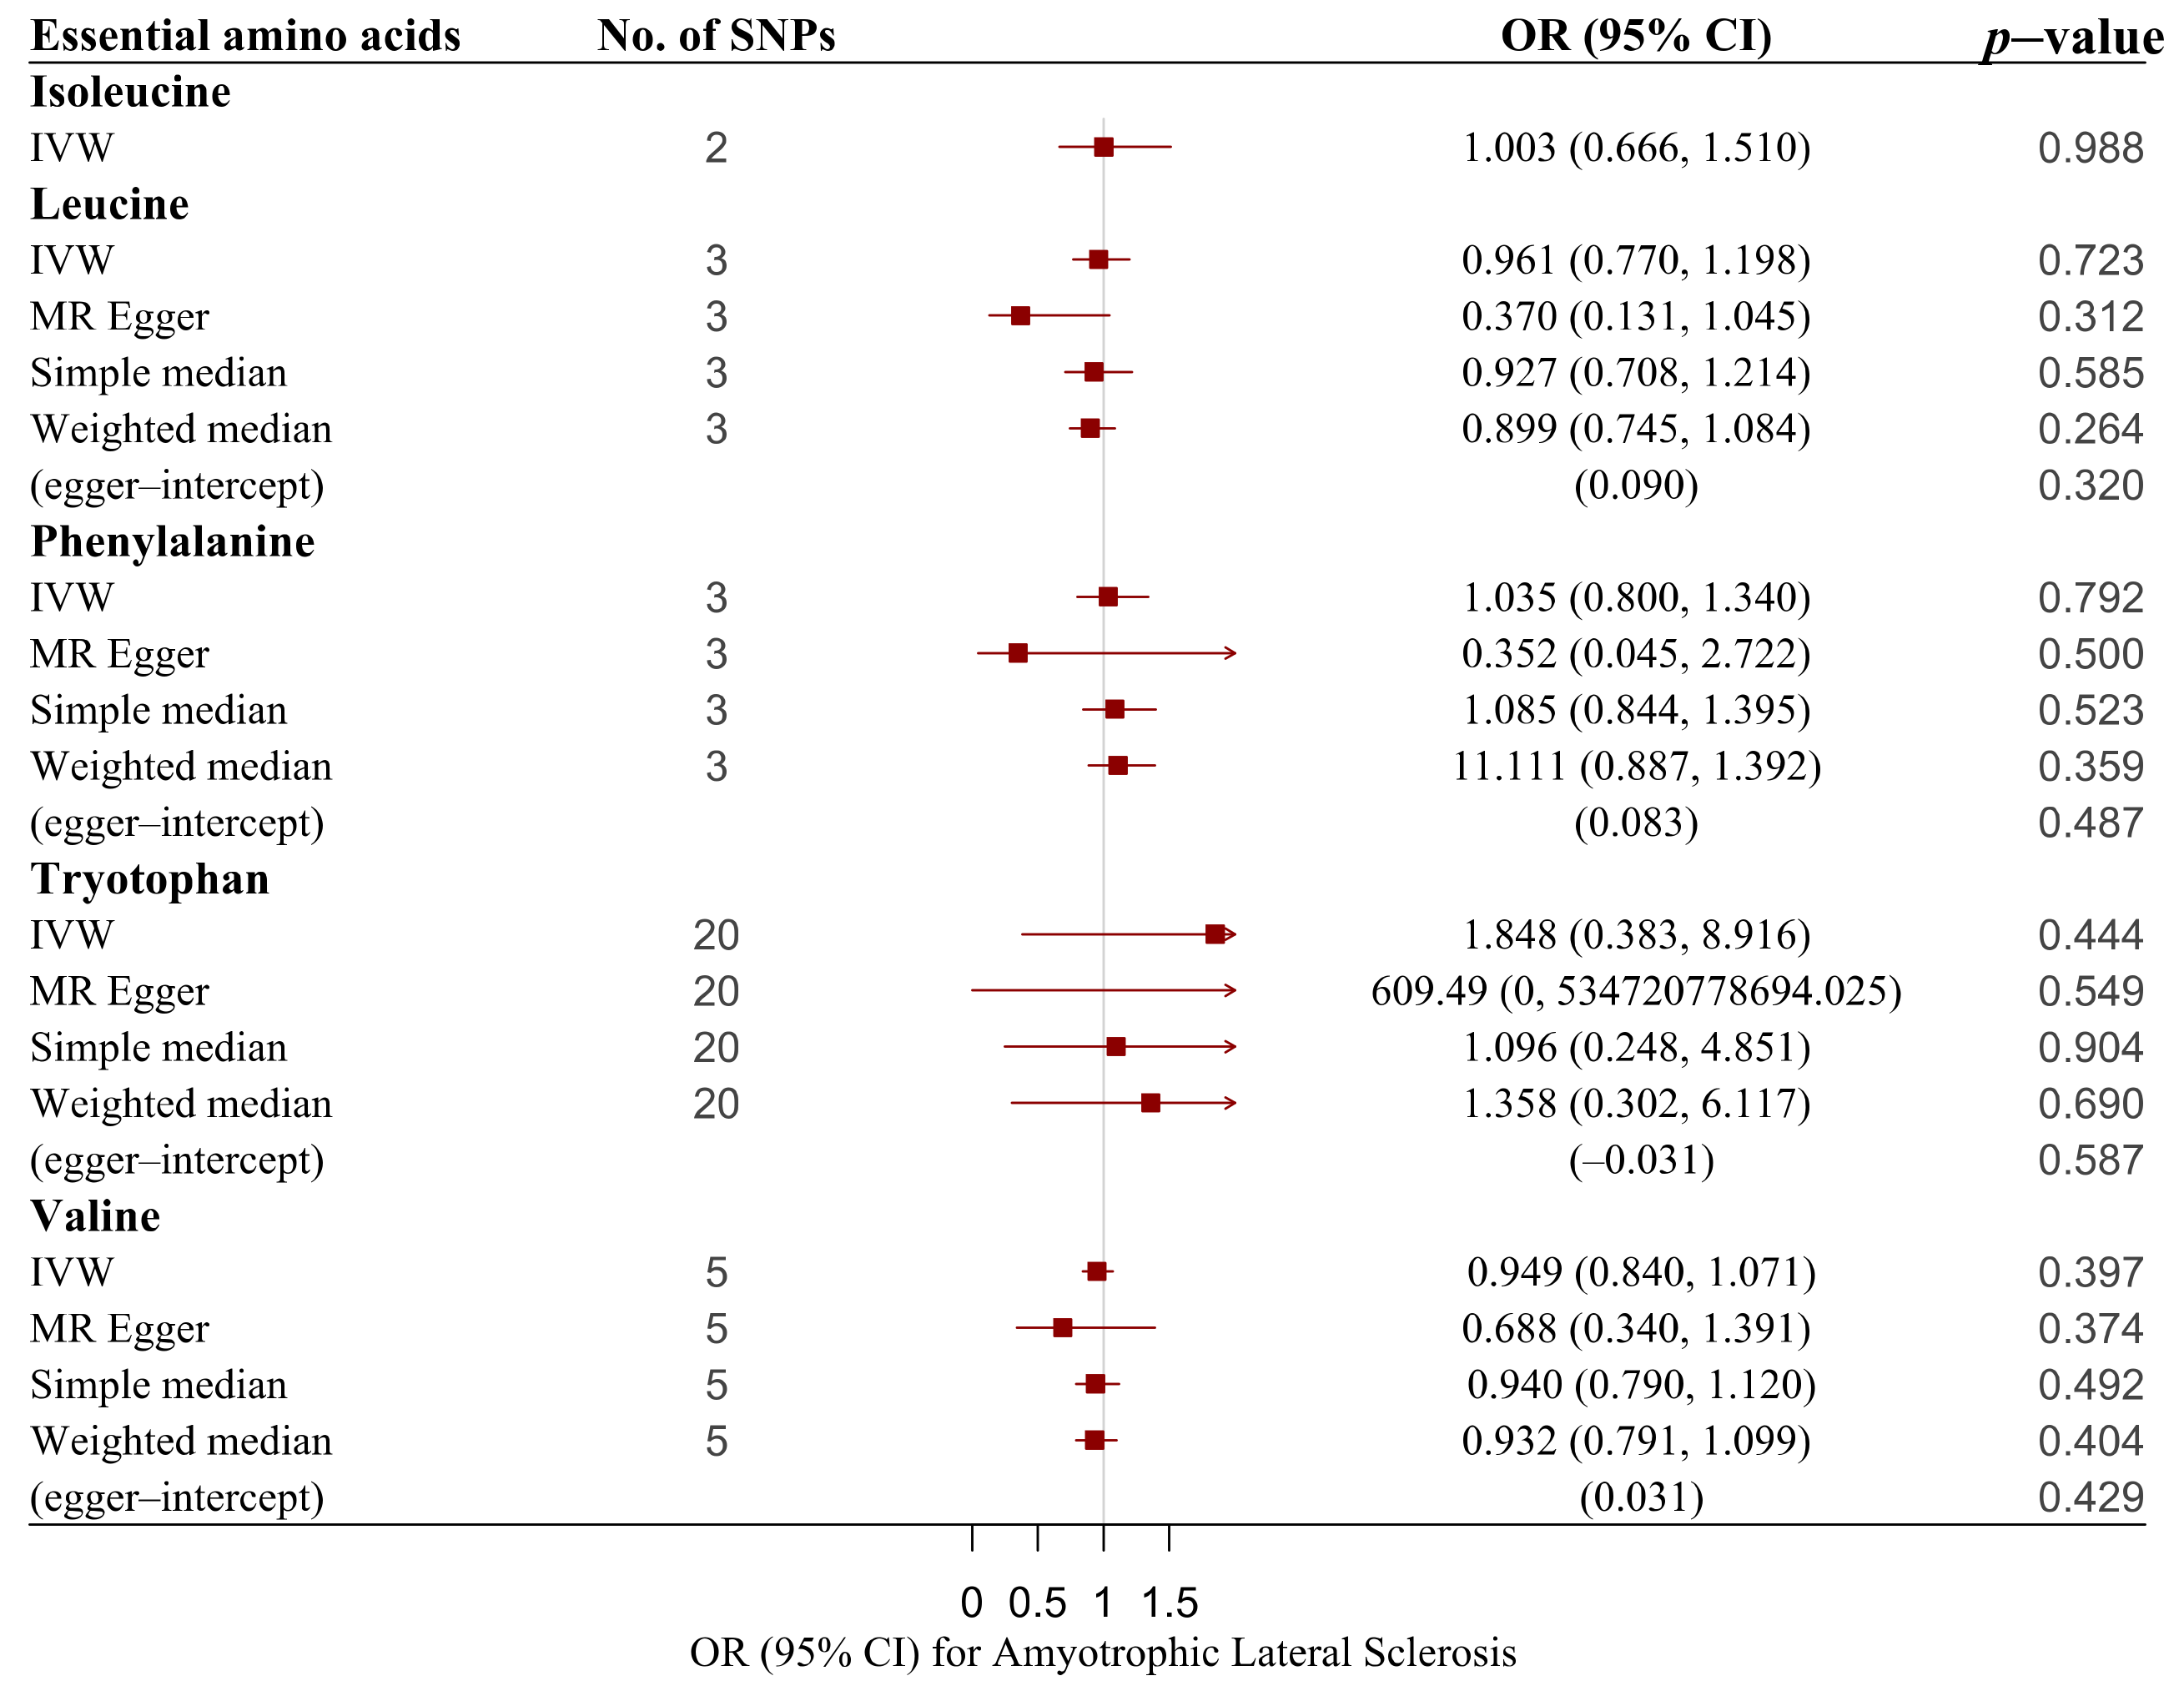
| Essential amino acids | ||||
| Isoleucine | IVW | 2 | 1.003 (0.666, 1.510) | 0.988 |
| Leucine | IVW | 3 | 0.961 (0.770, 1.198) | 0.723 |
| Leucine | MR–Egger | 3 | 0.370 (0.131, 1.045) | 0.312 |
| Leucine | Simple median | 3 | 0.927 (0.708, 1.214) | 0.583 |
| Leucine | Weighted median | 3 | 0.899 (0.745, 1.084) | 0.264 |
| Phenylalanine | IVW | 3 | 1.035 (0.800, 1.340) | 0.792 |
| Phenylalanine | MR–Egger | 3 | 0.352 (0.045, 2.722) | 0.500 |
| Phenylalanine | Simple median | 3 | 1.085 (0.844, 1.395) | 0.523 |
| Phenylalanine | Weighted median | 3 | 1.111 (0.887, 1.392) | 0.359 |
| Tryptophan | IVW | 20 | 1.848 (0.383, 8.916) | 0.444 |
| Tryptophan | MR–Egger | 20 | 609.49 (0, 534, 720, 778, 694.025) | 0.549 |
| Tryptophan | Simple median | 20 | 1.096 (0.248, 4.851) | 0.904 |
| Tryptophan | Weighted median | 20 | 1.358 (0.302, 6.117) | 0.690 |
| Valine | IVW | 5 | 0.949 (0.840, 1.071) | 0.397 |
| Valine | MR–Egger | 5 | 0.688 (0.340, 1.391) | 0.374 |
| Valine | Simple median | 5 | 0.94 (0.790, 1.120) | 0.492 |
| Valine | Weighted median | 5 | 0.932 (0.791, 1.099) | 0.404 |
| Essential polyunsaturated fatty acids | ||||
| Arachidonic acid (AA) | IVW | 2 | 0.995 (0.984, 1.007) | 0.415 |
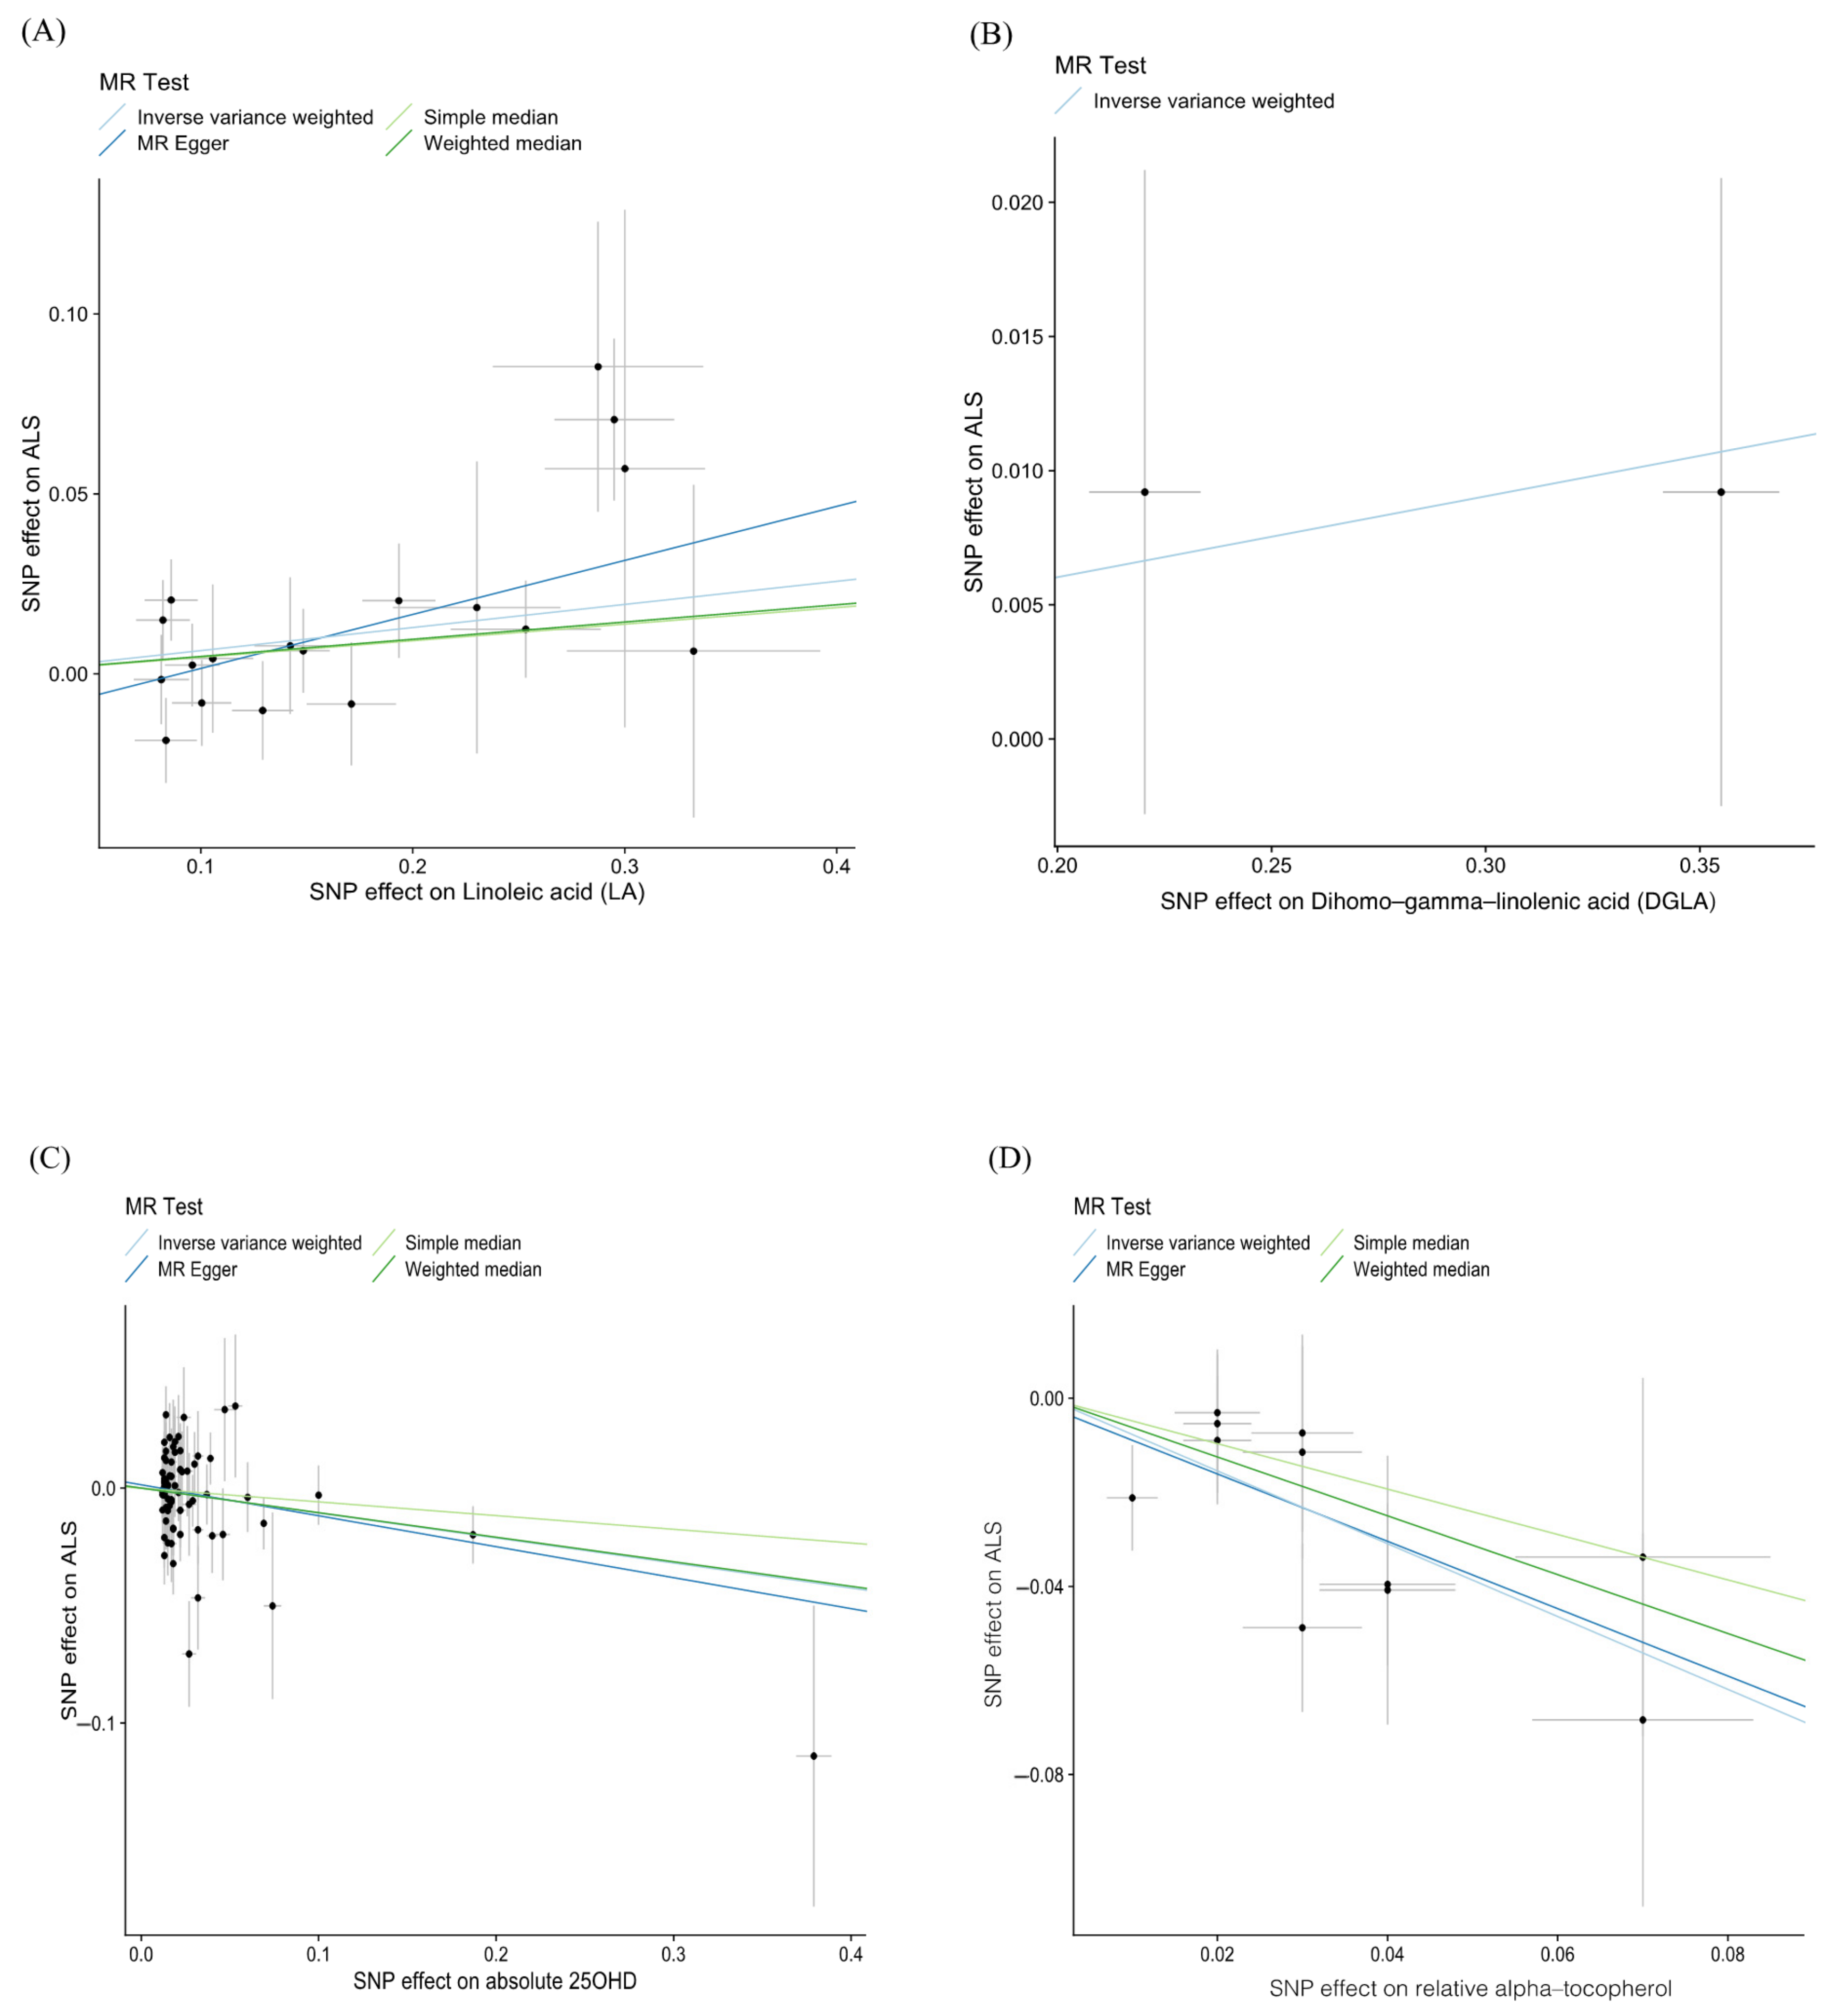
| Dihomo-gamma-linolenic acid (DGLA) | IVW | 2 | 1.031 (1.017, 1.045) | 1.70 × 10⁻⁵ |
| Docosahexaenoic acid (DHA) | IVW | 5 | 1.048 (0.924, 1.190) | 0.464 |
| Docosahexaenoic acid (DHA) | MR–Egger | 5 | 1.013 (0.427, 2.403) | 0.978 |
| Docosahexaenoic acid (DHA) | Simple median | 5 | 1.147 (0.971, 1.355) | 0.106 |
| Docosahexaenoic acid (DHA) | Weighted median | 5 | 1.008 (0.889, 1.143) | 0.902 |
| Docosapentaenoic acid (DPA) | IVW | 3 | 0.874 (0.607, 1.257) | 0.466 |
| Docosapentaenoic acid (DPA) | MR–Egger | 3 | 0.660 (0.276, 1.576) | 0.521 |
| Docosapentaenoic acid (DPA) | Simple median | 3 | 0.885 (0.635, 1.233) | 0.469 |
| Docosapentaenoic acid (DPA) | Weighted median | 3 | 0.840 (0.645, 1.095) | 0.198 |
| Eicosapentaenoic acid (EPA) | IVW | 2 | 0.872 (0.647, 1.175) | 0.367 |
| Gamma linolenic acid (GLA) | IVW | 2 | 0.724 (0.184, 2.844) | 0.643 |
| Linoleic acid (LA) | IVW | 18 | 1.066 (1.011, 1.125) | 0.019 |
| Linoleic acid (LA) | MR–Egger | 18 | 1.162 (1.029, 1.312) | 0.028 |
| Linoleic acid (LA) | Simple median | 18 | 1.047 (0.972, 1.128) | 0.226 |
| Linoleic acid (LA) | Weighted median | 18 | 1.049 (0.976, 1.128) | 0.196 |
| Minerals | ||||
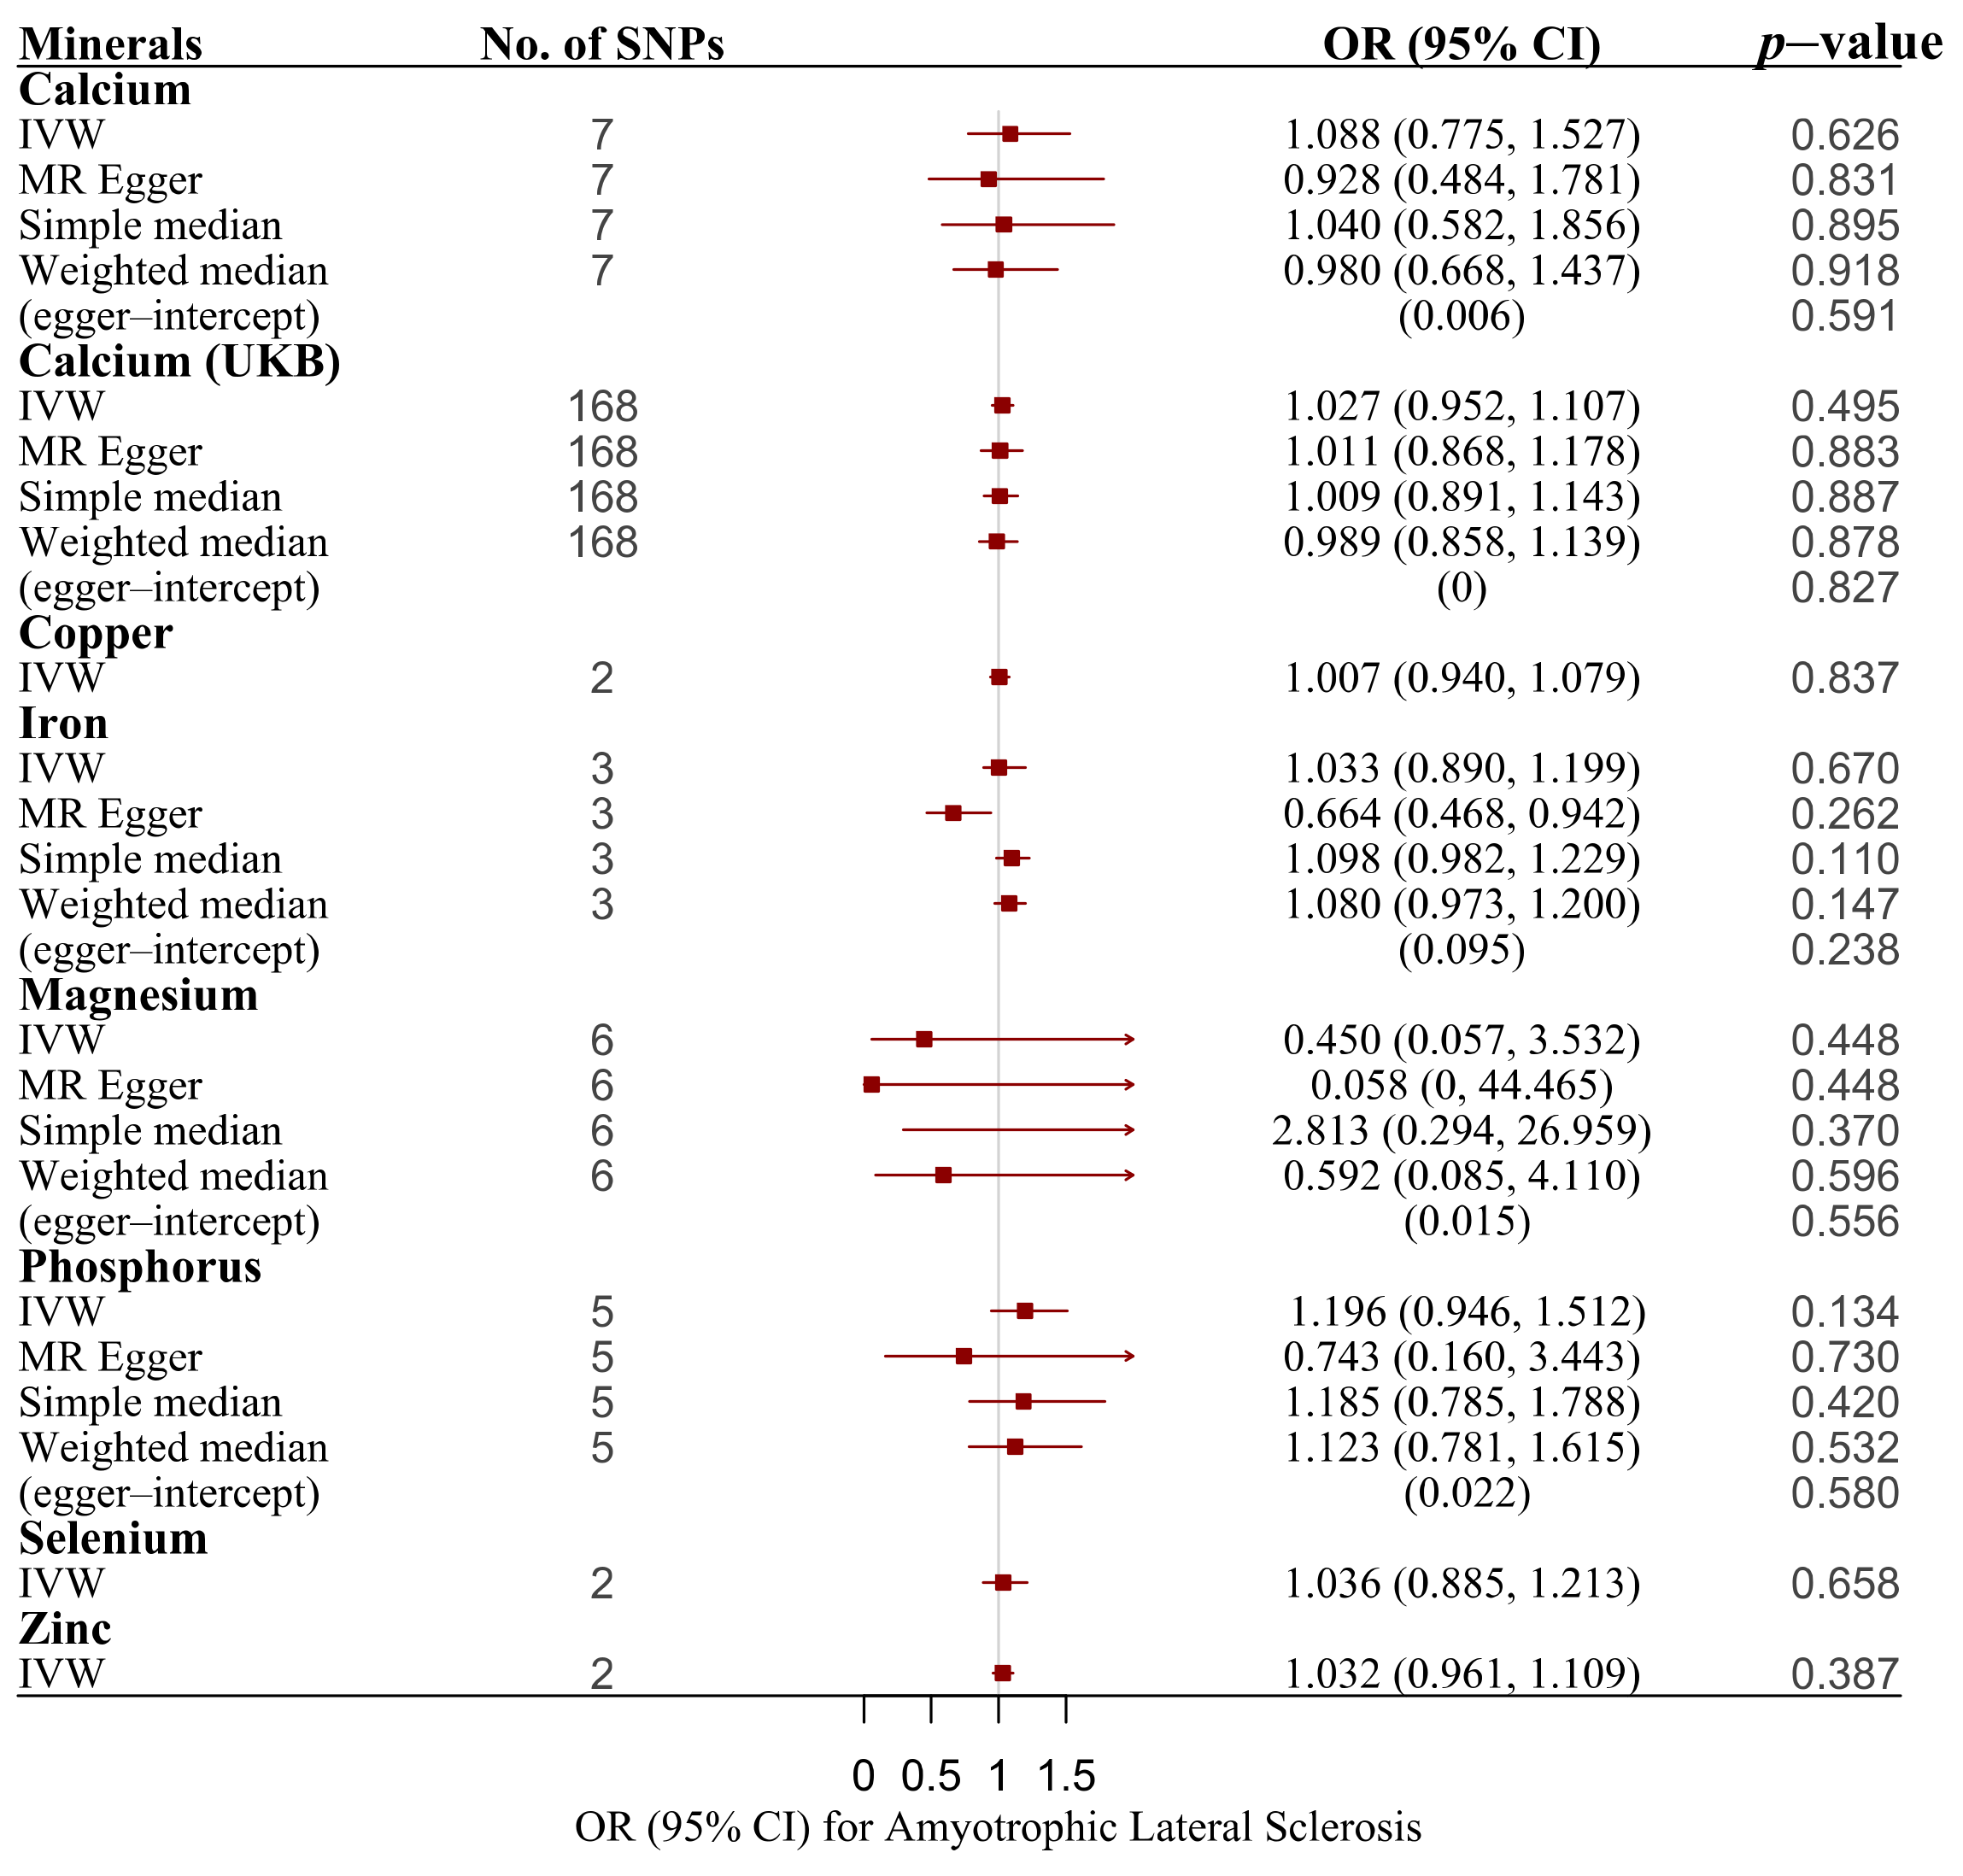
| Calcium | IVW | 7 | 1.088 (0.775, 1.527) | 0.626 |
| Calcium | MR–Egger | 7 | 0.928 (0.484, 1.781) | 0.831 |
| Calcium | Simple median | 7 | 1.04 (0.582, 1.856) | 0.895 |
| Calcium | Weighted median | 7 | 0.98 (0.668, 1.437) | 0.918 |
| Calcium (UKB) | IVW | 168 | 1.027 (0.952, 1.107) | 0.495 |
| Calcium (UKB) | MR–Egger | 168 | 1.011 (0.868, 1.178) | 0.883 |
| Calcium (UKB) | Simple median | 168 | 1.009 (0.891, 1.143) | 0.887 |
| Calcium (UKB) | Weighted median | 168 | 0.989 (0.858, 1.139) | 0.878 |
| Copper | IVW | 2 | 1.007 (0.940, 1.079) | 0.837 |
| Iron | IVW | 3 | 1.033 (0.890, 1.199) | 0.670 |
| Iron | MR–Egger | 3 | 0.664 (0.468, 0.942) | 0.262 |
| Iron | Simple median | 3 | 1.098 (0.982, 1.229) | 0.100 |
| Iron | Weighted median | 3 | 1.080 (0.973, 1.200) | 0.147 |
| Magnesium | IVW | 6 | 0.450 (0.057, 3.532) | 0.448 |
| Magnesium | MR–Egger | 6 | 0.058 (0, 44.465) | 0.448 |
| Magnesium | Simple median | 6 | 2.813 (0.294, 26.959) | 0.370 |
| Magnesium | Weighted median | 6 | 0.592 (0.085, 4.110) | 0.596 |
| Phosphorus | IVW | 5 | 1.196 (0.946, 1.512) | 0.134 |
| Phosphorus | MR–Egger | 5 | 0.743 (0.160, 3.443) | 0.730 |
| Phosphorus | Simple median | 5 | 1.185 (0.785, 1.788) | 0.420 |
| Phosphorus | Weighted median | 5 | 1.123 (0.781, 1.615) | 0.532 |
| Selenium | IVW | 2 | 1.036 (0.885, 1.213) | 0.658 |
| Zinc | IVW | 2 | 1.032 (0.961, 1.109) | 0.387 |
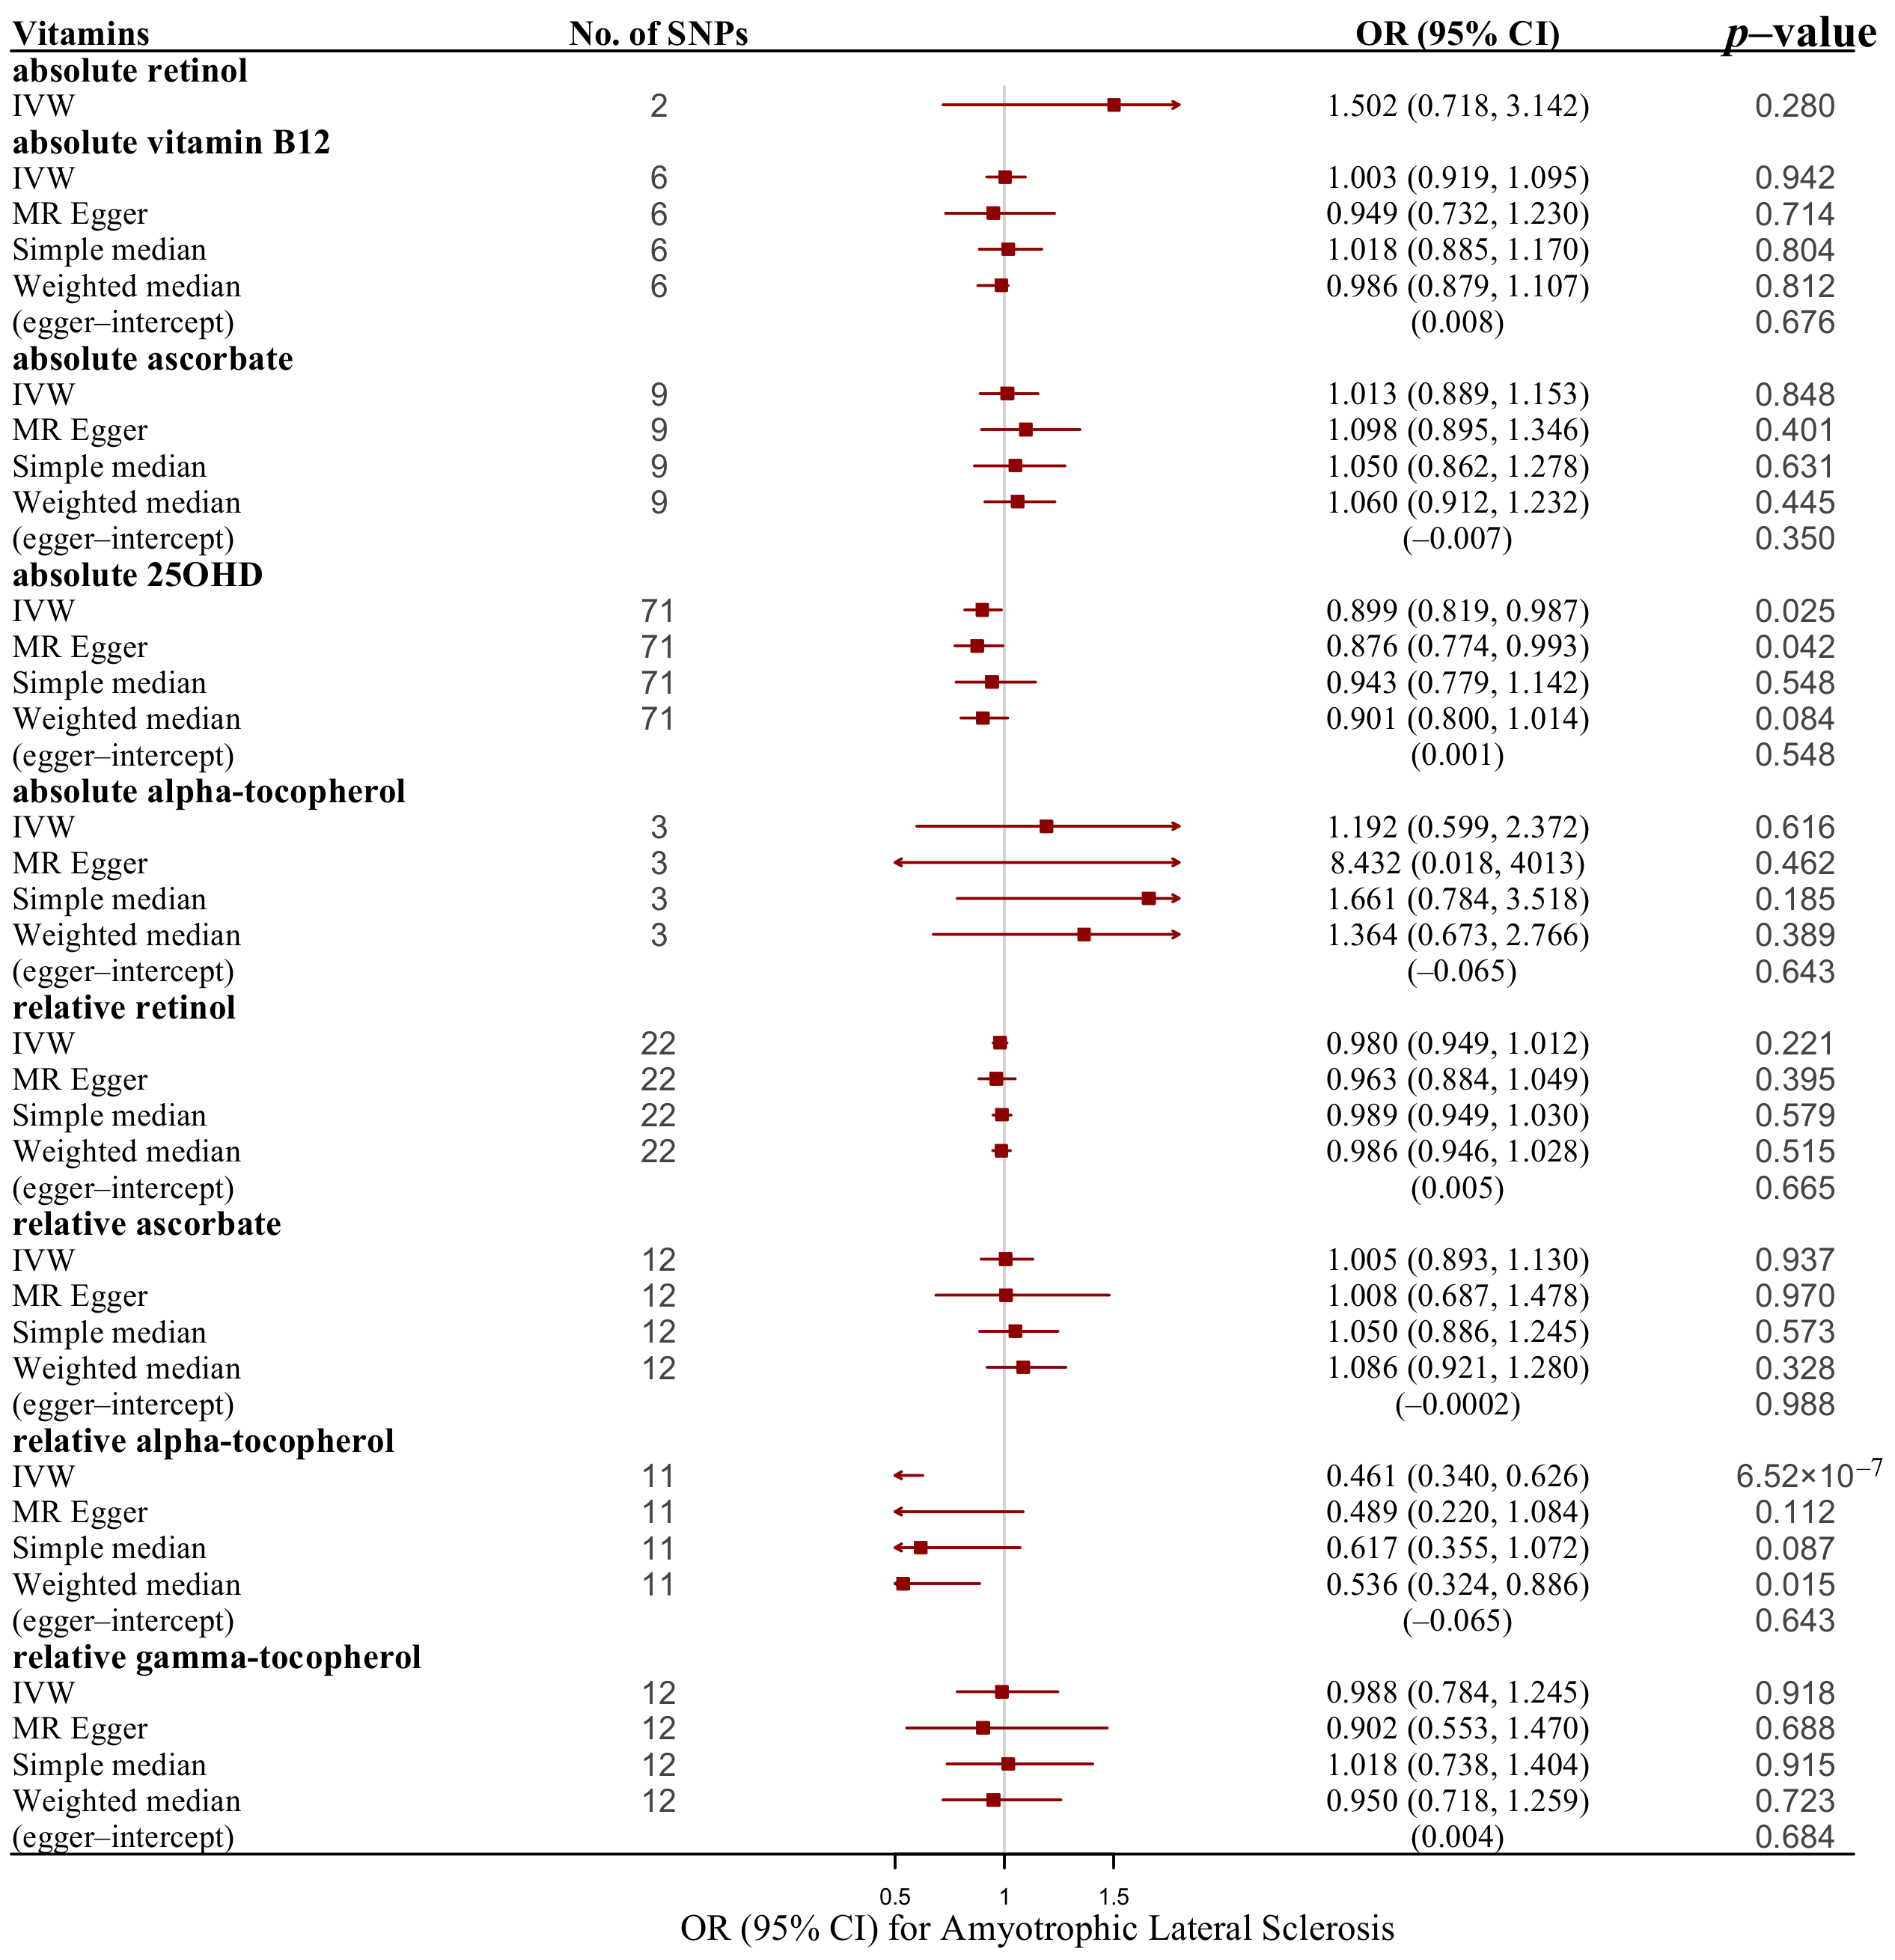
| Vitamins | ||||
| absolute retinol | IVW | 2 | 1.502 (0.718, 3.142) | 0.280 |
| absolute vitamin B-12 | IVW | 6 | 1.003 (0.919, 1.095) | 0.942 |
| absolute vitamin B-12 | MR–Egger | 6 | 0.949 (0.732, 1.230) | 0.714 |
| absolute vitamin B-12 | Simple median | 6 | 1.018 (0.885, 1.170) | 0.804 |
| absolute vitamin B-12 | Weighted median | 6 | 0.986 (0.879, 1.107) | 0.812 |
| absolute ascorbate | IVW | 9 | 1.013 (0.889, 1.153) | 0.848 |
| absolute ascorbate | MR–Egger | 9 | 1.098 (0.895, 1.346) | 0.401 |
| absolute ascorbate | Simple median | 9 | 1.050 (0.862, 1.278) | 0.631 |
| absolute ascorbate | Weighted median | 9 | 1.060 (0.912, 1.232) | 0.445 |
| absolute 25OHD | IVW | 71 | 0.899 (0.819, 0.987) | 0.025 |
| absolute 25OHD | MR–Egger | 71 | 0.876 (0.774, 0.993) | 0.042 |
| absolute 25OHD | Simple median | 71 | 0.943 (0.779, 1.142) | 0.548 |
| absolute 25OHD | Weighted median | 71 | 0.901 (0.800, 1.014) | 0.084 |
| absolute alpha-tocopherol | IVW | 3 | 1.192 (0.599, 2.372) | 0.616 |
| absolute alpha-tocopherol | MR–Egger | 3 | 8.432 (0.018, 4012.598) | 0.621 |
| absolute alpha-tocopherol | Simple median | 3 | 1.661 (0.784, 3.518) | 0.185 |
| absolute alpha-tocopherol | Weighted median | 3 | 1.364 (0.673, 2.766) | 0.389 |
| relative retinol | IVW | 22 | 0.980 (0.949, 1.012) | 0.221 |
| relative retinol | MR–Egger | 22 | 0.963 (0.884, 1.049) | 0.395 |
| relative retinol | Simple median | 22 | 0.989 (0.949, 1.030) | 0.579 |
| relative retinol | Weighted median | 22 | 0.986 (0.946, 1.028) | 0.515 |
| relative ascorbate | IVW | 12 | 1.005 (0.893, 1.130) | 0.937 |
| relative ascorbate | MR–Egger | 12 | 1.008 (0.687, 1.478) | 0.970 |
| relative ascorbate | Simple median | 12 | 1.050 (0.886, 1.245) | 0.573 |
| relative ascorbate | Weighted median | 12 | 1.086 (0.921, 1.280) | 0.328 |
| relative alpha-tocopherol | IVW | 11 | 0.461 (0.340, 0.626) | 6.52 × 10⁻⁷ |
| relative alpha-tocopherol | MR–Egger | 11 | 0.489 (0.220, 1.084) | 0.112 |
| relative alpha-tocopherol | Simple median | 11 | 0.617 (0.355, 1.072) | 0.087 |
| relative alpha-tocopherol | Weighted median | 11 | 0.536 (0.324, 0.886) | 0.015 |
| relative gamma-tocopherol | IVW | 12 | 0.988 (0.784, 1.245) | 0.918 |
| relative gamma-tocopherol | MR–Egger | 12 | 0.902 (0.553, 1.470) | 0.688 |
| relative gamma-tocopherol | Simple median | 12 | 1.018 (0.738, 1.404) | 0.915 |
| relative gamma-tocopherol | Weighted median | 12 | 0.950 (0.718, 1.259) | 0.723 |
| Exposures | F Statistics * | R2 | MR–Egger | Cochran’s Q | MR–PRESSO | MR–Steiger | ||||||
|---|---|---|---|---|---|---|---|---|---|---|---|---|
| Intercept | p | Q | p | RS Sobs | P- Global Test | P- Outlier | P- Distortion | Correct Causal Direction | p | |||
| Essential amino acids | ||||||||||||
| Isoleucine | 32.07 | 0.003 | NA | NA | 4.333 | 0.037 | NA | NA | NA | NA | TRUE | 4.74 × 10⁻²³ |
| Leucine | 32.532 | 0.004 | 0.09 | 0.32 | 4.049 | 0.132 | NA | NA | NA | NA | TRUE | 3.27 × 10−38 |
| Phenylalanine | 26.032 | 0.004 | 0.083 | 0.487 | 3.901 | 0.142 | NA | NA | NA | NA | TRUE | 7.23 × 10⁻³¹ |
| Tryptophan | 16.831 | 0.043 | –0.031 | 0.587 | 52.831 | 0 | 58.666 | <2 × 10⁻⁴ | 0.893 | 0.074 | TRUE | 4.08 × 10−134 |
| Valine | 29.951 | 0.006 | 0.031 | 0.429 | 3.423 | 0.49 | 4.651 | 0.587 | NA | NA | TRUE | 7.73 × 10−61 |
| Polyunsaturated fatty acids | ||||||||||||
| Arachidonic acid (AA) | 1302.627 | 0.233 | NA | NA | 0.725 | 0.395 | NA | NA | NA | NA | TRUE | 2.57 × 10−198 |
| Docosahexaenoic acid (DHA) | 19.211 | 0.007 | 0.004 | 0.943 | 5.774 | 0.217 | 9.826 | 0.26 | NA | NA | TRUE | 2.22 × 10−49 |
| Docosapentaenoic acid (DPA) | 129.675 | 0.044 | 0.016 | 0.603 | 3.878 | 0.144 | NA | NA | NA | NA | TRUE | 5.75 × 10−192 |
| Eicosapentaenoic acid (EPA) | 68.305 | 0.016 | NA | NA | 1.321 | 0.25 | NA | NA | NA | NA | TRUE | 8.54 × 10−63 |
| Gamma linolenic acid (GLA) | 77.298 | 0.018 | NA | NA | 0.993 | 0.319 | NA | NA | NA | NA | TRUE | 8.70 × 10−76 |
| Minerals | ||||||||||||
| Calcium | 22.182 | 0.003 | 0.006 | 0.591 | 6.118 | 0.41 | 8.54 | 0.486 | NA | NA | TRUE | 7.48 × 10−85 |
| Calcium (UKB) | 25.391 | 0.014 | 0 | 0.827 | 186.865 | 0.139 | 188.91 | 0.152 | NA | NA | TRUE | 0 |
| Copper | 18.08 | 0.014 | NA | NA | 0.835 | 0.361 | NA | NA | NA | NA | TRUE | 3.71 × 10⁻²⁸ |
| Iron | 159.741 | 0.01 | 0.095 | 0.238 | 6.747 | 0.034 | NA | NA | NA | NA | TRUE | 9.72 × 10−127 |
| Magnesium | 20.988 | 0.005 | 0.015 | 0.556 | 11.06 | 0.05 | 19.824 | 0.1 | NA | NA | TRUE | 4.97 × 10−73 |
| Phosphorus | 18.29 | 0.004 | 0.022 | 0.58 | 2.733 | 0.603 | 4.43 | 0.633 | NA | NA | TRUE | 2.82 × 10−50 |
| Selenium | 39.218 | 0.008 | NA | NA | 2.291 | 0.13 | NA | NA | NA | NA | TRUE | 8.59 × 10−42 |
| Zinc | 23.67 | 0.018 | NA | NA | 0.966 | 0.326 | NA | NA | NA | NA | TRUE | 4.77 × 10⁻²⁸ |
| Vitamins | ||||||||||||
| absolute retinol | 24.943 | 0.01 | NA | NA | 2 | 0.157 | NA | NA | NA | NA | TRUE | 7.89 × 10⁻²⁵ |
| absolute vitamin B-12 | 75.036 | 0.012 | 0.008 | 0.676 | 5.109 | 0.403 | 0.774 | 0.366 | NA | NA | TRUE | 3.62 × 10−212 |
| absolute ascorbate | 20.303 | 0.004 | −0.007 | 0.35 | 8.331 | 0.402 | 9.643 | 0.506 | NA | NA | TRUE | 9.77 × 10−120 |
| absolute alpha-tocopherol | 3.121 | 0.001 | −0.065 | 0.643 | 4.022 | 0.134 | NA | NA | NA | NA | TRUE | 1.04 × 10⁻²⁴ |
| relative retinol | 4.158 | 0.047 | 0.005 | 0.665 | 28.945 | 0.115 | 31.643 | 0.13 | NA | NA | TRUE | 1.59 × 10−118 |
| relative ascorbate | 83.86 | 0.04 | −0.0002 | 0.988 | 9.901 | 0.539 | 11.769 | 0.55 | NA | NA | TRUE | 1.17 × 10−62 |
| relative gamma-tocopherol | 5.881 | 0.012 | 0.004 | 0.684 | 14.503 | 0.206 | 17.795 | 0.214 | NA | NA | TRUE | 2.71 × 10−52 |
| Methods | Dihomo-Gamma-Linolenic Acid (DGLA) | Linoleic Acid (LA) | Absolute 25-OHD | Relative Alpha-Tocopherol | |
|---|---|---|---|---|---|
| mean F statistics | 218.419 | 17.009 | 89.901 | 4.07 | |
| R2 | 0.049 | 0.023 | 0.014 | 0.006 | |
| MR–Egger | intercept | NA | −0.014 | 0.001 | −0.065 |
| p value | NA | 0.146 | 0.548 | 0.643 | |
| Cochran’s Q | Q | 0.062 | 20.419 | 84.75 | 6.652 |
| p value | 0.804 | 0.253 | 0.11 | 0.758 | |
| MR–PRESSO | RS Sobs | NA | 23.102 | 85.808 | 7.907 |
| P-global test | NA | 0.258 | 0.144 | 0.807 | |
| P-outlier | NA | NA | NA | NA | |
| P-distortion | NA | NA | NA | NA | |
| MR–Steiger | correct causal direction | TRUE | TRUE | TRUE | TRUE |
| p value | 4.37 × 10−207 | 2.11 × 10−207 | 0 | 1.98 × 10−45 | |
Publisher’s Note: MDPI stays neutral with regard to jurisdictional claims in published maps and institutional affiliations. |
© 2022 by the authors. Licensee MDPI, Basel, Switzerland. This article is an open access article distributed under the terms and conditions of the Creative Commons Attribution (CC BY) license (https://creativecommons.org/licenses/by/4.0/).
Share and Cite
Xia, K.; Wang, Y.; Zhang, L.; Tang, L.; Zhang, G.; Huang, T.; Huang, N.; Fan, D. Dietary-Derived Essential Nutrients and Amyotrophic Lateral Sclerosis: A Two-Sample Mendelian Randomization Study. Nutrients 2022, 14, 920. https://doi.org/10.3390/nu14050920
Xia K, Wang Y, Zhang L, Tang L, Zhang G, Huang T, Huang N, Fan D. Dietary-Derived Essential Nutrients and Amyotrophic Lateral Sclerosis: A Two-Sample Mendelian Randomization Study. Nutrients. 2022; 14(5):920. https://doi.org/10.3390/nu14050920
Chicago/Turabian StyleXia, Kailin, Yajun Wang, Linjing Zhang, Lu Tang, Gan Zhang, Tao Huang, Ninghao Huang, and Dongsheng Fan. 2022. "Dietary-Derived Essential Nutrients and Amyotrophic Lateral Sclerosis: A Two-Sample Mendelian Randomization Study" Nutrients 14, no. 5: 920. https://doi.org/10.3390/nu14050920
APA StyleXia, K., Wang, Y., Zhang, L., Tang, L., Zhang, G., Huang, T., Huang, N., & Fan, D. (2022). Dietary-Derived Essential Nutrients and Amyotrophic Lateral Sclerosis: A Two-Sample Mendelian Randomization Study. Nutrients, 14(5), 920. https://doi.org/10.3390/nu14050920