1. Background
Globally, in 2020, 45 million children were estimated to be wasted (too thin for their height), and 149 million children under five years of age were estimated to be stunted (too short for their age). Undernutrition makes children in particular much more vulnerable to disease and death. Around 5% of deaths among children under five are linked to undernutrition, and these mostly occur in low- and middle-income countries (LMICs) [
1]. Moreover, the COVID-19 pandemic is expected to exacerbate child undernutrition and child mortality, especially in LMICs. A modeling study estimated that in 2022, COVID-19-related disruptions could result in an additional 9.3 million wasted children, 2.6 million stunted children, and 168,000 additional child deaths [
2].
In Indonesia, a lower-middle-income country, the burden of child undernutrition is similarly high. The latest data from Indonesia Basic Health Survey (RISKESDAS), a nationally representative sample, showed that 7.2% and 19.7% of children under five were wasted and stunted, respectively [
3]. With an estimated 24 million children under five in the country, over 1.7 million and 7.4 million children were wasted and stunted. While data showed that under-five mortality rates decreased from 52.2 per 1000 live births in 2000 to 23.9 in 2019, it was still higher than in many neighboring countries such as Malaysia (8.6 per 1000 live births), Thailand (9.0), and Vietnam (19.9) in 2019 [
4].
The linkage between socioeconomic environments and child undernutrition has been well-studied. A study using data from 47 LMICs in Asia, Africa, and Latin America showed pronounced within-country socioeconomic inequalities in stunting and wasting among children under five years old [
5]. The study showed that in Pakistan, for instance, the prevalence of stunting was 58.2% and 30.6% among the poorest and wealthiest quintiles, respectively. In Guatemala, the prevalence of stunting was 68.5% and 25.5% among the poorest and wealthiest quintiles, respectively [
5]. Another study analyzed data from 35 sub-Saharan African countries and found that underweight, wasting, and stunting were significantly higher among children from lower-income households, mothers with lower education, and rural areas [
6]. Furthermore, previous studies have also shown some evidence on geographic disparity in child undernutrition. A study in India analyzed data across 640 districts in India and found that the prevalence of stunting was higher among poorer populations in northern India compared to eastern and southern parts of India [
7]. Additionally, a study in Argentina found regional disparities with higher prevalence values in the north and northeast regions [
8]. A better understanding of these disparities provides a precision public health tool to target public policies to those populations with the greatest need in order to reduce health disparities [
8].
Narrowing the geographic and socioeconomic disparity in child undernutrition is crucial to achieving the Sustainable Development Goals of reducing wasting and stunting. However, previous studies on the geographic and socioeconomic disparity in child undernutrition from LMICs are limited in at least three ways. First, the majority of studies used individual-level data (including Demographic Health Surveys and Family Health Surveys) to examine the socioeconomic disparity or inequality, including studies from Asia (including India, Bangladesh, Nepal, Cambodia, and Indonesia), Africa (including Nigeria, Chad, and Sierra Leone), and Latin America (including Brazil, Guatemala, and Argentina) [
6,
7,
8,
9,
10,
11,
12,
13,
14,
15,
16,
17,
18,
19]. While that evidence is invaluable, analyses using locality-level data (including districts) are also needed to inform policies. For instance, district-level studies for Indonesia (and other countries with similar settings) are crucial because of the decentralization policy, which transfers health sector planning to district heads. Second, while there are plenty of studies on socioeconomic disparity, those on geospatial patterns are lacking [
7,
8]. Thus, our study aims to address this evidence gap by examining the geographic and socioeconomic disparity in child undernutrition (underweight, wasting, and stunting) across 514 districts in Indonesia, using data from a nationally representative health survey.
2. Methods
2.1. Study Design and Sample
We conducted a cross-sectional study on the geographic and socioeconomic disparity in child undernutrition (under five years old) among districts in Indonesia. Geospatial analyses were performed to assess geographic variations of child undernutrition. Additionally, quantitative regression analyses were conducted to examine the associations between socioeconomic indicators and child undernutrition. The child undernutrition data were from RISKESDAS 2018, a nationally representative health survey by the Ministry of Health, aggregated at the district level (514 districts within 34 provinces).
The target sample of RISKESDAS was 300,000 households from 30,000 census blocks from the National Socioeconomic Survey with two-stage sampling. First, the survey team selected 180,000 census blocks using probability proportional to size from 720,000 census blocks listed in the population census 2010. Additionally, then the team selected 30,000 census blocks in each urban and rural using probability proportional to size. Second, the team systematically chose ten households using implicit stratification of the education level of household heads (to maintain the variation among households). The team interviewed each household member and examined participants meeting the inclusion criteria. The interview response rate in RISKESDAS was relatively high at 95% of target households nationally (ranging from 85% in Papua province to 99% in Bangka Belitung province). The sample included 93,620 children under five years, 818,507 individuals aged 10+ years, and 713,783 individuals aged 15+ years [
3].
2.2. Independent Variables
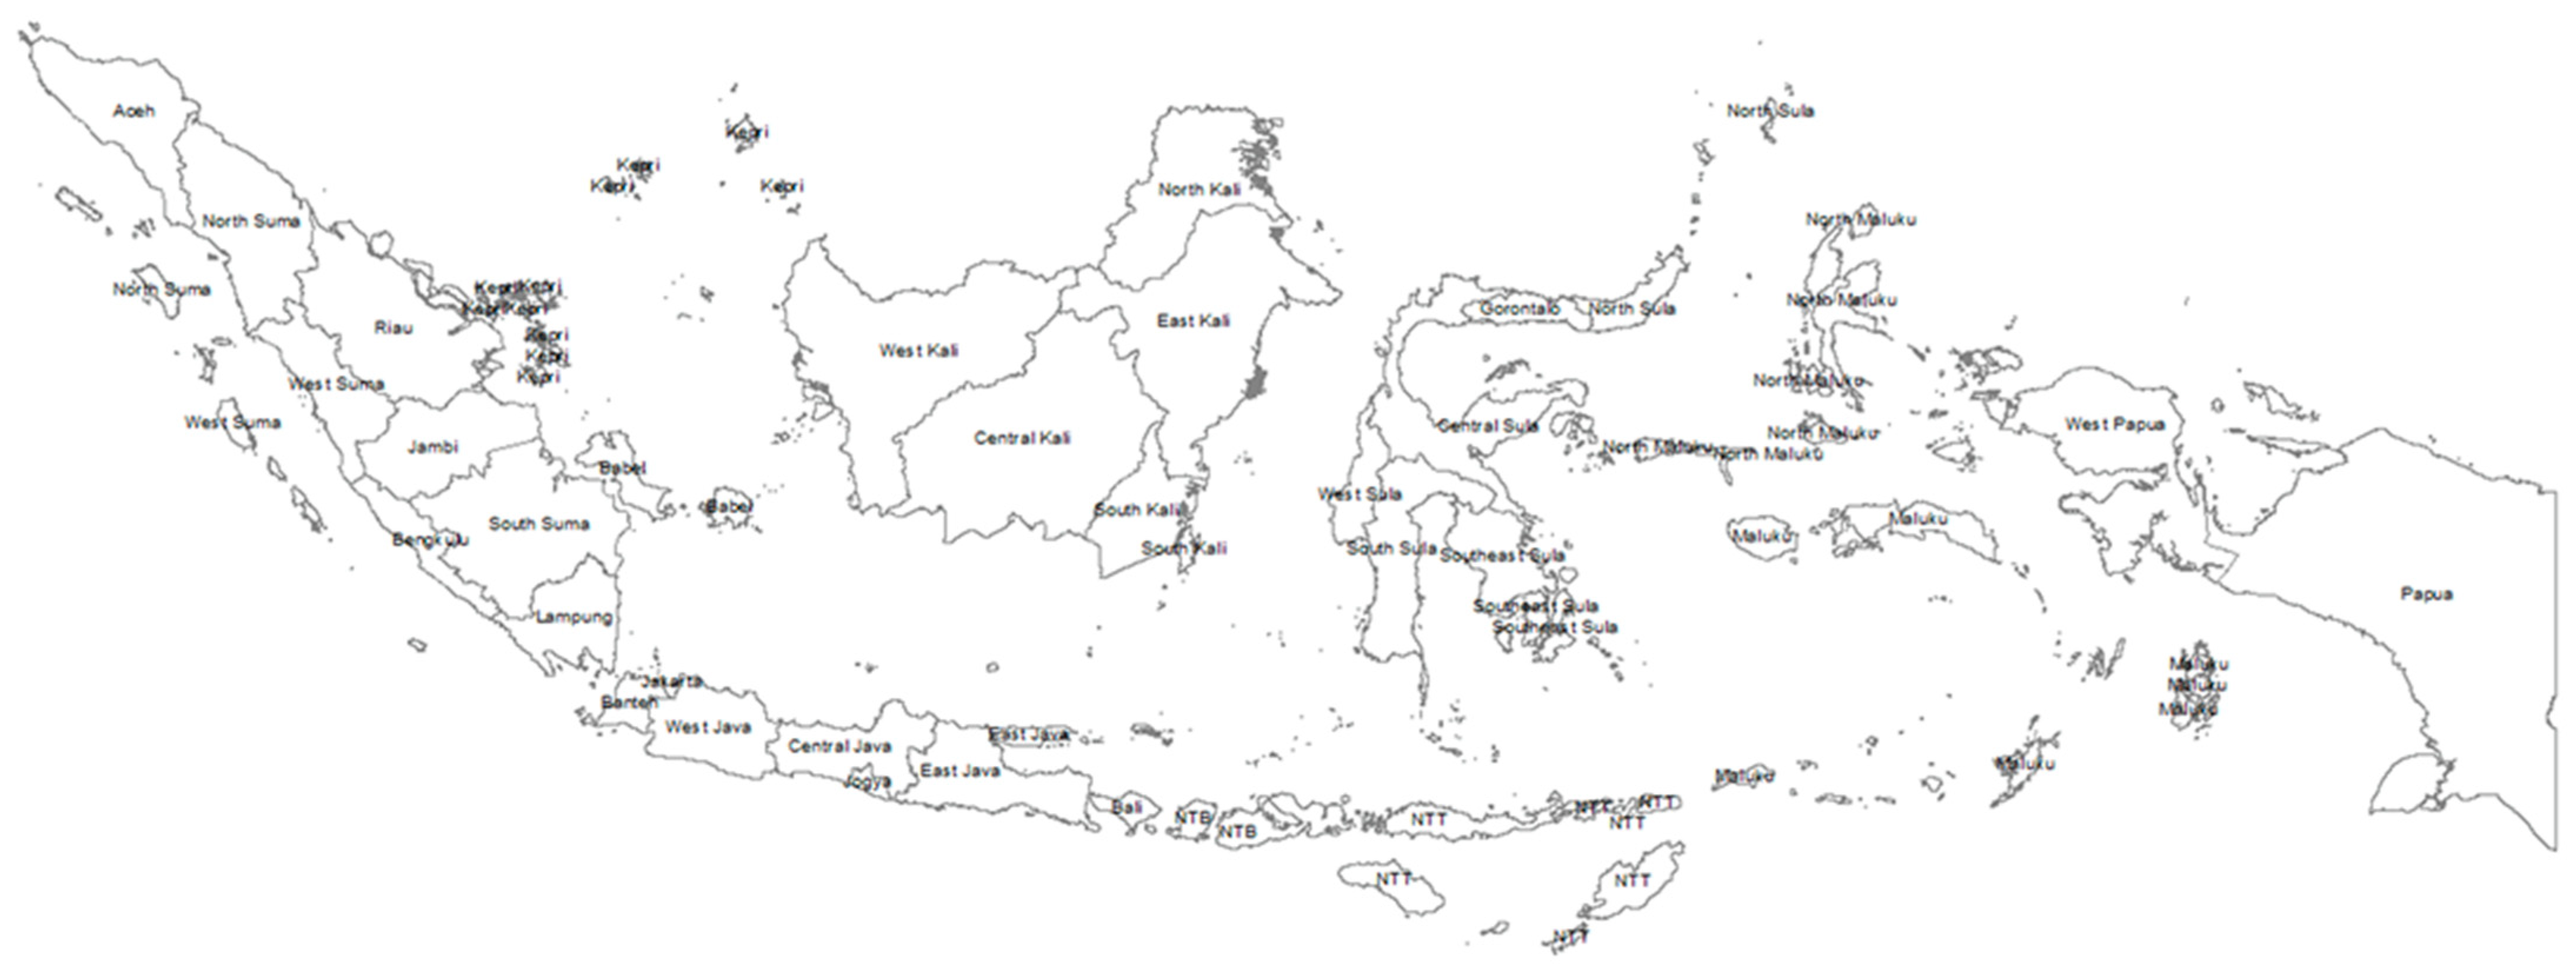
The socioeconomic indicators were obtained from the World Bank database. The districts and provinces were grouped into five regions: Sumatera, Java (including Bali), Kalimantan, Sulawesi, and Papua (including Nusa Tenggara and Maluku) see
Figure 1. The Java region is the most developed economically, and the Papua region is the least developed [
20,
21,
22]. By income, the district-level poverty rates were used and grouped into five quintiles, with the highest poverty rate as the first quintile (i.e., poorest) and the lowest poverty rate as the last quintile (i.e., wealthiest). By education, net enrollment ratios of senior secondary were used and grouped into five quintiles, with the first quintile as the least and the last quintile as the most educated. Socioeconomic data were used for all 514 districts, but child undernutrition data were used for 513 districts. Yalimo regency had missing values because of lacking children under five in the sample. The analyses were conducted using overall districts and urban/rural areas (cities as urban and regencies as rural) [
20,
21,
22].
2.3. Dependent Variables
Six indicators of child undernutrition were used as dependent variables: underweight, severe underweight, wasting, severe wasting, stunting, and severe stunting. The cut-off values were compared with the median of the WHO child growth standards for each indicator. Underweight and severe underweight were defined as a weight for age z-score (WAZ) less than −2 standard deviations and −3 standard deviations, respectively. Wasting and severe wasting were defined as height for age z-score (HAZ) of less than −2 standard deviations and −3 standard deviations, respectively. Additionally, stunting and severe stunting were defined as a weight for height z-score (WHZ) of less than −2 standard deviations and −3 standard deviations, respectively [
3].
Wasting usually indicates recent and severe weight loss because a child has not had enough food to eat or has had an infectious disease, such as diarrhea, that has caused them to lose weight. Stunting is due to chronic or recurrent undernutrition, usually associated with poor socioeconomic conditions, poor maternal health and nutrition, frequent illness, and inappropriate infant and young child feeding and care in early life. Stunting holds children back from reaching their physical and cognitive potential. Underweight children have low weight for their age and may be stunted, wasted, or both [
1].
2.4. Data Analysis
Geospatial analyses were conducted by dividing the undernutrition prevalence among 34 provinces and 514 districts into five quintiles in ArcMap 10. Dark red and red color systems were used to show the provinces and districts in the fifth quintile (highest prevalence of undernutrition) and the fourth quintile (higher prevalence), respectively. Dark blue and blue color systems were used to show the provinces and districts in the first quintile (lowest prevalence) and the second quintile (lower prevalence), respectively. This was done for each outcome variable.
Moreover, quantitative analyses were performed using descriptive statistics and bivariate analysis. Descriptive statistics included the prevalence of undernutrition by province and district as well as district characteristics by socioeconomic variables. Bivariate Ordinary Least Square (OLS) regressions in STATA 15 were performed to show associations between geographic (i.e., urban/rural and region) and socioeconomic (i.e., income and education) disparity for each undernutrition indicator: underweight, severe underweight, wasting, severe wasting, stunting, and severe stunting. The absolute and relative differences were calculated between geographic and socioeconomic variations. By region, the absolute and relative differences were between the Papua region (least developed) and the Java region (most developed). By income, the absolute and relative differences were between quintile 1 (poorest) and quintile 5 (wealthiest). By education, the absolute and relative differences were between quintile 1 (least educated) quintile 5 (most educated). All statistical significance was at the 5% level.
3. Results
The results were presented at the provincial and district levels. While the evidence on the disparity in child undernutrition at the provincial level is relevant for national development planning, the small number of provinces (i.e., 34 provinces) limits the observations for quantitative analysis. On the other hand, the large number of districts (i.e., 514 cities and regencies) is sufficient for further quantitative analysis. In terms of policy, district-level studies for Indonesia (and other countries with similar settings) are crucial because of the decentralization policy, which transfers health sector planning to district heads. Thus, district health offices are accountable to local district heads, not the national Ministry of Health.
3.1. Provincial Level Analysis
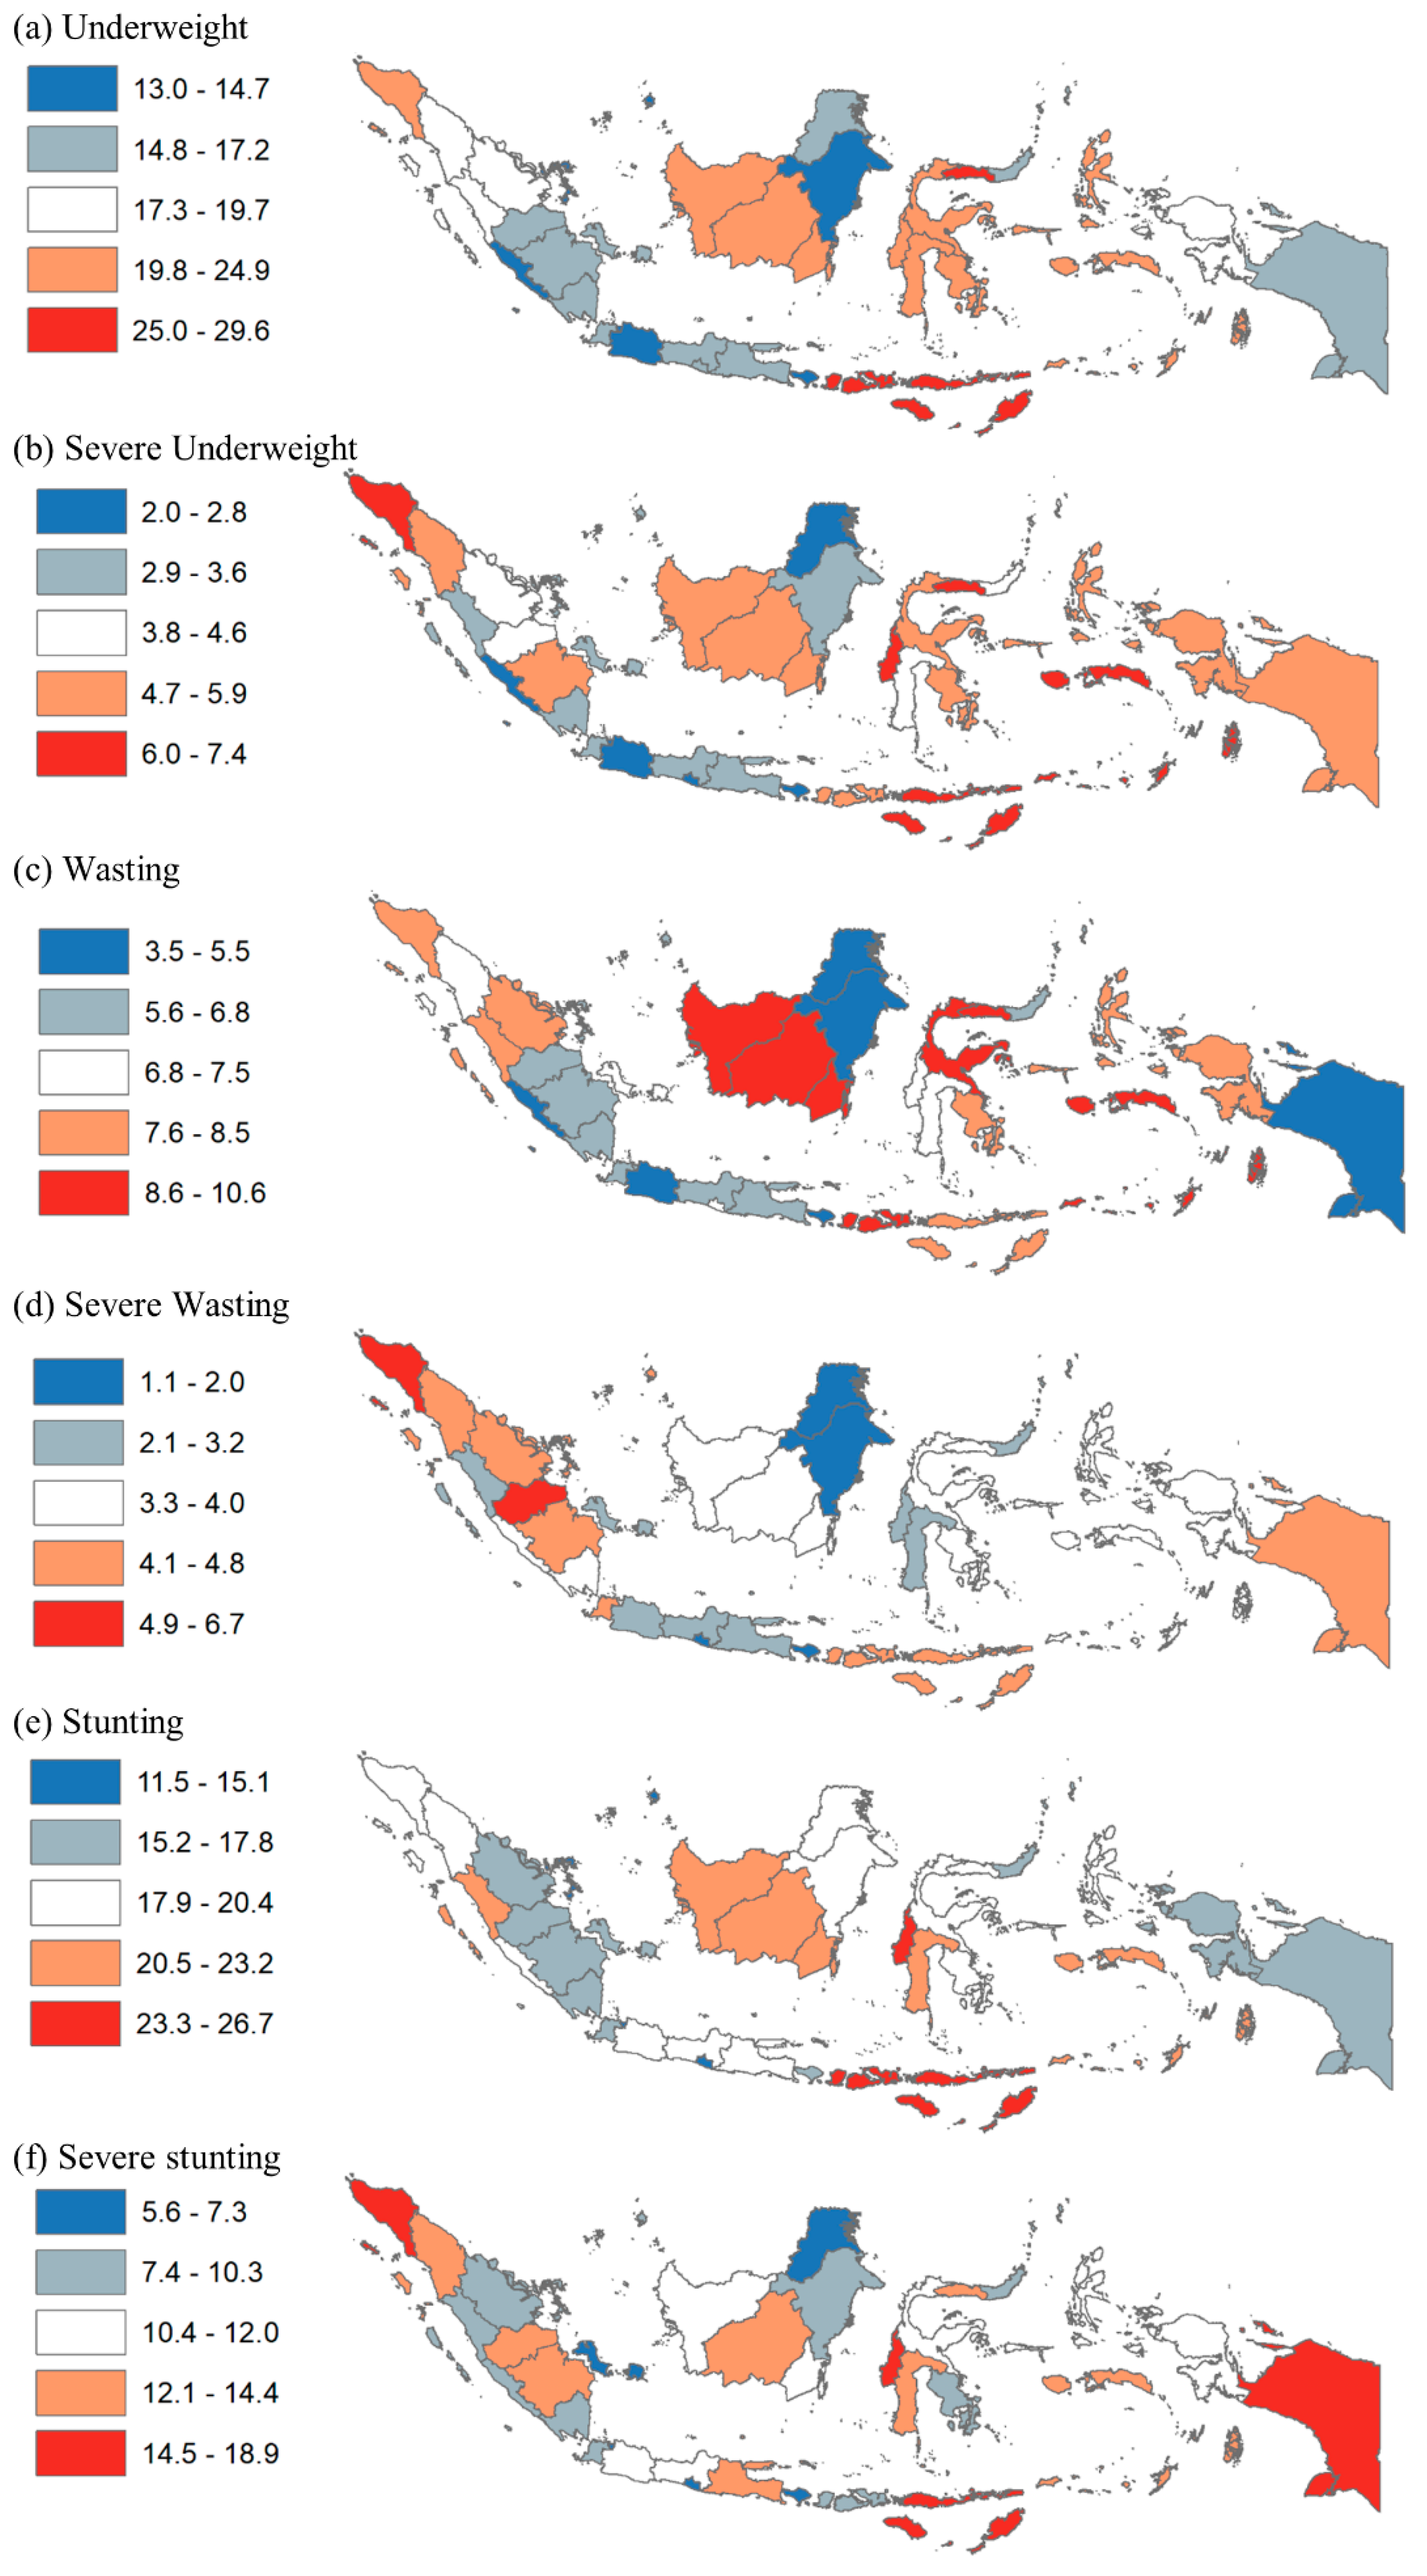
In terms of geographic disparity,
Figure 2 shows the distribution of child undernutrition prevalence quintiles by province. The prevalence of underweight ranged from 13.0% to 29.6%; that of severe underweight ranged from 2.0% to 7.4%; that of wasting ranged from 3.5% to 10.6%; that of severe wasting ranged from 1.1% to 6.7%; that of stunting ranged from 11.5% to 26.7%; that of severe stunting ranged from 5.65 to 18.9%. For underweight and severe underweight, the prevalence was highest (quintile 5) in the Papua (including East Nusa Tenggara, West Nusa Tenggara, Maluku), northern Sulawesi (including Gorontalo), and northern Sumatera (including Aceh) regions. For wasting, the prevalence was highest in the northern Sulawesi (including Gorontalo), Kalimantan (including West Kalimantan), and Papua (including West Nusa Tenggara) regions. However, the prevalence was highest for severe wasting in the northern (including Aceh) and central Sumatera (including Jambi) regions. For stunting and severe stunting, the prevalence was highest in the Papua (including East Nusa Tenggara, West Nusa Tenggara, Papua), western Sulawesi (including West Sulawesi), and northern Sumatera (including Aceh) regions.
In terms of socioeconomic disparity,
Table 1 shows the prevalence of child undernutrition by income at the provincial level. The top box shows provinces with the lowest poverty rates (i.e., wealthier) including Bali, South Kalimantan, Central Kalimantan, and Jakarta. The bottom box shows provinces with the higher poverty rates (i.e., poorer) including Papua, East Nusa Tenggara, Maluku, and Gorontalo. The prevalence with grey shades was higher than the national average for each indicator (column). Only two of the ten wealthiest provinces were consistently higher than average for all child undernutrition indicators. On the other hand, seven of ten poorest provinces were consistently higher than average for five or six child undernutrition indicators.
3.2. District Level
Table 2 shows the characteristics of districts and the prevalence of child undernutrition. There are 514 districts, consisting of 97 cities and 417 regencies. By region, most districts are in the Sumatera region (154 districts or 30.0% of total districts) and the Java region (128 districts or 24.9%). By income level, 79% of urban areas are relatively wealthy (in quintiles 4 and 5), while nearly half (47.2%) of rural areas are relatively poor (in quintiles 1 and 2). By the education level, 71.1% of urban areas have relatively high education (in quintiles 4 and 5), while nearly half (46.8%) of rural areas have relatively low education (in quintiles 1 and 2). In terms of child undernutrition (panel b), the prevalence of underweight and severe underweight is 19.1% and 4.6%; that of wasting and severe wasting is 7.2% and 3.7%; and that of for stunting and severe stunting is 19.7% and 12.3%, respectively. Moreover, the prevalence of child undernutrition is significantly higher in rural areas compared to urban areas. The prevalence of underweight and severe underweight in rural areas is higher by 1.21 (i.e., 19.8% divided by 16.3%) and 1.41 times, respectively, compared to urban areas. Similarly, the prevalence of wasting and severe wasting is higher in rural areas by 1.11 and 1.30 times, respectively; that of stunting and severe stunting is higher by 1.23 and 1.51 times, respectively, than in urban areas.
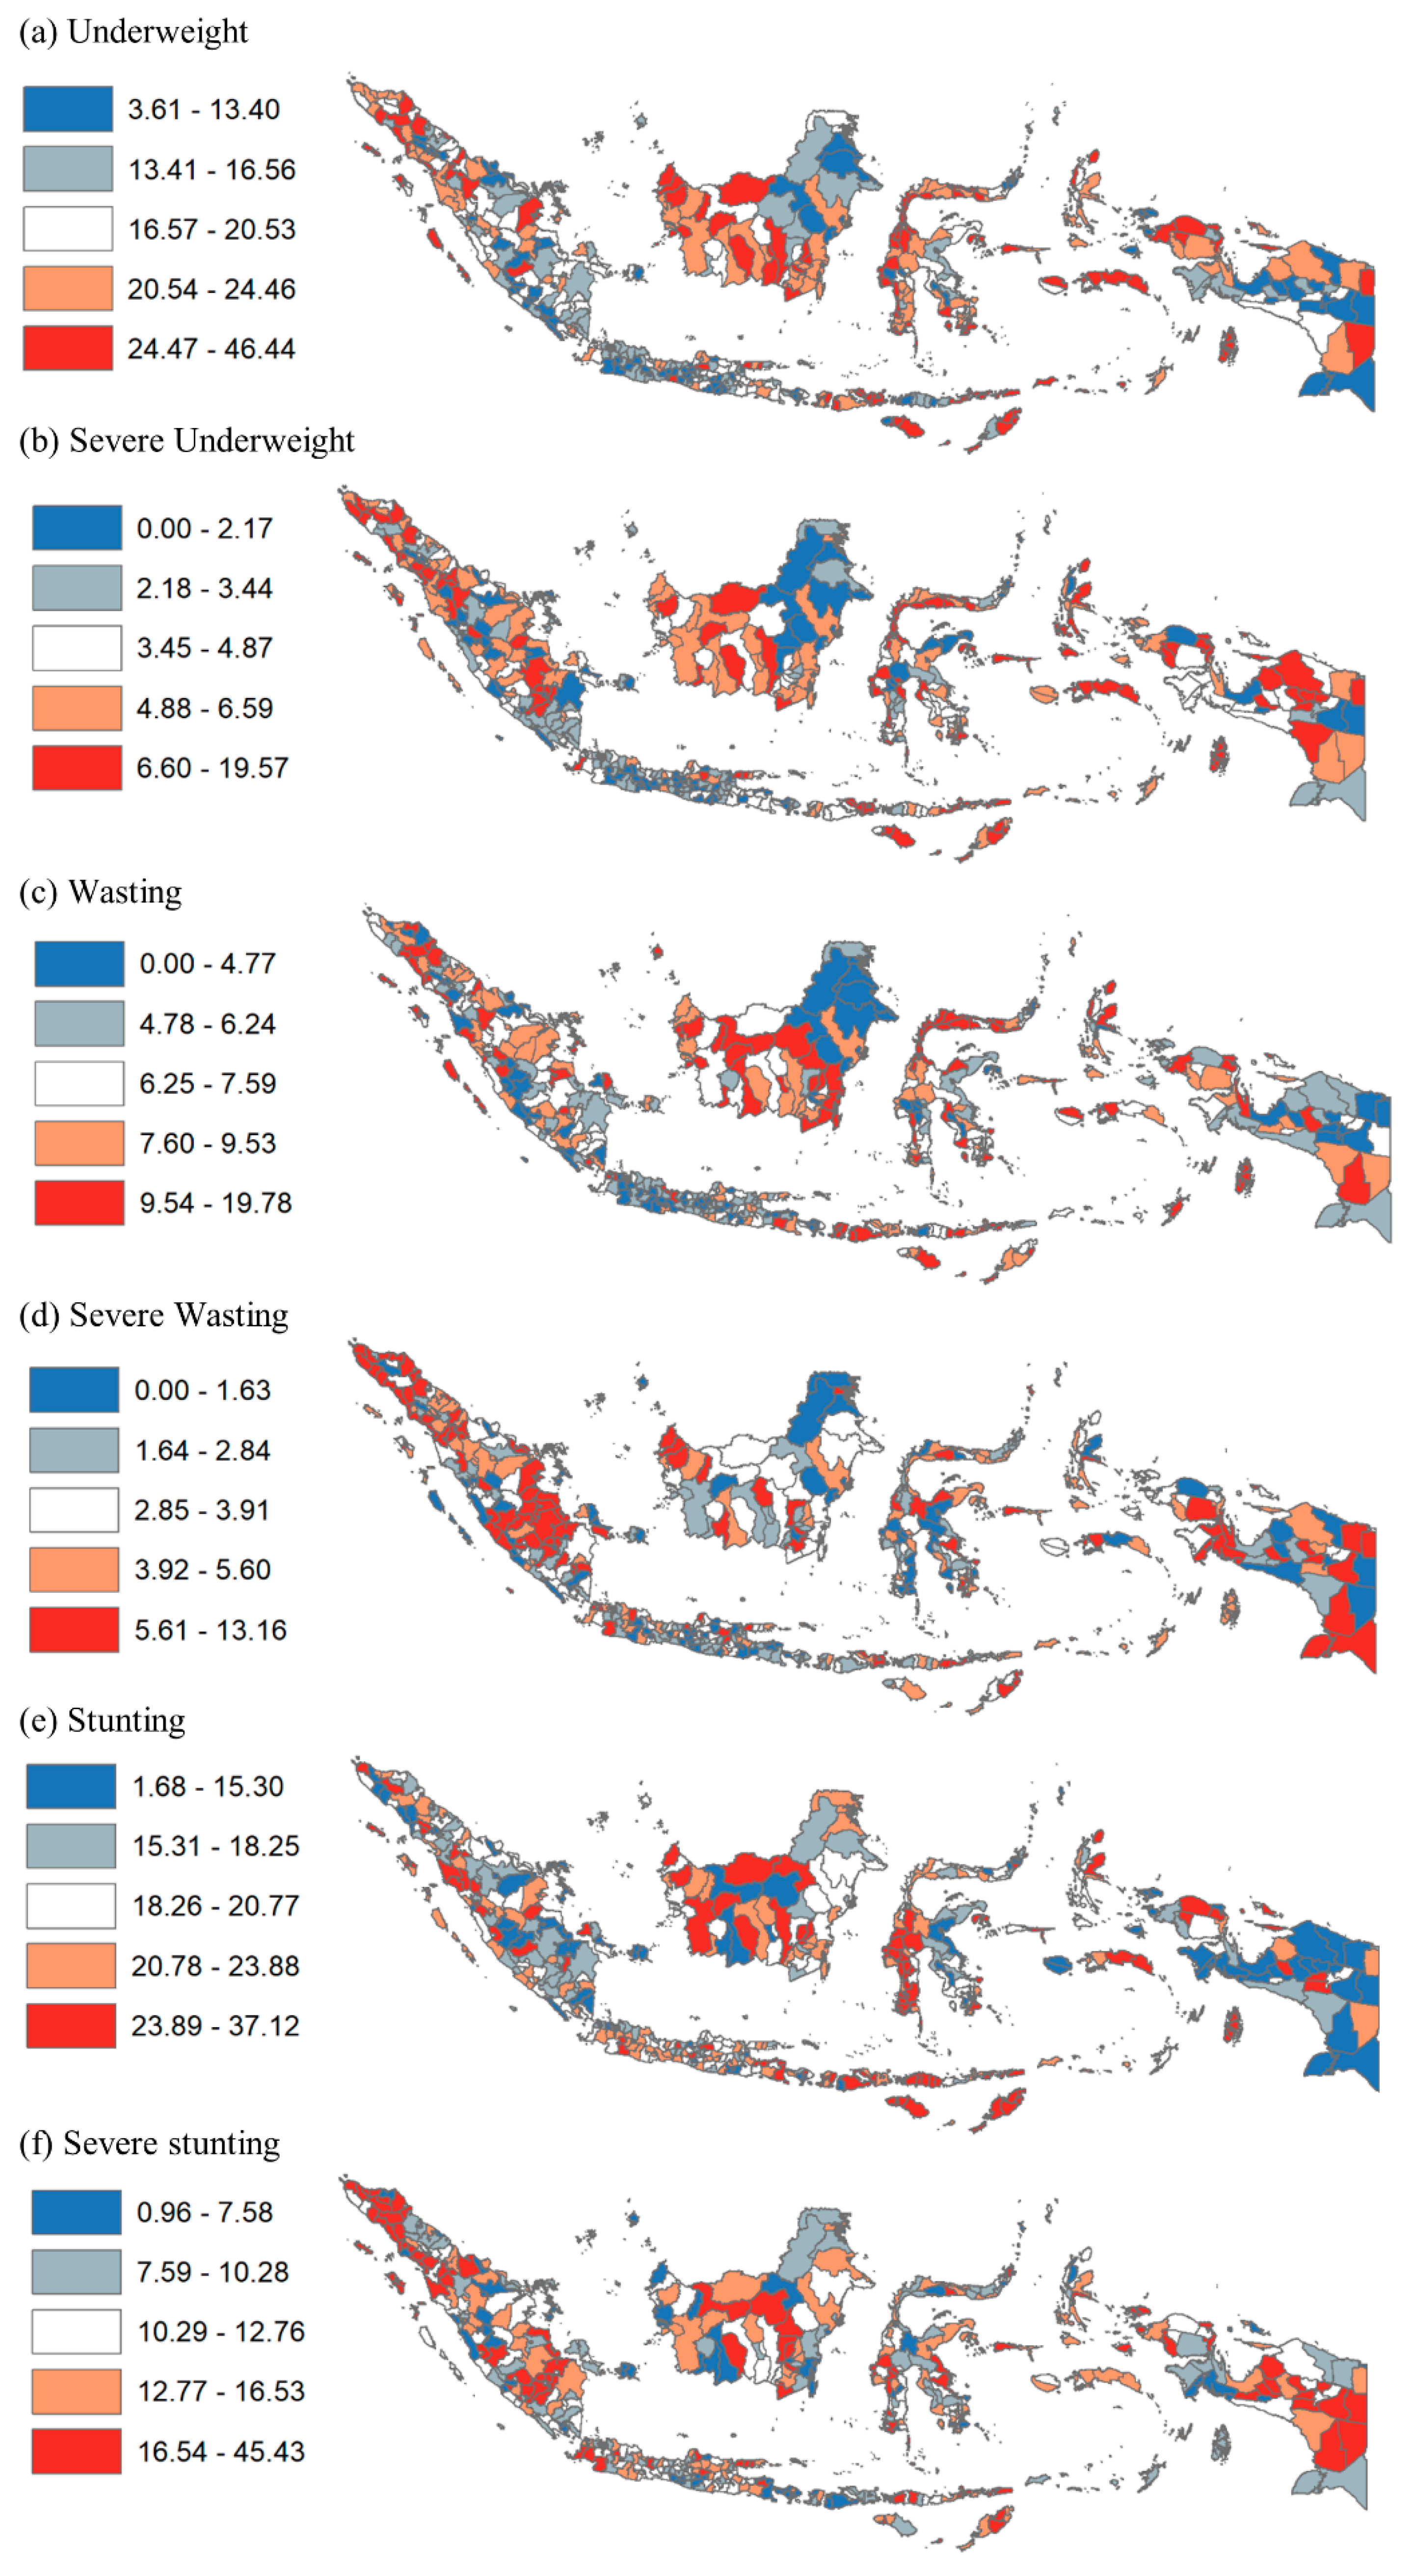
In terms of geographic disparity,
Figure 3 shows the disparity in child undernutrition at the district level by prevalence quintile. Results show more granularity by district than by province. For instance, many districts in Papua, Maluku, Central Sulawesi, West Kalimantan, Central Kalimantan, and Aceh provinces had the highest prevalence of underweight. Additionally, many districts in Papua, East Nusa Tenggara, West Kalimantan, Central Kalimantan, and South Sumatera provinces had the highest prevalence of severe wasting. Moreover, many districts in Papua, West Papua, Maluku, East Nusa Tenggara, West Sulawesi, West Kalimantan, Central Kalimantan, and Aceh provinces had the highest prevalence of stunting.
In terms of socioeconomic disparity,
Table 3 and
Table 4 provide the ten districts with the lowest and highest prevalence of child undernutrition, respectively. The prevalence of underweight ranged from 3.6% in Tabanan regency (Bali province) to 46.4% in Sabu Raijua (East Nusa Tenggara); that of severe underweight ranged from 0% in Salatiga city (Central Java), Yogyakarta city (Yogyakarta), Kediri city (East Java), Yahukimo (Papua), Tabanan (Bali), Pacitan (East Java), and Sumedang (West Java) to 19.6% in Aceh Selatan (Aceh). The prevalence of wasting ranged from 0% in Tolikara, Intan Jaya, Yahukimo (Papua), and Bener Meriah (Aceh) to 19.8% in Buton (Southeast Sulawesi); that of severe wasting ranged from 0% in 12 districts including Kepulauan Seribu (Jakarta), Malang city (East Java), and Aceh Tengah (Aceh) to 13.2% in Muara Enim (South Sumatera). Additionally, the prevalence of stunting ranged from 1.7% in Yahukimo (Papua) to 37.1% in Biak Nurfor (Papua); that of severe stunting ranged from 1.0% in Gianyar (Bali) to 45.4% in Dogiyai (Papua). By urban/rural, nearly all districts with the highest prevalence of child undernutrition are rural, but several districts with the lowest prevalence were urban. By income, the average poverty rates among the ten districts with the highest prevalence of child undernutrition were up to 26%, while the rates among the districts with the lowest prevalence were up to 22%.
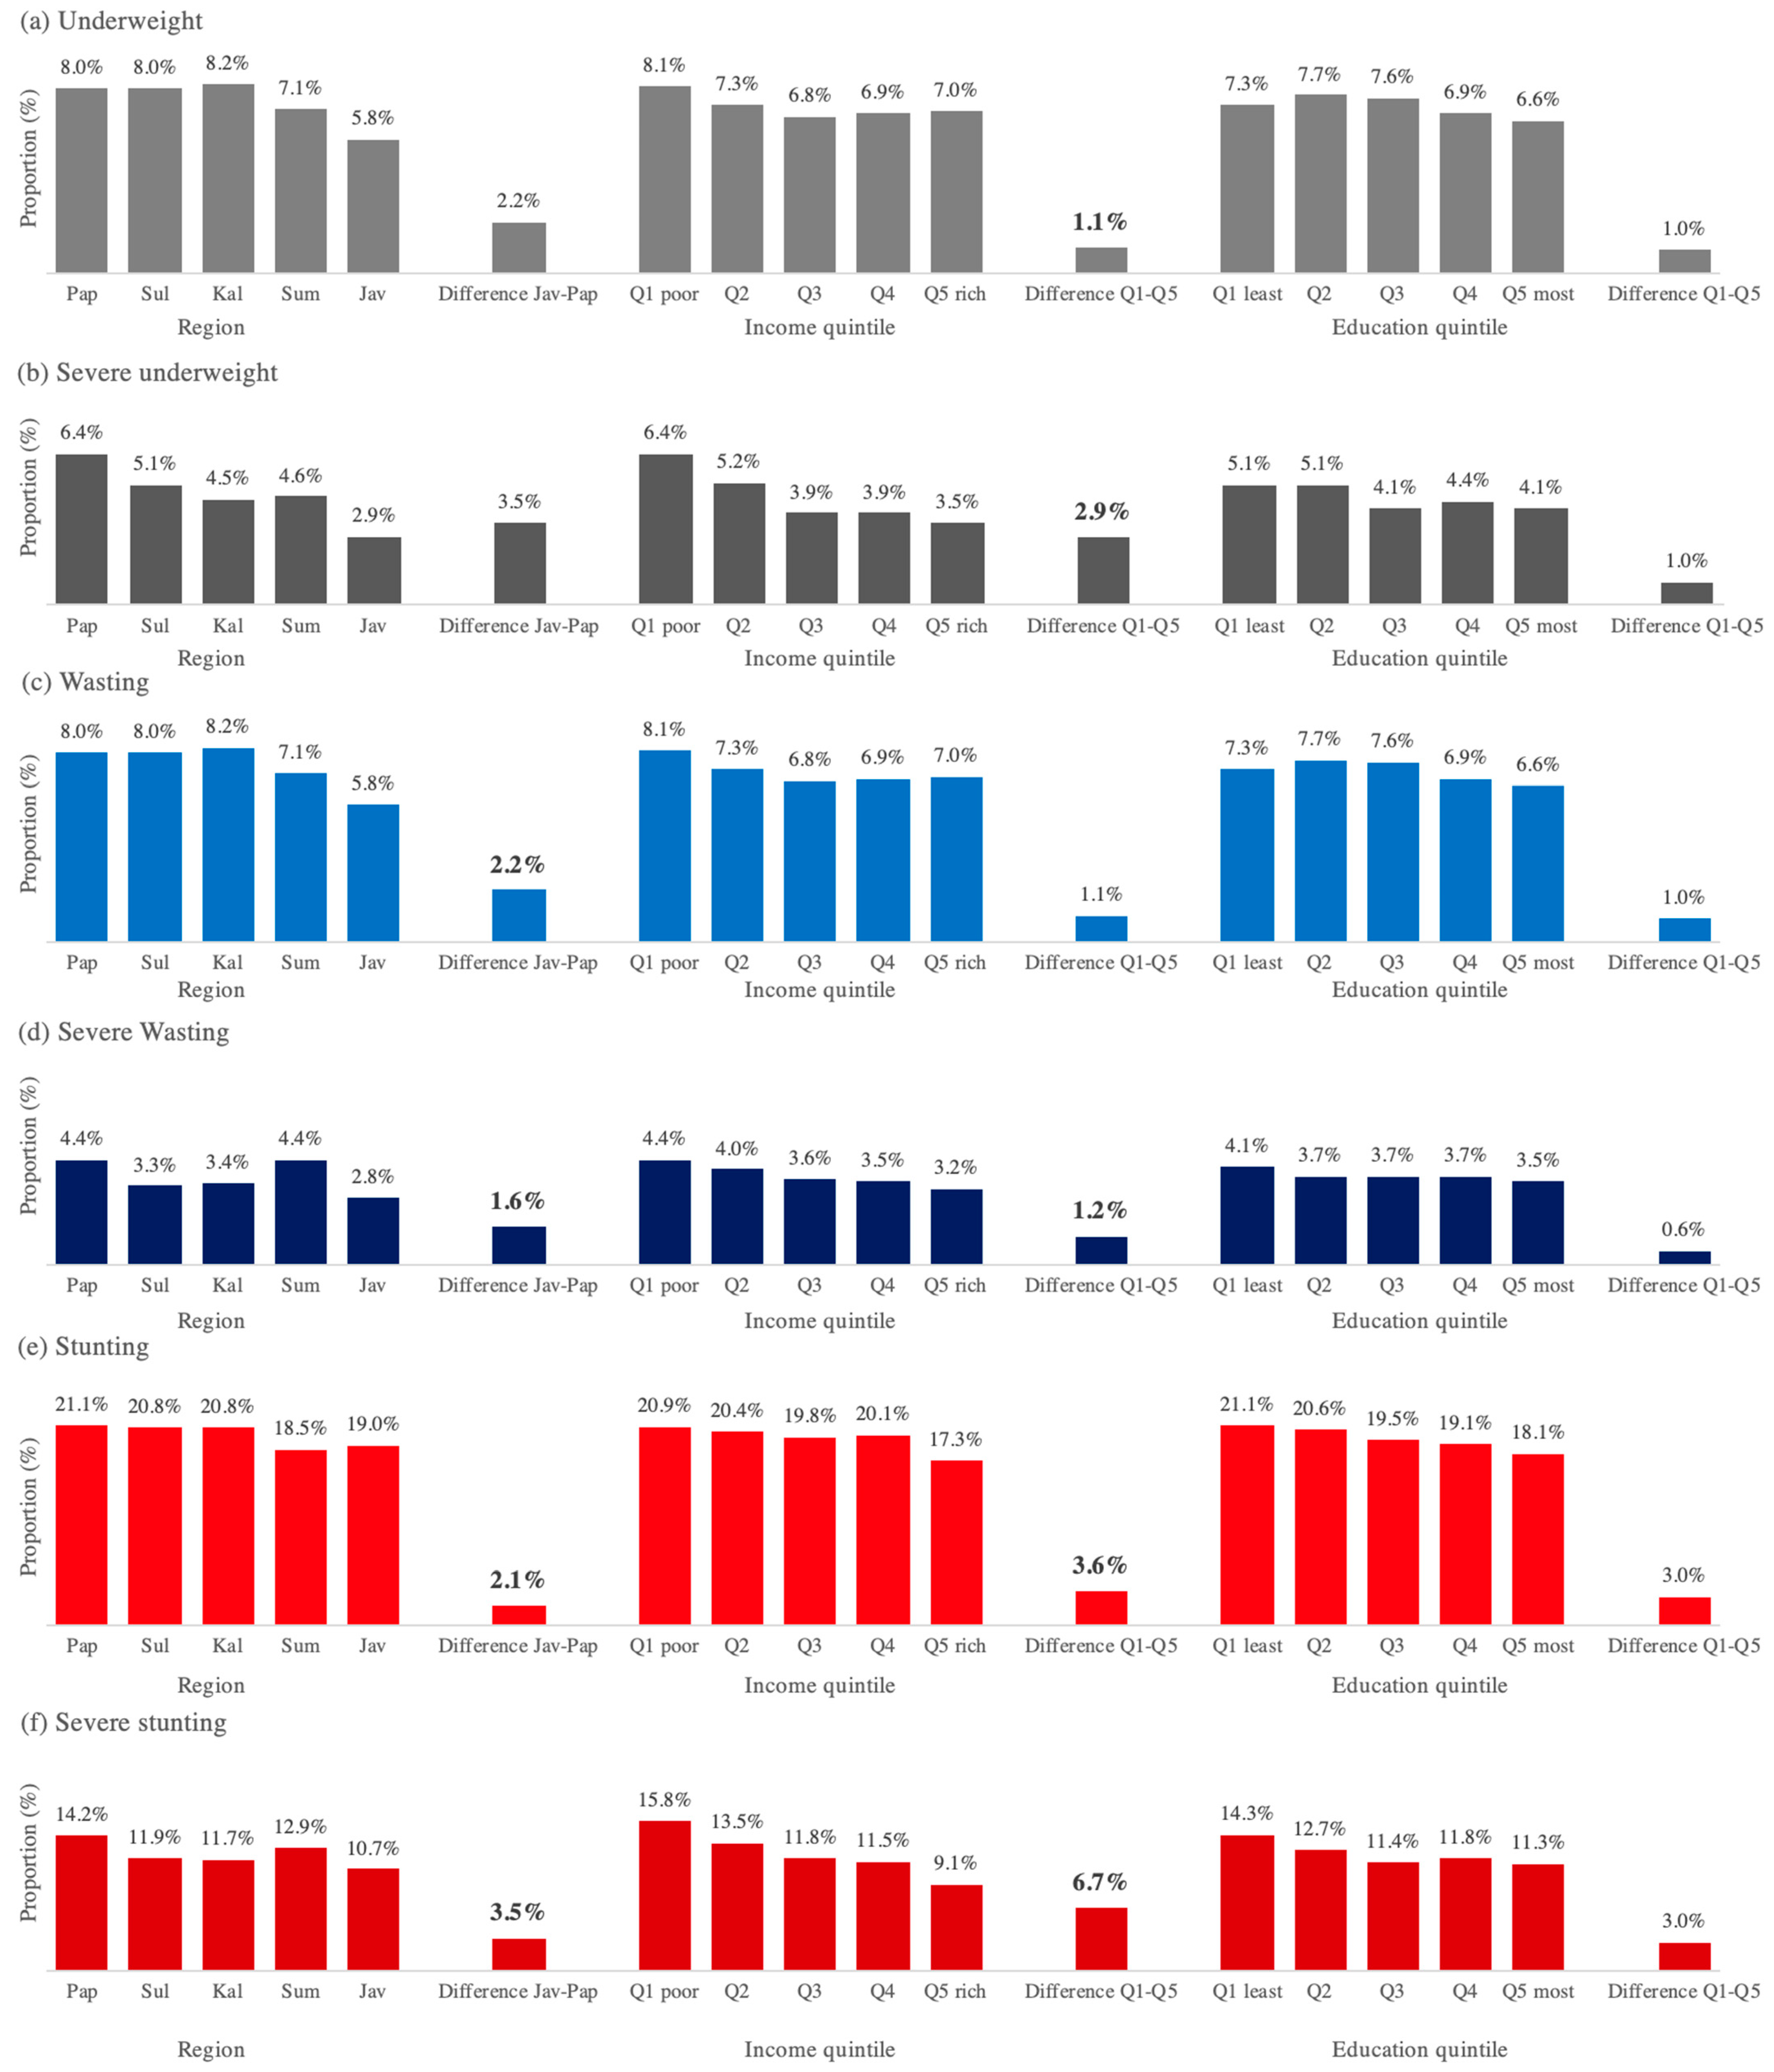
Figure 4 shows the associations between geographic and socioeconomic indicators (i.e., region, income, and education) and child undernutrition. The absolute (relative) values indicate the difference (ratio) between the Papua v Java regions and quintile 1 vs. quintile 5 for income and education level. We provide the absolute difference in
Figure 4 and the relative difference in
Appendix B. By region, districts in the Papua region had a significantly higher prevalence of underweight and wasting than those in the Java region. Districts in Papua had 44%, 121%, 38%, and 57% higher prevalence of underweight, severe underweight, wasting, and severe wasting; see
Appendix B. Similarly, the poorest districts had a significantly higher prevalence of underweight, wasting, and stunting than the wealthiest districts. Poorest districts had 30%, 83%, 16%, 21%, and 74% higher prevalence of underweight, severe underweight, wasting, stunting, and severe stunting. These results were similar among rural districts (see
Appendix B,
Figure 4. Geographic and socioeconomic disparity in child undernutrition).
4. Discussion
Our study found a high prevalence of undernutrition among children under five years in Indonesia. The prevalence of underweight, wasting, and stunting were 19.1%, 7.2%, and 19.7%, respectively; also, severe underweight, severe wasting, and severe stunting were 4.6%, 3.7%, and 12.3%. Compared to the 2020 joint estimates by the World Bank/WHO/UNICEF, the prevalence of wasting in Indonesia was higher than the global average (6.7%) but lower than that among lower-middle-income countries (9.9%) in 2020. Similarly, the prevalence of severe wasting was higher than the global average (2.0%) and that among lower-middle-income countries (2.8%). However, the prevalence of stunting was slightly lower than the global average (22%) and that among lower-middle-income countries (29.1%) [
23].
Our study also found a huge geographic and socioeconomic disparity in child undernutrition across districts in Indonesia. The prevalence of child undernutrition was significantly higher in rural areas (regents) than that in urban areas (cities) ranging from 1.11 times higher for wasting to 1.51 times higher for severe stunting. These findings align with previous studies in LMICs. A study on the disparity in child undernutrition in Cambodia found that the prevalence of underweight, wasting, and stunting was 1.59 times, 1.29 times, and 1.45 times higher in rural areas, respectively, compared to urban areas [
17]. Studies in Nigeria and other countries in Sub-Saharan Africa also had similar findings [
6,
10].
Moreover, the prevalence of child undernutrition was significantly higher in Indonesia’s least developed region than in the most developed region. The prevalence of child nutrition in the Papua region (including Papua, Maluku, and Nusa Tenggara region) was up to 2.21 times (for underweight) higher than that in the Java and Bali region. This disparity is similar to the global trend. For instance, the prevalence of stunting among children under five was the highest in the least developed low-income countries (34.6%) and lowest in the most developed high-income countries (3.4%) in 2020 [
4]. At the country level, a study on the disparity in child undernutrition across 640 districts in India found that the prevalence of stunting was higher among poorer populations in northern India compared to eastern and southern parts of India [
7].
The significantly higher burden of child undernutrition in rural areas and Indonesia’s least developed region is also because those areas are relatively poorer and least educated at the district level. The prevalence of child undernutrition in the poorest districts was up to 1.83 times higher (for severe underweight) than that in the wealthiest districts. Even among rural districts (regencies) that had a lower income level than urban districts (cities), the prevalence of child undernutrition in the poorest rural districts was significantly higher. This aligns with previous studies in Bangladesh, Guatemala, and countries in sub-Saharan Africa [
6,
11,
13,
19].
For policy, our findings support the idea that governments in Indonesia and other countries with similar settings should put more effort into reducing child undernutrition in rural districts, districts in the least developed regions, and those in the poorest areas. While stunting reduction is currently among the top national priorities in Indonesia, the policies and interventions should not be “one size fits all”, given the huge geographic and socioeconomic disparity in child undernutrition in the country. A combination of top-down and bottom-up interventions is ideal for considering local situations, knowledge, and practices related to social determinants of child undernutrition such as safe water access, sanitation, and the quantity and quality of available food [
24]. More efforts are needed to ensure improvement on each determinant. For instance, a study on access to improved sanitation in Indonesia found that households living in rural areas were 11.35% less likely to have access to improved sanitation facilities than those residing in urban areas [
25]. Efforts through more community empowerment may also be helpful. A study comparing the household cash transfers (PKH) and community cash transfers (Generasi) programs for the poorest Indonesians found that both programs increased child food consumption, particularly of protein-rich items such as milk and fish, by up to 19% and 14% for PKH and Generasi, respectively. Additionally, PKH significantly reduced the probability of severe wasting by 41%, and Generasi significantly reduced the probability of being severely underweight by 47% [
26].
Moreover, a “health in all policies” approach is needed to ensure effective efforts towards improving other social determinants of child undernutrition. They include programs to provide additional income (including conditional and unconditional cash transfers) and health insurance coverage (especially among the poor) [
24,
27]. More efforts are needed to ensure the improvement of those determinants as well. For instance, a study found that the impact of PKH cash transfer program on child basic vaccination was more prominent in urban areas compared to rural areas [
28]. Additionally, a study on the disparity of health insurance ownership in Indonesia showed that those in urban areas were 2.32 times more likely to own health insurance than those in rural areas [
29].
Our study has two limitations. First, data on child undernutrition by sex were not available for our analysis, which limited the disparity analysis among boys and girls. Second, our study used cross-sectional data on the prevalence of child undernutrition, which limited our analysis to assessing the temporal effect of association. Regardless of these limitations, our findings have important policy implications for Indonesia and other countries with similar settings.


 ,
, 