
Association between Dietary Nitrate, Nitrite Intake, and Site-Specific Cancer Risk: A Systematic Review and Meta-Analysis

 ,
,
Abstract
1. Introduction
2. Methods
2.1. Search Methods for Identifications of Studies
2.2. The Keywords and Search Terms Used
2.3. Inclusion and Exclusion Criteria
2.4. Data Extraction and Quality Assessment
2.5. Statistical Analysis
3. Results
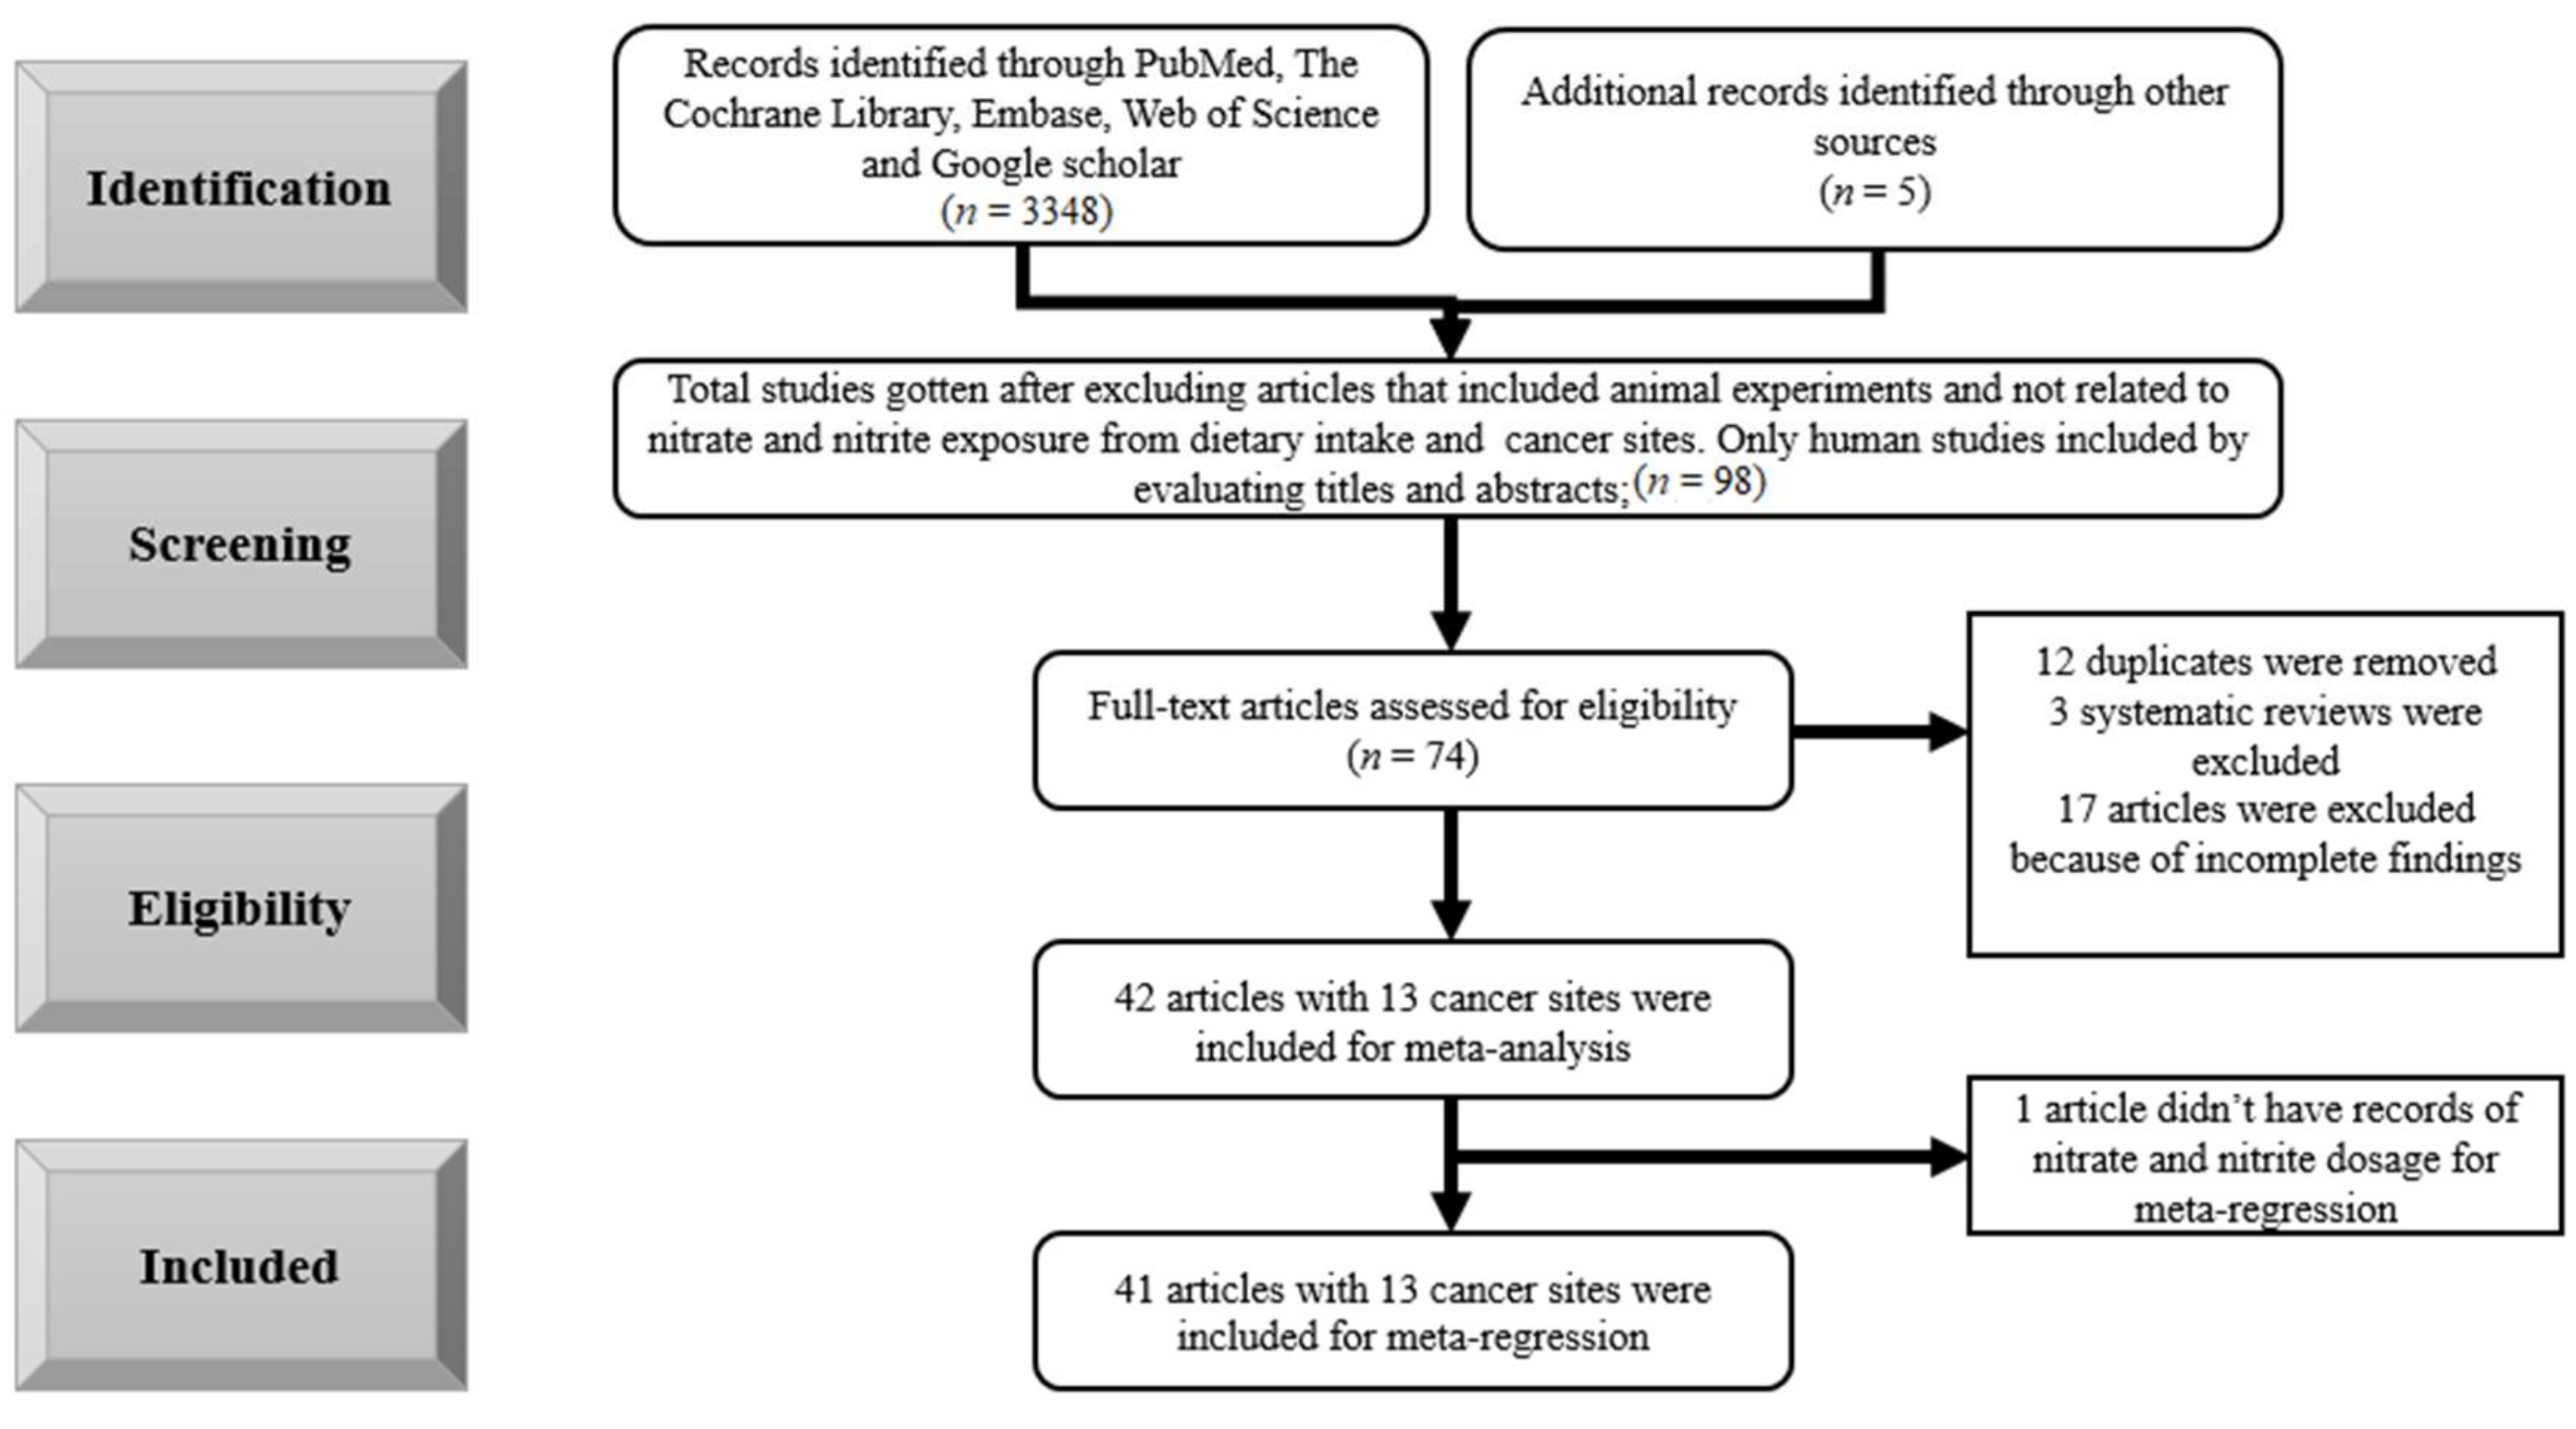
3.1. Selection of the Studies
3.2. Results
3.2.1. Meta-Regression
3.2.2. Meta-Analysis
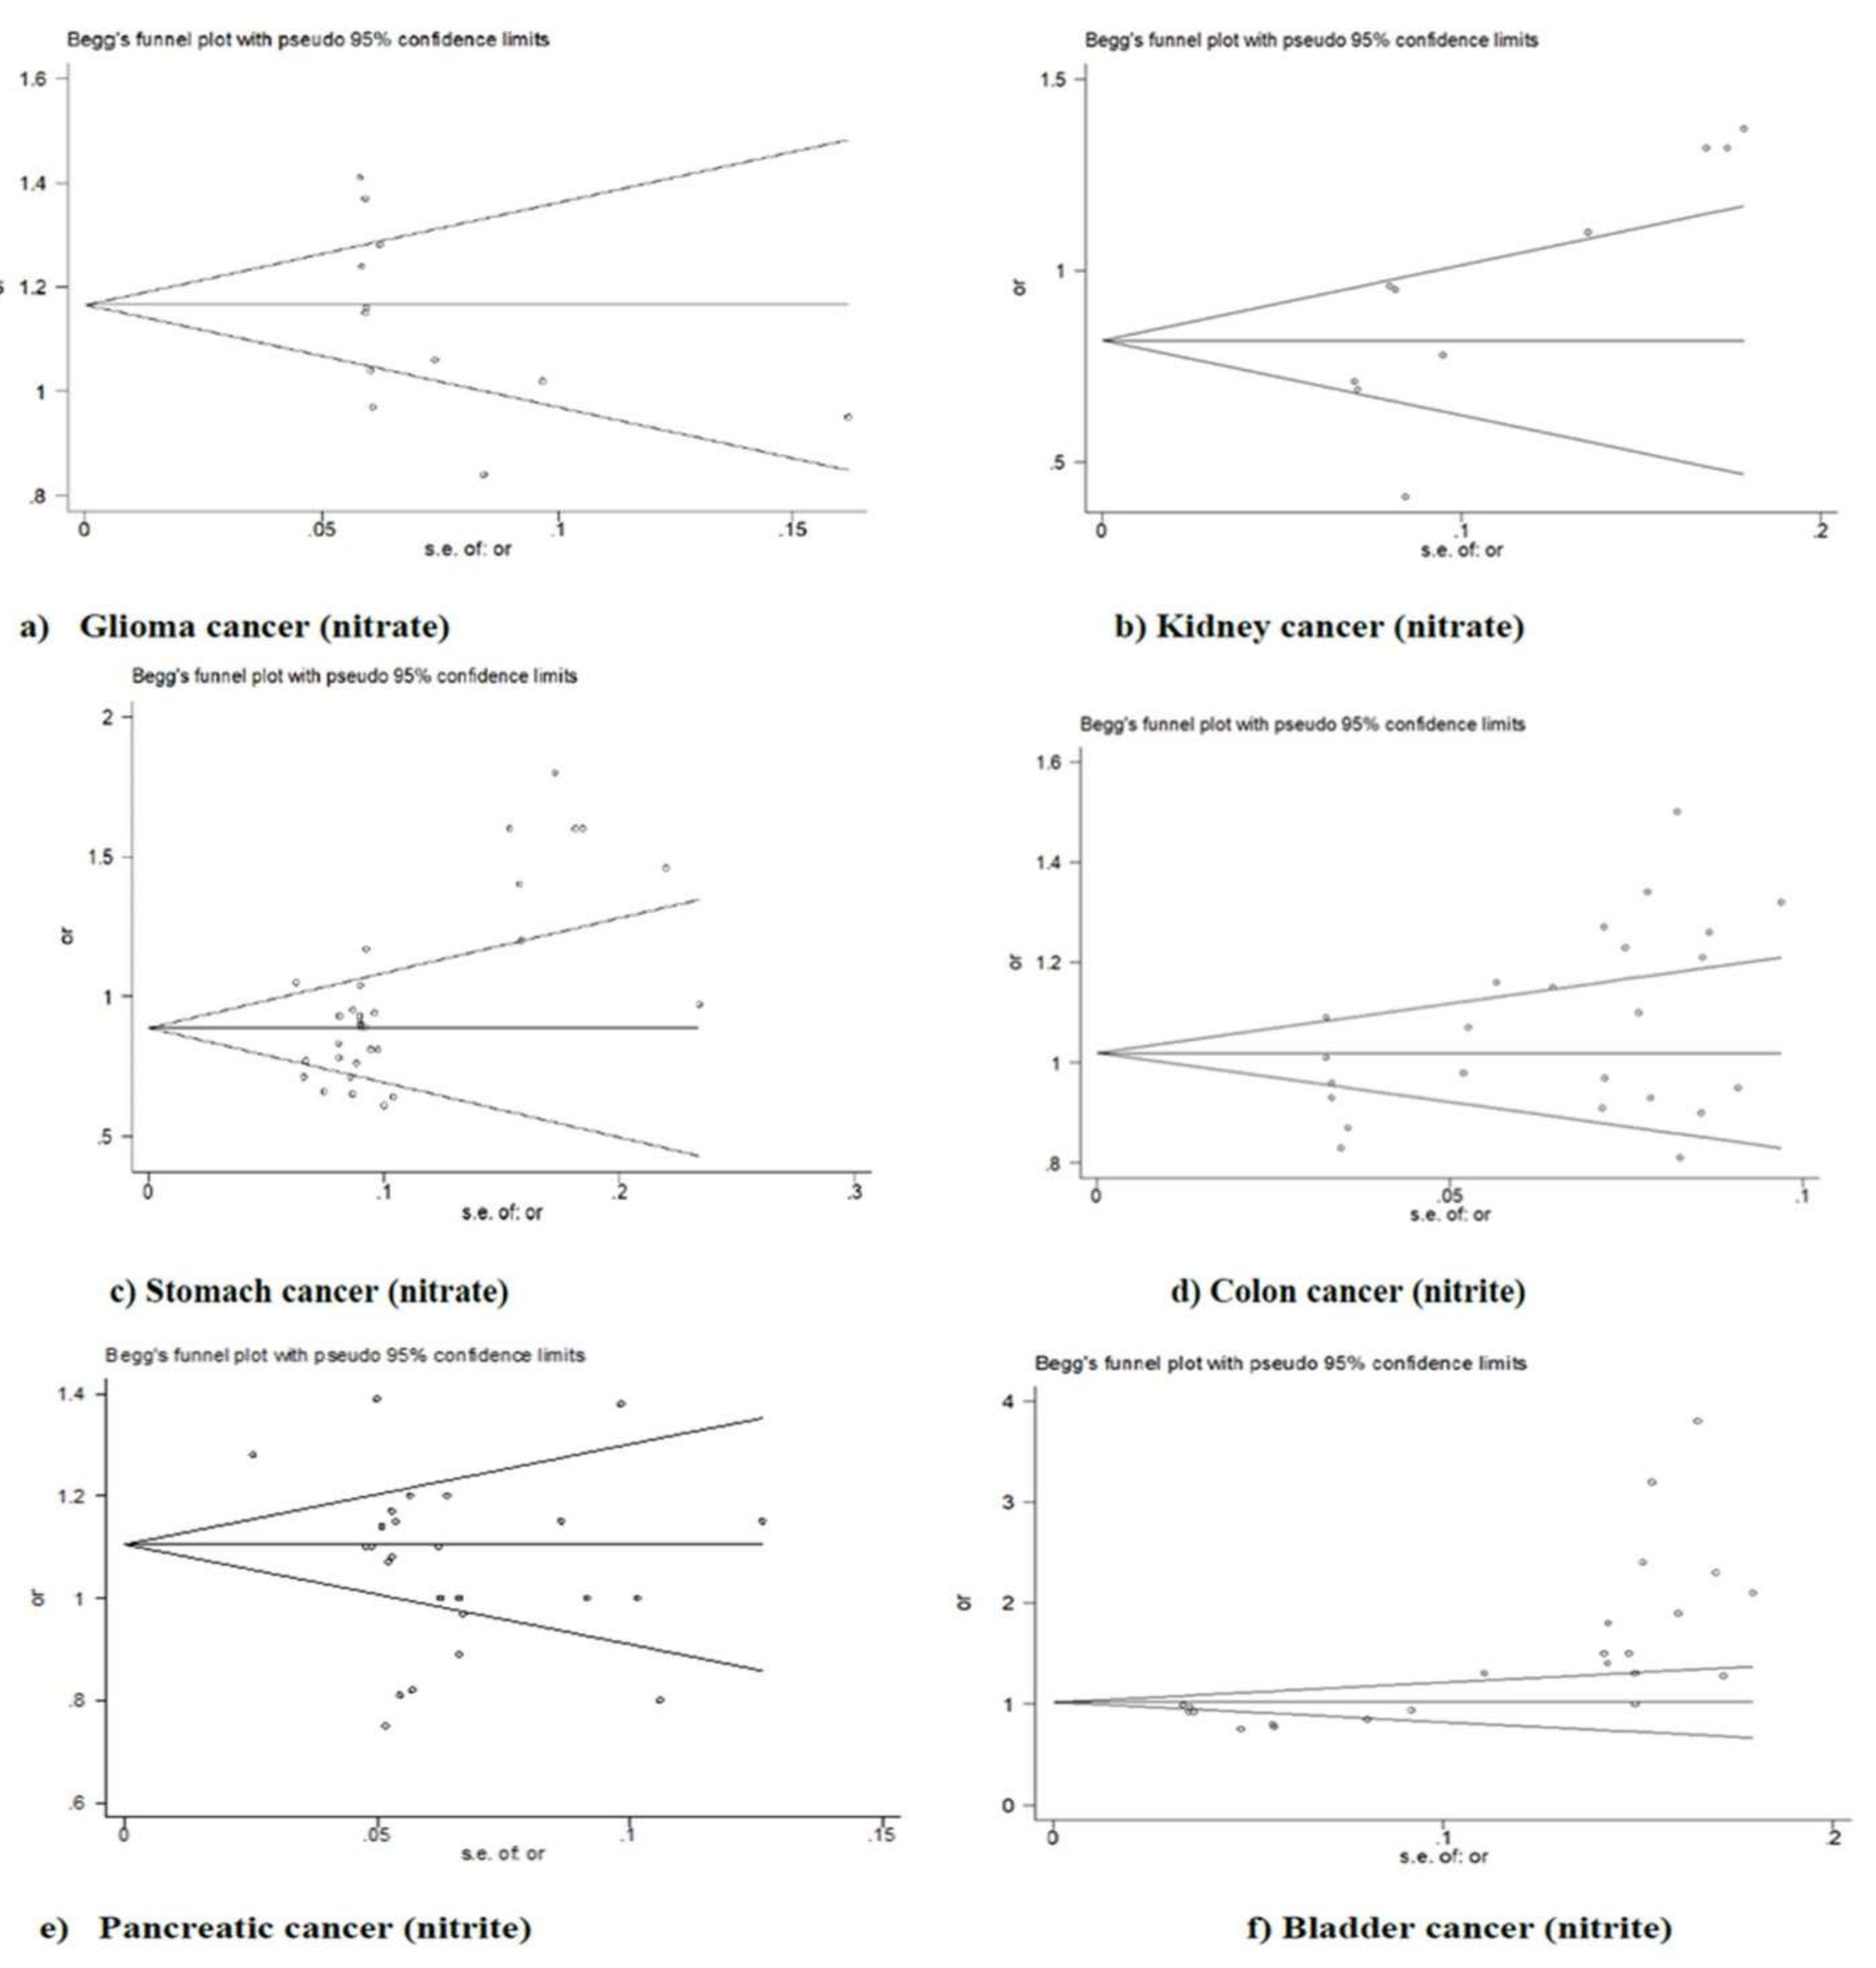
3.2.3. Publication Bias
4. Discussion
Limitations
5. Conclusions
Supplementary Materials
Author Contributions
Funding
Informed Consent Statement
Data Availability Statement
Acknowledgments
Conflicts of Interest
References
- Sung, H.; Ferlay, J.; Siegel, R.L.; Laversanne, M.; Soerjomataram, I.; Jemal, A.; Bray, F. Global Cancer Statistics 2020: GLOBOCAN Estimates of Incidence and Mortality Worldwide for 36 Cancers in 185 Countries. CA Cancer J. Clin. 2021, 71, 209–249. [Google Scholar] [CrossRef] [PubMed]
- Bryan, N.S.; van Grinsven, H. The role of nitrate in human health. Adv. Agron. 2013, 119, 153–182. [Google Scholar]
- GBD 2015 Risk Factors Collaborators. Global, regional, and national comparative risk assessment of 79 behavioural, environmental and occupational, and metabolic risks or clusters of risks, 1990–2015: A systematic analysis for the Global Burden of Disease Study 2015. Lancet 2016, 388, 1659–1724. [Google Scholar] [CrossRef]
- International Agency for Research on Cancer. Ingested nitrate and nitrite, and cyanobacterial peptide toxins. IARC Monogr. Eval. Carcinog. Risks Hum. 2010, 94, 448. [Google Scholar]
- Ferrucci, L.M.; Sinha, R.; Ward, M.H.; Graubard, B.I.; Hollenbeck, A.R.; Kilfoy, B.A.; Schatzkin, A.; Michaud, D.S.; Cross, A.J. Meat and components of meat and the risk of bladder cancer in the NIH-AARP Diet and Health Study. Cancer 2010, 116, 4345–4353. [Google Scholar] [CrossRef] [PubMed]
- Michaud, D.S.; Holick, C.N.; Giovannucci, E.; Stampfer, M.J. Meat intake and bladder cancer risk in 2 prospective cohort studies. Am. J. Clin. Nutr. 2006, 84, 1177–1183. [Google Scholar] [CrossRef][Green Version]
- Aune, D.; Giovannucci, E.; Boffetta, P.; Fadnes, L.T.; Keum, N.N.; Norat, T.; Greenwood, D.C.; Riboli, E.; Vatten, L.J.; Tonstad, S. Fruit and vegetable intake and the risk of cardiovascular disease, total cancer and all-cause mortality—A systematic review and dose-response meta-analysis of prospective studies. Int. J. Epidemiol. 2017, 46, 1029–1056. [Google Scholar] [CrossRef]
- Jones, R.R.; Weyer, P.J.; Dellavalle, C.T.; Inoue-Choi, M.; Anderson, K.E.; Cantor, K.P.; Krasner, S.; Robien, K.; Freeman, L.E.B.; Silverman, D.T.; et al. Nitrate from Drinking Water and Diet and Bladder Cancer Among Postmenopausal Women in Iowa. Environ. Health Perspect. 2016, 124, 1751–1758. [Google Scholar] [CrossRef]
- Bradbury, K.E.; Appleby, P.N.; Key, T.J. Fruit, vegetable, and fiber intake in relation to cancer risk: Findings from the European Prospective Investigation into Cancer and Nutrition (EPIC). Am. J. Clin. Nutr. 2014, 100, 394S–398S. [Google Scholar] [CrossRef]
- González, C.A.; Lujan-Barroso, L.; Bueno-De-Mesquita, H.B.; Jenab, M.; Duell, E.J.; Agudo, A.; Tjønneland, A.; Boutron-Ruault, M.C.; Clavel-Chapelon, F.; Touillaud, M.; et al. Fruit and vegetable intake and the risk of gastric adenocarcinoma: A reanalysis of the European prospective investigation into cancer and nutrition (EPIC-EURGAST) study after a longer follow-up. Int. J. Cancer 2012, 131, 2910–2919. [Google Scholar] [CrossRef]
- Speijers, G.J.A.; Van Went, G.F.; Van Apeldoorn, M.E.; Montizaan, G.F.; Janus, J.A.; Canton, J.H.; Van Gestel, C.A.M.; Van Der Heijden, C.A.; Heijna-Merkus, E.; Knaap, A.G.A.C.; et al. Integrated Criteria Document Nitrate; Effects. Appendix to RIVM Report No. 758473012; RIVM Report No. A758473012; National Institute for Public Health and the Environment: Bilthoven, The Netherlands, 1989.
- Inoue-Choi, M.; Jones, R.R.; Anderson, K.E.; Cantor, K.P.; Cerhan, J.R.; Krasner, S.; Robien, K.; Weyer, P.J.; Ward, M.H. Nitrate and nitrite ingestion and risk of ovarian cancer among postmenopausal women in Iowa. Int. J. Cancer 2015, 137, 173–182. [Google Scholar] [CrossRef] [PubMed]
- Hord, N.G.; Ghannam, J.S.; Garg, H.K.; Berens, P.D.; Bryan, N.S. Nitrate and Nitrite Content of Human, Formula, Bovine, and Soy Milks: Implications for Dietary Nitrite and Nitrate Recommendations. Breastfeed. Med. 2011, 6, 393–399. [Google Scholar] [CrossRef]
- Aschebrook-Kilfoy, B.; Shu, X.-O.; Gao, Y.-T.; Ji, B.-T.; Yang, G.; Li, H.L.; Rothman, N.; Chow, W.-H.; Zheng, W.; Ward, M.H. Thyroid cancer risk and dietary nitrate and nitrite intake in the Shanghai women’s health study. Int. J. Cancer 2013, 132, 897–904. [Google Scholar] [CrossRef] [PubMed]
- Joint FAO/WHO Expert Committee on Food Additives. World Health Organization. Evaluation of Certain Veterinary Drug Residues in Food: Fifty-Eighth Report of the Joint FAO/WHO Expert Committee on Food Additives; WHO Technical Report Series No. 911; World Health Organization: Geneva, Switzerland, 2002. [Google Scholar]
- World Health Organization. Boron in Drinking-Water: Background Document for Development of WHO Guidelines for Drinking-Water Quality; World Health Organization: Geneva, Switzerland, 2009. [Google Scholar]
- Gangolli, S.D.; van den Brandt, P.A.; Feron, V.J.; Janzowsky, C.; Koeman, J.H.; Speijers, G.J.; Spiegelhalder, B.; Walker, R.; Wishnok, J.S. Nitrate, nitrite and N-nitroso compounds. Eur. J. Pharmacol. Environ. Toxicol. Pharmacol. 1994, 292, 1–38. [Google Scholar] [CrossRef]
- Ward, M.H.; Cross, A.J.; Divan, H.; Kulldorff, M.; Nowell-Kadlubar, S.; Kadlubar, F.F.; Sinha, R. Processed meat intake, CYP2A6 activity and risk of colorectal adenoma. Carcinogenesis 2007, 28, 1210–1216. [Google Scholar] [CrossRef] [PubMed]
- Santarelli, R.L.; Pierre, F.; Corpet, D. Processed Meat and Colorectal Cancer: A Review of Epidemiologic and Experimental Evidence. Nutr. Cancer 2008, 60, 131–144. [Google Scholar] [CrossRef] [PubMed]
- Keszei, A.P.; Schouten, L.; Goldbohm, R.A.; van den Brandt, P.A. Red and processed meat consumption and the risk of esophageal and gastric cancer subtypes in The Netherlands Cohort Study. Ann. Oncol. 2012, 23, 2319–2326. [Google Scholar] [CrossRef] [PubMed]
- Heinen, M.M.; Verhage, B.A.; Goldbohm, R.A.; van den Brandt, P.A. Meat and fat intake and pancreatic cancer risk in the Netherlands Cohort Study. Int. J. Cancer 2009, 125, 1118–1126. [Google Scholar] [CrossRef]
- Cassens, R.G. Use of sodium nitrite in cured meats today. Food Technol. 1995, 49, 72–80. [Google Scholar]
- Larsson, S.C.; Orsini, N.; Wolk, A. Processed Meat Consumption and Stomach Cancer Risk: A Meta-Analysis. J. Natl. Cancer Inst. 2006, 98, 1078–1087. [Google Scholar] [CrossRef]
- Cross, A.J.; Freedman, N.D.; Ren, J.; Ward, M.H.; Hollenbeck, A.R.; Schatzkin, A.; Sinha, R.; Abnet, C. Meat Consumption and Risk of Esophageal and Gastric Cancer in a Large Prospective Study. Am. J. Gastroenterol. 2011, 106, 432–442. [Google Scholar] [CrossRef] [PubMed]
- Kilfoy, B.A.; Ward, M.H.; Zheng, T.; Holford, T.R.; Boyle, P.; Zhao, P.; Dai, M.; Leaderer, B.; Zhang, Y. Risk of non-Hodgkin lymphoma and nitrate and nitrite from the diet in Connecticut women. Cancer Causes Control. 2010, 21, 889–896. [Google Scholar] [CrossRef] [PubMed]
- Inoue-Choi, M.; Ward, M.H.; Cerhan, J.; Weyer, P.J.; Anderson, K.E.; Robien, K. Interaction of Nitrate and Folate on the Risk of Breast Cancer Among Postmenopausal Women. Nutr. Cancer 2012, 64, 685–694. [Google Scholar] [CrossRef]
- Ward, M.H.; Rusiecki, J.A.; Lynch, C.F.; Cantor, K.P. Nitrate in public water supplies and the risk of renal cell carcinoma. Cancer Causes Control. 2007, 18, 1141–1151. [Google Scholar] [CrossRef] [PubMed]
- de Roos, A.J.; Ward, M.H.; Lynch, C.F.; Cantor, K.P. Nitrate in Public Water Supplies and the Risk of Colon and Rectum Cancers. Epidemiology 2003, 14, 640–649. [Google Scholar] [CrossRef]
- Dubrow, R.; Darefsky, A.S.; Park, Y.; Mayne, S.T.; Moore, S.; Kilfoy, B.; Cross, A.J.; Sinha, R.; Hollenbeck, A.R.; Schatzkin, A.; et al. Dietary Components Related to N-Nitroso Compound Formation: A Prospective Study of Adult Glioma. Cancer Epidemiol. Biomark. Prev. 2010, 19, 1709–1722. [Google Scholar]
- Tiso, M.; Schechter, A.N. Nitrate reduction to nitrite, nitric oxide and ammonia by gut bacteria under physiological conditions. PLoS ONE 2015, 10, e0119712. [Google Scholar]
- Mirvish, S.S. Role of N-nitroso compounds (NOC) and N-nitrosation in etiology of gastric, esophageal, nasopharyngeal and bladder cancer and contribution to cancer of known exposures to NOC. Cancer Lett. 1995, 93, 17–48. [Google Scholar] [CrossRef]
- Michaud, D.S.; Holick, C.N.; Batchelor, T.T.; Giovannucci, E.; Hunter, D.J. Prospective study of meat intake and dietary nitrates, nitrites, and nitrosamines and risk of adult glioma. Am. J. Clin. Nutr. 2009, 90, 570–577. [Google Scholar] [CrossRef]
- Tricker, A.; Pfundstein, B.; Theobald, E.; Preussmann, R.; Spiegelhalder, B. Mean daily intake of volatile N-nitrosamines from foods and beverages in West Germany in 1989–1990. Food Chem. Toxicol. 1991, 29, 729–732. [Google Scholar] [CrossRef]
- Lundberg, J.O.; Weitzberg, E.; Gladwin, M.T. The nitrate–nitrite–nitric oxide pathway in physiology and therapeutics. Nat. Rev. Drug Discov. 2008, 7, 156–167. [Google Scholar] [CrossRef] [PubMed]
- Ward, M.H.; Cantor, K.P.; Riley, D.; Merkle, S.; Lynch, C.F. Nitrate in Public Water Supplies and Risk of Bladder Cancer. Epidemiology 2003, 14, 183–190. [Google Scholar] [CrossRef] [PubMed]
- Espejo-Herrera, N.; Cantor, K.P.; Malats, N.; Silverman, D.T.; Tardon, A.; García-Closas, R.; Serra, C.; Kogevinas, M.; Villanueva, C.M. Nitrate in drinking water and bladder cancer risk in Spain. Environ. Res. 2015, 137, 299–307. [Google Scholar] [CrossRef]
- Bryan, N.S.; Alexander, D.D.; Coughlin, J.R.; Milkowski, A.L.; Boffetta, P. Ingested nitrate and nitrite and stomach cancer risk: An updated review. Food and Chemical Toxicology. 2012, 50, 3646–3665. [Google Scholar] [CrossRef]
- Catsburg, C.E.; Gago-Dominguez, M.; Yuan, J.-M.; Castelao, J.E.; Cortessis, V.K.; Pike, M.C.; Stern, M.C. Dietary sources of N-nitroso compounds and bladder cancer risk: Findings from the Los Angeles bladder cancer study. Int. J. Cancer 2014, 134, 125–135. [Google Scholar] [CrossRef]
- Wu, J.W.; Cross, A.J.; Baris, D.; Ward, M.H.; Karagas, M.R.; Johnson, A.; Schwenn, M.; Cherala, S.; Colt, J.S.; Cantor, K.P.; et al. Dietary intake of meat, fruits, vegetables, and selective micronutrients and risk of bladder cancer in the New England region of the United States. Br. J. Cancer 2012, 106, 1891–1898. [Google Scholar] [CrossRef]
- Eichholzer, M.; Gutzwiller, F. Dietary Nitrates, Nitrites, and N-Nitroso Compounds and Cancer Risk: A Review of the Epidemiologic Evidence. Nutr. Rev. 1998, 56, 95–105. [Google Scholar] [CrossRef] [PubMed]
- Jones, R.R.; DellaValle, C.T.; Weyer, P.J.; Robien, K.; Cantor, K.P.; Krasner, S.; Freeman, L.E.B.; Ward, M.H. Ingested nitrate, disinfection by-products, and risk of colon and rectal cancers in the Iowa Women’s Health Study cohort. Environ. Int. 2019, 126, 242–251. [Google Scholar] [CrossRef] [PubMed]
- Bingham, S.; Pignatelli, B.; Pollock, J.; Ellul, A.; Malaveille, C.; Gross, G.; Runswick, S.; Cummings, J.; O’Neill, I. Does increased endogenous formation of N-nitroso compounds in the human colon explain the association between red meat and colon cancer? Carcinogenesis 1996, 17, 515–523. [Google Scholar] [CrossRef]
- Jakszyn, P.; Gonzalez, C.A. Nitrosamine and related food intake and gastric and oesophageal cancer risk: A systematic review of the epidemiological evidence. World J. Gastroenterol. 2006, 12, 4296–4303. [Google Scholar] [CrossRef]
- DellaValle, C.T.; Xiao, Q.; Yang, G.; Shu, X.-O.; Aschebrook-Kilfoy, B.; Zheng, W.; Li, H.L.; Ji, B.-T.; Rothman, N.; Chow, W.-H.; et al. Dietary nitrate and nitrite intake and risk of colorectal cancer in the Shanghai Women’s Health Study. Int. J. Cancer 2014, 134, 2917–2926. [Google Scholar] [CrossRef] [PubMed]
- Veroniki, A.A.; Jackson, D.; Viechtbauer, W.; Bender, R.; Bowden, J.; Knapp, G.; Kuss, O.; Higgins, J.P.T.; Langan, D.; Salanti, G. Methods to estimate the between-study variance and its uncertainty in meta-analysis. Res. Synth. Methods 2016, 7, 55–79. [Google Scholar] [CrossRef] [PubMed]
- Borenstein, M.; Hedges, L.V.; Higgins, J.P.T.; Rothstein, H.R. Introduction to Meta-Analysis; John Wiley & Sons: Oxford, UK, 2009. [Google Scholar]
- Callisto, M.; Molozzi, J.; Barbosa, J.L.E. Eutrophication of lakes. In Eutrophication: Causes, Consequences and Control; Springer: Dordrecht, The Netherlands, 2014; pp. 55–71. [Google Scholar]
- U.S. Department of Health and Human Services; U.S. Department of Agriculture. 2015–2020 Dietary Guidelines for Americans; USDA: Washington, DC, USA; HHS: Washington, DC, USA, 2015.
- Rogers, H.J.; Swaminathan, H. A Comparison of Logistic Regression and Mantel-Haenszel Procedures for Detecting Differential Item Functioning. Appl. Psychol. Meas. 1993, 17, 105–116. [Google Scholar] [CrossRef]
- DerSimonian, R.; Laird, N. Meta-analysis in clinical trials revisited. Contemp. Clin. Trials 2015, 45, 139–145. [Google Scholar] [CrossRef]
- Aschebrook-Kilfoy, B.; Ward, M.H.; Gierach, G.L.; Schatzkin, A.; Hollenbeck, A.R.; Sinha, R.; Cross, A.J. Epithelial ovarian cancer and exposure to dietary nitrate and nitrite in the NIH-AARP Diet and Health Study. Eur. J. Cancer Prev. 2012, 21, 65–72. [Google Scholar] [CrossRef]
- Weyer, P.J.; Cerhan, J.; Kross, B.C.; Hallberg, G.R.; Kantamneni, J.; Breuer, G.; Jones, M.P.; Zheng, W.; Lynch, C.F. Municipal Drinking Water Nitrate Level and Cancer Risk in Older Women: The Iowa Women’s Health Study. Epidemiology 2001, 12, 327–338. [Google Scholar] [CrossRef]
- Espejo-Herrera, N.; Gracia-Lavedan, E.; Pollan, M.; Aragones, N.; Boldo, E.; Perez-Gomez, B.; Altzibar, J.M.; Amiano, P.; Zabala, A.J.; Ardanaz, E.; et al. Ingested Nitrate and Breast Cancer in the Spanish Multicase-Control Study on Cancer (MCC-Spain). Environ. Health Perspect. 2016, 124, 1042–1049. [Google Scholar] [CrossRef]
- Ward, M.H.; Kilfoy, B.A.; Weyer, P.J.; Anderson, K.E.; Folsom, A.R.; Cerhan, J. Nitrate Intake and the Risk of Thyroid Cancer and Thyroid Disease. Epidemiology 2010, 21, 389–395. [Google Scholar] [CrossRef]
- Kilfoy, B.A.; Zhang, Y.; Park, Y.; Holford, T.R.; Schatzkin, A.; Hollenbeck, A.; Ward, M.H. Dietary nitrate and nitrite and the risk of thyroid cancer in the NIH-AARP Diet and Health Study. Int. J. Cancer 2010, 129, 160–172. [Google Scholar] [CrossRef]
- Ward, M.H.; Cerhan, J.; Colt, J.S.; Hartge, P. Risk of Non-Hodgkin Lymphoma and Nitrate and Nitrite from Drinking Water and Diet. Epidemiology 2006, 17, 375–382. [Google Scholar] [CrossRef]
- Ward, M.H.; Mark, S.D.; Cantor, K.P.; Weisenburger, D.D.; Correa-Villasenor, A.; Zahm, S.H. Drinking water nitrate and the risk of non-Hodgkin’s lymphoma. Epidemiology 1996, 7, 465–471. [Google Scholar] [CrossRef] [PubMed]
- Aschebrook-Kilfoy, B.; Ward, M.H.; Zheng, T.; Holford, T.R.; Boyle, P.; Leaderer, B.; Zhang, Y. Dietary Nitrate and Nitrite Intake and Non-Hodgkin Lymphoma Survival. Nutr. Cancer 2012, 64, 488–492. [Google Scholar] [CrossRef] [PubMed]
- Aschebrook-Kilfoy, B.; Ward, M.H.; Dave, B.J.; Smith, S.M.; Weisenburger, D.D.; Chiu, B.C.-H. Dietary nitrate and nitrite intake and risk of non-Hodgkin lymphoma. Leuk. Lymphoma 2013, 54, 945–950. [Google Scholar] [CrossRef] [PubMed]
- Chiu, B.C.-H.; Dave, B.J.; Ward, M.H.; Fought, A.J.; Hou, L.; Jain, S.; Gapstur, S.; Evens, A.M.; Zahm, S.H.; Blair, A.; et al. Dietary factors and risk of t(14;18)-defined subgroups of non-Hodgkin lymphoma. Cancer Causes Control. 2008, 19, 859–867. [Google Scholar] [CrossRef] [PubMed]
- Quist, A.J.; Inoue-Choi, M.; Weyer, P.J.; Anderson, K.E.; Cantor, K.P.; Krasner, S.; Freeman, L.E.B.; Ward, M.H.; Jones, R.R. Ingested nitrate and nitrite, disinfection by-products, and pancreatic cancer risk in postmenopausal women. Int. J. Cancer 2018, 142, 251–261. [Google Scholar] [CrossRef]
- Coss, A.; Cantor, K.P.; Reif, J.S.; Lynch, C.F.; Ward, M.H. Pancreatic Cancer and Drinking Water and Dietary Sources of Nitrate and Nitrite. Am. J. Epidemiol. 2004, 159, 693–701. [Google Scholar] [CrossRef]
- Zheng, J.; Stuff, J.; Tang, H.; Hassan, M.M.; Daniel, C.R.; Li, N. Dietary N-nitroso compounds and risk of pancreatic cancer: Results from a large case–control study. Carcinogenesis 2019, 40, 254–262. [Google Scholar] [CrossRef]
- Aschebrook-Kilfoy, B.; Cross, A.J.; Stolzenberg-Solomon, R.Z.; Schatzkin, A.; Hollenbeck, A.R.; Sinha, R.; Ward, M.H. Pancreatic Cancer and Exposure to Dietary Nitrate and Nitrite in the NIH-AARP Diet and Health Study. Am. J. Epidemiol. 2011, 174, 305–315. [Google Scholar] [CrossRef]
- Zeegers, M.P.; Selen, R.F.; Kleinjans, J.C.; Goldbohm, R.A.; van den Brandt, P.A. Nitrate Intake Does Not Influence Bladder Cancer Risk: The Netherlands Cohort Study. Environ. Health Perspect. 2006, 114, 1527–1531. [Google Scholar] [CrossRef]
- Karwowska, M.; Kononiuk, A. Nitrates/Nitrites in Food—Risk for Nitrosative Stress and Benefits. Antioxidants 2020, 9, 241. [Google Scholar] [CrossRef]
- Jones, R.R.; Weyer, P.J.; Dellavalle, C.T.; Robien, K.; Cantor, K.P.; Krasner, S.; Freeman, L.E.B.; Ward, M.H. Ingested Nitrate, Disinfection By-products, and Kidney Cancer Risk in Older Women. Epidemiology 2017, 28, 703–711. [Google Scholar] [CrossRef] [PubMed]
- Ward, M.H.; Heineman, E.F.; Markin, R.S.; Weisenburger, D.D. Adenocarcinoma of the stomach and esophagus and drinking water and dietary sources of nitrate and nitrite. Int. J. Occup. Environ. Health 2008, 14, 193–197. [Google Scholar] [CrossRef] [PubMed]
- Keszei, A.P.; Goldbohm, R.A.; Schouten, L.J.; Jakszyn, P.; van den Brandt, P.A. Dietary N-nitroso compounds, endogenous nitrosation, and the risk of esophageal and gastric cancer subtypes in the Netherlands Cohort Study. Am. J. Clin. Nutr. 2013, 97, 135–146. [Google Scholar] [CrossRef] [PubMed]
- van Loon, A.J.; Botterweck, A.A.; Goldbohm, R.A.; Brants, H.A.; van Klaveren, J.D.; van den Brandt, P.A. Intake of nitrate and nitrite and the risk of gastric cancer: A prospective cohort study. Br. J. Cancer 1998, 78, 129–135. [Google Scholar] [CrossRef] [PubMed]
- Hernández-Ramírez, R.U.; Galván-Portillo, M.V.; Ward, M.H.; Agudo, A.; González, C.A.; Oñate-Ocaña, L.F.; Herrera-Goepfert, R.; Palma-Coca, O.; López-Carrillo, L. Dietary intake of polyphenols, nitrate and nitrite and gastric cancer risk in Mexico City. Int. J. Cancer 2009, 125, 1424–1430. [Google Scholar] [CrossRef]
- La Vecchia, C.; Ferraroni, M.; D’Avanzo, B.; Decarli, A.; Franceschi, S. Selected micronutrient intake and the risk of gastric cancer. Cancer Epidemiol. Biomark. Prev. 1994, 3, 393–398. [Google Scholar]
- Ferrucci, L.M.; Sinha, R.; Huang, W.-Y.; Berndt, S.I.; Katki, H.A.; Schoen, R.E.; Hayes, R.B.; Cross, A.J. Meat consumption and the risk of incident distal colon and rectal adenoma. Br. J. Cancer 2011, 106, 608–616. [Google Scholar] [CrossRef]
- Zhu, Y.; Wang, P.P.; Zhao, J.; Green, R.; Sun, Z.; Roebothan, B.; Squires, J.; Buehler, S.; Dicks, E.; Zhao, J.; et al. Dietary N-nitroso compounds and risk of colorectal cancer: A case–control study in Newfoundland and Labrador and Ontario, Canada. Br. J. Nutr. 2014, 111, 1109–1117. [Google Scholar] [CrossRef]
- Ward, M.H.; Heineman, E.F.; McComb, R.D.; Weisenburger, D.D. Drinking Water and Dietary Sources of Nitrate and Nitrite and Risk of Glioma. J. Occup. Environ. Med. 2005, 47, 1260–1267. [Google Scholar] [CrossRef]
- Barry, K.H.; Jones, R.R.; Cantor, K.P.; Freeman, L.E.B.; Wheeler, D.C.; Baris, D.; Johnson, A.T.; Hosain, G.M.; Schwenn, M.; Zhang, H.; et al. Ingested Nitrate and Nitrite and Bladder Cancer in Northern New England. Epidemiology 2020, 31, 136–144. [Google Scholar] [CrossRef]
- Engel, L.S.; Chow, W.; Vaughan, T.L.; Gammon, M.D.; Risch, H.A.; Stanford, J.L.; Schoenberg, J.B.; Mayne, S.T.; Dubrow, R.; Rotterdam, H.; et al. Population Attributable Risks of Esophageal and Gastric Cancers. J. Natl. Cancer Inst. 2003, 95, 1404–1413. [Google Scholar] [CrossRef] [PubMed]
- Pobel, D.; Riboli, E.; Cornée, J.; Hémon, B.; Guyader, M. Nitrosamine, nitrate and nitrite in relation to gastric cancer: A case-control study in Marseille, France. Eur. J. Epidemiol. 1995, 11, 67–73. [Google Scholar] [CrossRef] [PubMed]
- Mayne, S.T.; Risch, H.A.; Dubrow, R.; Chow, W.H.; Gammon, M.D.; Vaughan, T.L.; Farrow, D.C.; Schoenberg, J.B.; Stanford, J.L.; Ahsan, H.; et al. Nutrient intake and risk of subtypes of esophageal and gastric cancer. Cancer Epidemiol. Biomark. Prev. 2001, 10, 1055–1062. [Google Scholar]
- Li, H.; Duncan, C.; Townend, J.; Killham, K.; Smith, L.M.; Johnston, P.; Dykhuizen, R.; Kelly, D.; Golden, M.; Benjamin, N.; et al. Nitrate-reducing bacteria on rat tongues. Appl. Environ. Microbiol. 1997, 63, 924–930. [Google Scholar] [CrossRef] [PubMed]
- Muñoz, J. Salud 21 de la Región de Europa: Meta 11; Organización Mundial de la Salud: Copenhagen, Denmark, 2000. [Google Scholar]
- Robertson, A.; Tirado, C.; Lobstein, T.; Jermini, M.; Knai, C.; Jensen, J.H.; Ferro-Luzzi, A.; James, W.P. Food and Health in Europe: A New Basis for Action; WHO Regional Office for Europe: Copenhagen, Denmark, 2004. [Google Scholar]
- Roberts, J.A.; Cumberland, P.; Sockett , P.N.; Wheeler, J.; Rodrigues, L.C.; Sethi, D.; Roderick, P.J.; Infectious Intestinal Disease Study Executive. A Report of the Study of Infectious Intestinal Disease in England; The Stationery Office: London, UK, 2000. [Google Scholar]
- Morris, R.D.; Audet, A.M.; Angelillo, I.F.; Chalmers, T.C.; Mosteller, F. Chlorination, chlorination by-products, and cancer: A meta-analysis. Am. J. Public Health 1992, 82, 955–963. [Google Scholar] [CrossRef] [PubMed]
- Essien, E.E.; Abasse, K.S.; Côté, A.; Mohamed, K.S.; Baig, M.M.F.A.; Habib, M.; Naveed, M.; Yu, X.; Xie, W.; Jinfang, S.; et al. Drinking-water nitrate and cancer risk: A systematic review and meta-analysis. Arch. Environ. Occup. Health 2020, 77, 51–67. [Google Scholar] [CrossRef]


| Type of Cancer | Highest versus the Lowest (Reference) Category | All Combined Highest versus the Lowest (Reference) Category | Publication Bias | |||
|---|---|---|---|---|---|---|
| Pooled OR (95% CI) | I-Squared (I2) and p-Value | Pooled OR (95% CI) | I-Squared (I2) and p-Value | Egger’s Test p-Value | Begg’s Test p-Value | |
| (a) Ovarian and uterine corpus (nitrate) | 1.03, (0.84, 1.22) | 28.7%, p = 0.240 | 0.97, (0.75, 1.19) | 80.6%, p = 0.001 | 0.067 | 0.090 |
| (b) Breast (nitrate) | 0.91, (0.81, 1.00) | 0.0%, p = 0.526 | 0.92, (0.87, 0.96) | 42.7%, p = 0.175 | 0.310 | 0.144 |
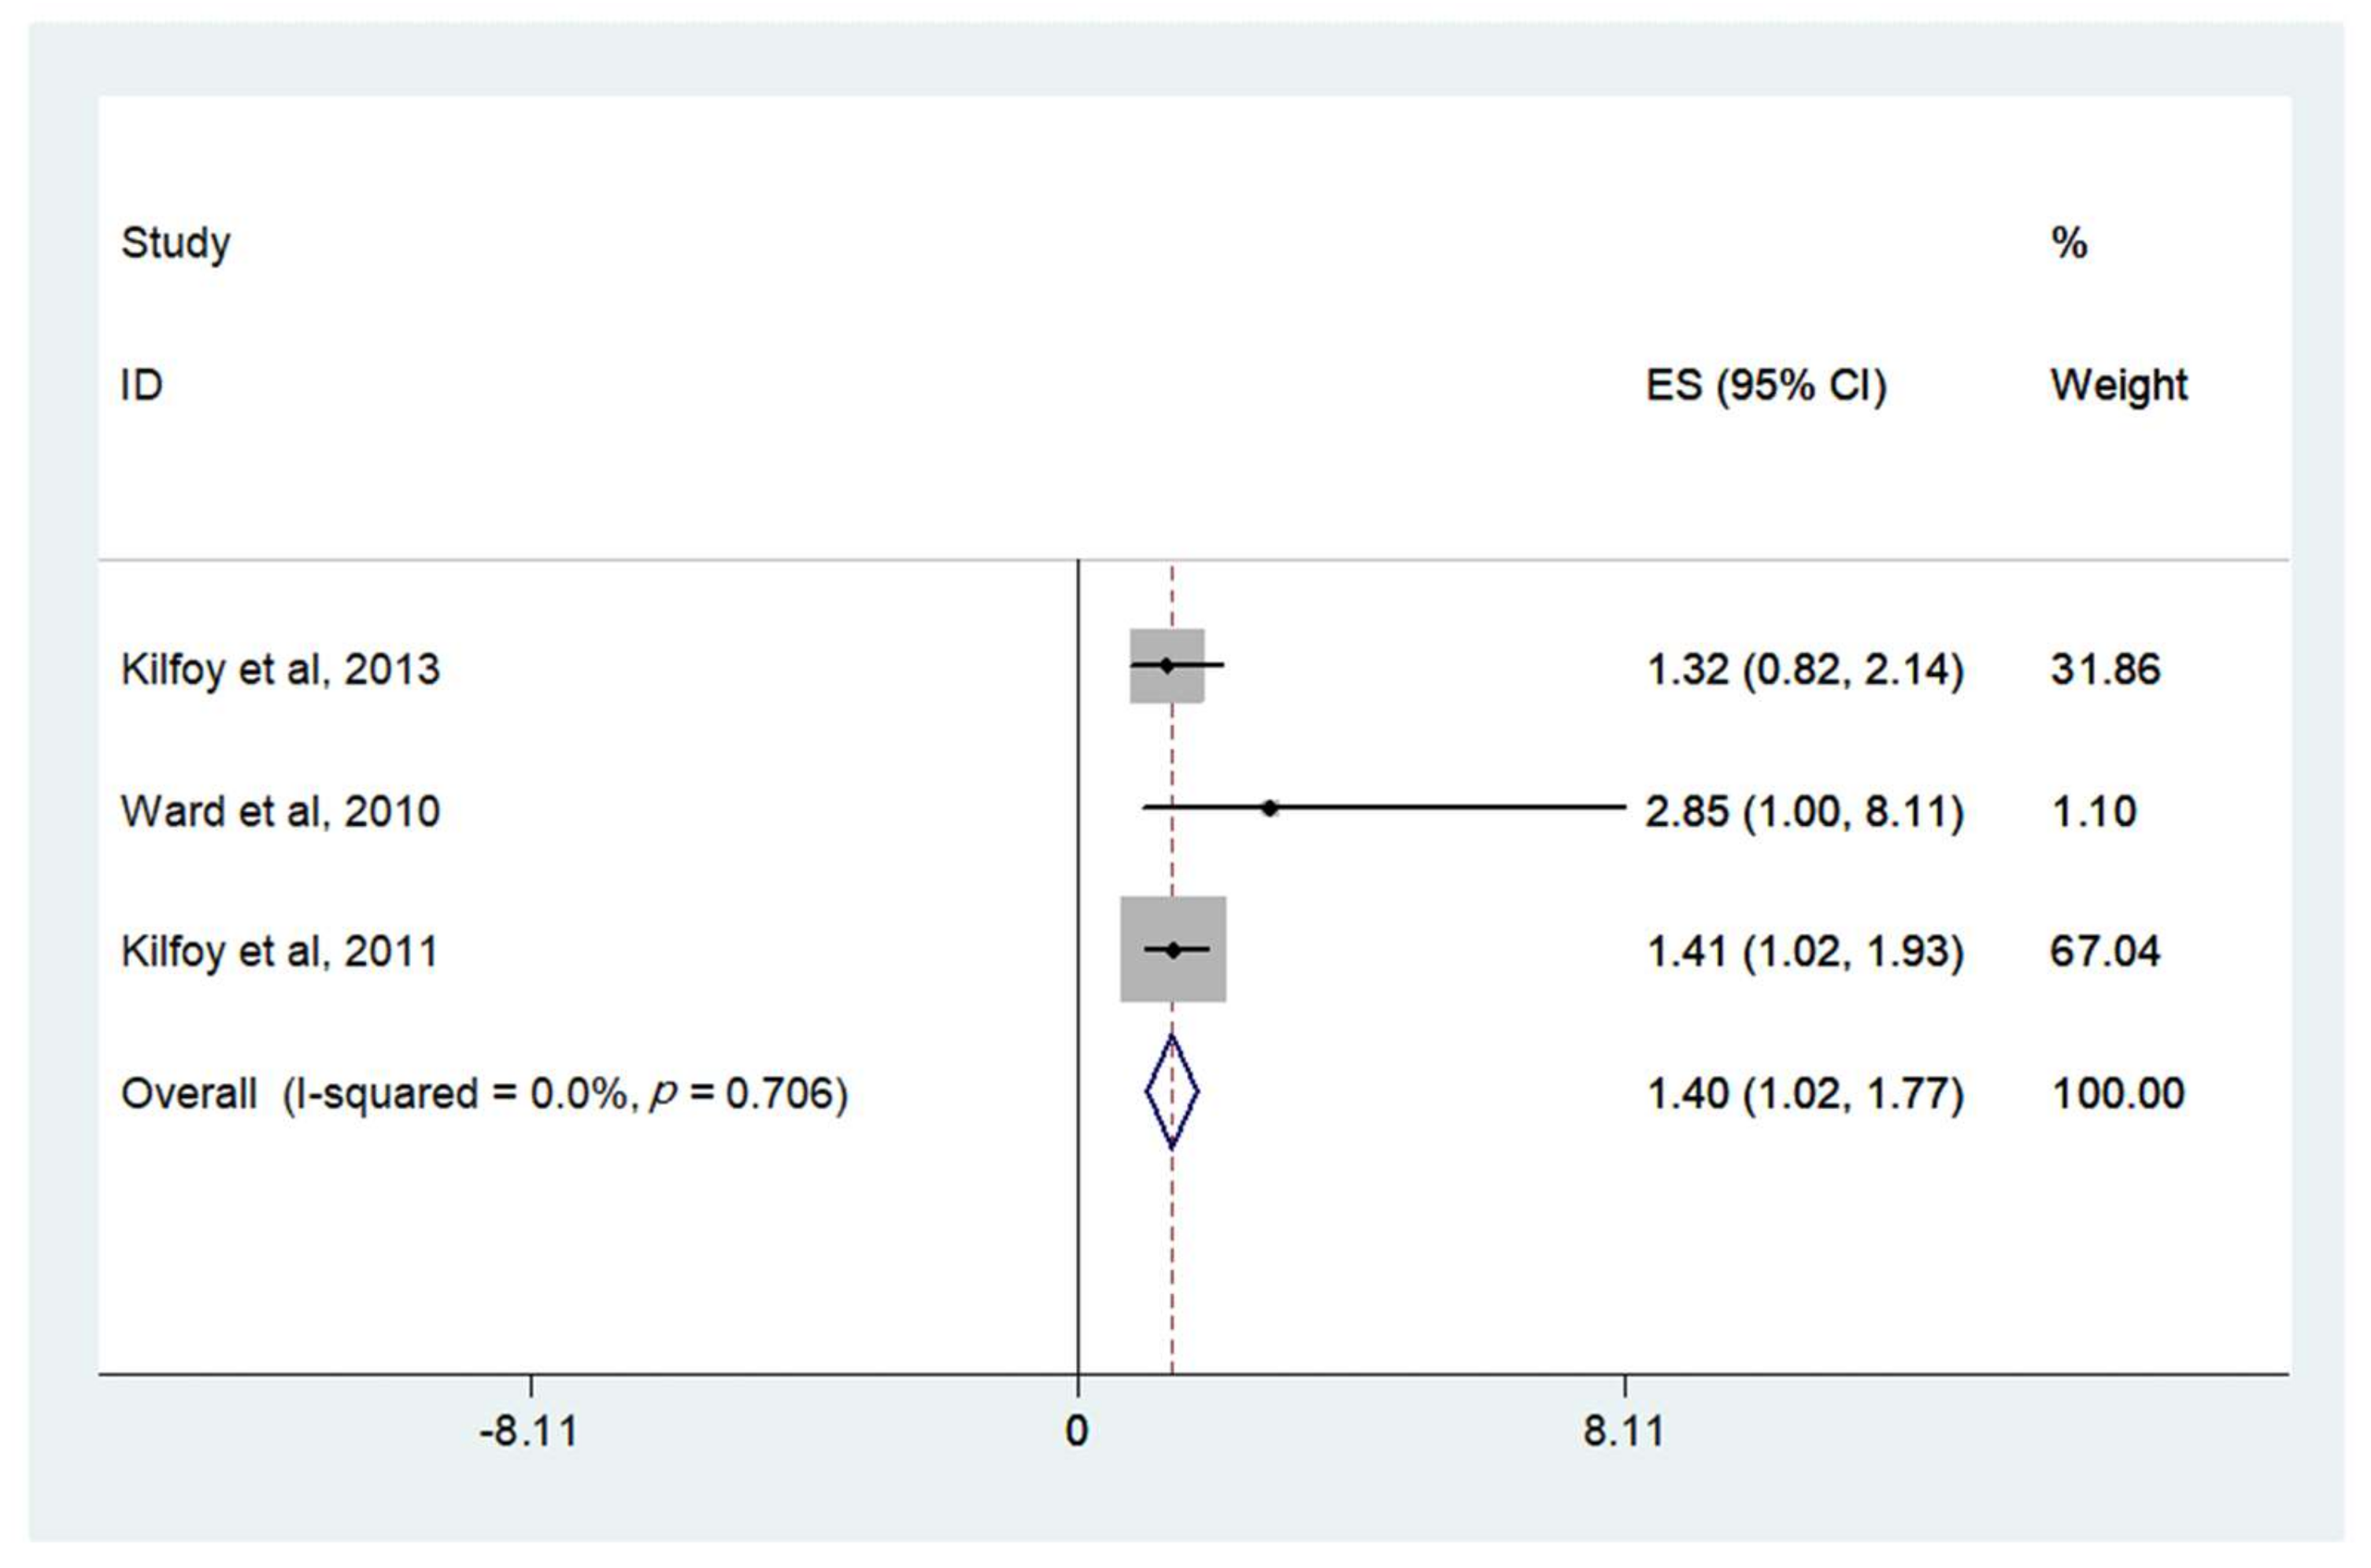
| (c) Thyroid (nitrate) | 1.40, (1.02, 1.77) | 0.0%, p = 0.706 | 1.27, (0.85, 1.69) | 62.0%, p = 0.072 | 0.064 | 0.325 |
| (d) Glioma (nitrate) | 1.11, (0.91, 1.31) | 0.0%, p = 0.546 | 1.11, (0.94, 1.29) | 66.9%, p = 0.049 | 0.132 | 0.040 |
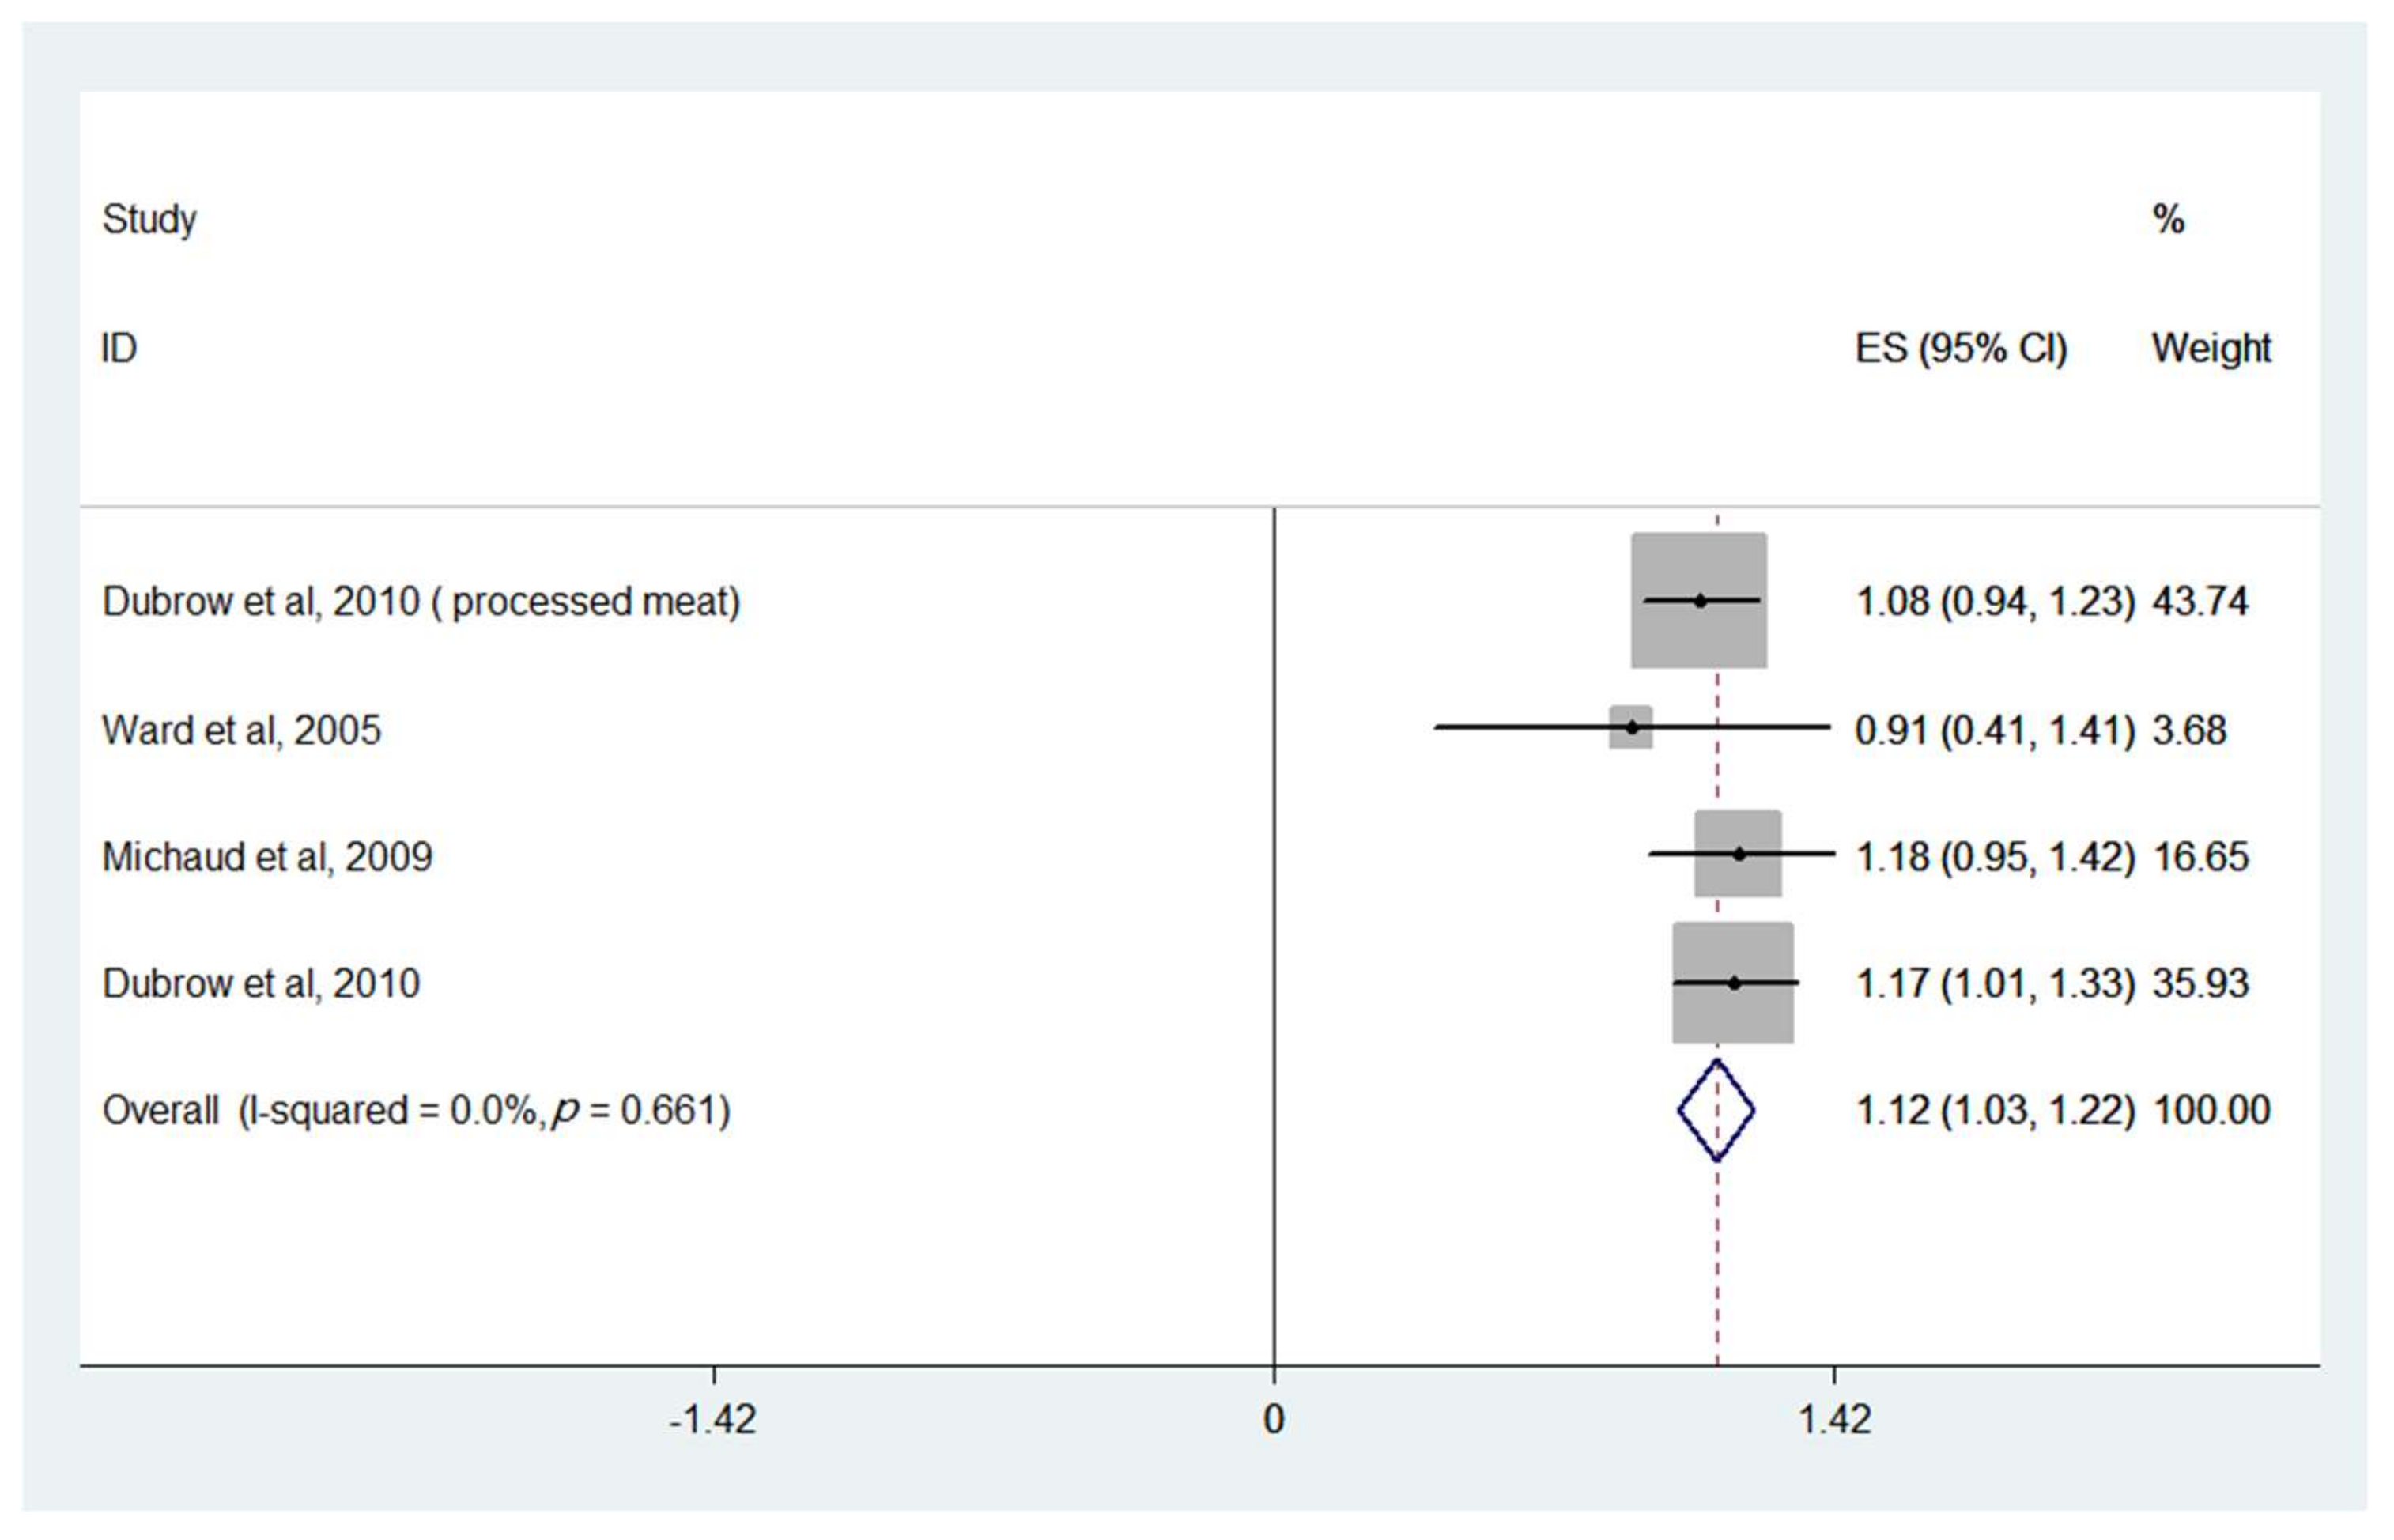
| (e) Glioma (nitrite) | 1.17, (0.98, 1.37) | 0.0%, p = 0.646 | 1.12, (1.03, 1.22) | 0.0%, p = 0.661 | 0.442 | 0.060 |
| (f) Non-Hodgkin’s Lymphoma (nitrate) | 0.82, (0.69, 0.94) | 27.1%, p = 0.195 | 0.83, (0.75, 0.91) | 35.6%, p = 0.124 | 0.163 | 0.728 |
| (g) Non-Hodgkin’s Lymphoma (nitrite) | 1.21, (0.78, 1.64) | 63%, p = 0.019 | 1.11, (0.85, 1.38) | 71.4%, p = 0.004 | 0.496 | 0.702 |
| (h) Pancreatic (nitrate) | 0.96, (0.84, 1.09) | 35.9%, p = 0.167 | 0.95, (0.89, 1.00) | 48.0%, p = 0.087 | 0.722 | 0.399 |
| (i) Pancreatic (nitrite) | 0.87, (0.76, 0.97) | 44.3%, p = 0.095 | 1.04, (0.85, 1.24) | 76.1%, p = 0.000 | 0.000 | 0.000 |
| (j) Bladder (nitrate) | 0.94, (0.84, 1.04) | 0.0%, p = 0.615 | 0.94, (0.84, 1.03) | 70.7%, p = 0.001 | 0.089 | 0.322 |
| (k) Bladder (nitrite) | 1.07, (0.94, 1.19) | 0.0%, p = 0.574 | 1.05, (0.92, 1.18) | 79.2%, p = 0.000 | 0.045 | 0.338 |
| (l) Kidney (nitrate) | 0.79, (0.17, 1.41) | 64.7%, p = 0.059 | 0.84, (0.52, 1.16) | 73.1%, p = 0.024 | 0.019 | 0.016 |
| (m) Kidney (nitrite) | 0.92, (0.62, 1.23) | 0.0%, p = 0.586 | 1.10, (0.78, 1.48) | 76.7%, p = 0.014 | 0.322 | 0.245 |
| (n) Colon (nitrate) | 0.99, (0.91, 1.08) | 40.1%, p = 0.100 | 1.00, (0.96, 1.04) | 0.0%, p = 0.593 | 0.332 | 0.284 |
| (o) Colon (nitrite) | 1.02, (0.92, 1.11) | 44.8%, p = 0.093 | 1.02, (0.93, 1.11) | 67.2%, p = 0.006 | 0.027 | 0.141 |
| (p) Rectal (nitrate) | 1.01, (0.88, 1.14) | 33.4%, p = 0.161 | 1.10, (0.96, 1.24) | 68.8%, p = 0.002 | 0.367 | 0.930 |
| (q) Rectal (nitrite) | 1.09, (0.79, 1.39) | 68.2%, p = 0.008 | 1.06, (0.87, 1.26) | 82.3%, p = 0.000 | 0.841 | 0.952 |
| (r) Esophageal (nitrate) | 0.75, (0.57, 0.94) | 46.1%, p = 0.073 | 0.83, (0.72, 0.94) | 33.7%, p = 0.159 | 0.983 | 0.446 |
| (s) Esophageal (nitrite) | 1.01, (0.78, 1.23) | 0.0%, p = 0.689 | 0.93, (0.81, 1.05) | 0.0%, p = 0.881 | 0.197 | 0.714 |
| (t) Stomach (nitrate) | 0.81, (0.70, 0.92) | 0.0%, p = 0.776 | 0.81, (0.75, 0.87) | 22.0%, p = 0.234 | 0.000 | 0.006 |
| (u) Stomach (nitrite) | 1.06, (0.92, 1.20) | 32.9%, p = 0.127 | 1.04, (0.91, 1.11) | 54.7%, p = 0.012 | 0.308 | 0.382 |
| First Author, Year, Country | Study Design | Case | Control/Number of Person-Years | Exposure Categories Nitrate Intake (mg/day) | Reported OR/RR/HR 95 CI | Cancer Sites | Adjustment | NOS |
|---|---|---|---|---|---|---|---|---|
| Briseis Aschebrook-Kilfoya et al., 2012, USA [51] | Cohort study, 1995–1996 | 128 143 143 140 155 | ⁕ | 36.7 58.1 78.4 109.5 175.4 | 1 (Reference) 1.13 (0.89–1.44) 1.15 (0.9–1.44) 1.14 (0.89–1.46) 1.31 (1.01–1.68) | Ovary | Age, race, total energy intake, family history of ovarian cancer, BMI, education, smoking status, menopausal status, parity, age at menarche, and total daily dietary vitamin C intake | 8 |
| Peter J. Weyer et al., 2001, USA [52] | Cohort study, 1986–1998 | 24 28 28 22 | ⁕ | 0–11.6 11.6–18 18.1–27.2 27.2–36.3 | 1 (Reference) 1.12 (0.65–1.94) 1.1 (0.63–1.92) 0.85 (0.47–1.55) | Ovary | Age and total energy intake | 7 |
| 71 41 51 61 | ⁕ | 0–11.6 11.6–18 18.1–27.2 27.2–36.3 | 1 (Reference) 0.6 (0.41–0.88) 0.78 (0.54–1.12) 0.97 (0.68–1.39) | Uterine corpus | ||||
| Maki Inoue-Choi et al., 2015, USA [12] | Population-based cohort, 1986–2010 | 59 73 54 74 55 | ⁕ | 3.87–65.43 65.44–92.04 92.05–121.96 121.97–165.48 165.48–209.2 | 1 (Reference) 1.18 (0.83–1.68) 0.86 (0.58–1.26) 1.21 (0.84–1.74) 0.85 (0.56–1.27) | Ovary | Age, BMI, family history of ovarian cancer, number of live births, age at menarche, age at menopause, age at first live birth, oral contraceptive use, estrogen use, and history of unilateral oophorectomy, and total energy intake | 8 |
| Maki Inoue-Choi et al., 2012, USA [26] | Prospective cohort study, 1986–2008 | 604 541 575 601 554 | ⁕ | 3.9–65.2 65.2–91.8 91.8–121.8 121.8–165.6 165.6–209.9 | 1 (Reference) 0.86 (0.76–0.98) 0.9 (0.79–1.02) 0.96 (0.84–1.1) 0.86 (0.74–1.01) | Breast | Age, total energy intake, BMI, WHR, education, smoking, physical activity level, alcohol intake, family history of breast cancer, education, smoking status, age at menopause, age at first live birth, estrogen use, total intake of folate, vitamin C and E intake and flavonoids, intake of cruciferae and red meat | 8 |
| Nadia Espejo-Herrera et al., 2016, Spain [53] | Multicase–Control Study, 2008–2013 | 387 349 348 | ⁕ | 0–90 90–138 138–186 | 1 (Reference) 0.9 (0.74–1.1) 0.9 (0.73–1.1) | Breast | Study area, age, and education | 6 |
| Peter J. Weyer et al., 2001, USA [52] | Cohort study in Iowa, 1986–1998 | 253 252 265 254 | ⁕ | 0–11.6 11.6–18 18.1–27.2 27.2–36.3 | 1 (Reference) 0.98 (0.83–1.17) 1.04 (0.87–1.24) 0.99 (0.83–1.19) | Breast | Age and total energy intake | 7 |
| Briseis Aschebrook-Kilfoy, et al., 2013, China [14] | Cohort study, 1996–2009 | 34 56 41 33 | ⁕ | 165.8 257.8 350.6 506.8 | 1 (Reference) 1.81 (1.18–2.76) 1.44 (0.92–2.28) 1.32 (0.82–2.14) | Thyroid | Age, total energy intake, education, and history of thyroid disease | 8 |
| Mary H. Ward, et al., 2010, USA [54] | Cohort study, 1986–2004 | 6 10 10 14 | 77,806 86,270 89,707 83,454 | 0–17.4 17.5–27.7 27.8–41.1 41.1–54.4 | 1 (Reference) 1.65 (0.59–4.61) 1.69 (0.58–4.84) 2.85 (1–8.11) | Thyroid | Age, total calories, vitamin C intake, and residence location | 8 |
| Briseis Aschebrook-Kilfoy et al., 2011, USA [55] | Prospective cohort study, 1995–2003 | 63 67 60 74 106 | ⁕ | 29.6 49.8 70.2 100.9 166.8 | 1 (Reference) 1.01 (0.72–1.43) 0.87 (0.61–1.24) 1.04 (0.74–1.45) 1.41 (1.02–1.93) | Thyroid | Age | 8 |
| Dominique S. Michaud, et al. 2009, USA [32] | 3 prospective cohort studies, 1976–2005 | 67 74 60 59 75 | Sub-cohort (PY) =815,155 833,168 811,541 822,304 818,945 | ⁑ 69.3 94.7 127.7 180 | 1 (Reference) 1.06 (0.76–1.48) 0.84 (0.57–1.22) 0.95 (0.46–1.98) 1.02 (0.66–1.58) | Glioma | Age and caloric intake | 6 |
| *Robert Dubrow et al., 2010, USA [29] | Prospective cohort study, 1995–2003 | 98 114 135 126 112 | ⁕ | 48.38 74.8 102.38 143.5 237.13 | 1 (Reference) 1.16 (0.89–1.52) 1.41 (1.09–1.84) 1.37 (1.05–1.79) 1.28 (0.97–1.7) | Glioma | Sex, age, race, energy intake, education, height, and history of cancer at baseline | 8 |
| 100 121 135 109 120 | ⁕ | 0.275 (nitrite plus nitrate) 0.725 1.225 1.925 3.575 | 1 (Reference) 1.15 (0.88–1.5) 1.24 (0.95–1.61) 0.97 (0.74–1.28) 1.04 (0.79–1.36) | |||||
| Mary H. Ward et al., 2006, USA [56] | Case-control study, 1998–2000 | 156 116 111 80 | 98 98 98 97 | 0–76 76–113.9 114–169.9 170–225.9 | 1 (Reference) 0.75 (0.51–1.1) 0.71 (0.47–1.07) 0.54 (0.34–0.86) | Non-Hodgkin’s lymphoma | Age, education, sex, study center, race, dietary vitamin C, and total energy | 7 |
| Mary H. Ward, et al., 1996, USA [57] | Case-control study, 1950–1987 | 35 38 20 11 | 82 106 86 64 | 0–13 13–19 19–26 26–33 | 1 (Reference) 1.1 (0.6–2.0) 0.8 (0.4–1.7) 0.7 (0.3–1.9) | Non-Hodgkin’s lymphoma | Age, gender, family history of cancer, vitamin C, and carotenes | 7 |
| Peter J. Weyer, et al., 2001, USA [52] | Cohort study, 1986–1998 | 37 34 25 38 | ⁕ | 0–11.6 11.6–18 18.1–27.2 27.2–36.3 | 1 (Reference) 0.88 (0.55–1.4) 0.62 (0.37–1.04) 0.91 (0.56–1.46) | Non-Hodgkin’s lymphoma | Age and total energy intake | 7 |
| Briseis Aschebrook-Kilfoya et al., 2012, USA [58] | Case-control, 1996–2008 | ⁕ | ⁕ | 0–62.8 62.8–95.9 95.9–141 141–186.1 | 1 (Reference) 1 (0.7–1.4) 1.1 (0.7–1.6) 1 (0.7–1.5) | Non-Hodgkin’s lymphoma | Calories, age, family history, and vitamin C | 7 |
| Briseis Aschebrook-Kilfoya et al., 2013, USA [59] | Case-control, 1999–2002 | 100 83 80 72 | 115 115 114 115 | 46.5 80.5 110.9 178.5 | 1 (Reference) 0.9 (0.6–1.3) 0.9 (0.6–1.3) 0.8 (0.5–1.3) | Non-Hodgkin’s lymphoma | Sex, age, body mass index, education, family history of cancer, vitamin C, and daily caloric intake | 6 |
| Brian C.-H. Chiu et al., 2008, USA [60] | Case-control study, 1983–1986 | 17 19 24 | 357 358 360 | 0–70 70–106 106–142 | 1 (Reference) 1 (0.5–1.9) 1.2 (0.6–2.4) | Non-Hodgkin’s lymphoma | Age, sex, type of respondent, family history of cancer, and body mass index | 8 |
| 17 19 24 | 357 358 360 | 0–65 65–101 101–137 | 1 (Reference) 1 (0.5–1.9) 1.2 (0.6–2.4) | |||||
| 36 28 23 | 357 358 360 | 0–70 70–106 106–142 | 1 (Reference) 0.8 (0.5–1.3) 0.7 (0.4–1.2) | |||||
| 36 29 22 | 357 358 360 | 0–65 65–101 101–137 | 1 (Reference) 0.8 (0.5–1.3) 0.6 (0.3–1.1) | |||||
| Briseis Aschebrook-Kilfoya et al., 2010, USA [25] | Case-control study, 1995–2001 | 274 317 | 352 355 | Low High | 1 (Reference) 1.09 (0.86–1.39) | Non-Hodgkin’s lymphoma | Age, family history of cancer, calories, vitamin C intake, vitamin E intake, and protein intake | 7 |
| Arbor J.L. Quist et al., 2018, USA [61] | Cohort study, 1986–2011 | 78 80 73 60 17 | n = 8558 8552 8568 6849 1715 | 0–16.2 16.2–23.9 24–34.2 34.3–58.5 58.5–82.7 | 1 (Reference) 1.08 (0.78–1.48) 0.99 (0.7–1.39) 1.05 (0.72–1.52) 1.25 (0.71–2.21) | Pancreas | Age, smoking category, calories, and mutually adjusted for either natural log-transported nitrate or nitrite | |
| Angela Coss, et al., 2004, USA [62] | Case-control study, 1960–1987 | 26 33 39 43 | 298 311 311 327 | 0–58 58–82 83–117 117–151 | 1 (Reference) 1.1 (0.63–1.9) 1.2 (0.7–2) 1 (0.6–1.8) | Pancreas | Age, cigarette use, and caloric intake | |
| 39 33 24 26 | 164 157 158 160 | 0–63 63–90 91–126 126–161 | 1 (Reference) 0.99 (0.58–1.7) 0.64 (0.36–1.1) 0.53 (0.29–0.97) | |||||
| Peter J. Weyer et al., 2001, USA [52] | Cohort study, 1986–1998 | 19 15 16 19 | ⁕ | 0–11.6 11.6–18 18.1–27.2 27.2–36.3 | 1 (Reference) 0.79 (0.4–1.56) 0.86 (0.44–1.69) 1.02 (0.52–1.99) | Pancreas | Age and total energy intake | 7 |
| *Jiali Zheng et al., 2019, USA [63] | Case–control study, 2002–2009 | 283 236 192 271 | 235 234 235 234 | 9.18–73.5 69.4–101.1 92.8–133.6 119.1–715.9 | 1 (Reference) 0.93 (0.72–1.2) 0.76 (0.59–0.99) 1.08 (0.84–1.39) | Pancreas | Age and energy intake | |
| Briseis Aschebrook-Kilfoy et al., 2011, USA [64] | Prospective cohort study, 1995–2006 | 370 330 360 340 322 | ⁕ | 34.8 56.9 75.0 95.3 150.3 | 1 (Reference) 0.91 (0.78–1.06) 1.02 (0.88–1.18) 0.99 (0.85–1.16) 1.01 (0.85–1.2) | Pancreas | Age, race, total energy intake, smoking status, family history of cancer, family history of diabetes, body mass index, and intakes of saturated fat, folate, and vitamin C | |
| Rena R. Jones, et al., 2016, USA [8] | Cohort study, 1986–2010 | 67 68 64 59 | n = 8467 8489 8, 506 8502 | 0–16.2 16.2–23.9 24–34.2 34.2–44.4 | 1 (Reference) 1 (0.72–1.41) 0.92 (0.66–1.3) 0.86 (0.6–1.22) | Bladder | Age and total in-transformed dietary nitrite from all sources | |
| Maurice P. Zeegers et al., 2006, Netherlands [65] | Cohort study, 1986–1995 | 168 186 181 180 174 | Subcohort (PY) =8512 8652 8706 8707 8564 | 2–69 69–88 88–107.5 107.5–135.3 135.3–451.1 | 1 (Reference) 1.14 (0.89–1.45) 1 (0.78–1.27) 1.02 (0.8–1.3) 1.01 (0.79–1.29) | Bladder | Age and sex | |
| Chelsea E. Catsburg et al., 2014, USA [38] | Case-control study, 1987–1996 | 467 329 293 274 284 | 315 314 315 315 314 | 0–64.3 64.4–91.4 91.5–117.3 117.4–148.3 148.4–179.3 | 1 (Reference) 0.79 (0.63–1.01) 0.74 (0.57–0.97) 0.78 (0.58–1.06) 0.9 (0.6–1.35) | Bladder | Smoking duration, smoking intensity, and smoking status | 8 |
| Mary H. Ward et al., 2003, USA [35] | Case-control study, 1986–1989. | ⁕ | ⁕ | 0–59 59–84 84–119 119–154 | 1 (Reference) 0.8 (0.7–1.1) 0.9 (0.7–1.2) 0.9 (0.7–1.1) | Bladder | Age, education, and cigarette smoking, years chlorinated surface water, and study period | |
| ⁕ | ⁕ | 0–62 62–90 90–127 127–164 | 1 (Reference) 1.2 (0.8–1.9) 0.9 (0.5–1.4) 0.8 (0.5–1.3) | |||||
| Peter J. Weyer, et al., 2001, USA [52] | Cohort study, 1986–1998 | 9 17 13 14 | ⁕ | 0–11.6 11.6–18 18.1–27.2 27.2–36.3 | 1 (Reference) 1.88 (0.84–4.24) 1.46 (0.62–3.47) 1.57 (0.66–3.75) | Bladder | Age and total energy intake | 7 |
| Kathryn Hughes Barry et al., 2020, New England [66] | Case–control study, 1994–1996 and 2001–2004 | 227 230 225 183 172 | 247 245 243 246 244 | 0–21.9 21.19–28.28 28.28–36.10 36.10–47.21 >47.21 | 1 (Reference) 1.2 (0.88–1.5) 1.2 (0.92–1.6) 1.0 (0.75–1.4) 0.95 (0.69–1.3) | Bladder | Adjusted for age, gender, smoking status, high-risk occupation, race, ethnicity, state, dietary vitamin C intake (per 1000 kcal—continuous), dietary vitamin B12 (per 1000 kcal—continuous), total energy intake (kcal—continuous), and total water intake (L/d—continuous); models for nitrate/nitrite from processed meat were additionally adjusted for total meat intake (per 1000 kcal—continuous) | |
| *Leah M. Ferrucci et al., 2010, USA [5] | Cohort study, 1995–2003 | 236 185 150 145 138 | ⁕ | 49.25 76 103.75 145 238.5 | 1 (Reference) 0.86 (0.71–1.06) 0.76 (0.6–0.95) 0.77 (0.6–0.99) 0.8 (0.58–1.1) | Bladder | Age, gender, smoking, intakes of fruit, vegetables, beverages, and total energy | |
| 109 147 173 191 234 | ⁕ | 0.05 0.175 0.275 0.425 0.725 | 1 (Reference) 0.97 (0.76–1.24) 1.09 (0.87–1.38) 1.07 (0.85–1.36) 1.2 (0.95–1.51) | |||||
| Mary H. Ward et al., 2007, USA [27] | Case-control study, 1986–1989. | 109 83 84 57 | 471 472 471 472 | 0–59.32 59.32–86.62 86.63–122 122–157.77 | 1 (Reference) 0.71 (0.52–0.98) 0.69 (0.5–0.95) 0.41 (0.28–0.6) | Kidney | Age, gender, sodium, and total calories | |
| Rena R. Jones et al., 2017, USA [67] | Cohort study, 1986–2010 | 67 65 66 43 15 | n = 8467 8489 8, 506 6803 1699 | 0–16.2 16.2–23.9 23.91–34.27 34.28–58.64 58.6–82.96 | 1 (Reference) 0.96 (0.68–1.4) 0.95 (0.67–1.4) 0.78 (0.51–1.2) 1.1 (0.59–2) | Kidney | Age, smoking status, pack-years of smoking, in-transformed total energy intake, body mass index, and total in-transformed total dietary nitrate or nitrite | |
| Peter J. Weyer et al., 2001, USA [52] | Cohort study from 1986–1998 | 12 15 14 14 | ⁕ | 0–11.6 11.6–18 18.1–27.2 27.2–36.3 | 1 (Reference) 1.32 (0.62–2.83) 1.32 (0.6–2.89) 1.37 (0.61–3.06) | Kidney | Age and total energy intake | |
| Mary H. Ward et al., 2008, USA [68] | Case-control study from 1988–1994 | 14 17 28 39 | 99 99 99 100 | 0–3.8 3.8–5.7 5.7–8.3 8.3–10.9 | 1 (Reference) 0.7 (0.3–1.6) 1.7 (0.7–4.1) 2.2 (0.9–5.7) | Esophagus | Year of birth, gender, body mass index, smoking, alcohol, total calories, vitamin A, folate, riboflavin, zinc, protein, and carbohydrate | |
| 29 27 18 24 | 99 99 99 100 | 0–16.9 16.9–26.2 26.2–38.8 38.8–51.4 | 1 (Reference) 0.9 (0.5–1.8) 0.6 (0.3–1.3) 0.8 (0.3–1.8) | |||||
| Andra’s P. Keszei et al., 2013, The Netherlands [69] | Cohort study, 1986–2002 | 24 21 14 | Sub-cohort (PY) 8383 9015 9050 | 68.1 100.8 146.2 | 1 (Reference) 0.82 (0.45–1.48) 0.54 (0.28–1.05) | Esophagus | Age | |
| 39 36 39 | 8383 9015 9050 | 68.1 100.8 146.2 | 1 (Reference) 0.86 (0.54–1.37) 0.92 (0.58–1.46) | |||||
| 15 18 15 | 9607 10,175 9996 | 66.4 98.5 142.7 | 1 (Reference) 1.17 (0.58–2.35) 1.02 (0.49–2.14) | |||||
| 14 13 4 | 9607 10,175 9996 | 66.4 98.5 142.7 | 1 (Reference) 0.89 (0.42–1.92) 0.29 (0.09–0.89) | |||||
| *Amanda J. Cross, et al., 2011, USA [24] | Cohort study, 1995–2006 | 22 25 15 25 41 | ⁕ | 0.605 0.1673 0.2818 0.4363 0.745 | 1 (Reference) 1.06 (0.59–1.91) 0.6 (0.3–1.18) 0.9 (0.49–1.67) 1.3 (0.72–2.35) | Esophagus | Age, sex, BMI, education, ethnicity, tobacco smoking, alcohol drinking, usual physical activity at work, vigorous physical activity, daily intake of fruit, vegetables, saturated fat, and calories | |
| 47 61 68 89 112 | ⁕ | 0.605 0.1673 0.2818 0.4363 0.745 | 1 (Reference) 0.97 (0.66–1.43) 0.91 (0.62–1.35) 1.01 (0.7–1.47) 1.1 (0.75–1.6) | |||||
| A. J. M. van Loon et al., 1998, The Netherlands [70] | Cohort study, 1986–1992 | 69 61 45 49 58 | Sub-cohort (PY) 3784 3813 3814 3813 3796 | 55.8 79.4 98.7 120.7 172.2 | 1 (Reference) 0.93 (0.64–1.33) 0.65 (0.44–0.96) 0.71 (0.48–1.04) 0.83 (0.58–1.2) | Stomach | Age and sex | |
| Raúl U. Hernández-Ramírez et al., 2009, Mexico [71] | Case-control study, 2004–2005 | ⁕ | ⁕ | 0–90.4 90.4–141.7 141.7–193 | 1 (Reference) 0.93 (0.62–1.39) 0.61 (0.39–0.96) | Stomach | Energy, age, gender, H. pylori CagA status, schooling, and consumptions of salt, chili, and alcohol. | |
| Andra´s P. Keszei et al., 2013, The Netherlands [69] | Cohort study, 1986–2002 | 49 47 43 | Sub-cohort (PY) 8383 9015 9050 | 68.1 100.8 146.2 | 1 (Reference) 0.89 (0.59–1.35) 0.81 (0.53–1.24) | Stomach | Age | |
| 111 125 93 | 8383 9015 9050 | 68.1 100.8 146.2 | 1 (Reference) 1.05 (0.79–1.39) 0.77 (0.57–1.04) | |||||
| 7 7 10 | 9607 10,175 9996 | 66.4 98.5 142.7 | 1 (Reference) 0.97 (0.34–2.81) 1.46 (0.54–3.93) | |||||
| 59 46 55 | 9607 10,175 9996 | 66.4 98.5 142.7 | 1 (Reference) 0.76 (0.51–1.13) 0.95 (0.64–1.4) | |||||
| Carlo La Vecchia, et al., 1994, Italy [72] | Case-control study, 1985–1992 | ⁕ | ⁕ | 62.95 80.7 96.33 116.88 | 1 (Reference) 0.71 (0.53–0.96) 0.66 (0.47–0.92) 0.78 (0.54–1.12) | Stomach | Age, sex, education, family history of gastric cancer, body mass index, total energy intake, plus all above variables | 5 |
| * Amanda J. Cross et al., 2011, USA [24] | Cohort study, 1995–2006 | 50 48 50 56 73 | ⁕ | 0.605 0.1673 0.2818 0.4363 0.745 | 1 (Reference) 0.9 (0.6–1.35) 0.89 (0.59–1.33) 0.91 (0.61–1.37) 1.04 (0.69–1.55) | Stomach | Age, sex, BMI, education, ethnicity, tobacco smoking, alcohol drinking, usual physical activity at work, vigorous physical activity, daily intake of fruit, vegetables, saturated fat, and calories. | |
| 39 57 36 61 62 | ⁕ | 0.605 0.1673 0.2818 0.4363 0.745 | 1 (Reference) 1.17 (0.77–1.77) 0.64 (0.4–1.02) 0.94 (0.61–1.45) 0.81 (0.52–1.25) | |||||
| Mary H. Ward, et al., 2008, USA [68] | Case-control study from 1988–1994 | 19 31 25 29 | 99 99 99 100 | 0–3.8 (nitrite plus nitrate) 3.8–5.7 5.7–8.3 8.3–10.9 | 1 (Reference) 1.6 (0.8–3.2) 1.8 (0.8–3.8) 1.6 (0.7–3.7) | Stomach | Year of birth, gender, education, smoking, alcohol, total calories, vitamin C, fiber, and carbohydrate. | |
| 24 28 26 26 | 99 99 99 100 | 0–16.9 16.9–26.2 26.2–38.8 38.8–51.4 | 1 (Reference) 1.2 (0.6–2.5) 1.4 (0.7–2.9) 1.6 (0.7–3.6) | |||||
| Curt T. Della Valle et al., 2014, China [44] | Prospective cohort study, 1996 to 2007 | 83 70 65 87 78 | ⁕ | 98.7 144.1 182.4 229 313.2 | 1 (Reference) 0.9 (0.65–1.25) 0.84 (0.59–1.2) 1.13 (0.77–1.66) 0.98 (0.59–1.63) | Colon | Age, energy intake, education, physical activity, dietary vitamin C intake, carotene, and folate | |
| Nadia Espejo-Herrera et al., 2016, Spain [53] | Case-control study, 2008–2013 | 388 394 371 | ⁕ | 0–83 83–133 133–183 | 1 (Reference) 1.04 (0.87–1.24) 0.9 (0.74–1.1) | Colon | Sex, age, education, physical activity, non-steroidal anti-inflammatory drugs use, family history of colorectal cancer, body mass index, and intake energy | |
| Rena R. Jones et al., 2019, USA [41] | Cohort study, 1986–2010 | 324 324 321 355 | n = 8676 8674 8685 8673 | 0–9.8 9.81–13.8 13.81–19.29 19.29–24.77 | 1 (Reference) 0.98 (0.84–1.15) 0.97 (0.83–1.13) 1.11 (0.94–1.3) | Colon | Age, heme iron, red meat, and total dietary nitrate or nitrite | |
| Peter J. Weyer et al., 2001, USA [52] | Cohort study, 1986–1998 | 98 78 90 97 | ⁕ | 0–11.6 11.6–18 18.1–27.2 27.2–36.3 | 1 (Reference) 0.79 (0.59–1.07) 0.93 (0.69–1.24) 1 (0.74–1.34) | Colon | Age and total energy intake | 7 |
| * Amanda J. Cross et al., 2010, USA [29] | Prospective cohort study, 1994–2003 | 341 344 386 439 485 | ⁕ | 0.0598 0.1633 0.274 0.423 0.723 | 1 (Reference) 0.93 (0.8–1.08) 0.99 (0.86–1.16) 1.08 (0.93–1.25) 1.13 (0.97–1.32) | Colon | Gender, education, BMI, smoking, and intake of total energy, fiber, and dietary calcium | |
| * L. M. Ferrucci et al., 2012, USA [73] | Multi-center, randomized controlled trial, 1993–2001. | 150 165 203 254 | ⁕ | 0.15 (nitrite plus nitrate) 0.425 0.9 2.1 | 1 (Reference) 0.98 (0.77–1.23) 1.07 (0.84–1.35) 1.16 (0.9–1.5) | Colon | Age, study center, gender, ethnicity, education, family history of colorectal cancer, BMI, NSAIDs use, physical activity, smoking status, alcohol intake, dietary calcium, supplemental calcium, dietary fibre, and total energy intake | |
| Anneclaire J. De Roos et al., 2003, USA [28] | Case-control study, 1986–1990 | (n(%)) 89 (32) 68 (24) 68 (24) 55 (20) | (n(%)) 261 (27) 241 (25) 246 (25) 234 (24) | 0–59.3 59.3–86.5 86.6–121.9 122–157 | 1 (Reference) 0.8 (0.6–1.2) 0.8 (0.5–1.1) 0.7 (0.4–1) | Colon | Age, sex, and chlorinated surface water | |
| Yun Zhu et al. 2014 [74] | Case-control study, 1997–2006 | 127 153 122 137 122 | 517 480 489 479 516 | 56.94 91.45 124.81 169.59 264.14 | 1 (Reference) 1.25 (0.93–1.66) 0.9 (0.66–1.23) 1.06 (0.78–1.48) 0.75 (0.54–1.05) | Colon | Age, sex, energy intake, BMI, cigarette smoking status, education attainment, reported colon screening procedures, NSAID use, multivitamin supplement use, folate supplement use, vegetable intake, and province of residence | |
| 109 113 128 122 114 | 517 480 489 479 516 | 56.94 91.45 124.81 169.59 264.14 | 1 (Reference) 1.07 (0.78–1.48) 1.24 (0.9–1.71) 1.31 (0.94–1.83) 1.01 (0.71–1.45) | |||||
| Curt T. Della Valle et al., 2014, China [44] | Prospective cohort study, 1996–2007 | 46 39 41 51 59 | ⁕ | 98.7 144.1 182.4 229 313.2 | 1 (Reference) 0.9 (0.58–1.4) 0.95 (0.6–1.5) 1.17 (0.72–1.9) 1.26 (0.69–2.32) | Rectum | Age, energy intake, education, physical activity, dietary vitamin C intake, carotene, and folate | |
| Nadia Espejo-Herrera et al., 2016, Spain [53] | Case-control study, 2008–2013. | 195 161 151 | ⁕ | 0–83 83–133 133–183 | 1 (Reference) 0.85 (0.66–1.08) 0.76 (0.58–1) | Rectum | Sex, age, education, physical activity, non-steroidal anti-inflammatory drugs use, family history of colorectal cancer, body mass index, and intake energy | |
| Rena R. Jones et al., 2019, USA [41] | Cohort study, 1986–2010 | 79 81 71 94 | n = 8676 8674 8685 8673 | 0–9.8 9.81–13.8 13.81–19.29 19.29–24.77 | 1 (Reference) 1.03 (0.76–1.41) 0.91 (0.66–1.26) 1.27 (0.93–1.74) | Rectum | Age and total dietary nitrate or nitrite | |
| Peter J. Weyer et al., 2001, USA [52] | Cohort study, 1986–1998. | 28 39 27 28 | ⁕ | 0–11.6 11.6–18 18.1–27.2 27.2–36.3 | 1 (Reference) 1.42 (0.87–2.31) 1.01 (0.59–1.73) 1.06 (0.61–1.83) | Rectum | Age and total energy intake | 7 |
| * Amanda J. Cross et al., 2010, USA [29] | Prospective cohort study, 1994–2003 | 110 126 144 170 174 | ⁕ | 0.0598 0.1633 0.274 0.423 0.723 | 1 (Reference) 1.08 (0.83–1.4) 1.18 (0.91–1.52) 1.31 (1.01–1.68) 1.26 (0.97–1.63) | Rectum | Gender, education, BMI, smoking, and intake of total energy, fiber, and dietary calcium. | |
| * L. M. Ferrucci et al., 2012, USA [73] | Multi-center, randomized controlled trial, 1993–2001 | 44 64 75 80 | ⁕ | 0.15 (nitrite plus nitrate) 0.425 0.9 2.1 | 1 (Reference) 1.31 (0.88–1.95) 1.38 (0.92–2.07) 1.27 (0.8–1.99) | Rectum | Age, study center, gender, ethnicity, education, family history of colorectal cancer, BMI, NSAIDs use, physical activity, smoking status, alcohol intake, dietary calcium, supplemental calcium, dietary fiber, and total energy intake | |
| Anneclaire J. De Roos et al., 2003, USA [28] | Case-Control study, 1986–1990 | (n(%)) 56 (22) 67 (27) 66 (27) 60 (24) | (n(%)) 261 (27) 241 (25) 246 (25) 234 (24) | 0–59.3 59.3–86.5 86.6–121.9 122–157 | 1 (Reference) 1.3 (0.9–1.9) 1.2 (0.8–1.8) 1.1 (0.8–1.7) | Rectum | Age, sex, and chlorinated surface water | |
| Yun Zhu, et al. 2014 [74] | Case-control study, 1997–2006 | 118 126 130 133 118 | 517 480 489 479 516 | 56.94 91.45 124.81 169.59 264.14 | 1 (Reference) 1.12 (0.83–1.53) 1.23 (0.9–1.69) 1.34 (0.94–1.85) 1.03 (0.73–1.46) | Rectum | Age, sex, energy intake, BMI, cigarette smoking status, education attainment, reported colon screening procedures, NSAID use, multivitamin supplements use, folate supplement use, vegetable intakes and province of residence. |
| First Author, Year, Country | Study Design | Case | Control | Exposure Categories Nitrite intake mg/day) | Reported OR/RR/HR 95 CI | Cancer sites | Adjustment | NOS |
|---|---|---|---|---|---|---|---|---|
| * Robert Dubrow et al., 2010, USA [29] | Prospective cohort study, 1995–2003 | 100 121 135 109 120 | ⁕ | 0.275 (nitrite plus nitrate) 0.725 1.225 1.925 3.575 | 1 (Reference) 1.15 (0.88–1.5) 1.24 (0.95–1.61) 0.97 (0.74–1.28) 1.04 (0.79–1.36) | Glioma | Sex, age, race, energy intake, education, height, and history of cancer at baseline | 8 |
| 101 129 106 118 131 | ⁕ | 1.13 1.43 1.63 1.85 2.25 | 1 (Reference) 1.25 (0.96–1.63) 1.03 (0.79–1.36) 1.16 (0.89–1.52) 1.32 (1.01–1.71) | |||||
| Mary H. Ward et al., 2005, USA [75] | Case-control study, 1983–1994 | 38 27 23 33 | 67 74 71 73 | 0–0.7 0.7–0.94 0.94–1.19 1.19–1.44 | 1 (Reference) 0.8 (0.4–1.7) 1.0 (0.4–2.3) 1.2 (0.5–3.2) | Glioma | Age, gender, respondent type, education, ever live/work on a farm, education, beta-carotene, fiber, and calories | 6 |
| Dominique S Michaud et al., 2009, USA [32] | 3 prospective cohort studies, 1976–2005 | 55 65 71 69 75 | Sub-cohort (PY) =812,763 812,974 844,064 810,417 820,895 | ⁑ 1.4 1.6 1.8 2.03 | 1 (Reference) 1.11 (0.72–1.71) 1.2 (0.84–1.71) 1.14 (0.73–1.78) 1.26 (0.89–1.79) | Glioma | Sex, age, race, energy intake, education, height, and history of cancer at baseline | 8 |
| Mary H. Ward et al., 2006, USA [56] | Case-control study, 1998- 2000 | 82 108 110 166 | 98 98 98 97 | 0–0.71 0.71–0.909 0.91–1.209 1.21–1.509 | 1 (Reference) 1.5 (1–2.3) 1.7 (1.1–2.7) 3.1 (1.7–5.5) | Non-Hodgkin’s lymphoma | Age, education, sex, study center, race, dietary vitamin C, and total energy | |
| Briseis Aschebrook-Kilfoya et al., 2012, USA [58] | Case-control study, 1996–2008 | ⁕ | ⁕ | 0–0.8 0.8–1.1 1.1–1.4 1.4–1.7 | 1 (Reference) 1.2(0.8–1.6) 0.8 (0.6–1.3) 1 (0.6–1.6) | Non-Hodgkin’s lymphoma | Calories, age, family history, and vitamin C | |
| Briseis Aschebrook-Kilfoya et al., 2013, USA [14] | Case-control study, 1999–2002 | 82 90 68 95 | 114 115 116 114 | 0.9 1.2 1.5 1.7 | 1 (Reference) 1.2 (0.8–1.8) 0.8 (0.5–1.3) 1.3 (0.8–1.9) | Non-Hodgkin’s lymphoma | Sex, age, body mass index, education, family history of cancer, vitamin C, and daily caloric intake | |
| Brian C.-H. Chiu et al., 2008, USA [60] | Case-control study, 1983–1986 | 14 15 31 | 357 358 360 | 0–1 1–1 1–2 | 1 (Reference) 1.1 (0.5–2.4) 2.8 (1.3–6.1) | Non-Hodgkin’s lymphoma | Age, sex, type of respondent, family history of cancer, and body mass index | 8 |
| 39 25 23 | 357 358 360 | 0–1 1–1 1–2 | 1 (Reference) 0.7 (0.4–1.1) 0.6 (0.3–1.2) | |||||
| Briseis Aschebrook-Kilfoya et al., 2010, USA [25] | Case-control study, 1995–2001 | 248 345 | 349 355 | Low High | 1 (Reference) 1.37 (1.04–1.79) | Non-Hodgkin’s lymphoma | Age, family history of cancer, calories, vitamin C intake, vitamin E intake, and protein intake | |
| Arbor J.L. Quist et al., 2018, USA [61] | Cohort study, 1986–2011 | 88 67 70 68 15 | n = 8501 8505 8753 6761 1722 | 0–0.86 0.86–1.11 1.12–1.43 1.44–2.05 2.05–2.66 | 1 (Reference) 0.85 (0.59–1.22) 0.94 (0.62–1.42) 1.3 (0.79–2.14) 1.28 (0.59–2.79) | Pancreas | Age, smoking category, calories, and mutually adjusted for either natural log-transported nitrate or nitrite | |
| Angela Coss et al., 2004, USA [62] | Case-control study, 1960–1987 | 15 22 40 64 | 233 307 333 374 | 0–0.75 0.75–0.98 0.99–1.3 1.3–1.61 | 1 (Reference) 1 (0.52–2) 1.5 (0.81–2.9) 1.5 (0.79–3) | Pancreas | Age, cigarette use, and caloric intake | |
| 9 22 60 50 | 264 282 359 342 | 0–0.22 0.22–0.31 0.32–0.53 0.53–0.74 | 1 (Reference) 2.1 (0.95–4.8) 3.8 (1.8–8) 2.3 (1.1–5.1) | |||||
| 18 32 32 40 | 144 146 168 181 | 0–0.56 0.56–0.71 0.72–0.93 0.93–1.13 | 1 (Reference) 1.8 (0.94–3.4) 1.4 (0.72–2.6) 1.3 (0.65–2.5) | |||||
| 13 32 26 51 | 148 164 147 180 | 0–0.13 0.13–0.18 0.19–0.26 0.26–0.33 | 1 (Reference) 2.4 (1.2–4.7) 1.9 (0.94–4) 3.2 (1.6–6.4) | |||||
| * Jiali Zheng et al., 2019, USA [63] | Case–control study, 2002–2009 | 291 226 225 215 | 235 234 235 234 | 0.025–1.475 1.375–2.1 2.075–2.925 2.9–9.65 | 1 (Reference) 0.8 (0.62–1.03) 0.77 (0.6–1) 0.75 (0.59–0.91) | Pancreas | Age and energy intake | |
| Briseis Aschebrook-Kilfoy et al., 2011, USA [64] | Prospective cohort study, 1995- 2006 | 361 361 331 348 321 | ⁕ | 0.8 1.0 1.2 1.2 1.6 | 1(Reference) 0.99 (0.86–1.16) 0.92 (0.79–1.08) 0.97 (0.83–1.14) 0.92 (0.78–1.08) | Pancreas | Age, race, total energy intake, smoking status, family history of cancer, family history of diabetes, body mass index, and intakes of saturated fat, folate, and vitamin C | |
| Rena R. Jones et al., 2016, USA [8] | Cohort study, 1986–2010 | 63 66 73 56 | n = 8450 8514 8487 8513 | 0–0.86 0.86–1.12 1.13–1.43 1.44–1.74 | 1 (Reference) 1.15 (0.78–1.7) 1.38 (0.89–2.16) 1.15 (0.65–2.03) | Bladder | Age, smoking status, pack-years of smoking, in-transformed total energy intake, and total in-transformed dietary nitrate from all sources | |
| Kathryn Hughes Barry et al., 2020, New England [76] | Case–control study, 1994–1996, 2001–2004 | 222 212 202 217 184 | 243 245 244 248 245 | 0–0.48 0.48–0.56 0.56–0.63 0.63–0.72 >0.72 | 1 (Reference) 1.0 (0.77–1.4) 1.0 (0.74–1.3) 1.1 (0.80–1.4) 0.97 (0.71–1.3) | Bladder | Adjusted for age, gender, smoking status, high-risk occupation, race, ethnicity, state, dietary vitamin C intake (per 1000 kcal—continuous), dietary vitamin B12 (per 1000 kcal—continuous), total energy intake (kcal—continuous), and total water intake (L/d—continuous); models for nitrate/nitrite from processed meat were additionally adjusted for total meat intake (per 1000 kcal—continuous) | |
| Mary H. Ward et al., 2003, USA [35] | Case-control study, 1986–1989 | ⁕ | ⁕ | 0–0.81 0.81–1.06 1.06–1.39 1.39–1.72 | 1 (Reference) 1.1 (0.9–1.4) 1.2 (0.9–1.5) 1.2 (0.9–1.6) | Bladder | Age, education, and cigarette smoking, years chlorinated surface water, and study period | |
| ⁕ | ⁕ | 0–0.58 0.58–0.75 0.75–0.98 0.98–1.21 | 1 (Reference) 1 (0.6–1.5) 0.8 (0.5–1.3) 1 (0.7–1.6) | |||||
| * Leah M. Ferrucci et al., 2010, USA [5] | Cohort study, 1995– 2003 | 176 181 164 161 172 | ⁕ | 1.15 1.425 1.625 1.85 2.275 | 1 (Reference) 1.17 (0.9–1.45) 1.1 (0.89–1.37) 1.14 (0.91–1.44) 1.28 (1.02–1.61) | Bladder | Age, gender, smoking, intakes of fruit, vegetables, beverages, and total energy | |
| 109 147 173 191 234 | ⁕ | 0.025 0.075 0.15 0.25 0.475 | 1 (Reference) 1.15 (0.9–1.46) 1.08 (0.85–1.37) 1.39 (1.11–1.74) 1.07 (0.85–1.36) | |||||
| * Chelsea E. Catsburg et al., 2014, USA [38] | Case-control study, 1987– 1996 | 400 287 302 314 344 | 314 316 313 315 315 | 0–0.234 0.235–0.311 0.312–0.4 0.401–0.532 0.532–0.664 | 1 (Reference) 0.75 (0.59–0.94) 0.81 (0.63–1.03) 0.82 (0.64–1.07) 0.89 (0.66–1.2) | Bladder | Smoking duration, smoking intensity, and smoking status | 8 |
| Mary H. Ward et al., 2007, USA [27] | Case-control study, 1986–1989 | 92 74 78 89 | 471 472 471 472 | 0–0.7 0.7–0.93 0.94–1.25 1.26–1.57 | 1 (Reference) 0.82 (0.58–1.17) 0.84 (0.57–1.22) 0.82 (0.5–1.33) | Kidney | Age, gender, sodium, total fat, and total calories | |
| 64 90 88 91 | 471 472 471 472 | 0–0.18 0.18–0.28 0.29–0.47 0.48–0.66 | 1 (Reference) 1.37 (0.95–1.95) 1.24 (0.85–1.83) 1 (0.63–1.59) | |||||
| Rena R. Jones et al., 2017, USA [67] | Cohort study, 1986–2010 | 57 68 69 49 13 | n = 8450 8514 8487 1704 6809 | 0–0.86 0.86–1.12 1.13–1.43 1.44–2.06 2.06–2.68 | 1 (Reference) 1.3 (0.87–1.9) 1.4 (0.89–2.3) 1.4 (0.77–2.5) 1.6 (0.7–3.8) | Kidney | Age, smoking status, pack-years of smoking, in-transformed total energy intake, body mass index, and total in-transformed total dietary nitrate or nitrite | |
| Mary H. Ward et al., 2008, USA [68] | Case-control study, 1988–1994 | 23 28 17 30 | 94 102 101 100 | 0–0.36 0.36–0.52 0.52–0.67 0.67–0.82 | 1 (Reference) 1.1 (0.5–2.3) 0.6 (0.2–1.3) 1 (0.4–2.4) | Esophagus | Year of birth, gender, body mass index, smoking, alcohol, total calories, vitamin A, folate, riboflavin, zinc, protein, and carbohydrate | |
| 19 31 25 29 | 99 99 99 100 | 0–3.8 (nitrite plus nitrate) 3.8–5.7 5.7–8.3 8.3–10.9 | 1 (Reference) 0.7 (0.3–1.6) 1.7 (0.7–4.1) 2.2 (0.9–5.7) | |||||
| Andra´s P Keszei et al., 2013, The Netherlands [69] | Cohort study, 1986–2002 | 17 19 23 | Sub-cohort (PY) 8665 8895 8890 | 0.03 0.12 0.28 | 1 (Reference) 1.18 (0.61–2.3) 1.49 (0.78–2.87) | Esophagus | Age | |
| 42 38 34 | 8665 8895 8890 | 0.03 0.12 0.28 | 1(Reference) 0.9 (0.57–1.43) 0.81 (0.5–1.31) | |||||
| 16 18 14 | 10,009 10,016 9752 | 0.02 0.08 0.2 | 1 (Reference) 1.17 (0.59–2.32) 0.96 (0.46–2) | |||||
| 12 12 7 | 10,009 10,016 9752 | 0.02 0.08 0.2 | 1 (Reference) 1.05 (0.47–2.36) 0.64 (0.25–1.64) | |||||
| * Amanda J. Cross et al., 2011, USA [24] | Cohort study, 1995–2006 | 20 30 19 28 31 | ⁕ | 0.0303 0.0865 0.1535 0.2573 0.498 | 1 (Reference) 1.36 (0.76–2.43) 0.82 (0.43–1.57) 1.15 (0.63–2.11) 1.21 (0.67–2.2) | Esophagus | Age, sex, BMI, education, ethnicity, tobacco smoking, alcohol drinking, usual physical activity at work, vigorous physical activity, daily intake of fruit, vegetables, saturated fat, and calories | |
| 50 60 66 81 120 | ⁕ | 0.0303 0.0865 0.1535 0.2573 0.498 | 1 (Reference) 0.89 (0.61–1.3) 0.82 (0.56–1.2) 0.88 (0.61–1.27) 1.19 (0.84–1.68) | |||||
| Lawrence S. Engel et al., 2003, USA [77] | Case–control study, 1993–1995 | ⁕ | ⁕ | 1.8–5.55 5.65–7.2 7.3–9.5 9.6–35.2 | 1 (Reference) 1.5 (1–2.4) 1.8 (1.1–3) 2.5(1.4–4.3) | Stomach | Geographic center, age, sex, race, income, respondent type, energy intake, and the other factors included in the table | |
| A. J. M. van Loon et al., 1998, The Netherlands [70] | Cohort study, 1986–1992 | 47 51 58 46 80 | Sub-cohort (PY) 3873 3706 3829 3844 3760 | 0.01 0.04 0.09 0.16 0.35 | 1 (Reference) 1.15 (0.76–1.74) 1.21 (0.81–1.83) 0.87 (0.57–1.33) 1.49 (1.01–2.2) | Stomach | Age and sex | |
| Raúl U. Hernández-Ramírez et al., 2009, Mexico [71] | Case–control study, 2004–2005 | ⁕ | ⁕ | 0–1 1–1.2 1.2–1.4 | 1 (Reference) 1.07 (0.69–1.65) 1.52 (0.99–2.34) | Stomach | Energy, age, gender, H. pylori CagA status, schooling, and consumptions of salt, chili, and alcohol | |
| Andra´s P Keszei et al., 2013, The Netherlands [69] | Cohort study, 1986–2002 | 47 39 53 | Sub-cohort (PY) 8665 8895 8890 | 0.03 0.12 0.28 | 1 (Reference) 0.83 (0.53–1.29) 1.14 (0.75–1.72) | Stomach | Age | |
| 98 109 122 | 8665 8895 8890 | 0.03 0.12 0.28 | 1 (Reference) 1.17 (0.87–1.58) 1.36 (1.01–1.82) | |||||
| 9 9 6 | 10,009 10,016 9752 | 0.02 0.08 0.2 | 1 (Reference) 1.05 (0.41–2.67) 0.73 (0.26–2.07) | |||||
| 56 50 54 | 10,009 10,016 9752 | 0.02 0.08 0.2 | 1 (Reference) 0.94 (0.63–1.39) 1.06 (0.71–1.57) | |||||
| Carlo La Vecchia et al., 1994, Italy [72] | Case-control study, 1985–1992 | ⁕ | ⁕ | 1.91 2.41 2.94 3.64 | 1 (Reference) 0.96 (0.69–1.32) 0.97 (0.7–1.35) 1.02 (0.73–1.43) | Stomach | Age, sex, education, family history of gastric cancer, body mass index, total energy intake, plus all the above variables | 5 |
| * Amanda J. Cross et al., 2011, USA [24] | Cohort study, 1995–2006 | 44 40 55 61 55 | ⁕ | 0.0303 0.0865 0.1535 0.2573 0.498 | 1 (Reference) 0.72 (0.47–1.11) 0.88 (0.58–1.32) 0.87 (0.58–1.31) 0.71 (0.47–1.08) | Stomach | Age, sex, BMI, education, ethnicity, tobacco smoking, alcohol drinking, usual physical activity at work, vigorous physical activity, daily intake of fruits, vegetables, saturated fat, and calories | |
| 54 44 48 67 64 | ⁕ | 0.0303 0.0865 0.1535 0.2573 0.498 | 1 (Reference) 0.77 (0.51–1.15) 0.79 (0.53–1.18) 1.04 (0.71–1.52) 0.93 (0.63–1.37) | |||||
| Mary H. Ward, et al., 2008, USA [68] | Case-control study, 1988–1994 | 23 22 29 30 | 94 102 101 100 | 0–0.36 0.36–0.52 0.52–0.67 0.67–0.83 | 1 (Reference) 1.1 (0.4–2.7) 0.8 (0.3–2.2) 1.1 (0.3–3.4) | Stomach | Year of birth, gender, education, smoking, alcohol, total calories, vitamin C, fiber, and carbohydrate | |
| 19 31 25 29 | 99 99 99 100 | 0–3.8 3.8–5.7 5.7–8.3 8.3–10.9 | 1 (Reference) 1.6 (0.8–3.2) 1.8 (0.8–3.8) 1.6 (0.7–3.7) | |||||
| Curt T. DellaValle et al., 2014, China [44] | Prospective cohort study, 1996–2007 | 72 81 75 80 75 | ⁕ | 0.56 0.74 0.87 1.01 1.23 | 1 (Reference) 1.27 (0.92–1.76) 1.23 (0.88–1.73) 1.34 (0.94–1.9) 1.26 (0.85–1.86) | Colon | Age, energy intake, education, physical activity, dietary vitamin C intake, carotene, and folate | |
| Rena R. Jones et al., 2019, USA [41] | Cohort study, 1986– 2010 | 345 342 320 317 | n = 8588 8655 8974 8491 | 0–0.57 0.58–0.65 0.66–0.74 0.74–0.82 | 1 (Reference) 0.93 (0.8–1.08) 0.83 (0.71–0.97) 0.87 (0.74–1.02) | Colon | Age, heme iron, red meat, and total dietary nitrate or nitrite | |
| * Amanda J. Cross et al., 2010, USA [29] | Prospective cohort study, 1994–2003 | 344 359 397 441 454 | ⁕ | 0.0298 0.0843 0.1493 0.2498 0.4853 | 1 (Reference) 0.96 (0.83–1.12) 1.01 (0.88–1.18) 1.09 (0.94–1.26) 1.09 (0.94–1.26) | Colon | Gender, education, BMI, smoking, and intake of total energy, fiber, and dietary calcium | |
| * L. M. Ferrucci et al., 2012, USA [73] | Multi-center, randomized controlled trial 1993–2001 | 150 165 203 254 | ⁕ | 0.15 (nitrite plus nitrate) 0.425 0.9 2.1 | 1 (Reference) 0.98 (0.77–1.23) 1.07 (0.84–1.35) 1.16 (0.9–1.5) | Colon | Age, study center, gender, ethnicity, education, family history of colorectal cancer, BMI, NSAIDs use, physical activity, smoking status, alcohol intake, dietary calcium, supplemental calcium, dietary fiber, and total energy intake | |
| Anneclaire J. De Roos et al., 2003, USA [28] | Case-Control study, 1986–1990 | (n(%)) 90 (32) 73 (26) 48 (17) 69 (25) | (n(%)) 311 (32) 251 (26) 220 (22) 200 (20) | 0–0.704 0.705–0.93 0.94–1.25 1.26–1.57 | 1 (Reference) 1.1 (0.8–1.6) 0.9 (0.6–1.3) 1.5 (1–2.1) | Colon | Age, sex, and chlorinated surface water | |
| Yun Zhu et al. 2014 [74] | Case-control study, 1997–2006 | 131 145 126 120 139 | 536 496 520 474 455 | 0.65 0.89 1.12 1.4 1.92 | 1 (Reference) 1.15 (0.86–1.54) 0.91 (0.66–1.26) 0.81 (0.56–1.18) 0.95 (0.63–1.43) | Colon | Age, sex, energy intake, BMI, cigarette smoking status, education attainment, reported colon screening procedures, NSAID use, multivitamin supplements use, folate supplement use, vegetable intakes, and province of residence | |
| 107 112 101 132 134 | 536 496 520 474 455 | 0.65 0.89 1.12 1.4 1.92 | 1 (Reference) 0.97 (0.7–1.34) 0.93 (0.65–1.32) 1.21 (0.82–1.78) 1.32 (0.85–2.04) | |||||
| Curt T. Della Valle et al., 2014, China [44] | Prospective cohort study, 1996–2007 | 57 45 48 42 44 | ⁕ | 0.56 0.74 0.87 1.01 1.23 | 1 (Reference) 0.87 (0.58–1.29) 0.94 (0.63–1.42) 0.81 (0.52–1.25) 0.8 (0.49–1.29) | Rectum | Age, energy intake, education, physical activity, dietary vitamin C intake, carotene, and folate | |
| Rena R. Jones et al., 2019, USA [41] | Cohort study, 1986– 2010 | 93 74 91 67 | n = 8588 8655 8974 8491 | 0–0.57 0.58–0.65 0.66–0.74 0.74–0.82 | 1 (Reference) 0.75 (0.55–1.02) 0.88 (0.65–1.18) 0.68 (0.49–0.94) | Rectum | Age and total dietary nitrate or nitrite | |
| * Amanda J. Cross et al., 2010, USA [29] | Prospective cohort study, 1994–2003 | 113 129 157 162 163 | ⁕ | 0.0298 0.0843 0.1493 0.2498 0.4853 | 1 (Reference) 1.07 (0.83–1.38) 1.23 (0.96–1.58) 1.21 (0.94–1.55) 1.16 (0.9–1.5) | Rectum | Gender, education, BMI, smoking, and intake of total energy, fiber, and dietary calcium | |
| * L. M. Ferrucci et al., 2012, USA [73] | Multi-center, randomized controlled trial 1993–2001 | 44 64 75 80 | ⁕ | 0.15 (nitrite plus nitrate) 0.425 0.9 2.1 | 1 (Reference) 1.31 (0.88–1.95) 1.38 (0.92–2.07) 1.27 (0.8–1.99) | Rectum | Age, study center, gender, ethnicity, education, family history of colorectal cancer, BMI, NSAIDs use, physical activity, smoking status, alcohol intake, dietary calcium, supplemental calcium, dietary fiber, and total energy intake | |
| Anneclaire J. De Roos et al., 2003, USA [28] | Case-control study, 1986–1990 | (n(%)) 74 (30) 62 (25) 43 (17) 70 (28) | (n(%)) 311 (32) 251 (26) 220 (22) 200 (20) | 0–0.705 0.705–0.93 0.94–1.25 1.26–1.57 | 1 (Reference) 1.1 (0.7–1.6) 0.9 (0.6–1.4) 1.7 (1.1–2.5) | Rectum | Age, sex, and chlorinated surface water | |
| Yun Zhu et al. 2014 [74] | Case-control study, 1997–2006 | 95 120 124 145 141 | 536 496 520 474 455 | 0.65 0.89 1.12 1.4 1.92 | 1 (Reference) 1.26 (0.91–1.73) 1.2 (0.84–1.71) 1.51 (1.02–2.22) 1.45 (0.94–2.24) | Rectum | Age, sex, energy intake, BMI, cigarette smoking status, education attainment, reported colon screening procedures, NSAID use, multivitamin supplements use, folate supplement use, vegetable intakes, and province of residence |
Publisher’s Note: MDPI stays neutral with regard to jurisdictional claims in published maps and institutional affiliations. |
© 2022 by the authors. Licensee MDPI, Basel, Switzerland. This article is an open access article distributed under the terms and conditions of the Creative Commons Attribution (CC BY) license (https://creativecommons.org/licenses/by/4.0/).
Share and Cite
Said Abasse, K.; Essien, E.E.; Abbas, M.; Yu, X.; Xie, W.; Sun, J.; Akter, L.; Cote, A. Association between Dietary Nitrate, Nitrite Intake, and Site-Specific Cancer Risk: A Systematic Review and Meta-Analysis. Nutrients 2022, 14, 666. https://doi.org/10.3390/nu14030666
Said Abasse K, Essien EE, Abbas M, Yu X, Xie W, Sun J, Akter L, Cote A. Association between Dietary Nitrate, Nitrite Intake, and Site-Specific Cancer Risk: A Systematic Review and Meta-Analysis. Nutrients. 2022; 14(3):666. https://doi.org/10.3390/nu14030666
Chicago/Turabian StyleSaid Abasse, Kassim, Eno E. Essien, Muhammad Abbas, Xiaojin Yu, Weihua Xie, Jinfang Sun, Laboni Akter, and Andre Cote. 2022. "Association between Dietary Nitrate, Nitrite Intake, and Site-Specific Cancer Risk: A Systematic Review and Meta-Analysis" Nutrients 14, no. 3: 666. https://doi.org/10.3390/nu14030666
APA StyleSaid Abasse, K., Essien, E. E., Abbas, M., Yu, X., Xie, W., Sun, J., Akter, L., & Cote, A. (2022). Association between Dietary Nitrate, Nitrite Intake, and Site-Specific Cancer Risk: A Systematic Review and Meta-Analysis. Nutrients, 14(3), 666. https://doi.org/10.3390/nu14030666