
Beverage Intake and Associated Nutrient Contribution for Aboriginal and Torres Strait Islander Australians: Secondary Analysis of a National Dietary Survey 2012–2013

 , and
, and 
Abstract
:1. Introduction
2. Materials and Methods
2.1. The National Aboriginal and Torres Strait Islander Nutrition and Physical Activity Survey (NATSINPAS)
2.2. Secondary Analysis Methodology
2.3. Statistical Analysis
3. Results
3.1. Population Beverage Consumption
3.2. Beverage Consumption by Type
3.3. Contribution of Beverages to Energy and Nutrients
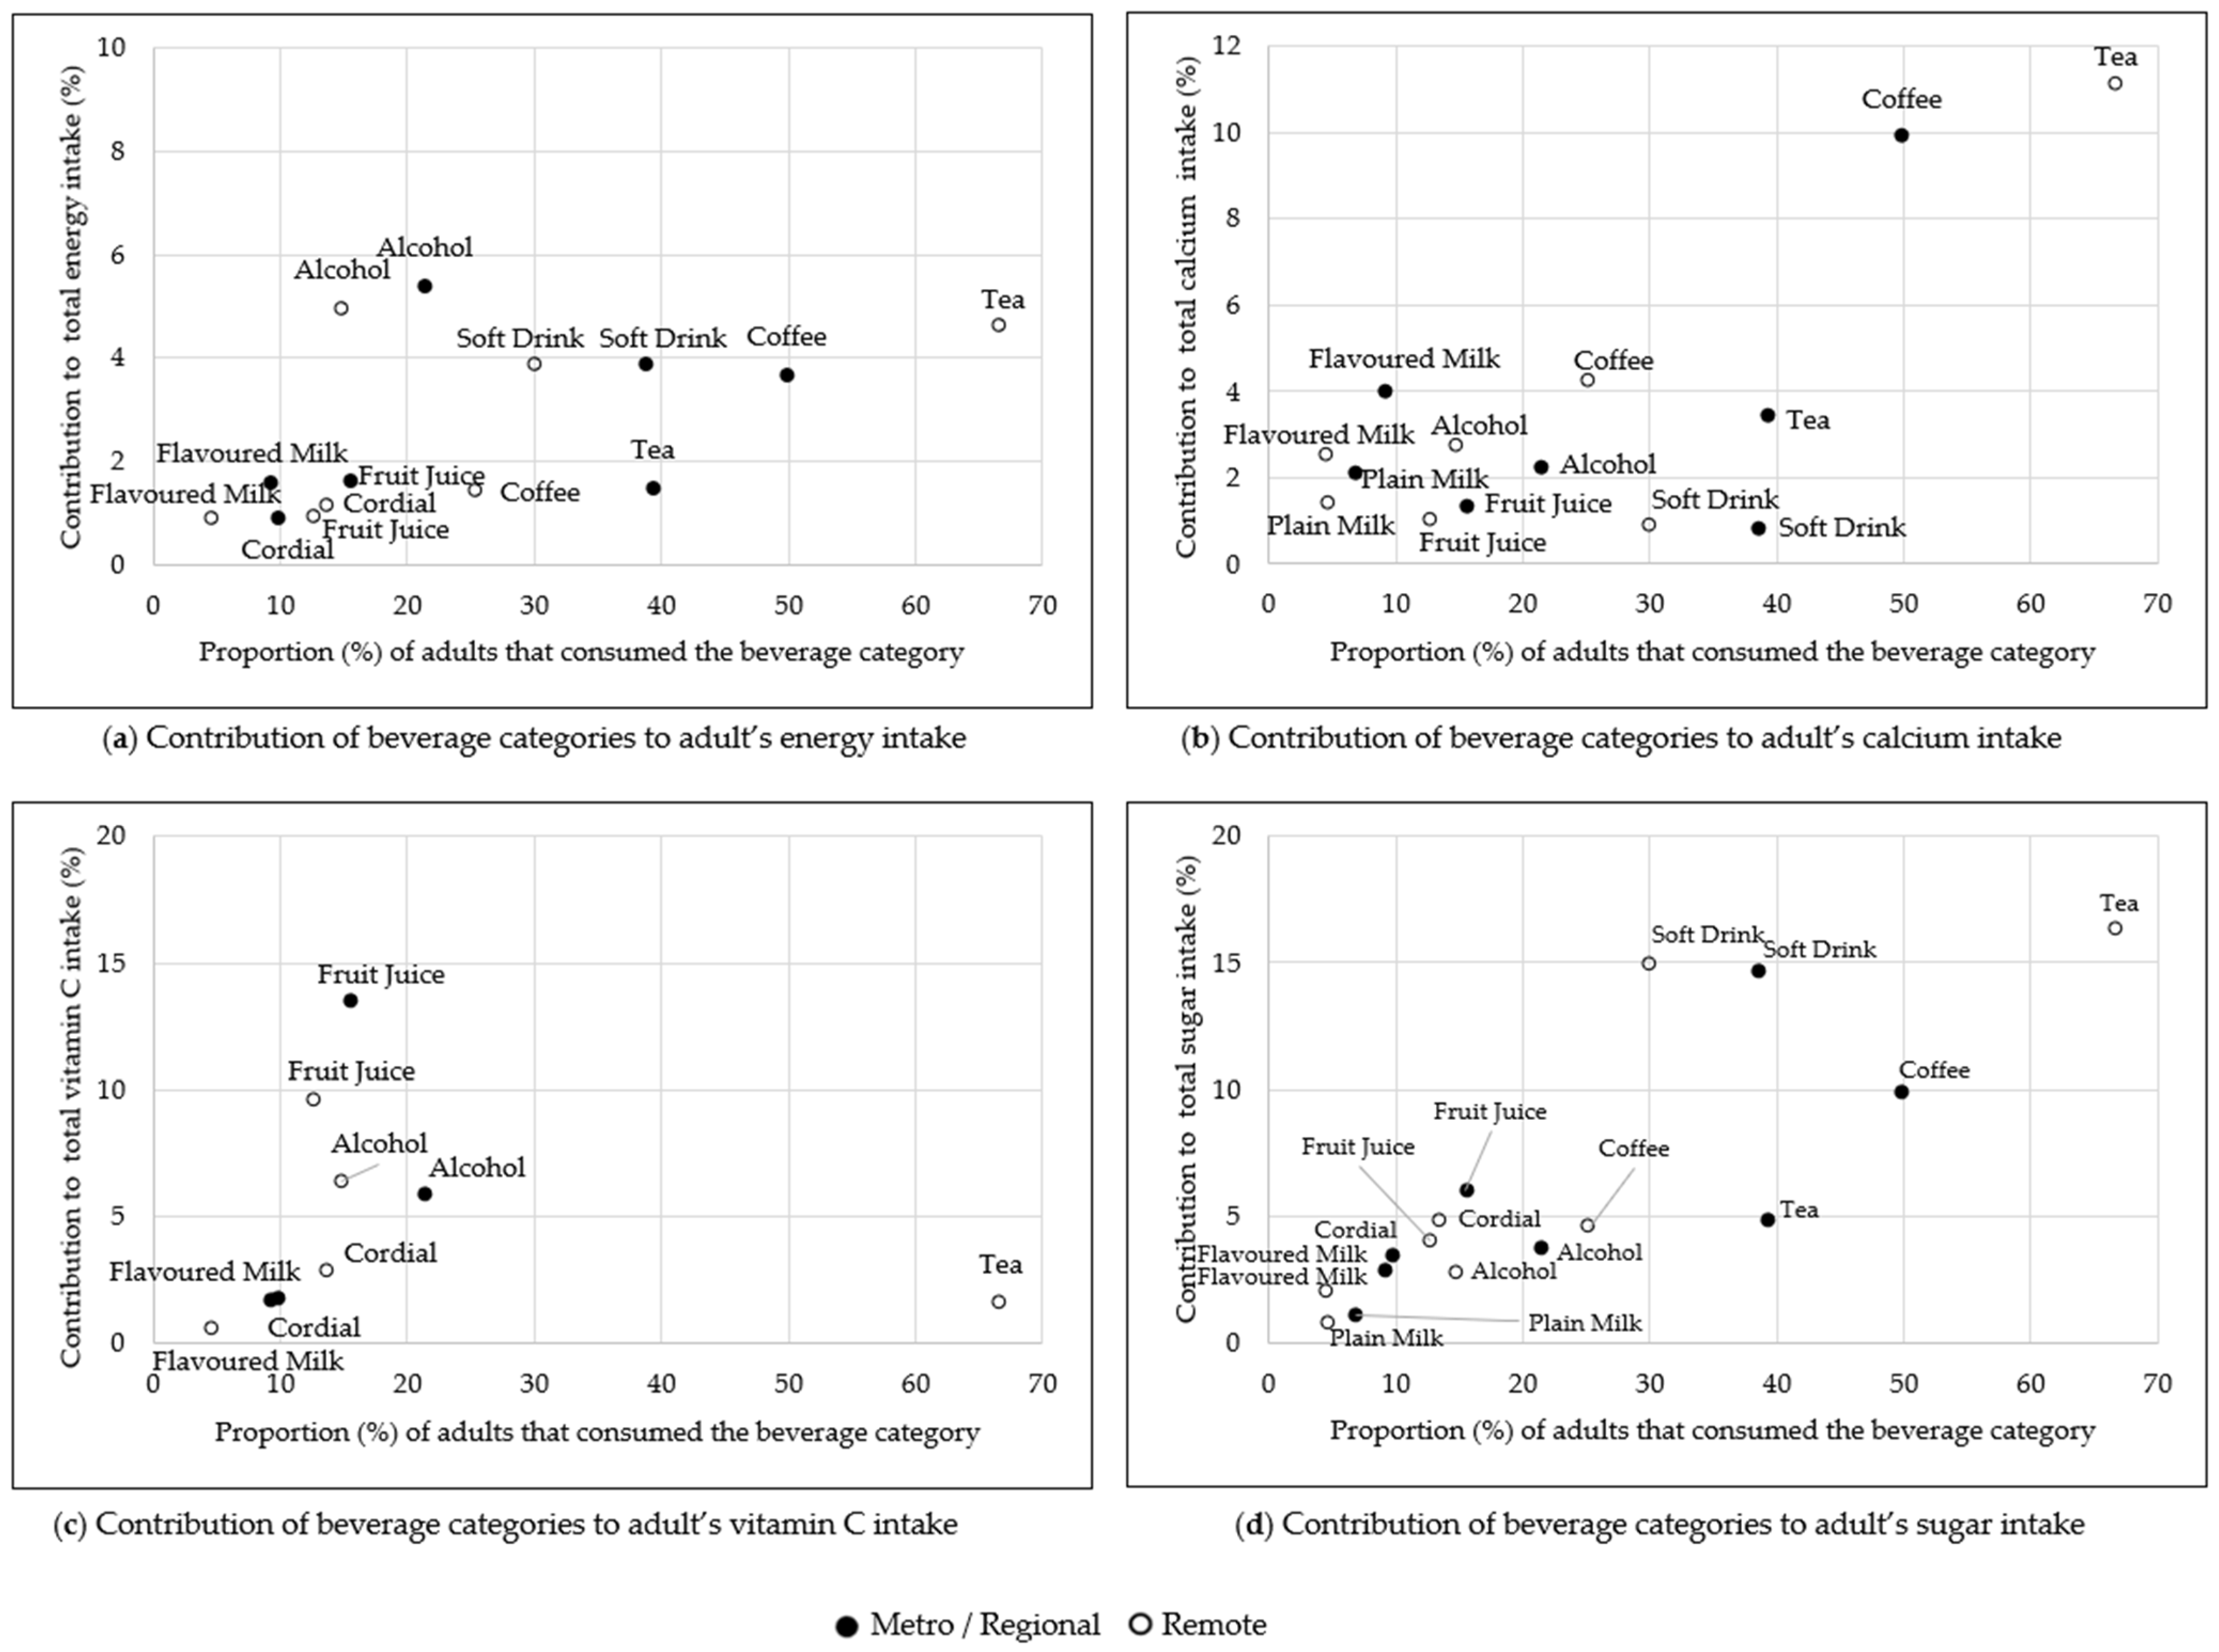
3.4. Contribution of Beverage Categories to Energy and Nutrients
4. Discussion
5. Conclusions
Supplementary Materials
Author Contributions
Funding
Institutional Review Board Statement
Informed Consent Statement
Data Availability Statement
Acknowledgments
Conflicts of Interest
References
- Riley, M.D.; Hendrie, G.A.; Baird, D.L. Drink Choice is Important: Beverages Make a Substantial Contribution to Energy, Sugar, Calcium and Vitamin C Intake among Australians. Nutrients 2019, 11, 1389. [Google Scholar] [CrossRef] [PubMed] [Green Version]
- Australian Bureau of Statistics. Estimates of Aboriginal and Torres Strait Islander Australians, ABS website. 2011. Available online: https://www.abs.gov.au/AUSSTATS/abs@.nsf/Lookup/3238.0.55.001Main+Features1June%202011?OpenDocument (accessed on 1 December 2021).
- Australian Bureau of Statistics. Australian Aboriginal and Torres Strait Islander Health Survey: Updated Results 2012–13, ABS website. 2014. Available online: https://www.abs.gov.au/ausstats/abs@.nsf/mf/4727.0.55.006 (accessed on 1 December 2021).
- Australian Bureau of Statistics. Australian Aboriginal and Torres Strait Islander Health Survey: Nutrition Results—Foods and Nutrients 2012–13, ABS website. 2015. Available online: https://www.abs.gov.au/ausstats/abs@.nsf/Lookup/4727.0.55.005main+features12012-13 (accessed on 1 December 2021).
- Hyde, Z.; Smith, K.; Flicker, L.; Atkinson, D.; Almeida, O.P.; Lautenschlager, N.T.; Dwyer, A.; LoGiudice, D. Mortality in a cohort of remote-living Aboriginal Australians and associated factors. PLoS ONE 2018, 13, e0195030. [Google Scholar] [CrossRef] [PubMed] [Green Version]
- Wright, K.M.; Dono, J.; Brownbill, A.L.; Pearson Nee Gibson, O.; Bowden, J.; Wycherley, T.P.; Keech, W.; O’Dea, K.; Roder, D.; Avery, J.C.; et al. Sugar-sweetened beverage (SSB) consumption, correlates and interventions among Australian Aboriginal and Torres Strait Islander communities: A scoping review. BMJ Open 2019, 9, e023630. [Google Scholar] [CrossRef] [PubMed]
- Mullee, A.; Romaguera, D.; Pearson-Stuttard, J.; Viallon, V.; Stepien, M.; Freisling, H.; Fagherazzi, G.; Mancini, F.R.; Boutron-Ruault, M.-C.; Kühn, T.; et al. Association Between Soft Drink Consumption and Mortality in 10 European Countries. JAMA Intern. Med. 2019, 9, e023630. [Google Scholar] [CrossRef] [PubMed] [Green Version]
- Smithers, L.G.; Lynch, J.; Hedges, J.; Jamieson, L.M. Diet and anthropometry at 2 years of age following an oral health promotion programme for Australian Aboriginal children and their carers: A randomised controlled trial. Br. J. Nutr. 2017, 118, 1061–1069. [Google Scholar] [CrossRef] [PubMed] [Green Version]
- Thurber, K.; Bagheri, N.; Banwell, C. Social determinants of sugar-sweetened beverage consumption in the Longitudinal Study of Indigenous Children. Fam. Matters 2014, 95, 51–61. [Google Scholar]
- Miller, C.; Wakefield, M.; Braunack-Mayer, A.; Roder, D.; O’Dea, K.; Ettridge, K.; Dono, J. Who drinks sugar sweetened beverages and juice? An Australian population study of behaviour, awareness and attitudes. BMC Obes. 2019, 6, 1. [Google Scholar] [CrossRef] [PubMed] [Green Version]
- Australian Bureau of Statistics (ABS). The Australian Statistical Geography Standard (ASGS) Remoteness Structure; Commonwealth of Australia: Canberra, Australia, 2016.
- Australian Institute of Health and Welfare (AIHW). Profile of Indigenous Australians; AIHW: Canberra, Australia, 2019.
- Ferguson, M.; O’Dea, K.; Chatfield, M.; Moodie, M.; Altman, J.; Brimblecombe, J. The comparative cost of food and beverages at remote Indigenous communities, Northern Territory, Australia. Aust. N. Z. J. Public Health 2016, 40, S21–S26. [Google Scholar] [CrossRef] [PubMed] [Green Version]
- Australian Bureau of Statistics. Table 9 Proportion of Energy from Discretionary Foods, Australian Health Survey: Nutrition First Results—Foods and Nutrients, ABS website. 2014. Available online: https://www.abs.gov.au/statistics/health/health-conditions-and-risks/australian-health-survey-nutrition-first-results-foods-and-nutrients/latest-release# (accessed on 1 December 2021).
- Ferguson, M.; O’Dea, K.; Altman, J.; Moodie, M.; Brimblecombe, J. Health-Promoting Food Pricing Policies and Decision-Making in Very Remote Aboriginal and Torres Strait Islander Community Stores in Australia. Int. J. Environ. Res. Public Health 2018, 15, 2908. [Google Scholar] [CrossRef] [PubMed] [Green Version]
- Australian Bureau of Statistics. Australian Aboriginal and Torres Strait Islander Health Survey: Users’ Guide, 2012–2013, ABS website. 2013. Available online: https://www.abs.gov.au/AUSSTATS/abs@.nsf/DetailsPage/4727.0.55.0022012-13?OpenDocument (accessed on 1 December 2021).
- Bliss, R.M. Researchers produce innovation in dietary recall. Agric. Res. 2004, 52, 10–13. [Google Scholar]
- Australian Bureau of Statistics (ABS). Australian Health Survey Food Model Booklet; ABS: Canberra, Australia, 2012.
- Australian Bureau of Statistics (ABS). Australian Health Survey Bush Tucker Card; ABS: Canberra, Australia, 2012.
- National Health and Medical Research Council (NHMRC). Australian Dietary Guidelines; National Health and Medical Research Council: Canberra, Australia, 2013.
- Suter, R.; Miller, C.; Gill, T.; Coveney, J. The bitter and the sweet: A cultural comparison of non-alcoholic beverage consumption in Japan and Australia. Food Cult. Soc. 2020, 23, 334–346. [Google Scholar] [CrossRef]
- Kouris-Blazos, A.; Wahlqvist, M. Indigenous Australian food culture on cattle stations prior to the 1960s and food intake of older Aborigines in a community studied in 1988. Asia Pac. J. Clin. Nutr. 2000, 9, 224–231. [Google Scholar] [CrossRef] [PubMed]
- Australian Bureau of Statistics. National Aboriginal and Torres Strait Islander Health Survey, ABS website. 2019. Available online: https://www.abs.gov.au/statistics/people/aboriginal-and-torres-strait-islander-peoples/national-aboriginal-and-torres-strait-islander-health-survey/latest-release (accessed on 1 December 2021).
- National Health and Medical Research Council. Calcium. Nutrient Reference Values for Australia and New Zealand. 2014. Available online: https://www.nhmrc.gov.au/sites/default/files/images/nutrient-refererence-dietary-intakes.pdf (accessed on 1 December 2021).
- National Health and Medical Research Council (NHMRC); Australian Research Council; Universities Australia. Australian Guidelines to Reduce Health Risks from Drinking Alcohol; Commonwealth of Australia: Canberra, Australia, 2020.
- Australian Institute of Health and Welfare (AIHW). National Drug Strategy Household Survey 2016: Detailed Findings; AIHW: Canberra, Australia, 2017.
- Browne, J.; MacDonald, C.; Egan, M.; Delbridge, R.; McAleese, A.; Morley, B.; Atkinson, P. You wouldn’t eat 16 teaspoons of sugar-so why drink it? Aboriginal and Torres Strait Islander responses to the LiveLighter sugary drink campaign. Health Promot. J. Aust. Off. J. Aust. Assoc. Health Promot. Prof. 2019, 30, 212–218. [Google Scholar] [CrossRef] [PubMed]
- Apunipima Cape York Health Council. Sugary Drinks Proper No Good—Drink More Water Youfla Campaign Launch. Available online: http://www.apunipima.org.au/news-events/item/961-sugary-drinks-proper-no-good-drink-more-water-youfla-campaign-launch (accessed on 15 July 2020).
- Gwynn, J.; Sim, K.; Searle, T.; Senior, A.; Lee, A.; Brimblecombe, J. Effect of nutrition interventions on diet-related and health outcomes of Aboriginal and Torres Strait Islander Australians: A systematic review. BMJ Open 2019, 9, e025291. [Google Scholar] [CrossRef] [PubMed] [Green Version]
- Australian Bureau of Statistics. Australian Aboriginal and Torres Strait Islander Health Survey: Physical activity, 2012–13, ABS website. 2014. Available online: https://www.abs.gov.au/ausstats/abs@.nsf/PrimaryMainFeatures/4727.0.55.004?OpenDocument (accessed on 1 December 2021).


| Beverage Category | Description |
|---|---|
| Alcoholic beverages | All beverages including any alcohol content. Mixers are included in the category, but any alcoholic beverage used as an ingredient in food is not included. |
| Tea | All home brewed tea plus all additions (milk, sugar, water) are included. |
| Coffee | Hot coffee plus all additions (milk, sugar, water) are included. Cold coffee flavoured milk beverages are included in flavoured milks. |
| Soft drink | All flavoured carbonated beverages whether sugar sweetened or sweetened with other sweetening agents. |
| Cordial | All flavoured drinks made up with water from a concentrate. |
| Energy drinks | Energy drinks and electrolyte (‘sport’) drinks. |
| Fruit juices and drinks | All fruit and vegetable juices and drinks (non-carbonated), regardless of their dilution. |
| Plain milk | Plain white milk without flavouring or additives, regardless of fat content. Milk used as an ingredient for food is not included; milk as an ingredient of beverages was included in the respective categories. |
| Flavoured milk | All flavoured milk (hot or cold) whether as purchased or produced through adding powdered flavouring to milk. |
| Milk alternatives | Plain or flavoured dairy milk alternatives such as soy milk and nut milks, not used in food or as an addition to another beverage category. |
| Other beverages | Powdered flavourings with water, probiotic drinks, breakfast cereal beverages, protein and supplement powders. |
| Water | All water consumed as a drink, but not included in any other beverage category. Includes carbonated and still water. |
| Survey Sample | Metropolitan/Regional Living | Remote Living | ||||
|---|---|---|---|---|---|---|
| n | % | N | % | n | % | |
| Total | 4109 | 100 | 1792 | 43.6 | 2317 | 56.4 |
| Sex (n) | ||||||
| Male | 1814 | 44.1 | 797 | 44.5 | 1017 | 43.9 |
| Female | 2295 | 55.9 | 995 | 55.5 | 1300 | 56.1 |
| Mean age (years) | 30 | 30.1 | 30.1 | |||
| Age category | ||||||
| 2–3 | 240 | 5.8 | 102 | 5.7 | 138 | 6.0 |
| 4–8 | 515 | 12.5 | 214 | 11.9 | 301 | 13.0 |
| 9–13 | 409 | 10.0 | 176 | 9.8 | 233 | 10.1 |
| 14–18 | 332 | 8.1 | 153 | 8.5 | 179 | 7.7 |
| All children (2–18) | 1496 | 36.4 | 645 | 36.0 | 851 | 36.7 |
| 19–30 | 722 | 17.6 | 332 | 18.5 | 390 | 16.8 |
| 31–50 | 1098 | 26.7 | 482 | 26.9 | 616 | 26.6 |
| 51–70 | 722 | 17.6 | 300 | 16.7 | 422 | 18.2 |
| 71+ | 71 | 1.7 | 33 | 1.8 | 38 | 1.6 |
| All adults (19+) | 2613 | 63.6 | 1147 | 64.0 | 1466 | 63.3 |
Publisher’s Note: MDPI stays neutral with regard to jurisdictional claims in published maps and institutional affiliations. |
© 2022 by the authors. Licensee MDPI, Basel, Switzerland. This article is an open access article distributed under the terms and conditions of the Creative Commons Attribution (CC BY) license (https://creativecommons.org/licenses/by/4.0/).
Share and Cite
Rebuli, M.A.; Hendrie, G.A.; Baird, D.L.; Mahoney, R.; Riley, M.D. Beverage Intake and Associated Nutrient Contribution for Aboriginal and Torres Strait Islander Australians: Secondary Analysis of a National Dietary Survey 2012–2013. Nutrients 2022, 14, 507. https://doi.org/10.3390/nu14030507
Rebuli MA, Hendrie GA, Baird DL, Mahoney R, Riley MD. Beverage Intake and Associated Nutrient Contribution for Aboriginal and Torres Strait Islander Australians: Secondary Analysis of a National Dietary Survey 2012–2013. Nutrients. 2022; 14(3):507. https://doi.org/10.3390/nu14030507
Chicago/Turabian StyleRebuli, Megan A., Gilly A. Hendrie, Danielle L. Baird, Ray Mahoney, and Malcolm D. Riley. 2022. "Beverage Intake and Associated Nutrient Contribution for Aboriginal and Torres Strait Islander Australians: Secondary Analysis of a National Dietary Survey 2012–2013" Nutrients 14, no. 3: 507. https://doi.org/10.3390/nu14030507
APA StyleRebuli, M. A., Hendrie, G. A., Baird, D. L., Mahoney, R., & Riley, M. D. (2022). Beverage Intake and Associated Nutrient Contribution for Aboriginal and Torres Strait Islander Australians: Secondary Analysis of a National Dietary Survey 2012–2013. Nutrients, 14(3), 507. https://doi.org/10.3390/nu14030507