
The TriMet_DB: A Manually Curated Database of the Metabolic Proteins of Triticum aestivum

 , and
, and 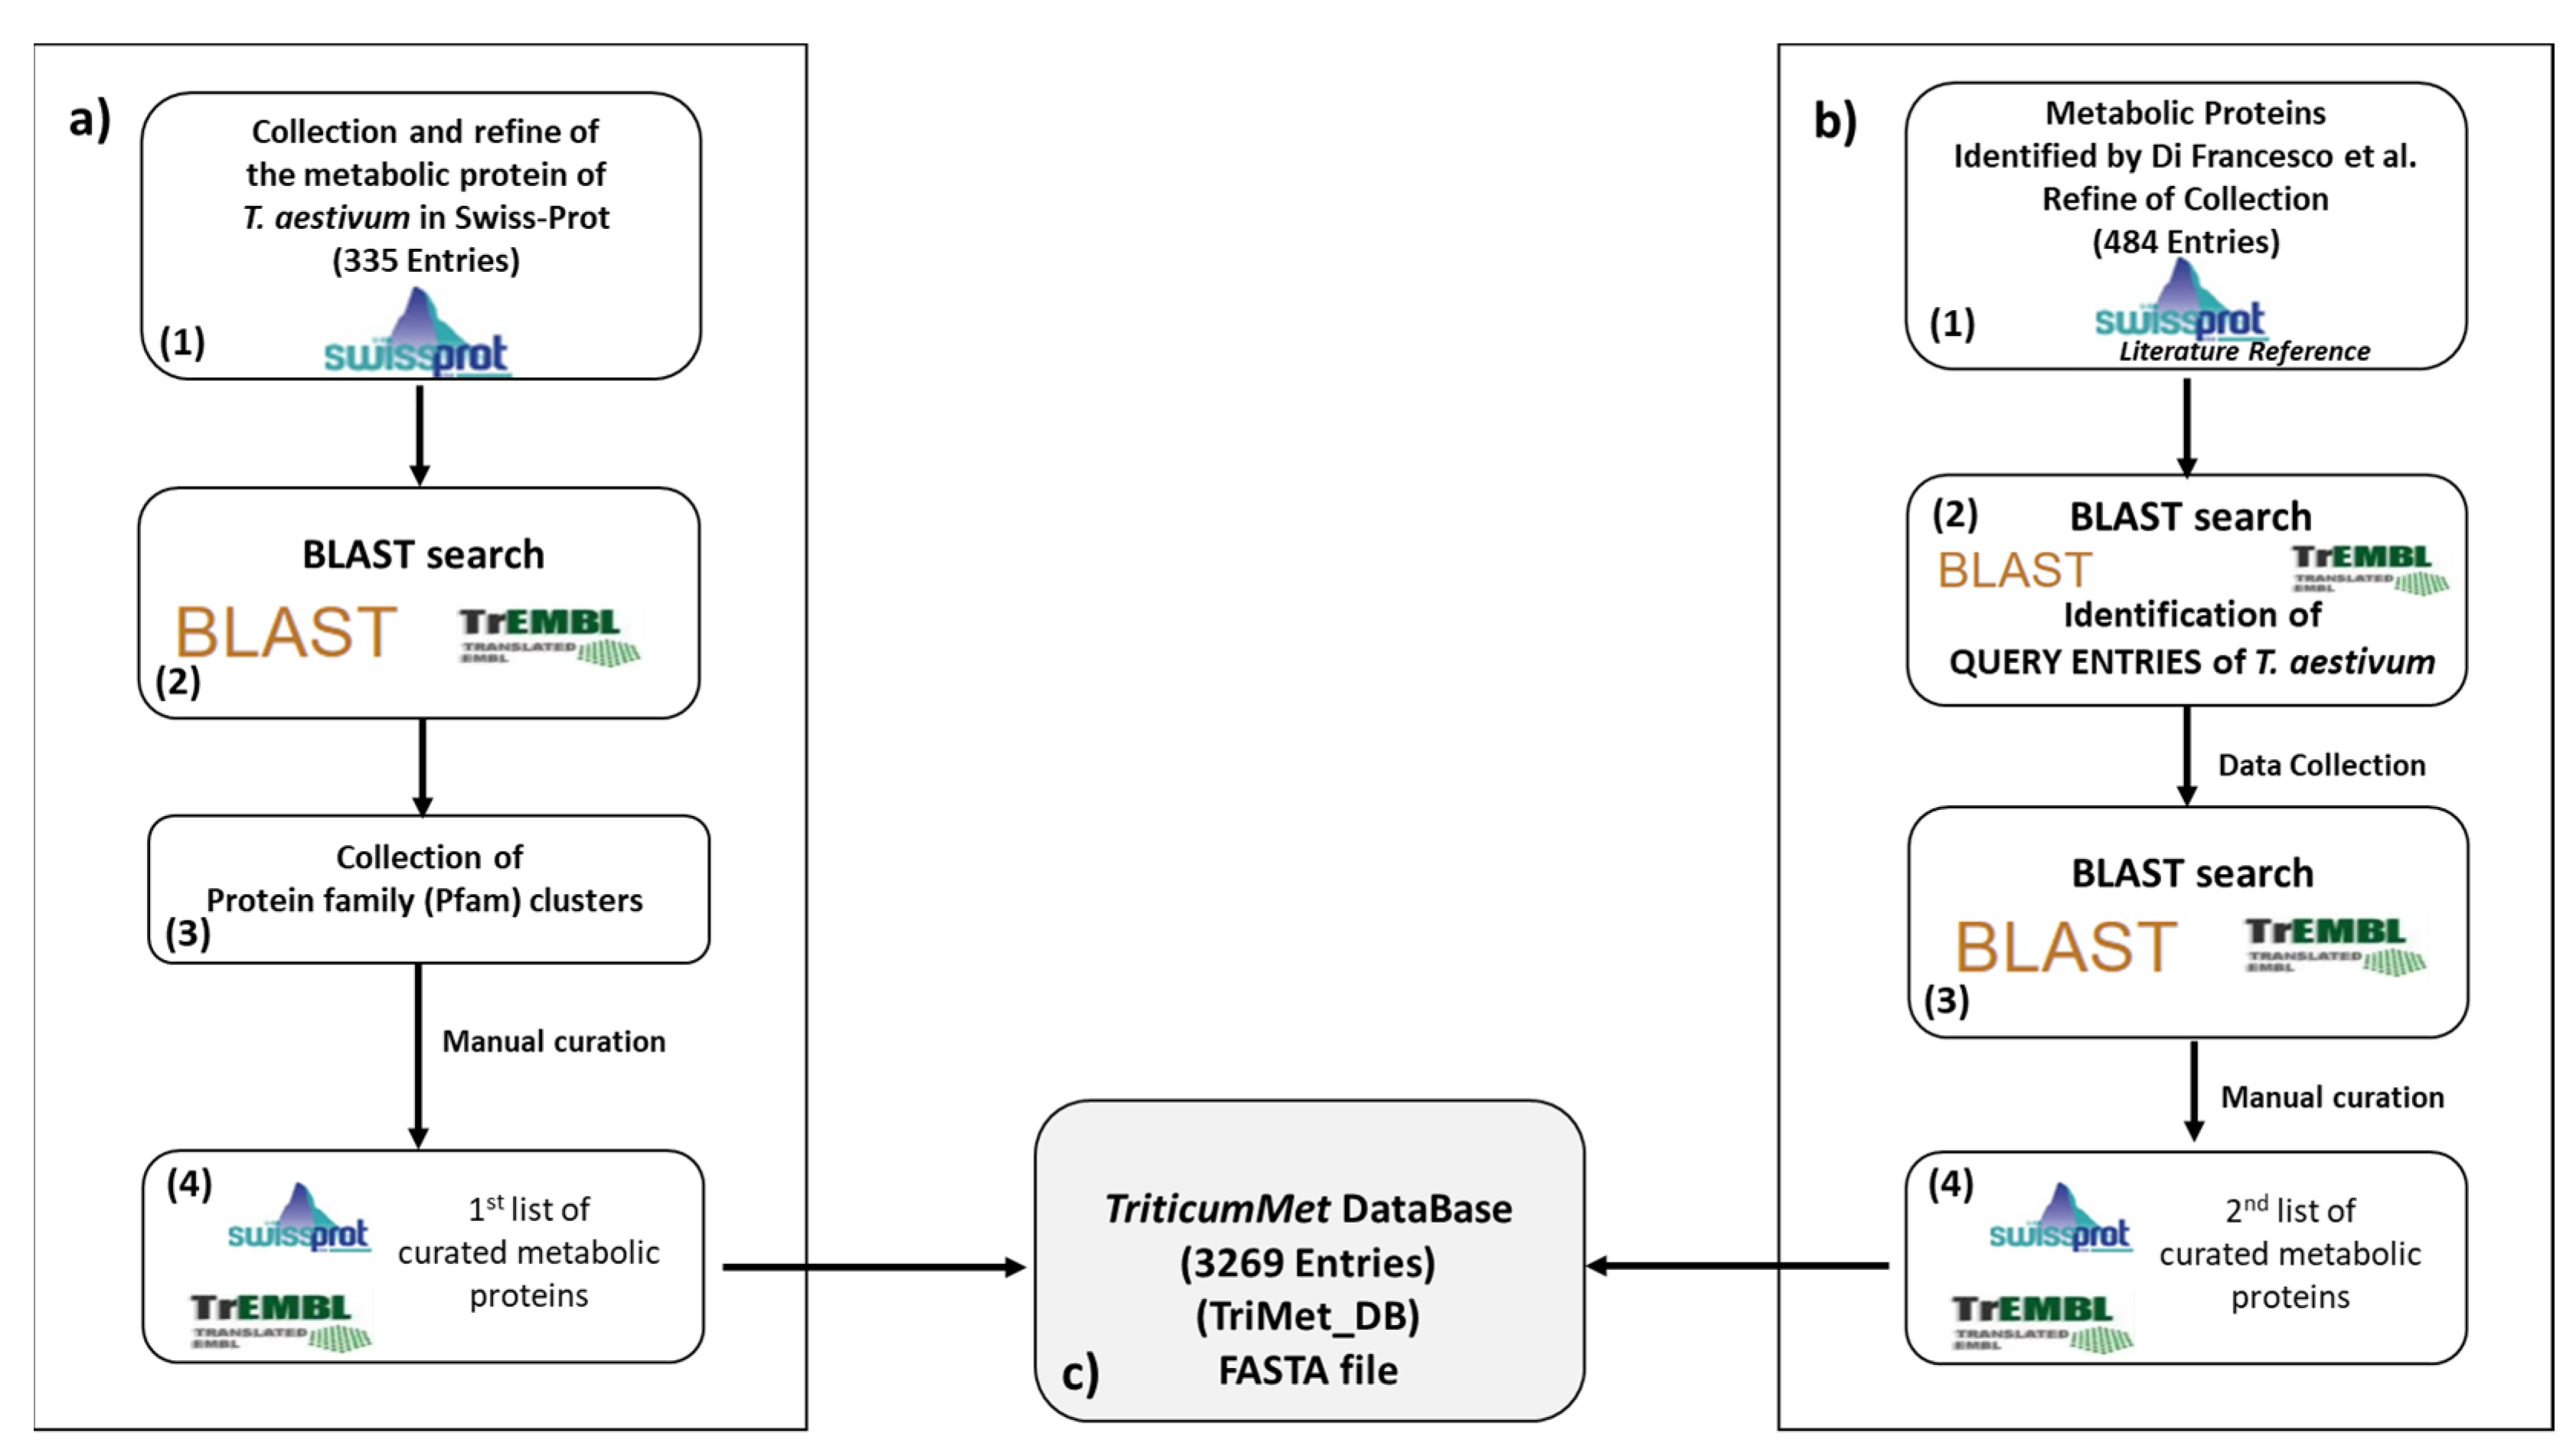
Abstract
1. Introduction
2. Materials and Methods
2.1. The TriMet Database Compilation
2.2. Chemicals
2.3. Sample Collection and Treatment
2.4. Mass Spectrometry Analysis
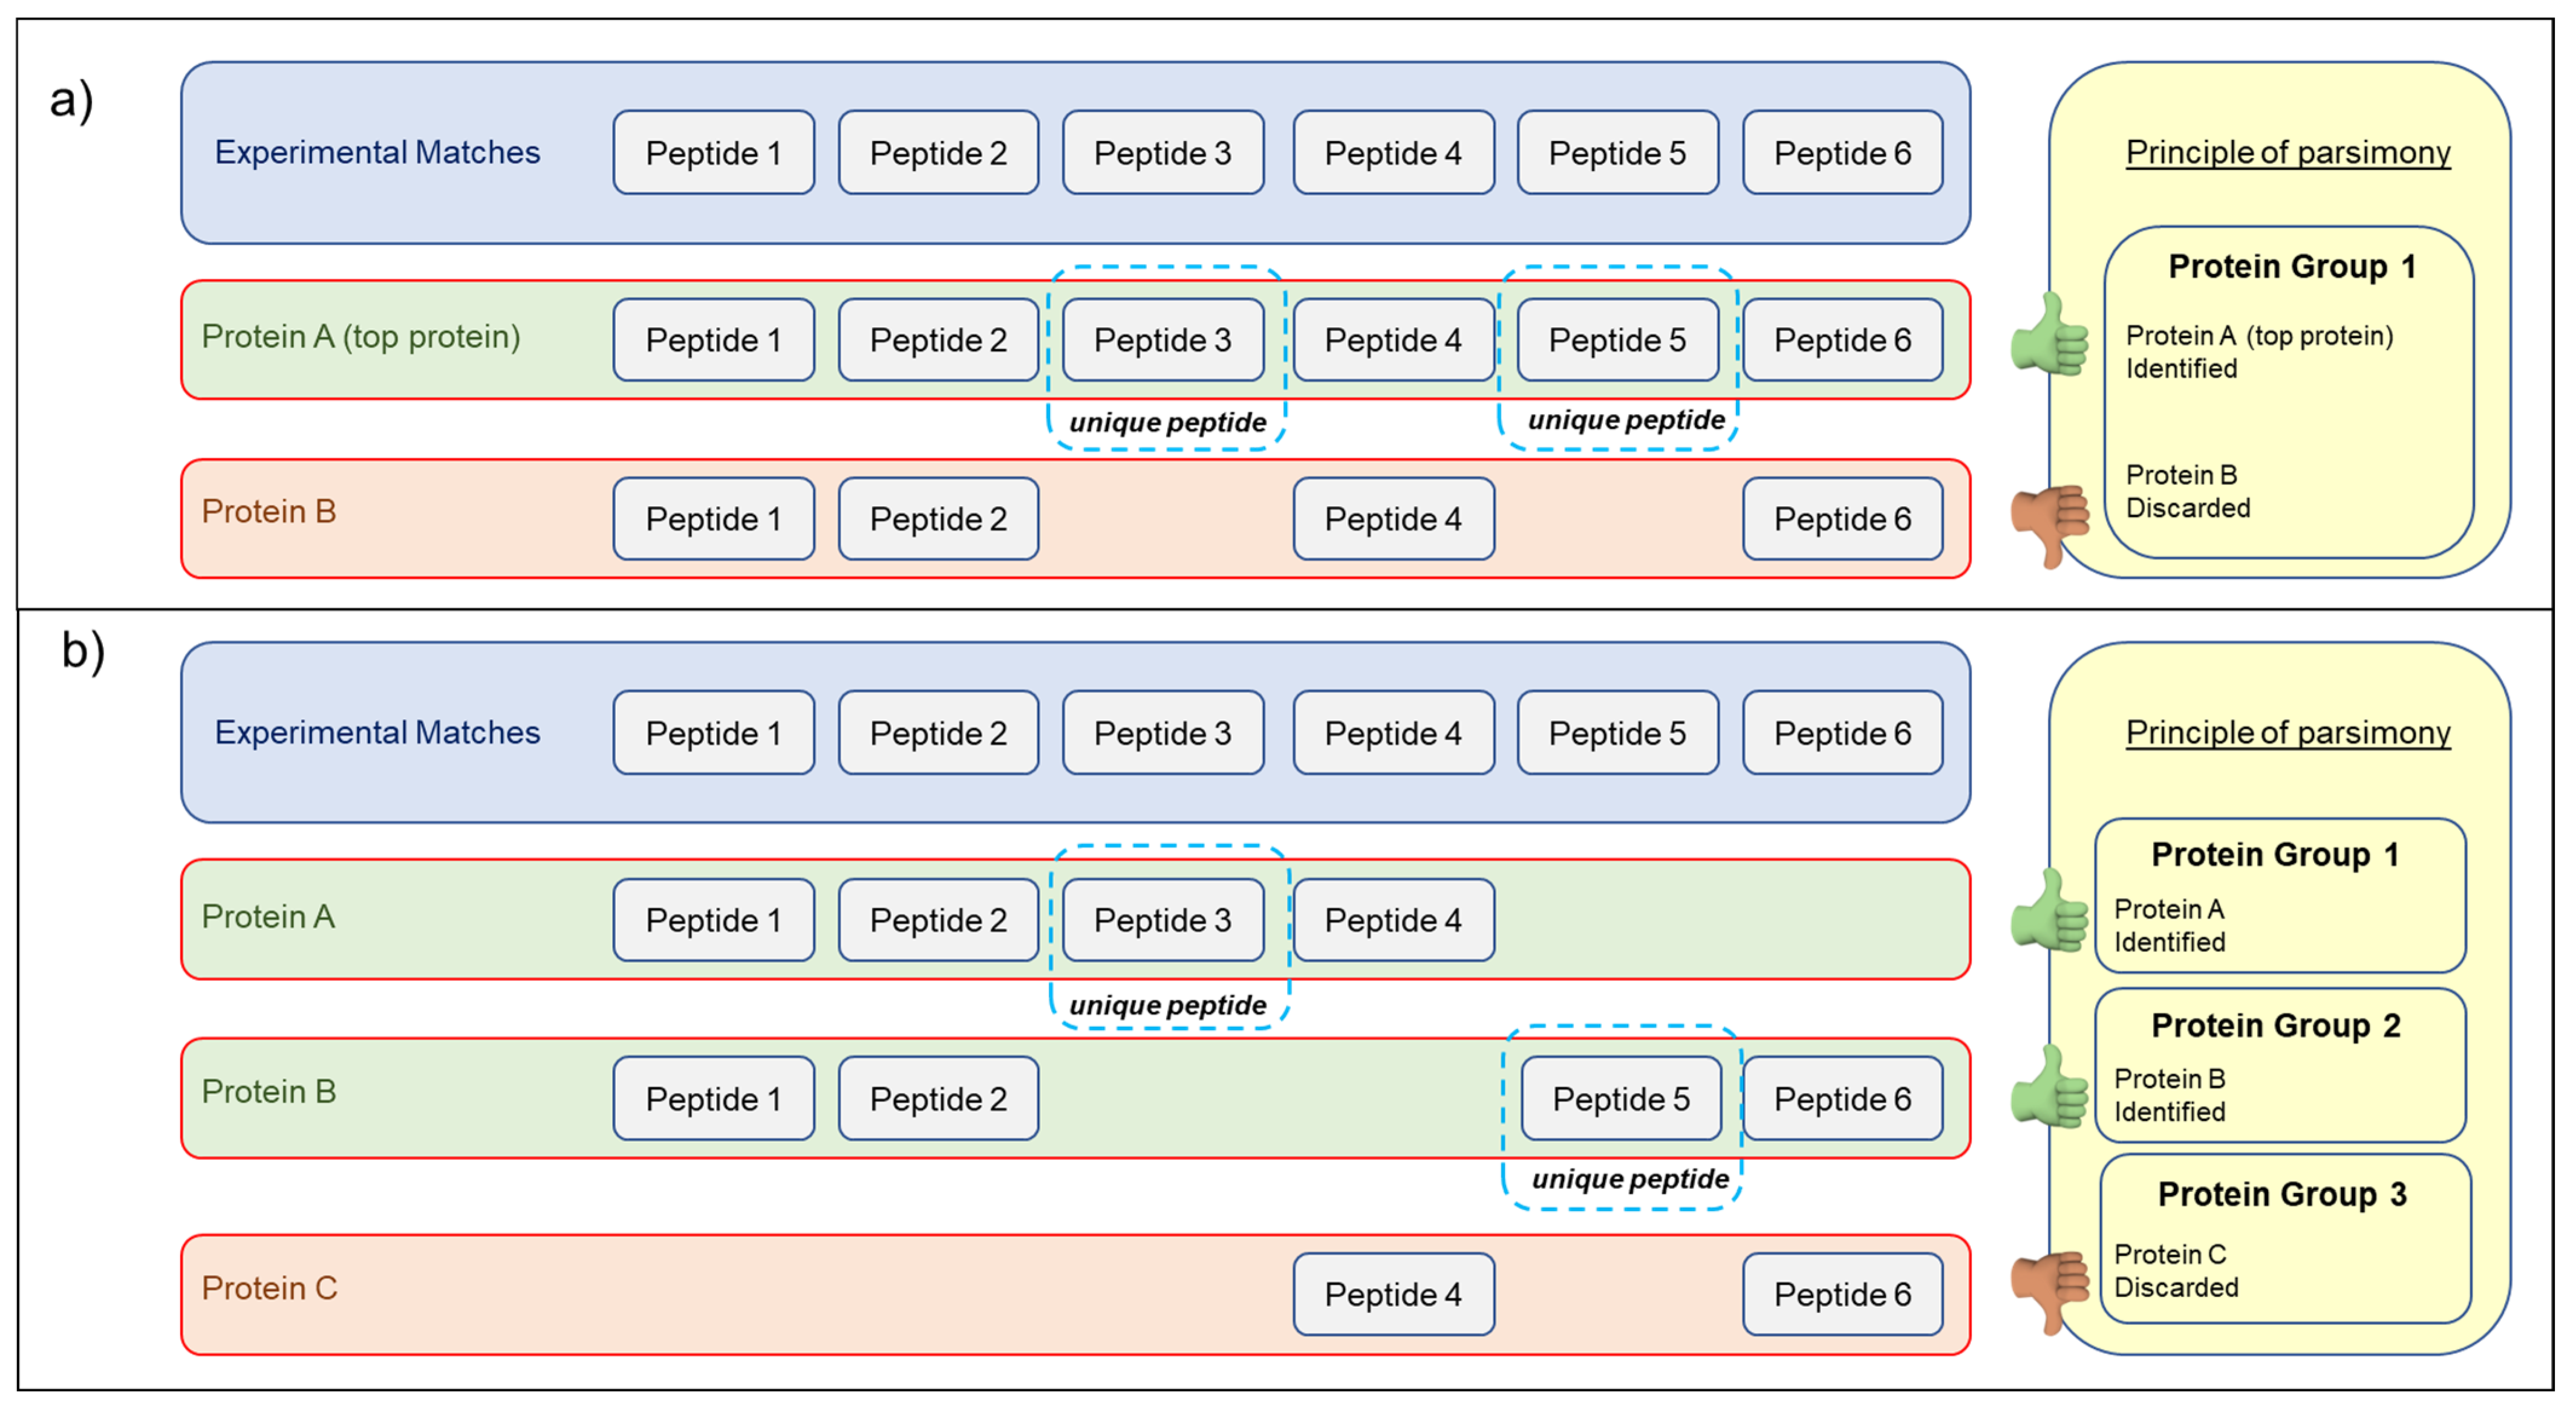
2.5. Database Search and Protein Identification
3. Results
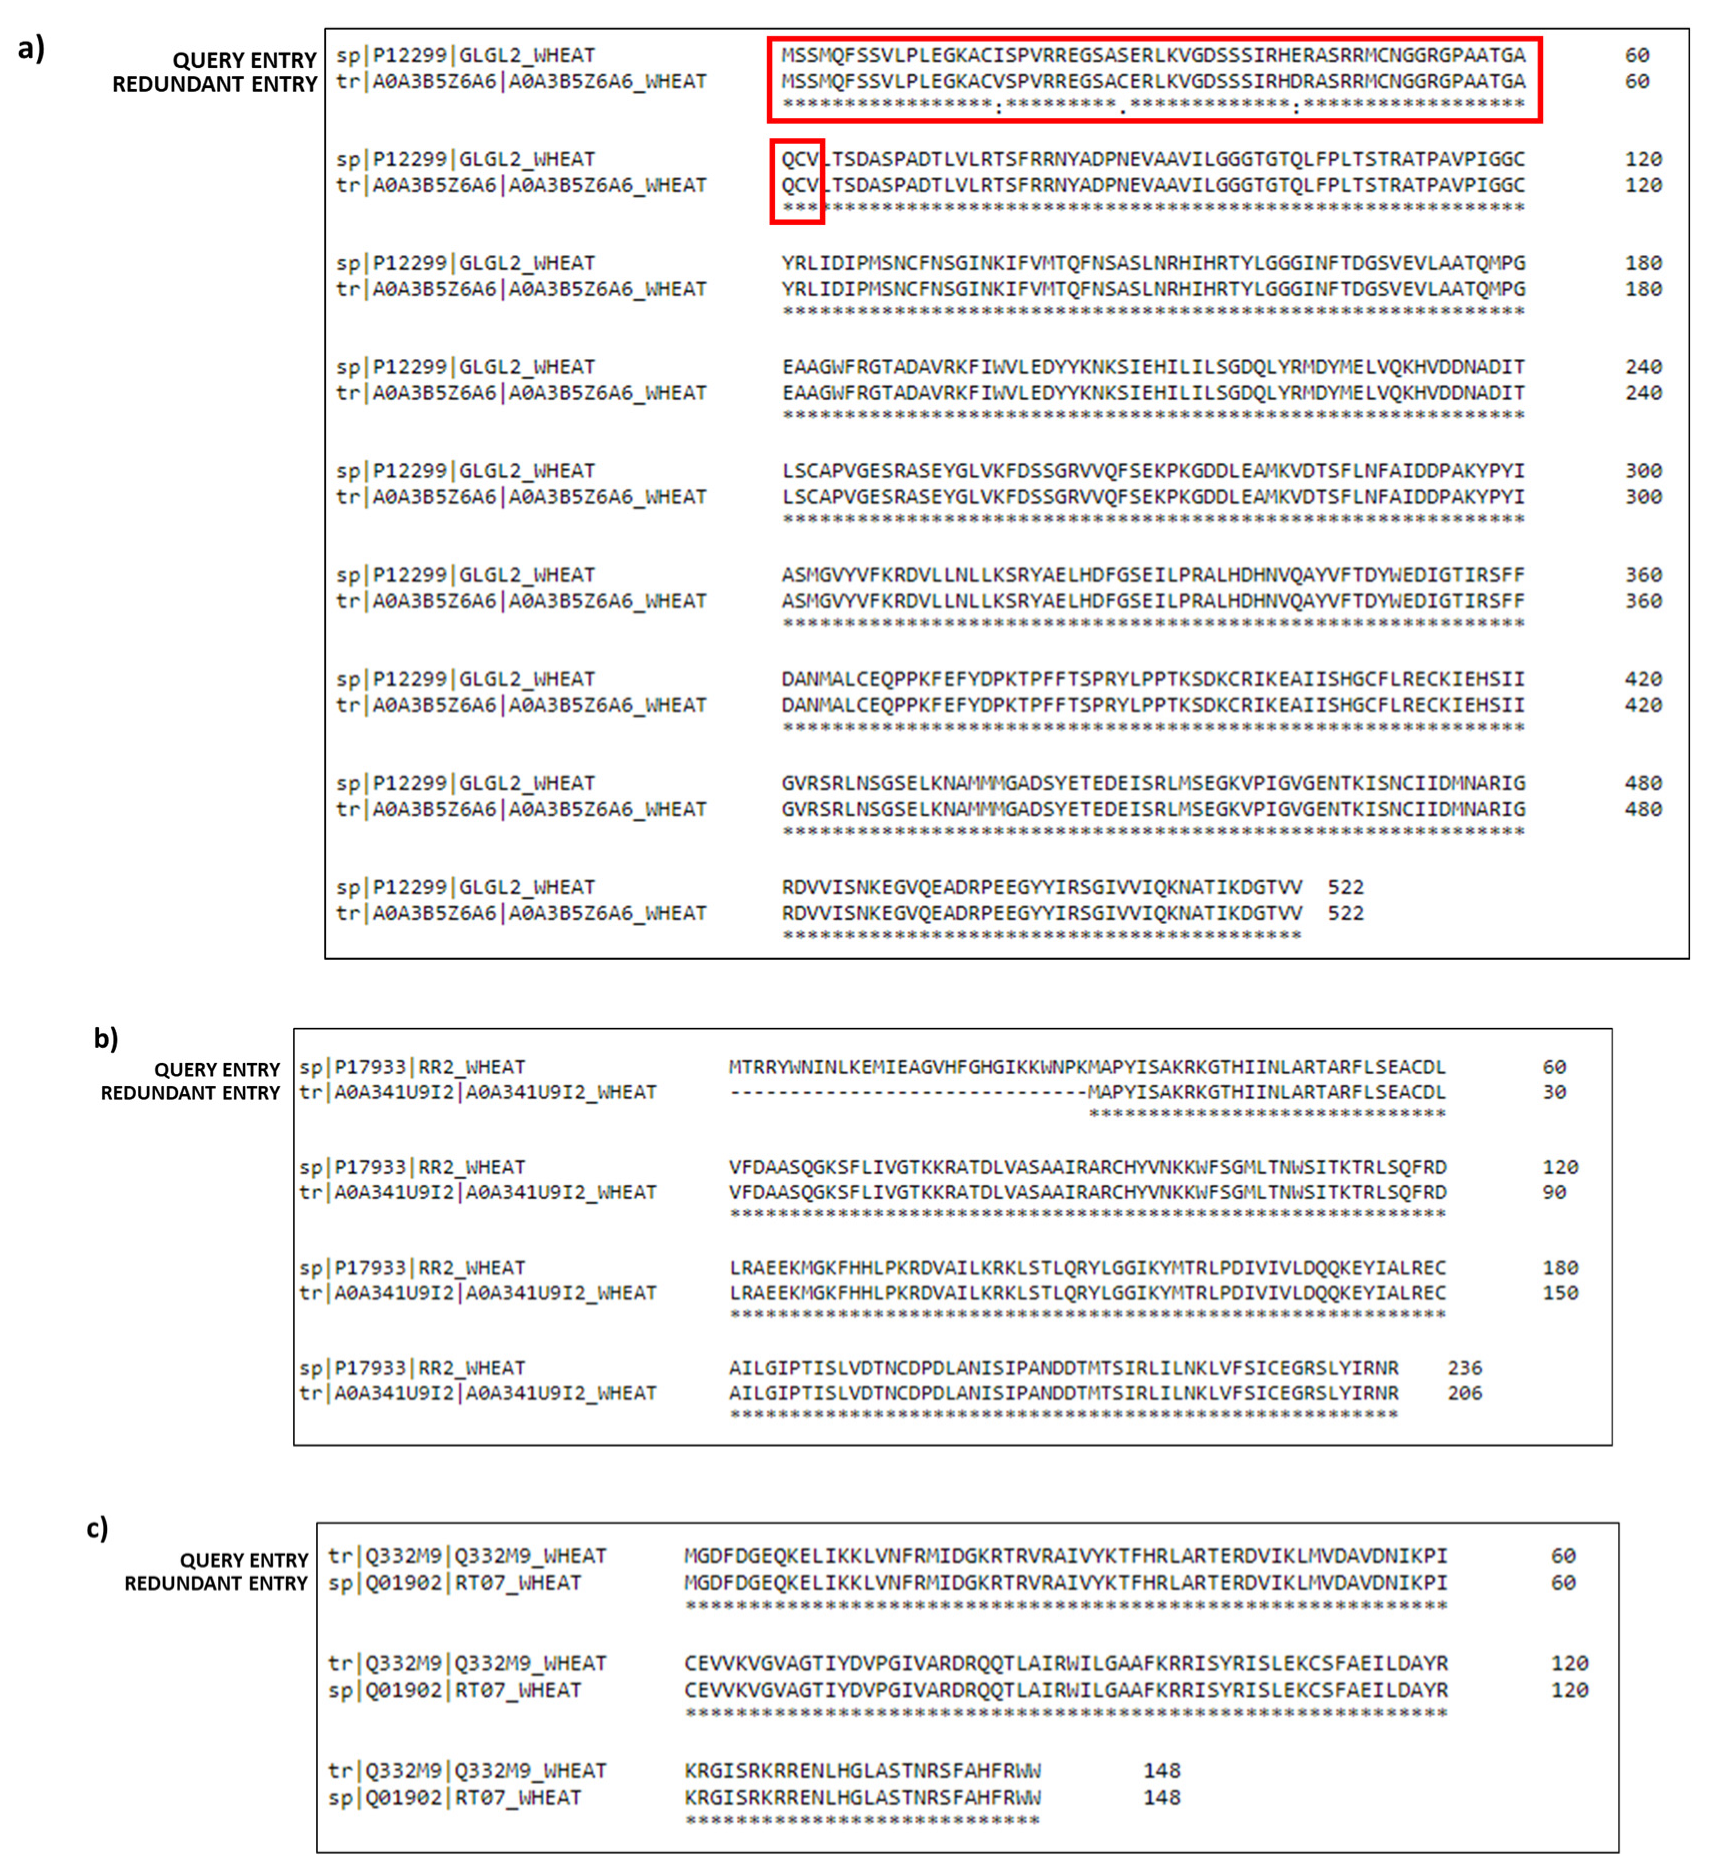
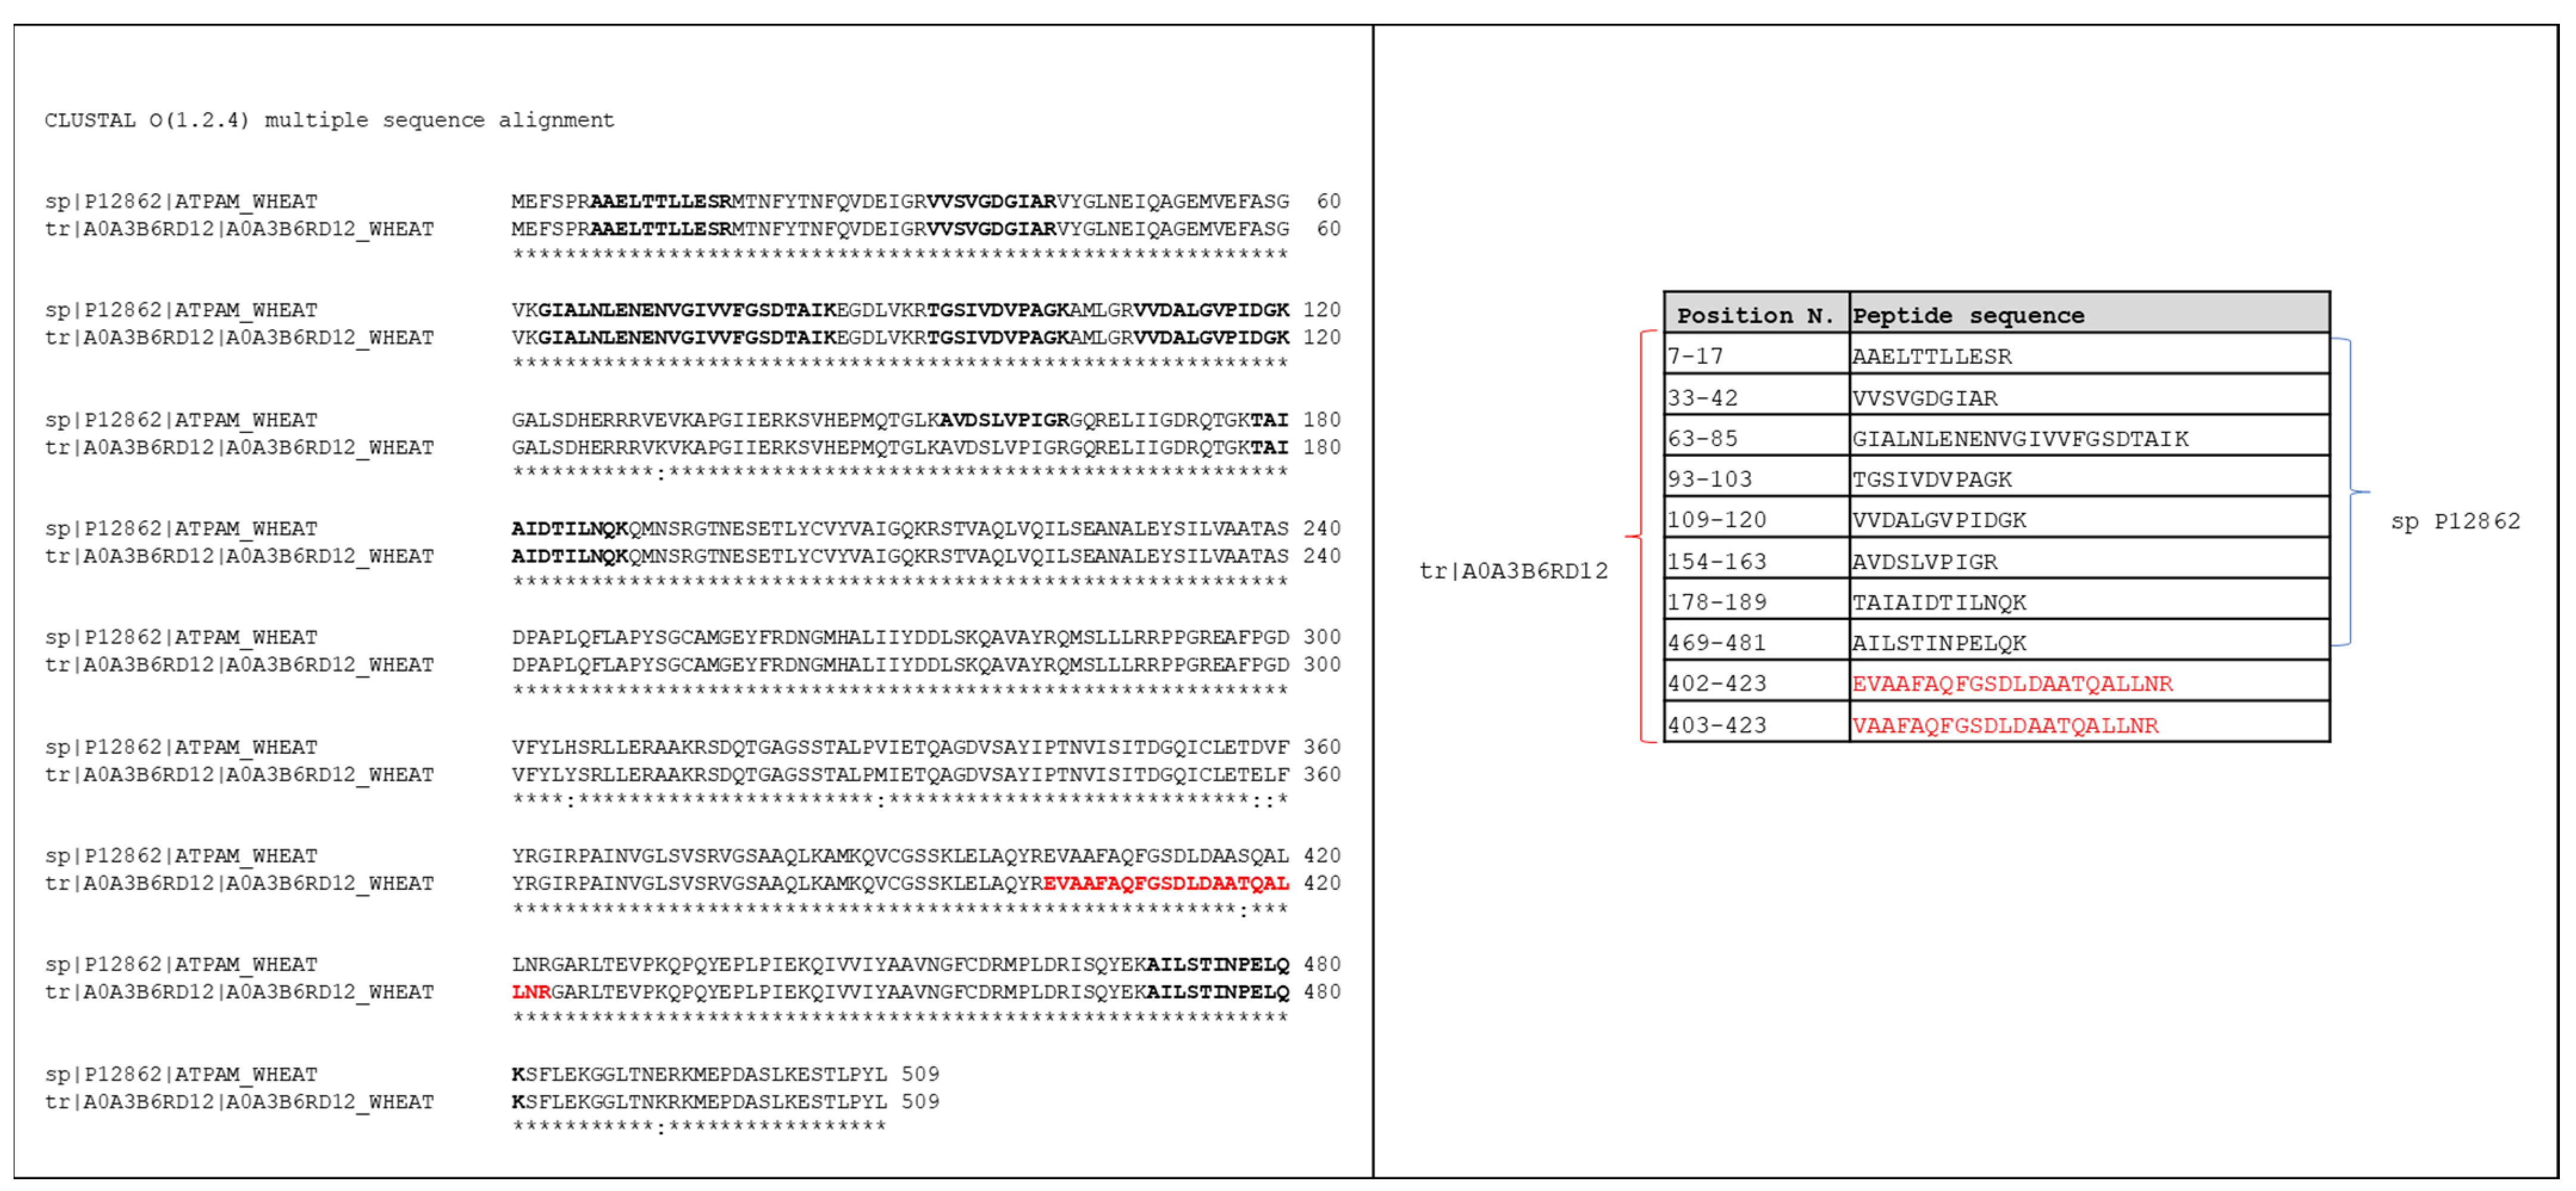
3.1. TriMet_DB Development
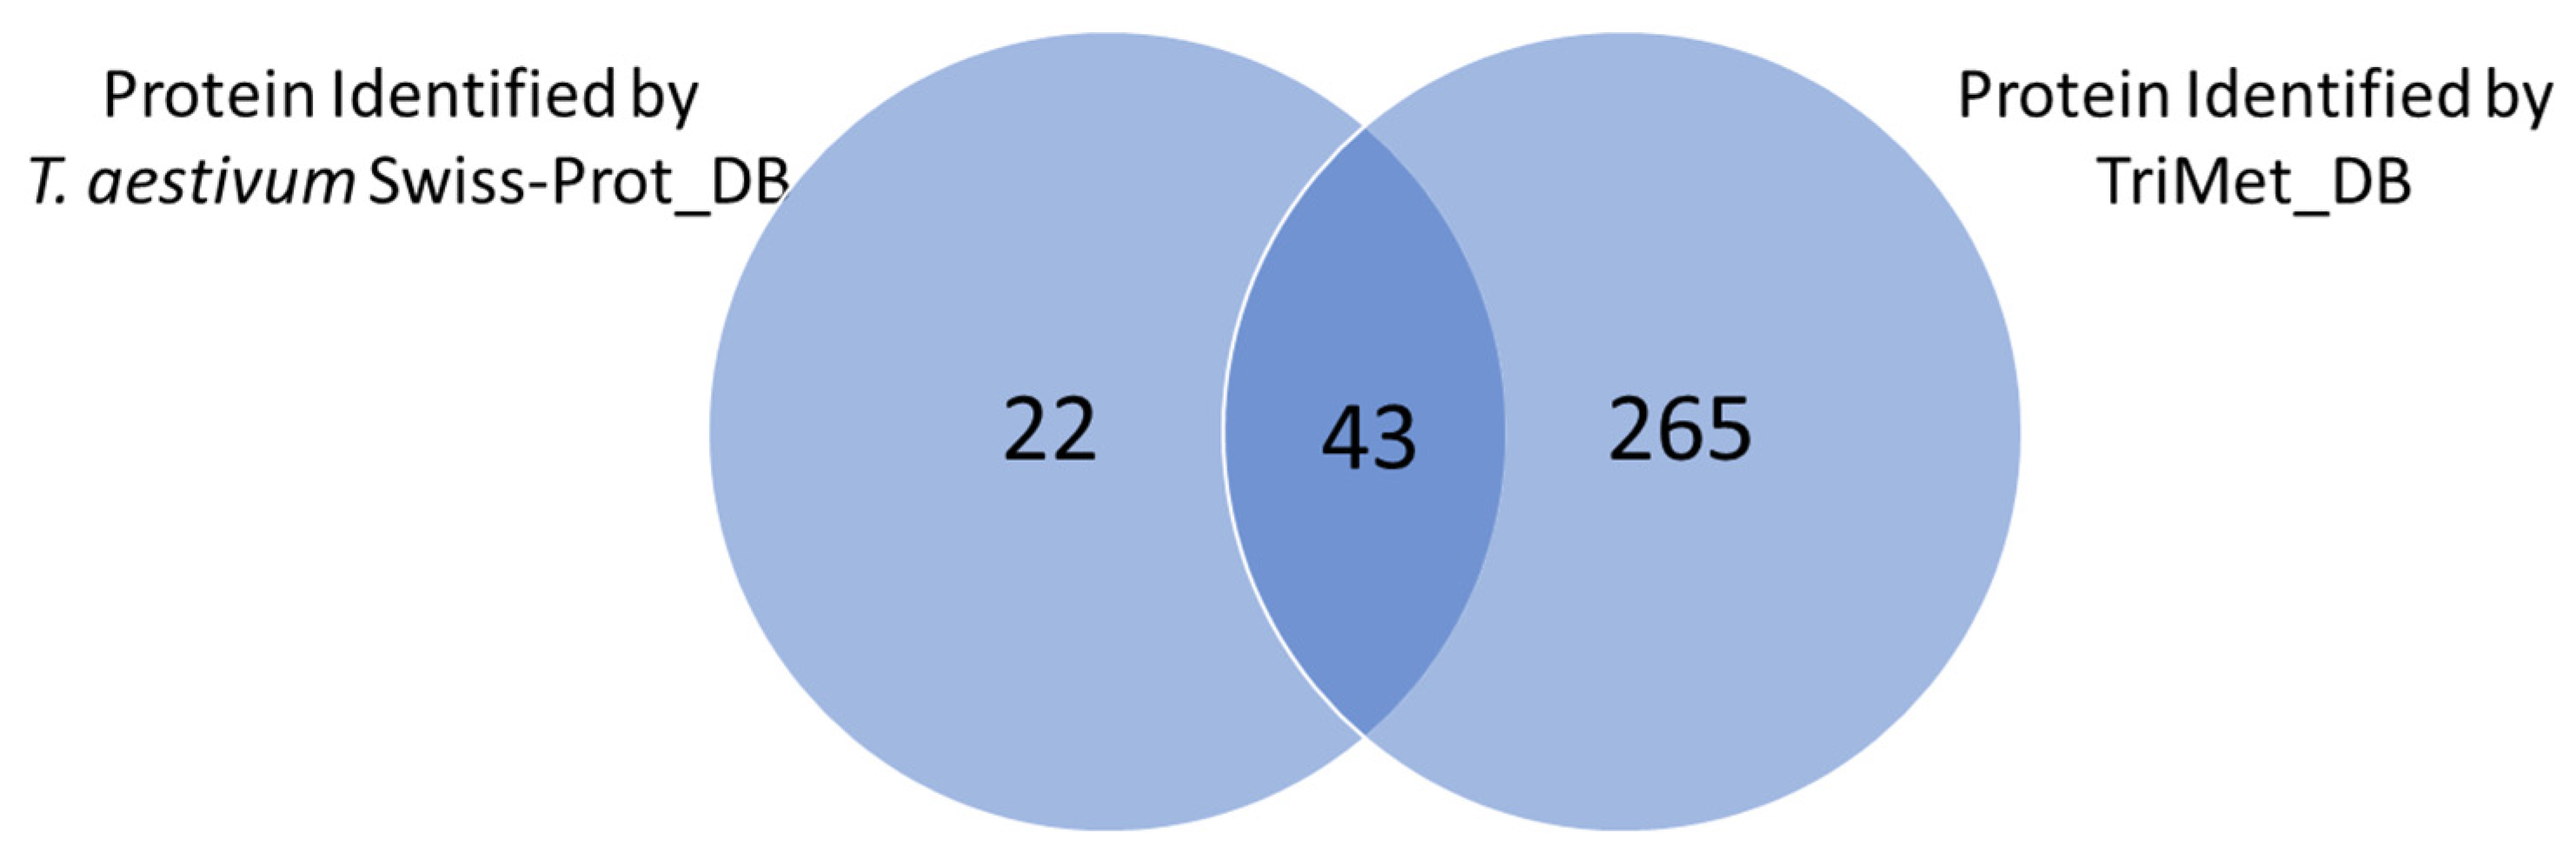
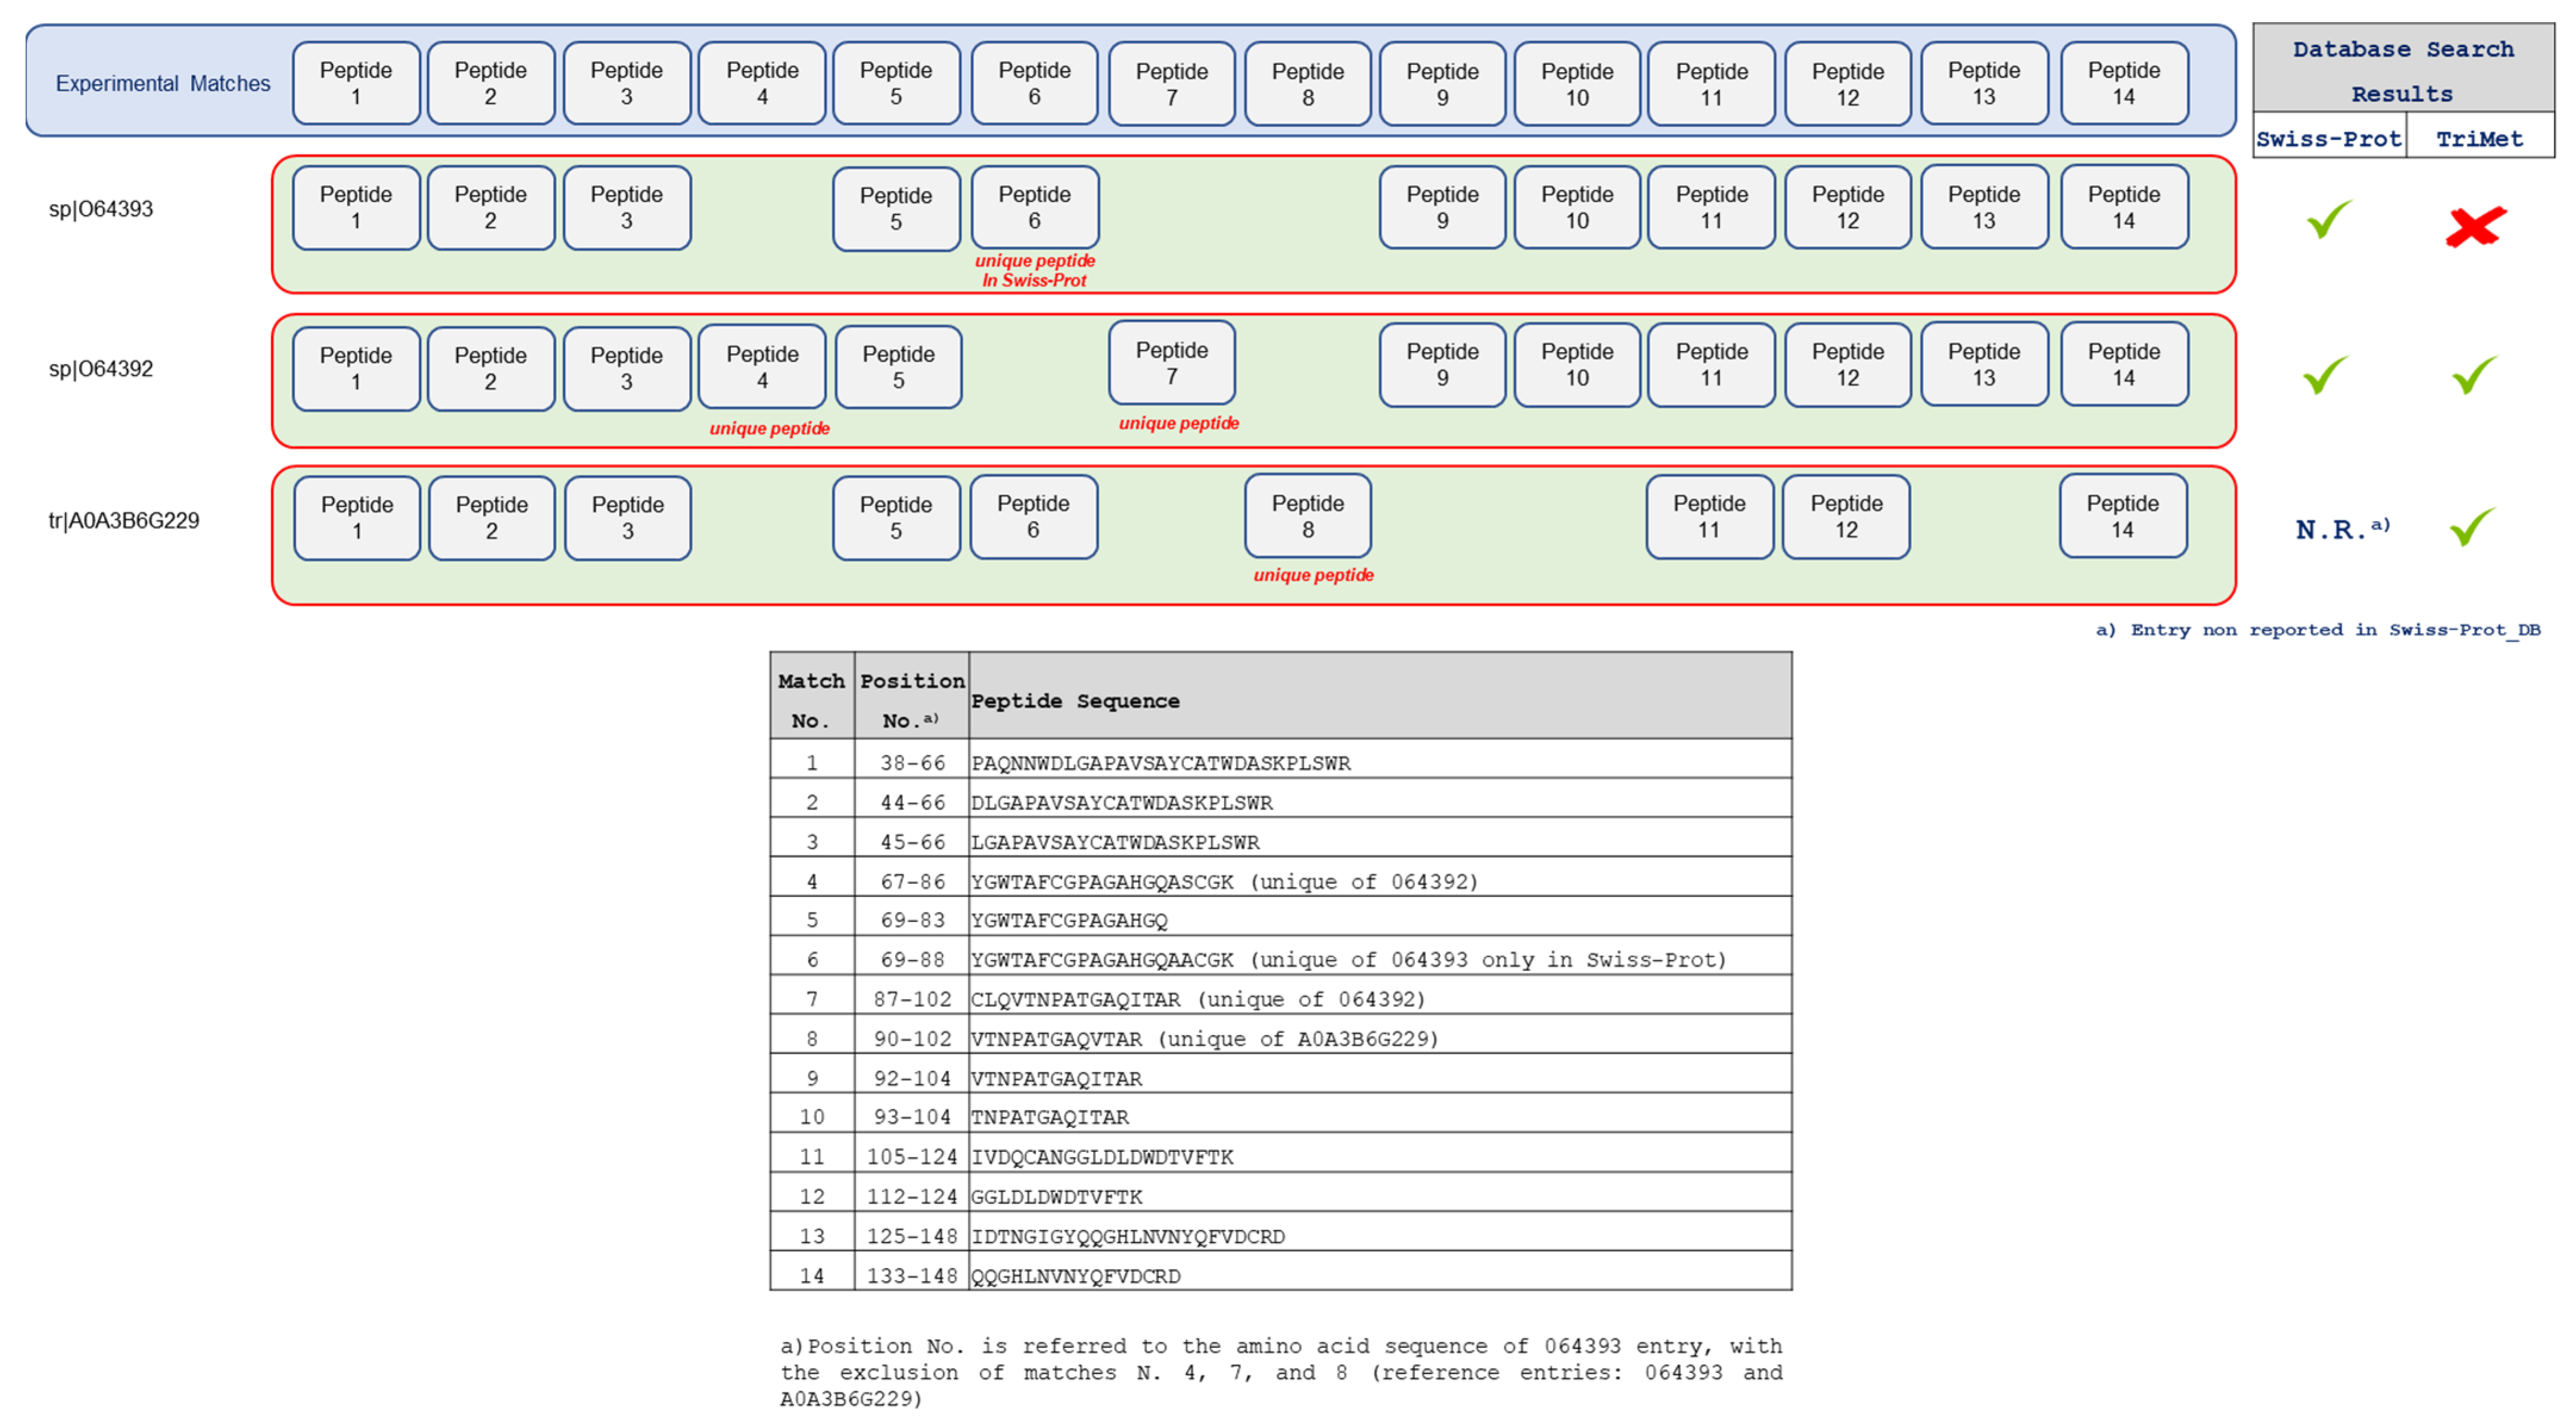
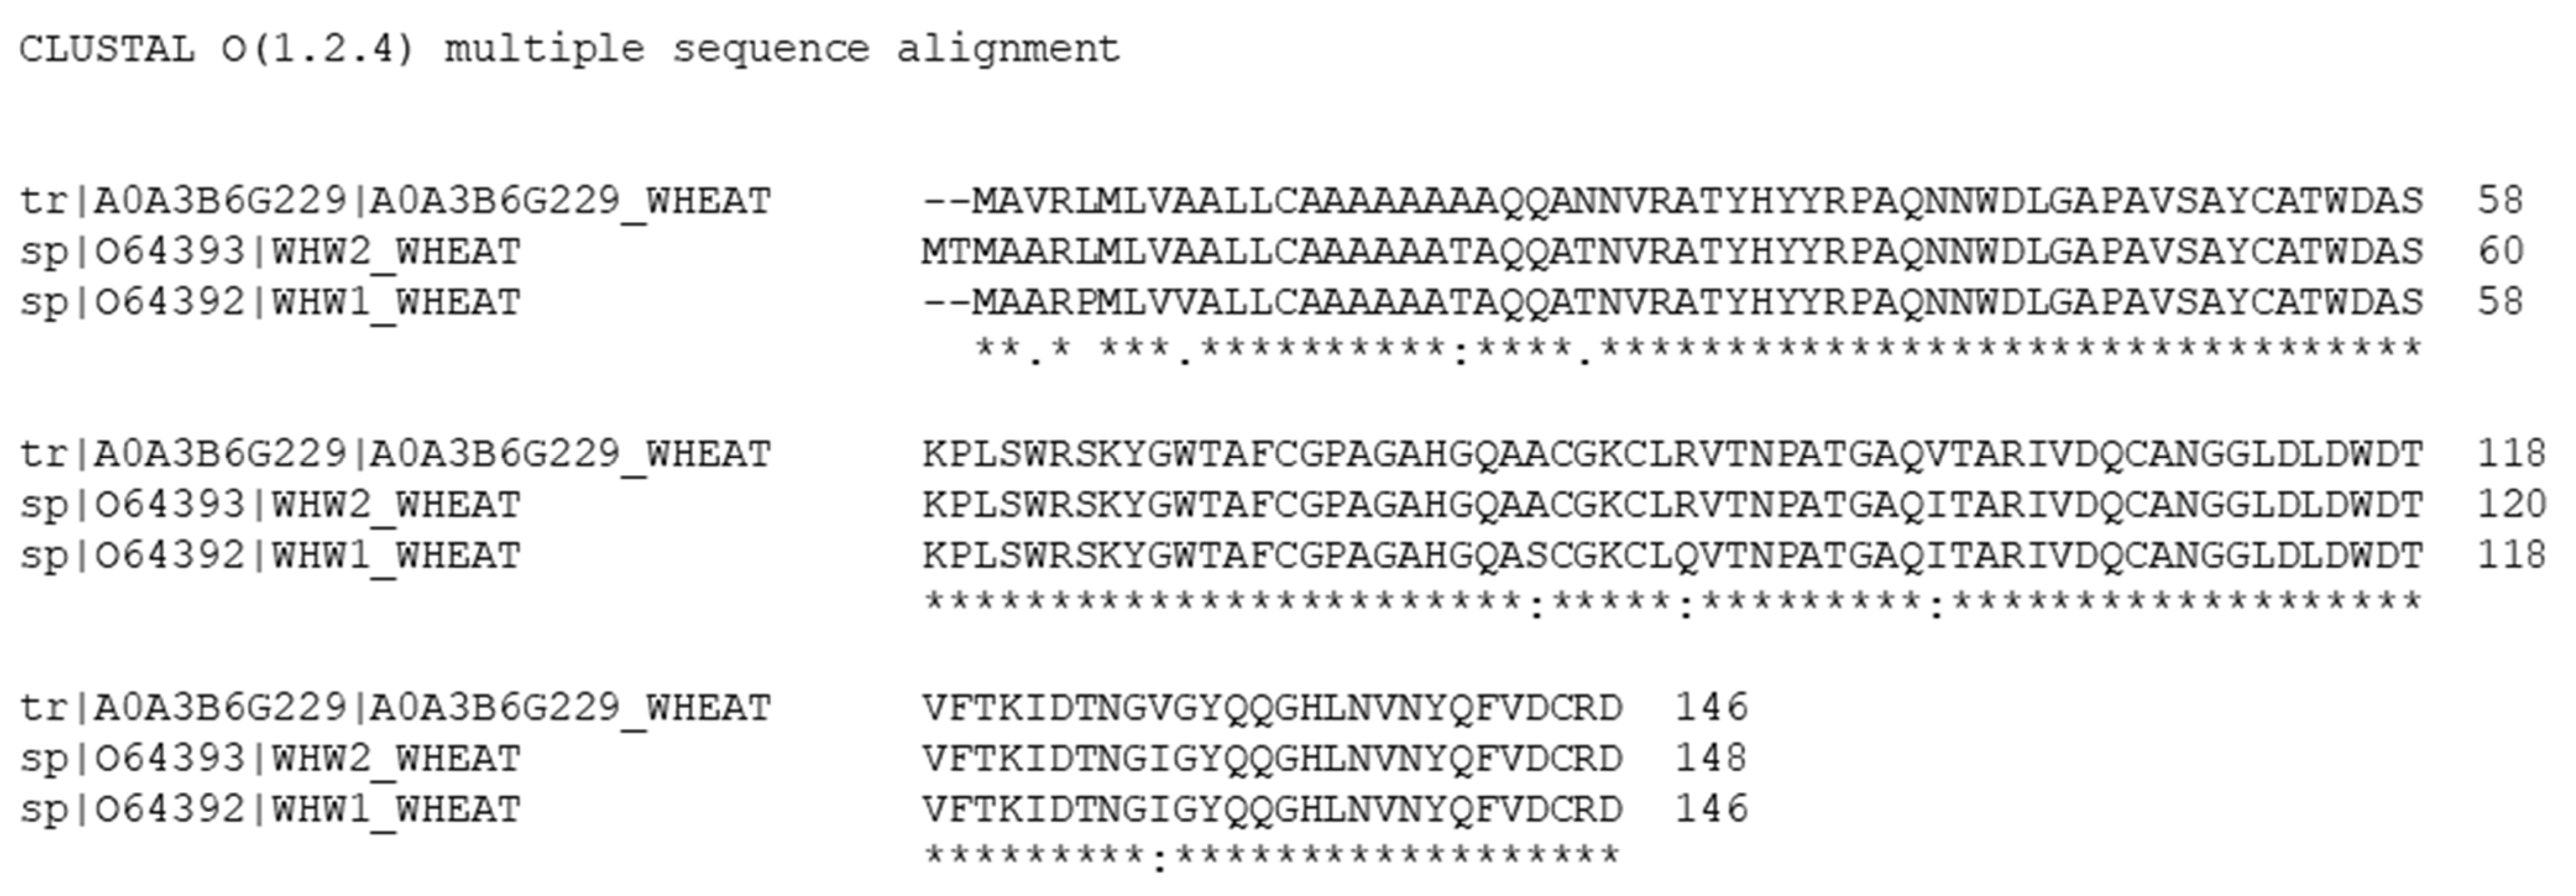
3.2. Searching MS Data against the TriMet_DB and T. aestivum Swiss-Prot_DB
4. Discussion
5. Conclusions
Supplementary Materials
Author Contributions
Funding
Institutional Review Board Statement
Informed Consent Statement
Data Availability Statement
Acknowledgments
Conflicts of Interest
References
- De Sousa, T.; Ribeiro, M.; Sabenca, C.; Igrejas, G. The 10,000-Year Success Story of Wheat! Foods 2021, 10, 2124. [Google Scholar] [CrossRef] [PubMed]
- Ciudad-Mulero, M.; Matallana-Gonzalez, M.C.; Callejo, M.J.; Carrillo, J.M.; Morales, P.; Fernandez-Ruiz, V. Durum and Bread Wheat Flours. Preliminary Mineral Characterization and Its Potential Health Claims. Agronomy 2021, 11, 108. [Google Scholar] [CrossRef]
- Bromilow, S.N.L.; Gethings, L.A.; Langridge, J.I.; Shewry, P.R.; Buckley, M.; Bromley, M.J.; Mills, E.N.C. Comprehensive Proteomic Profiling of Wheat Gluten Using a Combination of Data-Independent and Data-Dependent Acquisition. Front. Plant Sci. 2017, 7, 2020. [Google Scholar] [CrossRef] [PubMed]
- Juhasz, A.; Belova, T.; Florides, C.G.; Maulis, C.; Fischer, I.; Gell, G.; Birinyi, Z.; Ong, J.; Keeble-Gagnere, G.; Maharajan, A.; et al. Genome mapping of seed-borne allergens and immunoresponsive proteins in wheat. Sci. Adv. 2018, 4, eaar8602. [Google Scholar] [CrossRef] [PubMed]
- Lopez-Pedrouso, M.; Lorenzo, J.M.; Gagaoua, M.; Franco, D. Current Trends in Proteomic Advances for Food Allergen Analysis. Biology 2020, 9, 247. [Google Scholar] [CrossRef]
- Taranto, F.; D’Agostino, N.; Catellani, M.; Laviano, L.; Ronga, D.; Milc, J.; Prandi, B.; Boukid, F.; Sforza, S.; Graziano, S.; et al. Characterization of Celiac Disease-Related Epitopes and Gluten Fractions, and Identification of Associated Loci in Durum Wheat. Agronomy 2020, 10, 1231. [Google Scholar] [CrossRef]
- Di Francesco, A.; Cunsolo, V.; Saletti, R.; Svensson, B.; Muccilli, V.; De Vita, P.; Foti, S. Quantitative Label-Free Comparison of the Metabolic Protein Fraction in Old and Modern Italian Wheat Genotypes by a Shotgun Approach. Molecules 2021, 26, 2596. [Google Scholar] [CrossRef]
- Leonard, M.M.; Sapone, A.; Catassi, C.; Fasano, A. Celiac Disease and Nonceliac Gluten Sensitivity A Review. JAMA-J. Am. Med. Assoc. 2017, 318, 647–656. [Google Scholar] [CrossRef]
- Prem, L.; Bhalla, A.S.; Singh, M.B. Enabling Molecular Technologies for Trait Improvement in Wheat. In Wheat Biotechnology: Methods and Protocols, 2017 ed.; Singh, M.B., Bhalla, P.L., Eds.; Humana Press: New York, NY, USA, 2017; Volume 1679, pp. 3–24. [Google Scholar]
- Shah, T.; Xu, J.S.; Zou, X.L.; Cheng, Y.; Nasir, M.; Zhang, X.K. Omics Approaches for Engineering Wheat Production under Abiotic Stresses. Int. J. Mol. Sci. 2018, 19, 2390. [Google Scholar] [CrossRef]
- Appels, R.; Eversole, K.; Feuillet, C.; Keller, B.; Rogers, J.; Stein, N.; Pozniak, C.J.; Choulet, F.; Distelfeld, A.; Poland, J.; et al. Shifting the limits in wheat research and breeding using a fully annotated reference genome. Science 2018, 361, 1126. [Google Scholar] [CrossRef]
- Cunsolo, V.; Muccilli, V.; Saletti, R.; Foti, S. Mass spectrometry in food proteomics: A tutorial. J. Mass Spectrom. 2014, 49, 768–784. [Google Scholar] [CrossRef]
- Cunsolo, V.; Muccilli, V.; Saletti, R.; Foti, S. Mass spectrometry in the proteome analysis of mature cereal kernels. Mass Spectrom. Rev. 2012, 31, 448–465. [Google Scholar] [CrossRef]
- Ferranti, P. Mass spectrometric approach for the analysis of food proteins. Eur. J. Mass Spectrom. 2004, 10, 349–358. [Google Scholar] [CrossRef]
- Ferranti, P.; Marnone, G.R.; Picariello, G.; Addeo, F. Mass spectrometry analysis of gliadins in celiac disease. J. Mass Spectrom. 2007, 42, 1531–1548. [Google Scholar] [CrossRef]
- Vincent, D.; Bui, A.; Ram, D.; Ezernieks, V.; Bedon, F.; Panozzo, J.; Maharjan, P.; Rochfort, S.; Daetwyler, H.; Hayden, M. Mining the Wheat Grain Proteome. Int. J. Mol. Sci. 2022, 23, 713. [Google Scholar] [CrossRef]
- Afzal, M.; Pfannstiel, J.; Zimmermann, J.; Bischoff, S.C.; Wurschum, T.; Longin, C.F.H. High-resolution proteomics reveals differences in the proteome of spelt and bread wheat flour representing targets for research on wheat sensitivities. Sci. Rep. 2020, 10, 14677. [Google Scholar] [CrossRef]
- Fallahbaghery, A.; Zou, W.; Byrne, K.; Howitt, C.A.; Colgrave, M.L. Comparison of Gluten Extraction Protocols Assessed by LC-MS/MS Analysis. J. Agric. Food Chem. 2017, 65, 2857–2866. [Google Scholar] [CrossRef]
- Guan, J.T.; Garcia, D.F.; Zhou, Y.; Appels, R.; Li, A.L.; Mao, L. The Battle to Sequence the Bread Wheat Genome: A Tale of the Three Kingdoms. Genom. Proteom. Bioinform. 2020, 18, 221–229. [Google Scholar] [CrossRef]
- Lai, K.T.; Berkman, P.J.; Lorenc, M.T.; Duran, C.; Smits, L.; Manoli, S.; Stiller, J.; Edwards, D. WheatGenome.info: An Integrated Database and Portal for Wheat Genome Information. Plant Cell Physiol. 2012, 53, e2. [Google Scholar] [CrossRef]
- Mayer, K.F.X.; Rogers, J.; Dolezel, J.; Pozniak, C.; Eversole, K.; Feuillet, C.; Gill, B.; Friebe, B.; Lukaszewski, A.J.; Sourdille, P.; et al. A chromosome-based draft sequence of the hexaploid bread wheat (Triticum aestivum) genome. Science 2014, 345, 1251788. [Google Scholar] [CrossRef]
- Ramirez-Gonzalez, R.H.; Borrill, P.; Lang, D.; Harrington, S.A.; Brinton, J.; Venturini, L.; Davey, M.; Jacobs, J.; van Ex, F.; Pasha, A.; et al. The transcriptional landscape of polyploid wheat. Science 2018, 361, eaar6089. [Google Scholar] [CrossRef] [PubMed]
- Canovas, F.M.; Dumas-Gaudot, E.; Recorbet, G.; Jorrin, J.; Mock, H.P.; Rossignol, M. Plant proteome analysis. Proteomics 2004, 4, 285–298. [Google Scholar] [CrossRef] [PubMed]
- Jorrin, J.V.; Maldonado, A.M.; Castillejo, M.A. Plant proteome analysis: A 2006 update. Proteomics 2007, 7, 2947–2962. [Google Scholar] [CrossRef] [PubMed]
- Newton, R.P.; Brenton, A.G.; Smith, C.J.; Dudley, E. Plant proteome analysis by mass spectrometry: Principles, problems, pitfalls and recent developments. Phytochemistry 2004, 65, 1449–1485. [Google Scholar] [CrossRef] [PubMed]
- Schneider, M.; Lane, L.; Boutet, E.; Lieberherr, D.; Tognolli, M.; Bougueleret, L.; Baiyoch, A. The UniProtKB/Swiss-Prot knowledgebase and its Plant Proteome Annotation Program. J. Proteom. 2009, 72, 567–573. [Google Scholar] [CrossRef]
- Boutet, E.; Lieberherr, D.; Tognolli, M.; Schneider, M.; Bairoch, A. UniProtKB/Swiss-Prot; Human Press: Totowa, NJ, USA, 2007; Volume 406, pp. 89–112. [Google Scholar]
- Heazlewood, J.L. The Green proteome: Challenges in plant proteomics. Front. Plant Sci. 2011, 2, 6. [Google Scholar] [CrossRef]
- Sun, Q.; Zybailov, B.; Majeran, W.; Friso, G.; Olinares, P.D.B.; van Wijk, K.J. PPDB, the Plant Proteomics Database at Cornell. Nucleic Acids Res. 2009, 37, D969–D974. [Google Scholar] [CrossRef] [PubMed]
- Bromilow, S.; Gethings, L.A.; Buckley, M.; Bromley, M.; Shewry, P.R.; Langridge, J.I.; Mills, E.N.C. A curated gluten protein sequence database to support development of proteomics methods for determination of gluten in gluten-free foods. J. Proteom. 2017, 163, 67–75. [Google Scholar] [CrossRef]
- Di Francesco, A.; Saletti, R.; Cunsolo, V.; Svensson, B.; Muccilli, V.; De Vita, P.; Foti, S. Qualitative proteomic comparison of metabolic and CM-like protein fractions in old and modern wheat Italian genotypes by a shotgun approach. J. Proteom. 2020, 211, 103530. [Google Scholar] [CrossRef]
- Eddy, S.R. Where did the BLOSUM62 alignment score matrix come from? Nat. Biotechnol. 2004, 22, 1035–1036. [Google Scholar] [CrossRef]
- Valencia, A. Automatic annotation of protein function. Curr. Opin. Struct. Biol. 2005, 15, 267–274. [Google Scholar] [CrossRef] [PubMed]
- Galperin, M.Y.; Koonin, E.V. Sources of systematic error in functional annotation of genomes: Domain rearrangement, non-orthologous gene displacement and operon disruption. Silico Biol. 1998, 1, 55–67. [Google Scholar]
- Serang, O.; Noble, W. A review of statistical methods for protein identification using tandem mass spectrometry. Stat. Its Interface 2012, 5, 3–20. [Google Scholar]
- Bamberger, C.; Martinez-Bartolome, S.; Montgomery, M.; Pankow, S.; Hulleman, J.D.; Kelly, J.W.; Yates, J.R. Deducing the presence of proteins and proteoforms in quantitative proteomics. Nat. Commun. 2018, 9, 2320. [Google Scholar] [CrossRef]
- McHugh, L.; Arthur, J.W. Computational Methods for Protein Identification from Mass Spectrometry Data. PLoS Comput. Biol. 2008, 4, e12. [Google Scholar] [CrossRef] [PubMed]
- Nesvizhskii, A.I.; Aebersold, R. Interpretation of shotgun proteomic data-The protein inference problem. Mol. Cell Proteom. 2005, 4, 1419–1440. [Google Scholar] [CrossRef]
- Koskinen, V.R.; Emery, P.A.; Creasy, D.M.; Cottrell, J.S. Hierarchical Clustering of Shotgun Proteomics Data. Mol. Cell Proteom. 2011, 10, M110.003822. [Google Scholar] [CrossRef]
- Perez-Riverol, Y.; Csordas, A.; Bai, J.W.; Bernal-Llinares, M.; Hewapathirana, S.; Kundu, D.J.; Inuganti, A.; Griss, J.; Mayer, G.; Eisenacher, M.; et al. The PRIDE database and related tools and resources in 2019: Improving support for quantification data. Nucleic Acids Res. 2019, 47, D442–D450. [Google Scholar] [CrossRef]


Publisher’s Note: MDPI stays neutral with regard to jurisdictional claims in published maps and institutional affiliations. |
© 2022 by the authors. Licensee MDPI, Basel, Switzerland. This article is an open access article distributed under the terms and conditions of the Creative Commons Attribution (CC BY) license (https://creativecommons.org/licenses/by/4.0/).
Share and Cite
Cunsolo, V.; Di Francesco, A.; Pittalà, M.G.G.; Saletti, R.; Foti, S. The TriMet_DB: A Manually Curated Database of the Metabolic Proteins of Triticum aestivum. Nutrients 2022, 14, 5377. https://doi.org/10.3390/nu14245377
Cunsolo V, Di Francesco A, Pittalà MGG, Saletti R, Foti S. The TriMet_DB: A Manually Curated Database of the Metabolic Proteins of Triticum aestivum. Nutrients. 2022; 14(24):5377. https://doi.org/10.3390/nu14245377
Chicago/Turabian StyleCunsolo, Vincenzo, Antonella Di Francesco, Maria Gaetana Giovanna Pittalà, Rosaria Saletti, and Salvatore Foti. 2022. "The TriMet_DB: A Manually Curated Database of the Metabolic Proteins of Triticum aestivum" Nutrients 14, no. 24: 5377. https://doi.org/10.3390/nu14245377
APA StyleCunsolo, V., Di Francesco, A., Pittalà, M. G. G., Saletti, R., & Foti, S. (2022). The TriMet_DB: A Manually Curated Database of the Metabolic Proteins of Triticum aestivum. Nutrients, 14(24), 5377. https://doi.org/10.3390/nu14245377