
Assessment of Vitamin D Status in Slovenian Premenopausal and Postmenopausal Women, Using Total, Free, and Bioavailable 25-Hydroxyvitamin D (25(OH)D)

 , and
, and
Abstract
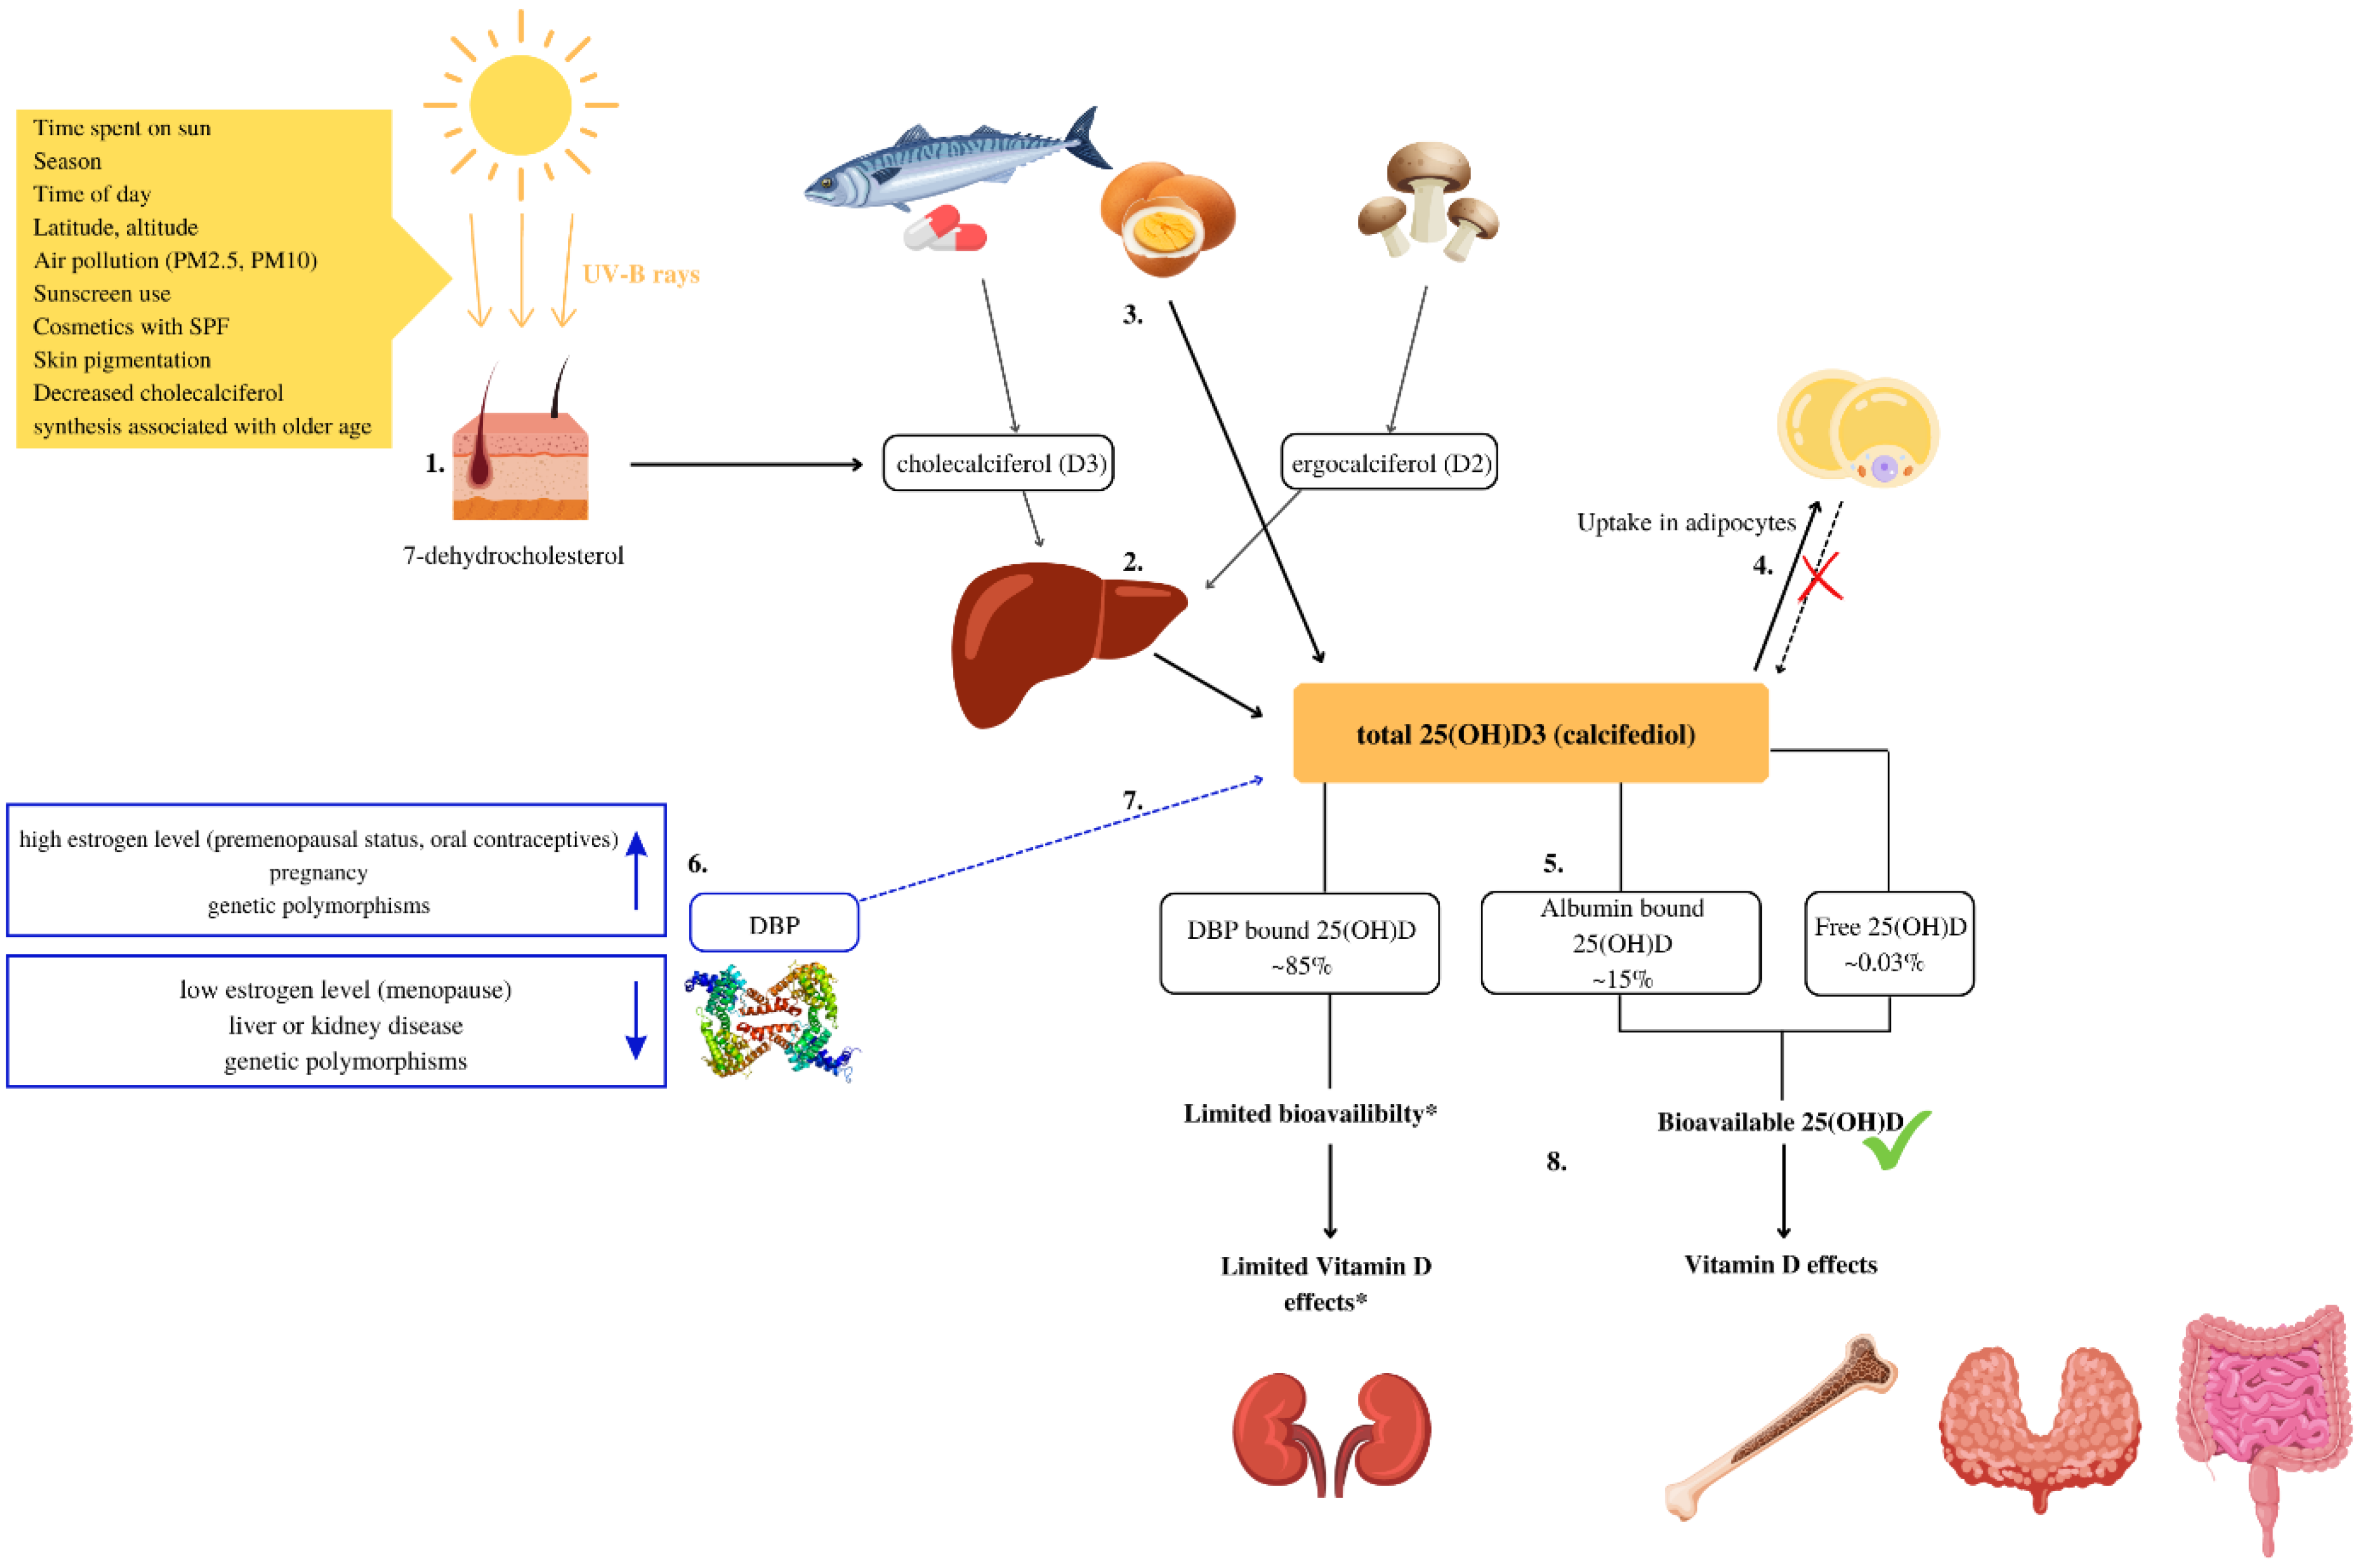
1. Introduction
2. Materials and Methods
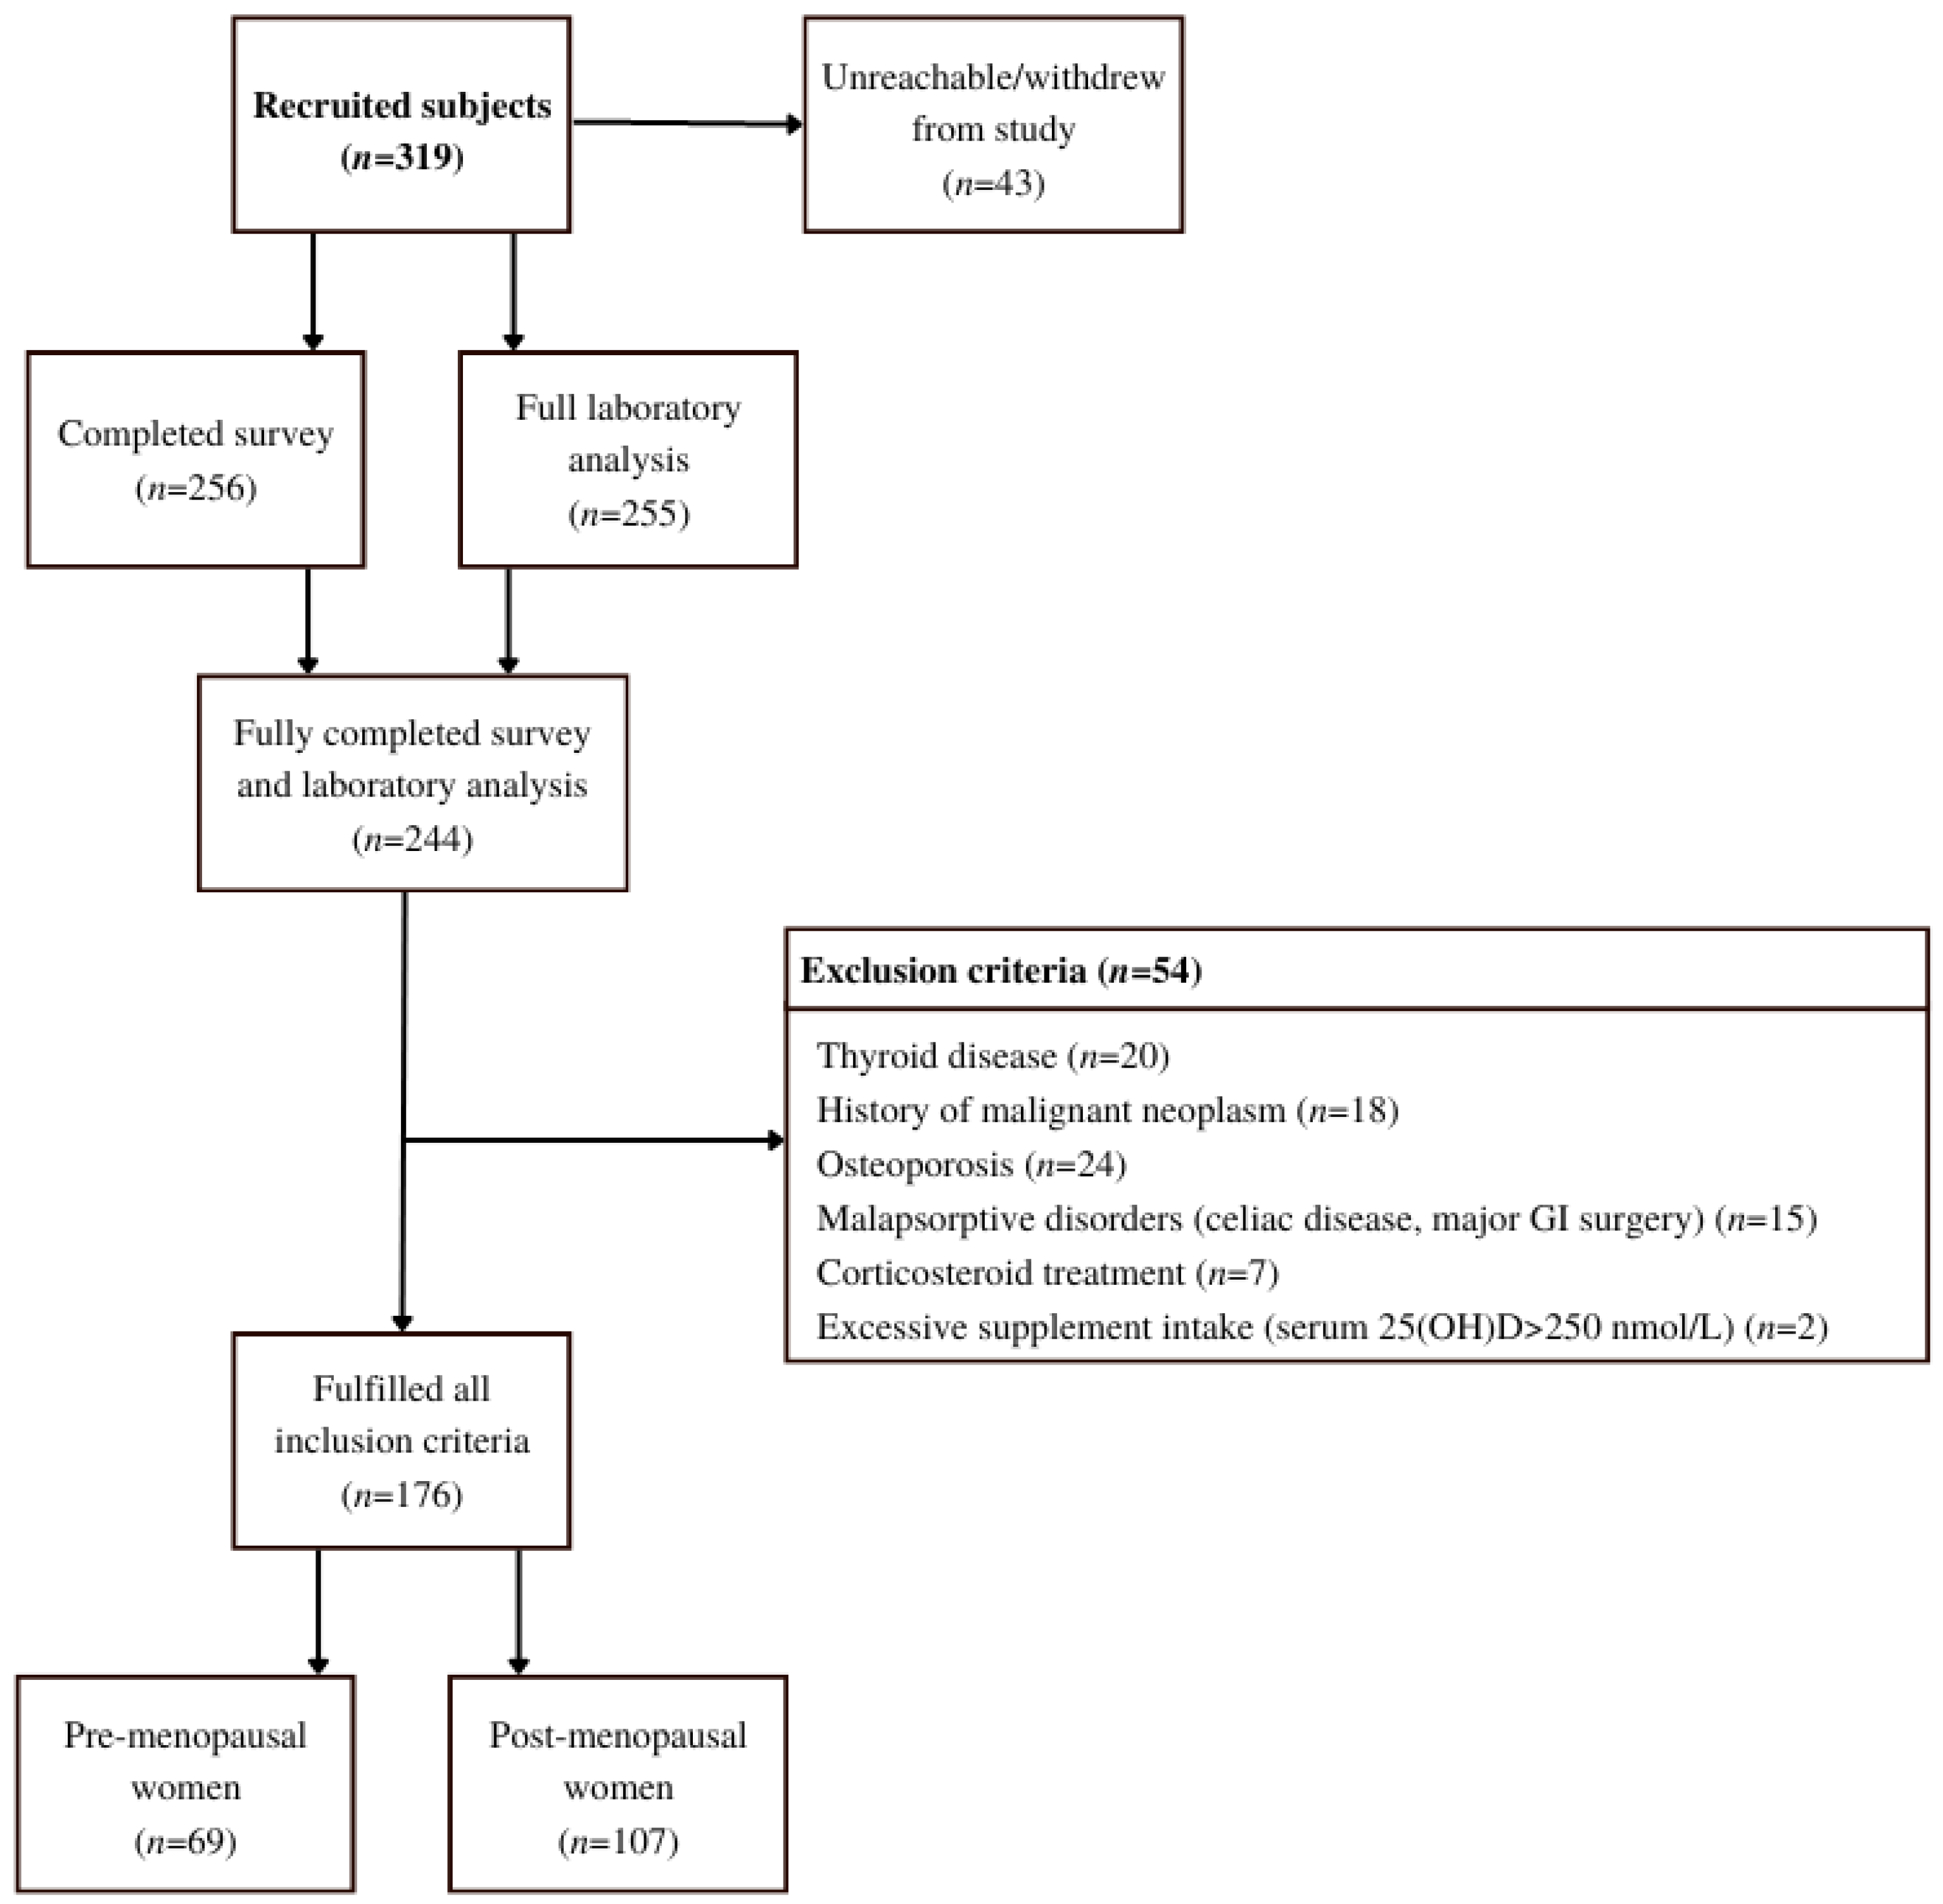
2.1. Study Design and Participants
2.2. Ethical Approval
2.3. Inclusion and Exclusion Criteria
2.4. Content Validity of a Questionnaire
2.5. Data Collection
2.6. Calculation of Bioavailable and Free 25(OH)D
KDBP affinity constant between 25(OH)D and DBP 7 × 10⁸ M − 1
[Alb] = concentration of albumin
[Total 25(OH)D] = concentration of total 25(OH)D
[DBP] = concentration of DBP
[DAlb] = Albumin-bound 25(OH)D
2.7. Statistical Analysis
3. Results
3.1. Descriptive Statistics
3.2. Comparison of Premenopausal and Postmenopausal Women
3.3. Correlations of Total, Free, and Bioavailable 25(OH)D
3.4. Predictors of Vitamin D Status
4. Discussion
4.1. Study Strengths and Limitations
4.2. Practical Considerations and Future Research
5. Conclusions
Supplementary Materials
Author Contributions
Funding
Institutional Review Board Statement
Informed Consent Statement
Data Availability Statement
Acknowledgments
Conflicts of Interest
Abbreviations
| BMI | body mass index |
| UV | ultraviolet |
| D3 | cholecalciferol |
| D2 | ergocalciferol |
| Total 25(OH)D | 25-Hydroxycholecalciferol, calcifediol, calcidiol, 25-Hydroxyvitamin D3 |
| 1,25(OH)D | 1,25-dihydroxycholecalciferol |
| DBP | vitamin D binding protein |
| SARS-CoV-2 | severe acute respiratory syndrome coronavirus 2 |
| FFQ | food frequency questionnaire |
| HIS | health interview survey |
| HES | clinical health examination survey |
| ICF | informed consent form |
| MNutr | Master of Nutrition |
| OR | Odds ratio |
| RN | registered nurse |
| CVI | Content Validity Index |
| S-CVI/Ave | scale-level content validity index based on the average method |
| S-CVI/UA | scale-level content validity index based on the universal agreement method |
References
- Holick, M.F. Vitamin D Deficiency. N. Engl. J. Med. 2007, 357, 266–281. [Google Scholar] [CrossRef]
- Taylor, C.L.; Patterson, K.Y.; Roseland, J.M.; Wise, S.A.; Merkel, J.M.; Pehrsson, P.R.; Yetley, E.A. Including Food 25-Hydroxyvitamin D in Intake Estimates May Reduce the Discrepancy between Dietary and Serum Measures of Vitamin D Status. J. Nutr. 2014, 144, 654–659. [Google Scholar] [CrossRef]
- Jakobsen, J.; Melse-Boonstra, A.; Rychlik, M. Challenges to Quantify Total Vitamin Activity: How to Combine the Contribution of Diverse Vitamers? Curr. Dev. Nutr. 2019, 3, nzz086. [Google Scholar] [CrossRef]
- Vranić, L.; Mikolašević, I.; Milić, S. Vitamin D Deficiency: Consequence or Cause of Obesity? Medicina 2019, 55, 541. [Google Scholar] [CrossRef]
- Bikle, D.D.; Malmstroem, S.; Schwartz, J. Current Controversies: Are Free Vitamin Metabolite Levels a More Accurate Assessment of Vitamin D Status than Total Levels? Endocrinol. Metab. Clin. N. Am. 2017, 46, 901–918. [Google Scholar] [CrossRef]
- Tsuprykov, O.; Chen, X.; Hocher, C.-F.; Skoblo, R.; Yin, L.; Hocher, B. Why Should We Measure Free 25(OH) Vitamin D? J. Steroid Biochem. Mol. Biol. 2018, 180, 87–104. [Google Scholar] [CrossRef]
- Karras, S.N.; Koufakis, T.; Fakhoury, H.; Kotsa, K. Deconvoluting the Biological Roles of Vitamin D-Binding Protein During Pregnancy: A Both Clinical and Theoretical Challenge. Front. Endocrinol. 2018, 9, 259. [Google Scholar] [CrossRef]
- Smith, J.E.; Goodman, D.S. The Turnover and Transport of Vitamin D and of a Polar Metabolite with the Properties of 25-Hydroxycholecalciferol in Human Plasma. J. Clin. Investig. 1971, 50, 2159–2167. [Google Scholar] [CrossRef]
- Bikle, D.D.; Schwartz, J. Vitamin D Binding Protein, Total and Free Vitamin D Levels in Different Physiological and Pathophysiological Conditions. Front. Endocrinol. 2019, 10, 317. [Google Scholar] [CrossRef]
- Hribar, M.; Hristov, H.; Gregorič, M.; Blaznik, U.; Zaletel, K.; Oblak, A.; Osredkar, J.; Kušar, A.; Žmitek, K.; Rogelj, I.; et al. Nutrihealth Study: Seasonal Variation in Vitamin D Status Among the Slovenian Adult and Elderly Population. Nutrients 2020, 12, 1838. [Google Scholar] [CrossRef]
- Lerchbaum, E. Vitamin D and Menopause—A Narrative Review. Maturitas 2014, 79, 3–7. [Google Scholar] [CrossRef]
- Kuchuk, N.O.; van Schoor, N.M.; Pluijm, S.M.; Chines, A.; Lips, P. Vitamin D Status, Parathyroid Function, Bone Turnover, and BMD in Postmenopausal Women with Osteoporosis: Global Perspective. J. Bone Miner. Res. 2009, 24, 693–701. [Google Scholar] [CrossRef]
- Chalcraft, J.R.; Cardinal, L.M.; Wechsler, P.J.; Hollis, B.W.; Gerow, K.G.; Alexander, B.M.; Keith, J.F.; Larson-Meyer, D.E. Vitamin D Synthesis Following a Single Bout of Sun Exposure in Older and Younger Men and Women. Nutrients 2020, 12, 2237. [Google Scholar] [CrossRef]
- Cheema, C.; Grant, B.F.; Marcus, R. Effects of Estrogen on Circulating “Free” and Total 1,25-Dihydroxyvitamin D and on the Parathyroid-Vitamin D Axis in Postmenopausal Women. J. Clin. Investig. 1989, 83, 537–542. [Google Scholar] [CrossRef]
- Harmon, Q.E.; Umbach, D.M.; Baird, D.D. Use of Estrogen-Containing Contraception Is Associated With Increased Concentrations of 25-Hydroxy Vitamin D. J. Clin. Endocrinol. Metab. 2016, 101, 3370–3377. [Google Scholar] [CrossRef]
- Moller, U.K.; Streym, S.; Jensen, L.T.; Mosekilde, L.; Schoenmakers, I.; Nigdikar, S.; Rejnmark, L. Increased Plasma Concentrations of Vitamin D Metabolites and Vitamin D Binding Protein in Women Using Hormonal Contraceptives: A Cross-Sectional Study. Nutrients 2013, 5, 3470–3480. [Google Scholar] [CrossRef]
- Pop, L.C.; Shapses, S.A.; Chang, B.; Sun, W.; Wang, X. Vitamin D-Binding Protein In Healthy Pre- And Postmenopausal Women: Relationship With Estradiol Concentrations. Endocr. Pract. 2015, 21, 936–942. [Google Scholar] [CrossRef]
- Mendel, C.M. The Free Hormone Hypothesis: A Physiologically Based Mathematical Model. Endocr. Rev. 1989, 10, 232–274. [Google Scholar] [CrossRef]
- Abidin, N.Z.; Mitra, S.R. Total vs. Bioavailable: Determining a Better 25(OH)D Index in Association with Bone Density and Muscle Mass in Postmenopausal Women. Metabolites 2020, 11, 23. [Google Scholar] [CrossRef]
- Tolonen, H.; Koponen, P.; Al-Kerwi, A.; Capkova, N.; Giampaoli, S.; Mindell, J.; Paalanen, L.; Ruiz-Castell, M.; Trichopoulou, A.; Kuulasmaa, K.; et al. European Health Examination Surveys—A Tool for Collecting Objective Information about the Health of the Population. Arch. Public Health 2018, 76, 38. [Google Scholar] [CrossRef]
- Goodman, L.A. Snowball Sampling. Ann. Math. Statist. 1961, 32, 148–170. [Google Scholar] [CrossRef]
- WHO. Research on the Menopause in the 1990s. Report of a WHO Scientific Group. World Health Organ. Tech. Rep. Ser. 1996, 866, 1–107. [Google Scholar]
- Brot, C.; Vestergaard, P.; Kolthoff, N.; Gram, J.; Hermann, A.P.; Sørensen, O.H. Vitamin D Status and Its Adequacy in Healthy Danish Perimenopausal Women: Relationships to Dietary Intake, Sun Exposure and Serum Parathyroid Hormone. Br. J. Nutr. 2001, 86, S97–S103. [Google Scholar] [CrossRef]
- Jeretina, B. Dejavniki Vpliva Na Pojav Prezgodnje Menopavze: Magistrsko Delo; Zdravstvena Fakulteta v Ljubljani: Ljubljana, Slovenia, 2019. [Google Scholar]
- Yusoff, M.S.B. ABC of Content Validation and Content Validity Index Calculation. Educ. Med. J. 2019, 11, 49–54. [Google Scholar] [CrossRef]
- Vermeulen, A.; Verdonck, L.; Kaufman, J.M. A Critical Evaluation of Simple Methods for the Estimation of Free Testosterone in Serum. J. Clin. Endocrinol. Metab. 1999, 84, 3666–3672. [Google Scholar] [CrossRef]
- Holick, M.F.; Binkley, N.C.; Bischoff-Ferrari, H.A.; Gordon, C.M.; Hanley, D.A.; Heaney, R.P.; Murad, M.H.; Weaver, C.M. Guidelines for Preventing and Treating Vitamin D Deficiency and Insufficiency Revisited. J. Clin. Endocrinol. Metab. 2012, 97, 1153–1158. [Google Scholar] [CrossRef]
- Vieth, R.; Holick, M.F. Chapter 57B—The IOM—Endocrine Society Controversy on Recommended Vitamin D Targets: In Support of the Endocrine Society Position. In Vitamin D, 4th ed.; Feldman, D., Ed.; Academic Press: Cambridge, MA, USA, 2018; pp. 1091–1107. ISBN 978-0-12-809965-0. [Google Scholar]
- Mukaka, M.M. Statistics Corner: A Guide to Appropriate Use of Correlation Coefficient in Medical Research. Malawi Med. J. 2012, 24, 69–71. [Google Scholar]
- Szumilas, M. Explaining Odds Ratios. J. Can. Acad. Child Adolesc. Psychiatry 2010, 19, 227–229. [Google Scholar]
- Powe, C.E.; Ricciardi, C.; Berg, A.H.; Erdenesanaa, D.; Collerone, G.; Ankers, E.; Wenger, J.; Karumanchi, S.A.; Thadhani, R.; Bhan, I. Vitamin D-Binding Protein Modifies the Vitamin D-Bone Mineral Density Relationship. J. Bone Miner. Res. 2011, 26, 1609–1616. [Google Scholar] [CrossRef]
- Aloia, J.; Mikhail, M.; Dhaliwal, R.; Shieh, A.; Usera, G.; Stolberg, A.; Ragolia, L.; Islam, S. Free 25(OH)D and the Vitamin D Paradox in African Americans. J. Clin. Endocrinol. Metab. 2015, 100, 3356–3363. [Google Scholar] [CrossRef]
- Zeng, S.; Chu, C.; Doebis, C.; von Baehr, V.; Hocher, B. Reference Values for Free 25-Hydroxy-Vitamin D Based on Established Total 25-Hydroxy-Vitamin D Reference Values. J. Steroid Biochem. Mol. Biol. 2021, 210, 105877. [Google Scholar] [CrossRef]
- Schwartz, J.B.; Lai, J.; Lizaola, B.; Kane, L.; Markova, S.; Weyland, P.; Terrault, N.A.; Stotland, N.; Bikle, D. A Comparison of Measured and Calculated Free 25(OH) Vitamin D Levels in Clinical Populations. J. Clin. Endocrinol. Metab. 2014, 99, 1631–1637. [Google Scholar] [CrossRef]
- Tsuprykov, O.; Buse, C.; Skoblo, R.; Haq, A.; Hocher, B. Reference Intervals for Measured and Calculated Free 25-Hydroxyvitamin D in Normal Pregnancy. J. Steroid Biochem. Mol. Biol. 2018, 181, 80–87. [Google Scholar] [CrossRef]
- Liu, X.; Baylin, A.; Levy, P.D. Vitamin D Deficiency and Insufficiency among US Adults: Prevalence, Predictors and Clinical Implications. Br. J. Nutr. 2018, 119, 928–936. [Google Scholar] [CrossRef]
- Bani-Issa, W.; Eldeirawi, K.; Harfil, S.; Fakhry, R. Vitamin D Deficiency and Its Determinants in Adults: A Sample from Community-Based Settings in the United Arab Emirates. Int. J. Endocrinol. 2017, 2017, 3906306. [Google Scholar] [CrossRef]
- Tønnesen, R.; Hovind, P.H.; Jensen, L.T.; Schwarz, P. Determinants of Vitamin D Status in Young Adults: Influence of Lifestyle, Sociodemographic and Anthropometric Factors. BMC Public Health 2016, 16, 385. [Google Scholar] [CrossRef]
- Thuesen, B.; Husemoen, L.; Fenger, M.; Jakobsen, J.; Schwarz, P.; Toft, U.; Ovesen, L.; Jørgensen, T.; Linneberg, A. Determinants of Vitamin D Status in a General Population of Danish Adults. Bone 2012, 50, 605–610. [Google Scholar] [CrossRef]
- ten Haaf, D.S.M.; Balvers, M.G.J.; Timmers, S.; Eijsvogels, T.M.H.; Hopman, M.T.E.; Klein Gunnewiek, J.M.T. Determinants of Vitamin D Status in Physically Active Elderly in the Netherlands. Eur. J. Nutr. 2019, 58, 3121–3128. [Google Scholar] [CrossRef]
- Socioekonomske Značilnosti Prebivalstva, Slovenija, 1 January 2020. Available online: https://www.stat.si/StatWeb/News/Index/9263 (accessed on 28 July 2021).


| Variable | Category/ Unit | Total n = 176 | Premenopausal n = 69 | Postmenopausal n = 107 | 𝑝-Value |
|---|---|---|---|---|---|
| Age | years | 53.8 ± 5.0 | 49.8 ± 3.3 | 56.45 ± 4.1 | <0.001 |
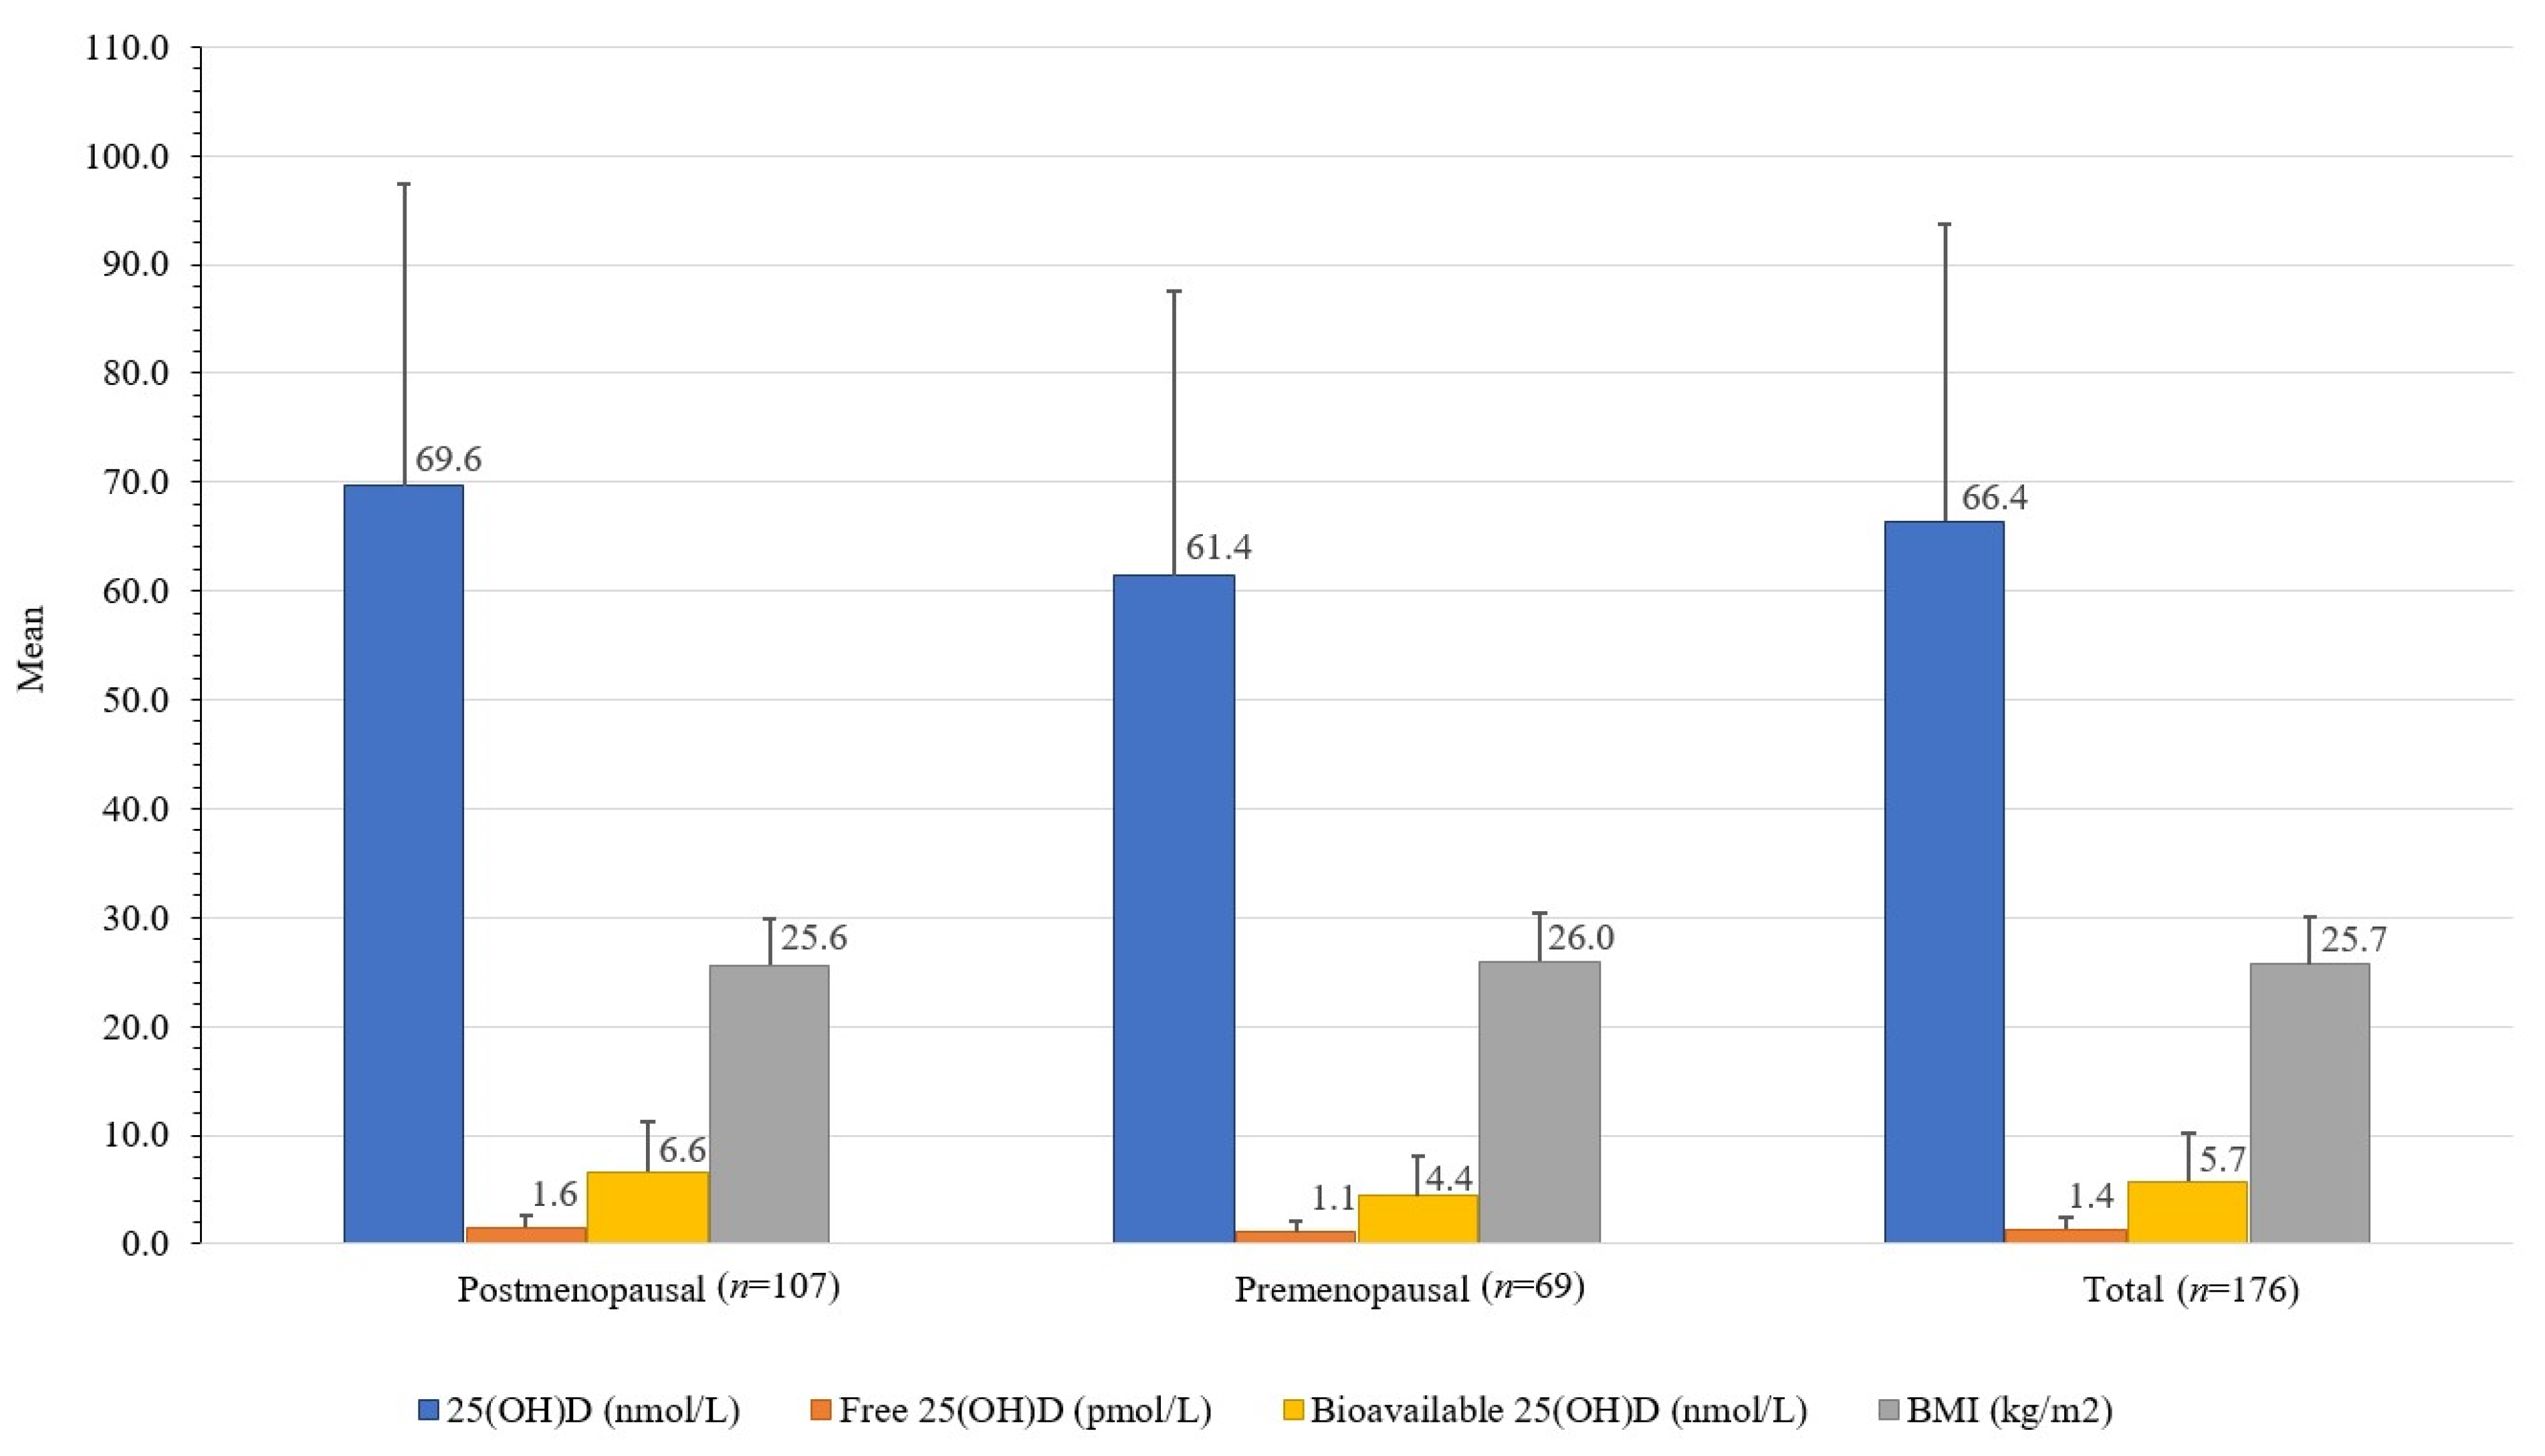
| BMI | kg/m2 | 25.7 ± 4.4 | 26.0 ± 4.4 | 25.6 ± 4.3 | 0.574 |
| 18.5–24.9 | 51.7% | 50.7% | 52.3% | ||
| 25.0–29.9 | 32.4% | 34.8% | 30.8% | ||
| 30.0–34.9 | 10.8% | 8.7% | 12.2% | ||
| 35.0–39.9 | 4.6% | 5.8% | 3.7% | ||
| >40.0 | 0.57% | 0.93% | |||
| Lifestyle Factors | |||||
| Smoking status | Current smoker | 13.0% | 17.4% | 10.3% | 0.092 |
| Former smoker | 24.4% | 17.4% | 29.0% | ||
| Non-smoker | 62.5% | 65.2% | 61.0% | ||
| Education level | Primary and high school | 32.4% | 24.6% | 37.4% | 0.015 |
| Higher education | 67.6% | 75.4% | 62.6% | ||
| Time spent in the sun | min | 53.3 ± 17.7 | 52.9 ± 15.0 | 53.6 ± 19.3 | 0.650 |
| Moderate physical activity | h/week | 3.2 ± 4.2 | 3.7 ± 5.3 | 2.8 ± 3.6 | 0.197 |
| >150 min/week | 86.9% | 82.6% | 89.7% | ||
| <150 min/week | 13.2% | 17.4% | 10.3% | ||
| Sunscreen use | Yes | 90.9% | 85.5% | 94.4% | 0.184 |
| No | 9.1% | 14.5% | 5.6% | ||
| Sun tanning habits | High sun exposure | 6.8% | 10.1% | 4.7% | 0.161 |
| Medium sun exposure | 64.2% | 56.5% | 69.2% | ||
| Low sun exposure | 29.0% | 33.3% | 26.2% | ||
| Laboratory Analysis | |||||
| Total 25(OH)D | nmol/L | 66.4 ± 27.4 | 61.4 ± 26.1 | 69.6 ± 27.8 | 0.052 |
| <30 | 8.5% | 11.6% | 6.5% | ||
| 30–50 | 15.9% | 17.4% | 15.0% | ||
| 50–75 | 43.2% | 47.8% | 40.2% | ||
| >75 | 32.3% | 23.2% | 38.3% | ||
| DBP | mg/L | 576 ± 436 | 680 ± 486 | 509 ± 387 | 0.010 |
| Albumin | g/L | 47.1 ± 2.2 | 46.9 ± 2.3 | 47.3 ± 2.2 | 0.245 |
| Free 25(OH)D | pmol/L | 1.37 ± 1.06 | 1.11 ± 0.90 | 1.56 ± 1.11 | 0.005 |
| Bioavailable 25(OH)D | nmol/L | 5.7 ± 4.5 | 4.4 ± 3.8 | 6.6 ± 4.7 | 0.002 |
| Estradiol | nmol/L | 0.22 ± 0.48 | 0.41 ± 0.64 | 0.11 ± 0.30 | <0.001 |
| Vitamin D Intake and Supplementation | |||||
| Food intake | µg/day | 2.2 ± 1.3 | 2.3 ± 1.5 | 2.1 ± 1.3 | 0.227 |
| Supplement use (≥5 µg vitamin D/day) | 61.4% | 53.6% | 66.4% | 0.069 | |
| Supplemental intake | µg/day | 21.7 ± 26.2 | 20.1 ± 28.2 | 22.8 ± 25.0 | 0.499 |
| Intake of all sources | µg/day | 24.1 ± 26.2 | 22.4 ± 28.1 | 25.1 ± 25.0 | 0.500 |
| Total 25(OH)D | Bioavailable 25(OH)D | Free 25(OH)D | Estradiol | DBP | Albumin | |
|---|---|---|---|---|---|---|
| Total 25(OH)D | 1 | 0.44 ** | 0.42 ** | −0.14 | 0.06 | 0.12 |
| Bioavailable 25(OH)D | 0.44 ** | 1 | 0.97 ** | −0.13 | −0.61 ** | 0.08 |
| Free 25(OH)D | 0.42 ** | 0.97 ** | 1 | −0.13 | −0.63 ** | 0.03 |
| Estradiol | −0.14 | −0.13 | −0.13 | 1 | 0.11 | −0.19 * |
| DBP | 0.06 | −0.61 ** | −0.63 ** | 0.11 | 1 | 0.14 |
| Albumin | 0.12 | 0.08 | 0.03 | −0.19 * | 0.14 | 1 |
| 25(OH)D (nmol/L) | |
|---|---|
| Supplemental vitamin D intake (µg/day) | 0.56 * |
| Food vitamin D intake (µg/day) | 0.13 |
| Time spent in the sun (min) | 0.23 * |
| BMI | −0.10 |
| Moderate physical activity h/week | 0.06 |
Publisher’s Note: MDPI stays neutral with regard to jurisdictional claims in published maps and institutional affiliations. |
© 2022 by the authors. Licensee MDPI, Basel, Switzerland. This article is an open access article distributed under the terms and conditions of the Creative Commons Attribution (CC BY) license (https://creativecommons.org/licenses/by/4.0/).
Share and Cite
Vičič, V.; Kukec, A.; Kugler, S.; Geršak, K.; Osredkar, J.; Pandel Mikuš, R. Assessment of Vitamin D Status in Slovenian Premenopausal and Postmenopausal Women, Using Total, Free, and Bioavailable 25-Hydroxyvitamin D (25(OH)D). Nutrients 2022, 14, 5349. https://doi.org/10.3390/nu14245349
Vičič V, Kukec A, Kugler S, Geršak K, Osredkar J, Pandel Mikuš R. Assessment of Vitamin D Status in Slovenian Premenopausal and Postmenopausal Women, Using Total, Free, and Bioavailable 25-Hydroxyvitamin D (25(OH)D). Nutrients. 2022; 14(24):5349. https://doi.org/10.3390/nu14245349
Chicago/Turabian StyleVičič, Vid, Andreja Kukec, Saša Kugler, Ksenija Geršak, Joško Osredkar, and Ruža Pandel Mikuš. 2022. "Assessment of Vitamin D Status in Slovenian Premenopausal and Postmenopausal Women, Using Total, Free, and Bioavailable 25-Hydroxyvitamin D (25(OH)D)" Nutrients 14, no. 24: 5349. https://doi.org/10.3390/nu14245349
APA StyleVičič, V., Kukec, A., Kugler, S., Geršak, K., Osredkar, J., & Pandel Mikuš, R. (2022). Assessment of Vitamin D Status in Slovenian Premenopausal and Postmenopausal Women, Using Total, Free, and Bioavailable 25-Hydroxyvitamin D (25(OH)D). Nutrients, 14(24), 5349. https://doi.org/10.3390/nu14245349