Article

Research Trends in Advanced Glycation End Products and Obesity: Bibliometric Analysis

by
Patricia Budihartanti Liman
1,2,3,*,
Karina Shasri Anastasya
1,
Nabila Maudy Salma
4,
Yenny Yenny
5 and
Meutia Atika Faradilla
6
1
Department of Nutrition, Faculty of Medicine, Universitas Trisakti, Jakarta 11440, Indonesia
2
Nutrition Study Center, Faculty of Medicine, Universitas Trisakti, Jakarta 11440, Indonesia
3
Ciputra Hospital Tangerang, Tangerang 15710, Indonesia
4
Department of Anatomy, Faculty of Medicine, Universitas Trisakti, Jakarta 11440, Indonesia
5
Department of Pharmacology and Medical Pharmacy, Faculty of Medicine, Universitas Trisakti, Jakarta 11440, Indonesia
6
Department of Biochemistry, Faculty of Medicine, Universitas Trisakti, Jakarta 11440, Indonesia
*
Author to whom correspondence should be addressed.
Nutrients 2022, 14(24), 5255; https://doi.org/10.3390/nu14245255
Submission received: 3 November 2022 / Revised: 2 December 2022 / Accepted: 3 December 2022 / Published: 9 December 2022
(This article belongs to the Section Carbohydrates)

Abstract

:
The aim of this study was to conduct a bibliometric analysis of the scientific articles on advanced glycation end products (AGEs) and obesity. English-language journal articles about AGEs and obesity were retrieved from the Scopus database. The OpenRefine application was used for data cleaning, the VOSviewer software program for analysis of the trends of year of publication, country, institution, journal, authors, references, and keywords. Microsoft Excel and Tableau Public were applied for the visualizing of the publication trends. Data collection was performed on 3 February 2022, from a total of 1170 documents. The Mann–Whitney test and Spearman test with software SPSS ver.28.0.1.1. were used to assess the relation between open access journal statuses, years of publications, and CiteScore. The results of the study showed that there was an increase in studies on processed foods, including AGEs and obesity. The United States was the country with the largest contribution in this field, with the highest number of citations. The Nutrients journal published the largest number of articles on this topic, particularly in the last two years. The present focus of the studies is on ultra-processed foods. The open access journals have younger medians of the year of publication and higher medians for number of citations than do closed access journals (p < 0.001 and p < 0.05, respectively). A strong negative association was seen between CiteScore and the year of publication (r = −0.64 [95% CI: −0.67, −0.60]), p < 0.001. We present this bibliometric analysis to furnish the most recent data on the description, visualization, and analysis of AGEs and obesity.

1. Introduction

Obesity is a global problem that is still unsolved. This may also be seen in Indonesia from the yearly increases in the prevalence of obesity [1]. The shift in lifestyle as a result of globalization and modernization leads to an increase in sedentary activities and the consumption of unhealthy foods such as processed foods, and in overnutrition [2,3]. This lifestyle, in conjunction with smoking [4] and hyperglycaemia [5], is known to increase the level of advanced glycation end products (AGEs) in the body, which subsequently cause disease complications [6].
Publications about AGEs started to develop with the discovery of AGEs in the body in connection with diabetes [7]. The increase in publications became more noticeable after the breakthrough discovery of AGEs in foods [8] that are consumed daily [9,10,11,12,13]. There were also other discoveries, such as the effect of heating [14], pH [15], and the duration of food storage [16], all of which may be changed to reduce the level of AGEs in foods. In spite of this, in general the studies demonstrated that processed foods and high fat foods have higher AGE levels than unprocessed food. These studies, initially concerned only with the content of salt, sugar, fats, and fiber in foods [17], added to the knowledge of processed foods to include other active substances, namely AGEs [18]. The available studies show that foods that are high in AGEs have the greatest effect on the level of AGEs in the body, apart from cigarettes and endogenously formed AGEs [19,20]. The high AGE content in processed foods also brought about changes in the studies in this field. This is apparent from the fact that the keyword “food industry” occupies the fourth highest rank in publications on foods [21].
It is well known that study results, ideas, and discussions are shared by being published as scientific articles [22]. For the objective and subjective retrospective mapping of the trends in an abundance of publications possibly numbering in the thousands, bibliometric analysis is required. Bibliometric studies may become the foundations for overviewing the available study topics, searching for knowledge gaps, finding ideas for studies that have never been conducted previously or are still in small numbers, and for determining the position of the research contribution [23], such as performance analysis and subjective analysis. Scopus is one of the international commercial scientific publishers of global reputation, whose database is regarded as being reliable and comprehensive for use as a bibliographic database and even superior to other databases [22].
The publication of journal articles on AGEs in obesity was first recorded in the Scopus database at the end of the twentieth century [7], after which studies on AGEs and their complications increased annually with the various developments [24]. One study showed that AGEs have become the fifth highest-ranking topic in studies on diabetic kidney disease [25]. However, there are no systematic analytical studies on the publication trends of AGEs with obesity.
This study presents the publication trends on AGEs in obesity using bibliometric analysis by means of VOSviewer. The aim of this study was to obtain visual and quantitative information from the available scientific publications of AGE studies, namely for determining the publication trends of these studies in the Scopus database, for the mapping of publications on AGEs by researcher, affiliated institution, and country of publication, and for determining the degree of collaboration between researchers.

2. Materials and Methods

The methodology of this study may be divided into three phases, i.e., the identification of the sources and criteria for the data search, software selection and data extraction, and finally data analysis and interpretation (Figure 1).

2.1. Phase I—Identification of Data Sources and Search Criteria

The investigators tried to identify publications on AGEs in an objective manner: to analyze the distribution of scientific productions with regard to researchers, institution, or country, and to evaluate the structure and evolution of the field of AGE research. Our study used documents obtained from the Scopus database, which is a database of peer-reviewed journals that allows bibliometric studies in analysis and visualization, supporting the scope of journals on AGEs.
Data collection was conducted on 3 February 2022, using search terms associated with AGEs and obesity in the titles and keywords, in the following format: (TITLE-ABS-KEY (“advanced glycation end product*” OR “carboxymethyl-lysine” OR “glycosylation product” OR “*glycoxidation product” OR “processed food”) AND TITLE-ABS-KEY (“obesity”)) AND (LIMIT-TO (PUBSTAGE, “final”)) AND (LIMIT-TO (DOCTYPE, “ar”)) AND (LIMIT-TO (LANGUAGE, “English”)) AND (LIMIT-TO (SRCTYPE, “j”)). On the initial search, the researchers found 2134 documents.
The inclusion criteria were then confined to the final publications of articles in English-language journals and excluding review articles, book chapters, conference articles, books, notes, letters, errata, short surveys, and others. However, our study did not place limits on the year of publication. The final number of documents in this phase was 1170 documents.
Figure 1. Phases of methodology and analysis used in this study.
Nutrients 14 05255 g001

2.2. Phase 2—Software Selection and Data Extraction

The mined data from Scopus were exported as comma-separated values in Microsoft Excel Home and Student 2019 edition version 16.57. The information that was downloaded for each publication was data on authors, abstract, keywords, document titles, year, number of citations, bibliographic information, funding details, open access journal label, and references. The values of Source Normalized Impact per Paper (SNIP) were taken from the article of Bajjou M.S. [26]. The statistics of Q-ranking, SCImago Journal & Country Rank (SJR), and h-index were taken from the website https://www.scimagojr.com/journalrank.php (accessed on 29 March 2022). The VOSviewer software version 1.6.17, from Leiden University, Leiden, Netherlands, was used for bibliometric construction and graphics. In data cleaning, the spelling of words with the same meaning was uniformly formatted using the OpenRefine software version 3.5.2 and thesaurus text (thesaurus table). Non-relevant terms were manually removed. Visualization of figures, graphics, and tables was performed by means of Tableau Public version 2021.4.4. and Microsoft Excel. The Mann–Whitney test in SPSS software version 28.0.1.1 was used to analyze the relationship of the status of open access journals with year of publication and number of citations.

2.3. Phase 3—Data Analysis and Interpretation

Data were analyzed and interpreted objectively and subjectively, and subsequently underwent structured and documented evaluation. Performance analysis was performed objectively, i.e., by evaluating the trends for year of publication, country, journal, and greatest number of documents and citations. Scientific mapping was performed subjectively, namely by evaluating keywords, author networks, and scientific journal co-citation networks. We also analyzed the relation of open access journal status, including years of publications and CiteScore.

3. Results

3.1. Performance Analysis

3.1.1. Distribution of Publication by Year

There were 1170 publications of studies on AGEs in processed foods and obesity, in the form of articles in English-language journals from 1988 to 2022 in the Scopus database (Table S1). Figure 2 shows that there were yearly increases in the number of research publications. There was a considerably sharp increase in 2003 that triggered a surge in the number of publications in the following years.
The publication data in the graph for 2022 seem lower than 2021. This is because data are taken until 3 January 2022, so they do not reflect the publication data in one whole year. However, if it is simulated with the same publication rate per month, the estimated publication figure reaches 200 articles in 2022, or exceeds the number of publications in 2021.

3.1.2. Contributions by Country and Region

Bibliometric coupling analysis was used to evaluate the number of documents from the researchers’ country of origin. There were 112 countries that met the minimum criterion of one document. The distribution of the countries involved in the publications may be seen in Figure 3. The United States predominates in the number of publications on AGEs and obesity with 382 documents.
Table 1 shows the top 15 countries based on the number of documents in the field of AGEs and obesity using VOSviewer. Brazil, the UK, and Australia are the countries contributing the largest number of publications after the United States. Regarding the number of cited publications, the US also occupies the highest rank with 19,362 citations, while the UK and Italy occupy the second and third ranks with 4203 and 3988 citations, respectively. The developed countries that are equated with a high consumption of fast foods and processed foods dominate the number of documents in this field.
Table 2 shows the three topmost ranking countries per cluster based on the number of documents. In Cluster 2 (coded green), the three highest ranking countries from Asia among the fifteen countries with the highest number of documents are Japan, China, and India with 57, 53, and 37 documents, respectively. European countries are dominated by the UK (102) in Cluster 10. There are two other countries in Cluster 10, namely Oman and South Sudan. The UK has strong links with the US (4926), Brazil (2989), and Australia (1665). Oman and South Sudan collaborate with the UK and the US, having links of 80 and 78, respectively, which are the lowest collaboration levels if compared with the other countries in this field. Lontchi-Yimagou, E., from Cameroon in Cluster 5, published an article on AGE receptors as inflammatory biomarkers in the body that may be associated with insulin resistance and the complications of obesity. This publication contributes much to the knowledge of the probable inflammatory pathway, which may have increased the number of citations for this document. The collaboration of the authors from Cameroon with other authors from the United States, the Netherlands, Australia, and South Africa increase the number of links to 26, if compared with Oman (4) and South Sudan (4). This is also seen in Cluster 7, where Cyprus contributes one document on dietary quality, particularly in connection with ultra-processed foods, in subjects participating in the European I.Family Study. In the latter study, there are 17 authors involved in writing documents with authors from Cyprus with 12 affiliations and 9 countries with links to Cyprus (47 links), which is higher than for authors from Cameroon, with 4 authors (26 links). The difference in year of publication may have contributed to the difference in the number of citations for Cyprus (for 2021) in comparison with Cameroon (for 2013).

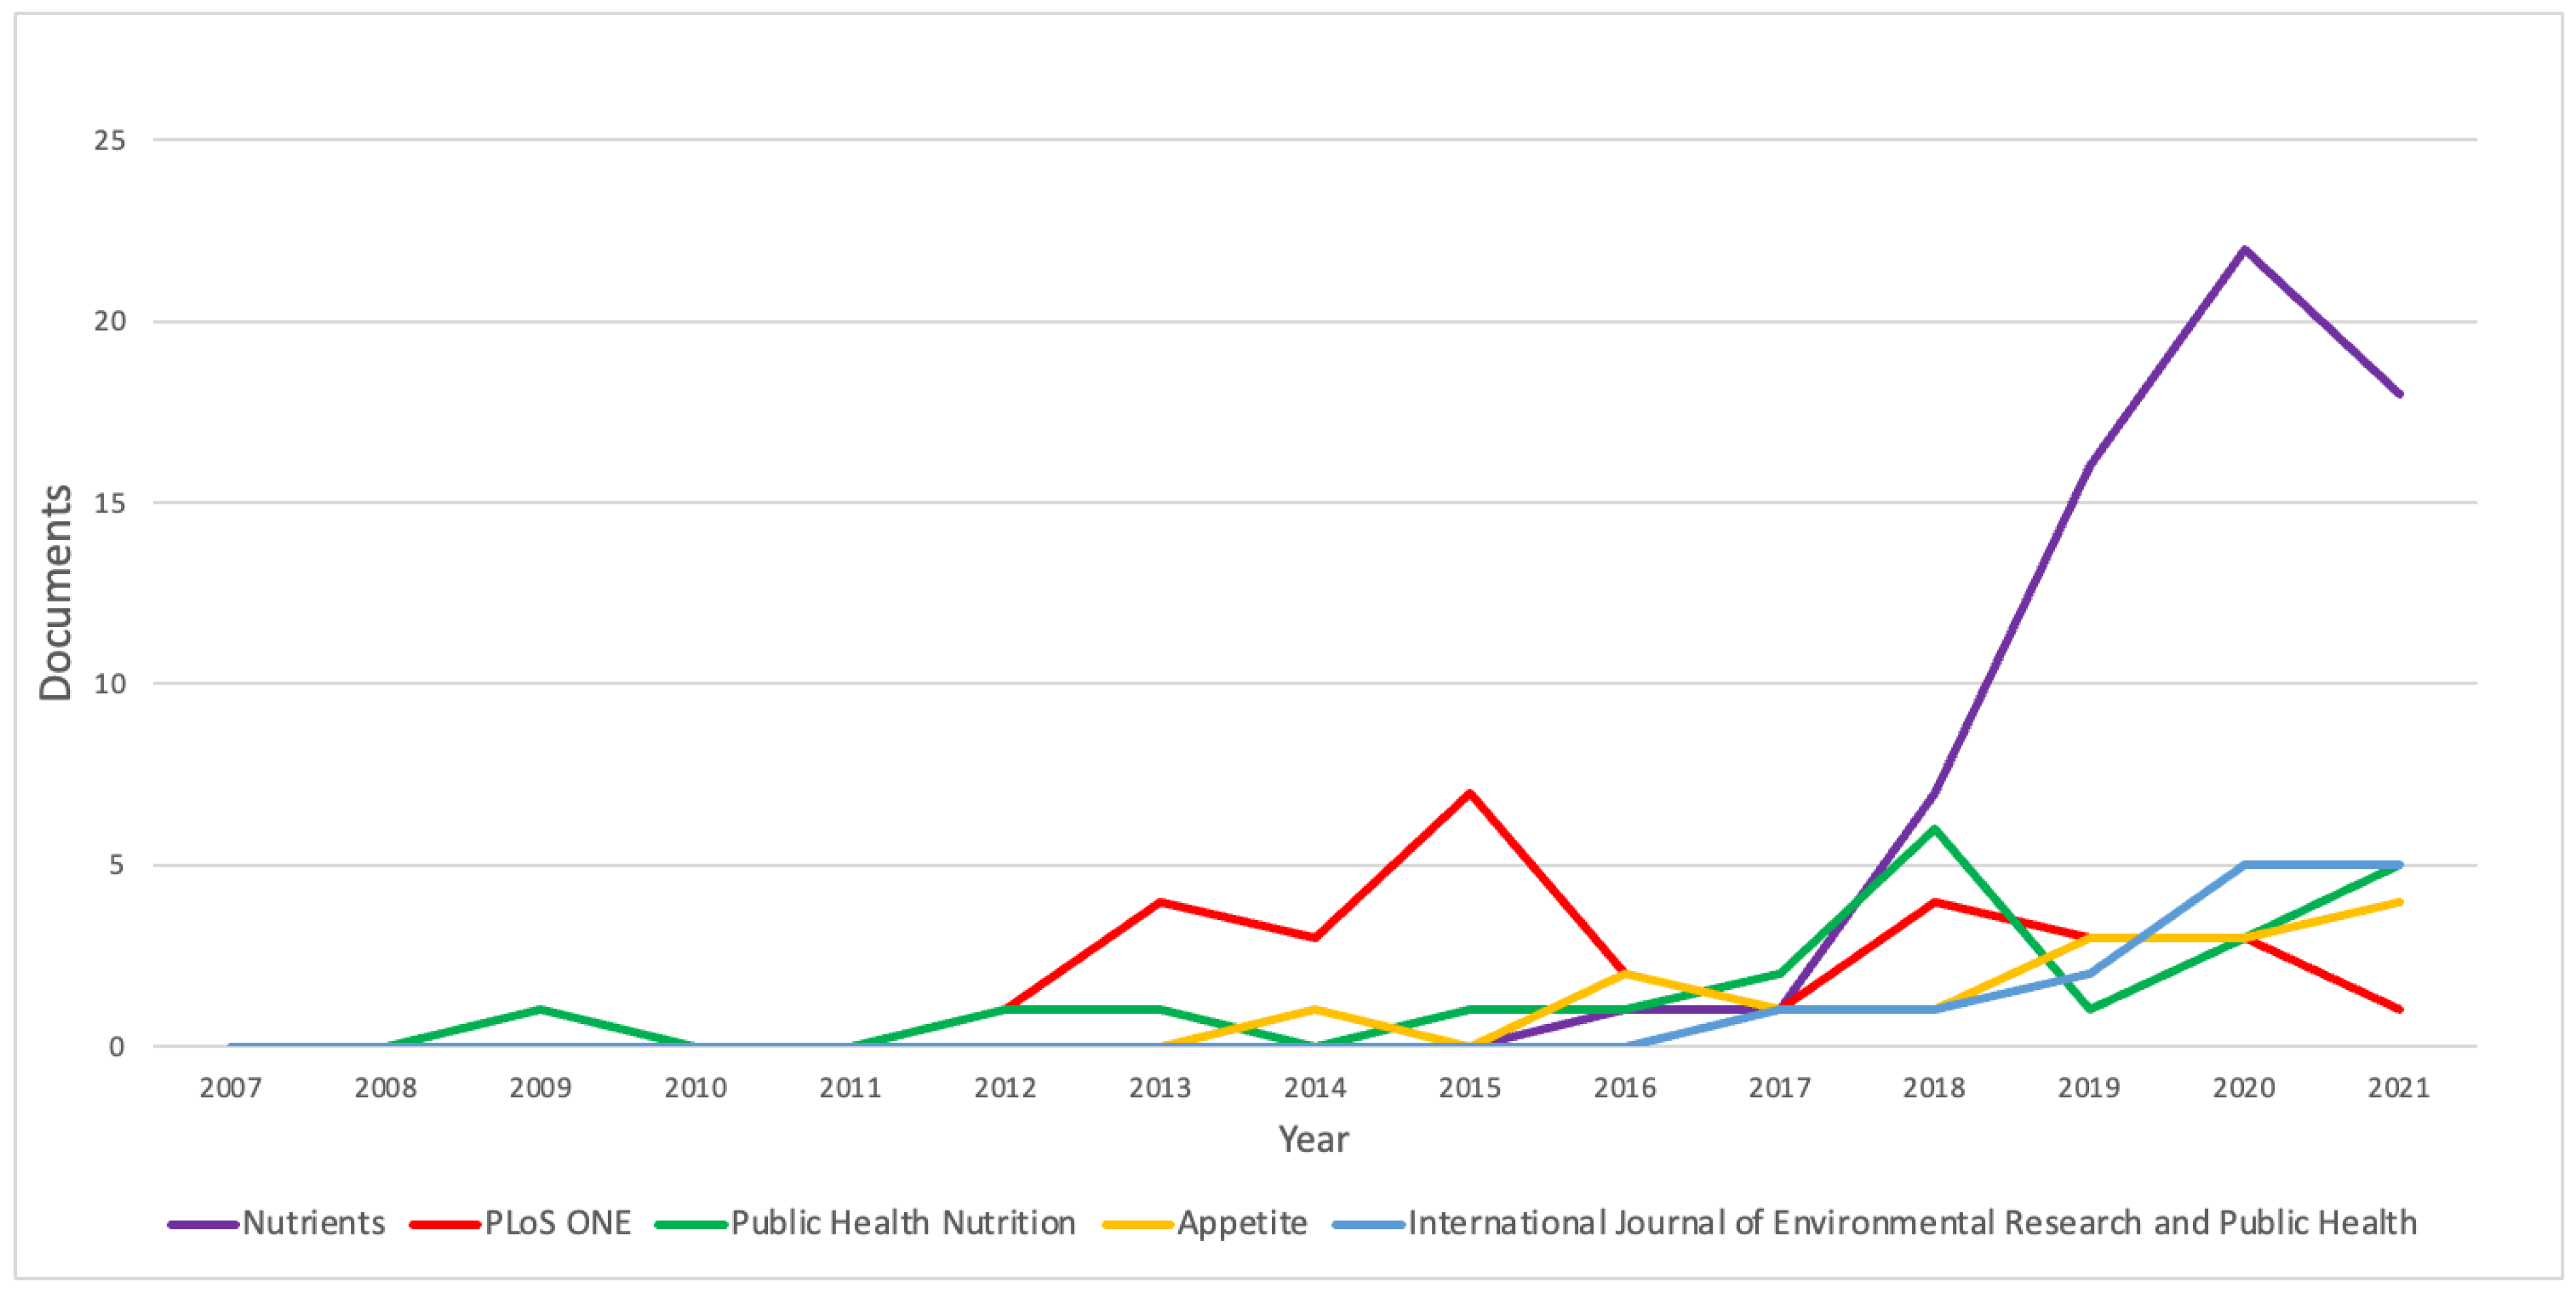
3.1.3. Analysis of Journals

Articles on AGEs in obesity have been published in 499 journals indexed in Scopus. Nutrients is the journal that accepts the greatest number of articles in this field, namely 65 articles (Figure 4). Other journals that are recorded as accepting large numbers of articles on AGEs up to January 2022 are PLoS ONE, Public Health Nutrition, Appetite, and International Journal of Environmental Research and Public Health, with 29, 22, 18, and 16 articles, respectively.
The VOSviewer analysis program was used to evaluate journals on the basis of the citations of their articles (Figure 5). There were 34 out of 599 sources of articles that met the minimum criterion of 5 documents and 30 sources of articles that had links with other sources of articles.
Open access journals may be defined as those containing documents that may be freely downloaded and read online without having subscriptions or filling their affiliations [27]. Our study shows that the majority or 60.9% (713/1170) of journals are open access. Table 3 shows that the median of the year of publication in open access journals is lower than in non-open access journals (p < 0.001); in other words, the articles are more recent. Our study shows that open access journals have higher medians for the number of citations than do non-open access journals (p < 0.05). The CiteScore has a negative association with the year of publication (r = −0.64 [95% CI: −0.67, −0.60], p <0.001).
Table 4, below, shows the top 15 journals based on the number of documents. The journal Nutrients contributed 5.6% of all documents on AGEs and obesity. The US is predominant in being the country with journal domains that publish the greatest number of articles on AGEs and obesity (seven journals), followed by the UK (five journals) and Europe (three journals).

3.1.4. Most Frequently Cited Documents

Table 5 showed the 15 most-cited documents, representing 27.6% of the total number of citations.

3.1.5. Collaboration between Authors

The collaboration between authors was evaluated using co-authorship by means of VOSviewer. There were 98 authors who were co-authors, among the 5954 authors having a minimum number of four documents. Figure 6 shows the 28 authors who collaborated with other authors in the writing of articles.
The collaboration of Cai, W., Vlassara, H., Uribarri, J., Striker, G.E., Chen, X., and Zhu, L. is most apparent as indicated by the proximity of the circles and the width of the lines connecting the circles. These authors have the same affiliation, namely Icahn School of Medicine at Mount Sinai, New York, NY, USA. Vlassara, H. and Cai, W. have the highest total link strengths of 19, followed by Uribarri, J. (18), Chen, X. (18), and Striker, G.E. (15). Chen, X. and Zhu, L. also collaborated with researchers outside their institution, as shown by the lines connecting the green and red clusters. The other authors in the red cluster collaborated more frequently with researchers in other clusters. This may be seen from the large number of lines connecting the red circles with circles of other colors, such as green, dark blue, light blue, and violet. Li, Y. is the topmost co-author (10 documents), followed by Uribarri, J. (9 documents), Schmidt, A.M. (8 documents), Popkin, B.M. (8 documents), and Vlassara, H. (7 documents). From the number of citations, there are five co-authors with the largest number of citations, namely Popkin, B.M. (2577), Vlassara, H. (844), Schmidt, A.M. (716), Uribarri, J. (628), and Cai, W. (520).

3.2. Analysis of Intellectual Structure

3.2.1. Analysis of Keywords

Bibliometric analysis was used to evaluate the correlation of the most frequent keywords used by the authors of scientific articles on associated topics. This may facilitate the search for concepts and topics in the concerned field. This analysis used the VOSviewer application that can build a multidimensional representation of various topics. There are 53 keywords that appear minimally 10 times out of a total of 2505 keywords on this topic. The keywords are grouped into four clusters with a total of 440 links and a total link strength of 1434.
Obesity is the most popular keyword used by authors on this topic, and is found in Cluster 3 with 310 co-occurrences and has links with 50 other words. The next most frequently used keywords in Cluster 3 are physical activity, childhood obesity, food addiction, and community health problems. The keyword AGEs is the second most-used by several researchers in connection with this topic and lies in the red-colored Cluster 1. The green-colored Cluster 2 contains 18 nodes that are dominated by ultra-processed foods, whereas the yellow-colored Cluster 4 is focused on cardiovascular disease. (Table 6).
Figure 7 shows that obesity is at the center of the keywords used by researchers and is closely associated with AGEs. The strength of the association between the keywords AGEs and obesity is shown by the thickness of the lines connecting the two circles (34 links). The use of AGEs as a keyword occurs together with the keywords oxidative stress (20 links), inflammation (15 links), insulin resistance (10 links), and type 2 diabetes mellitus (18 links). The topic of obesity is also frequently associated with ultra-processed foods (29 links). The circles of obesity and AGEs are seen to be closer to each other than to ultra-processed foods. The proximity of AGEs and AGE receptors is shown by the shorter distance between their circles (14 links). The topic of obesity is close to diet (34 links), which is associated with nutrition transition (12 links), quality (12 links), and dietary pattern, such as processed foods (19 links), ultra-processed foods (31 links), and fast foods (12 links).

3.2.2. Co-Citation Networks of Cited Authors

There were 94,188 authors who became references in minimally two studies on AGEs and obesity, obtained through bibliographic analysis using VOSviewer, among whom 802 authors had 20 minimal citations. Table 7 below shows 15 of the most cited authors.
Monteiro, C.A. occupies the highest rank, with 746 citations, 111 links with other authors, and link strength of 54,339. This is followed by Popkin, B.M., with 517 citations, 182 links with other authors, and link strength of 34,295, while the third in line is Vlassara, H. with 495 citations, 192 links with other authors, and link strength of 58,763. Next come Schmidt, A.M., Cannon, G., Levy, R.B., Cai, W., Yamagishi, S., Moubarac, J.C., Uribarri, J., Thornalley, P.J., Takeuchi, M., Hu, F.B., Claro, R.M., and Brownlee, M., respectively.
In Figure 8, the author co-citation map shows three clusters with a total of 144,439 links, and total link strength of 1,088,462. The first cluster consists of 289 authors, 14,623 citations, 89,267 links, and total link strength of 857,028. Monteiro, C.A. occupies the highest rank with 746 citations, 111 links with other authors, and link strength of 54,339, followed by Popkin, B.M., Cannon, G., and Levy, R.B. The second cluster consists of 268 authors, where the most prominent author is Schmidt, A.M. with 439 citations, 608 links, and total link strength of 29,721. Other authors with the highest number of co-citations in Cluster 2 are Vlassara, H., Cai, W., Yamagishi, S., and Uribarri, J. Cluster 3 consists of 55 authors, with Wang, Y. being the most prominent author in this cluster, having 193 citations, links to 192 other authors, with link strength of 8798. The next most prominent authors are Brownlee, M., Li, Y., and Zhang, Y.

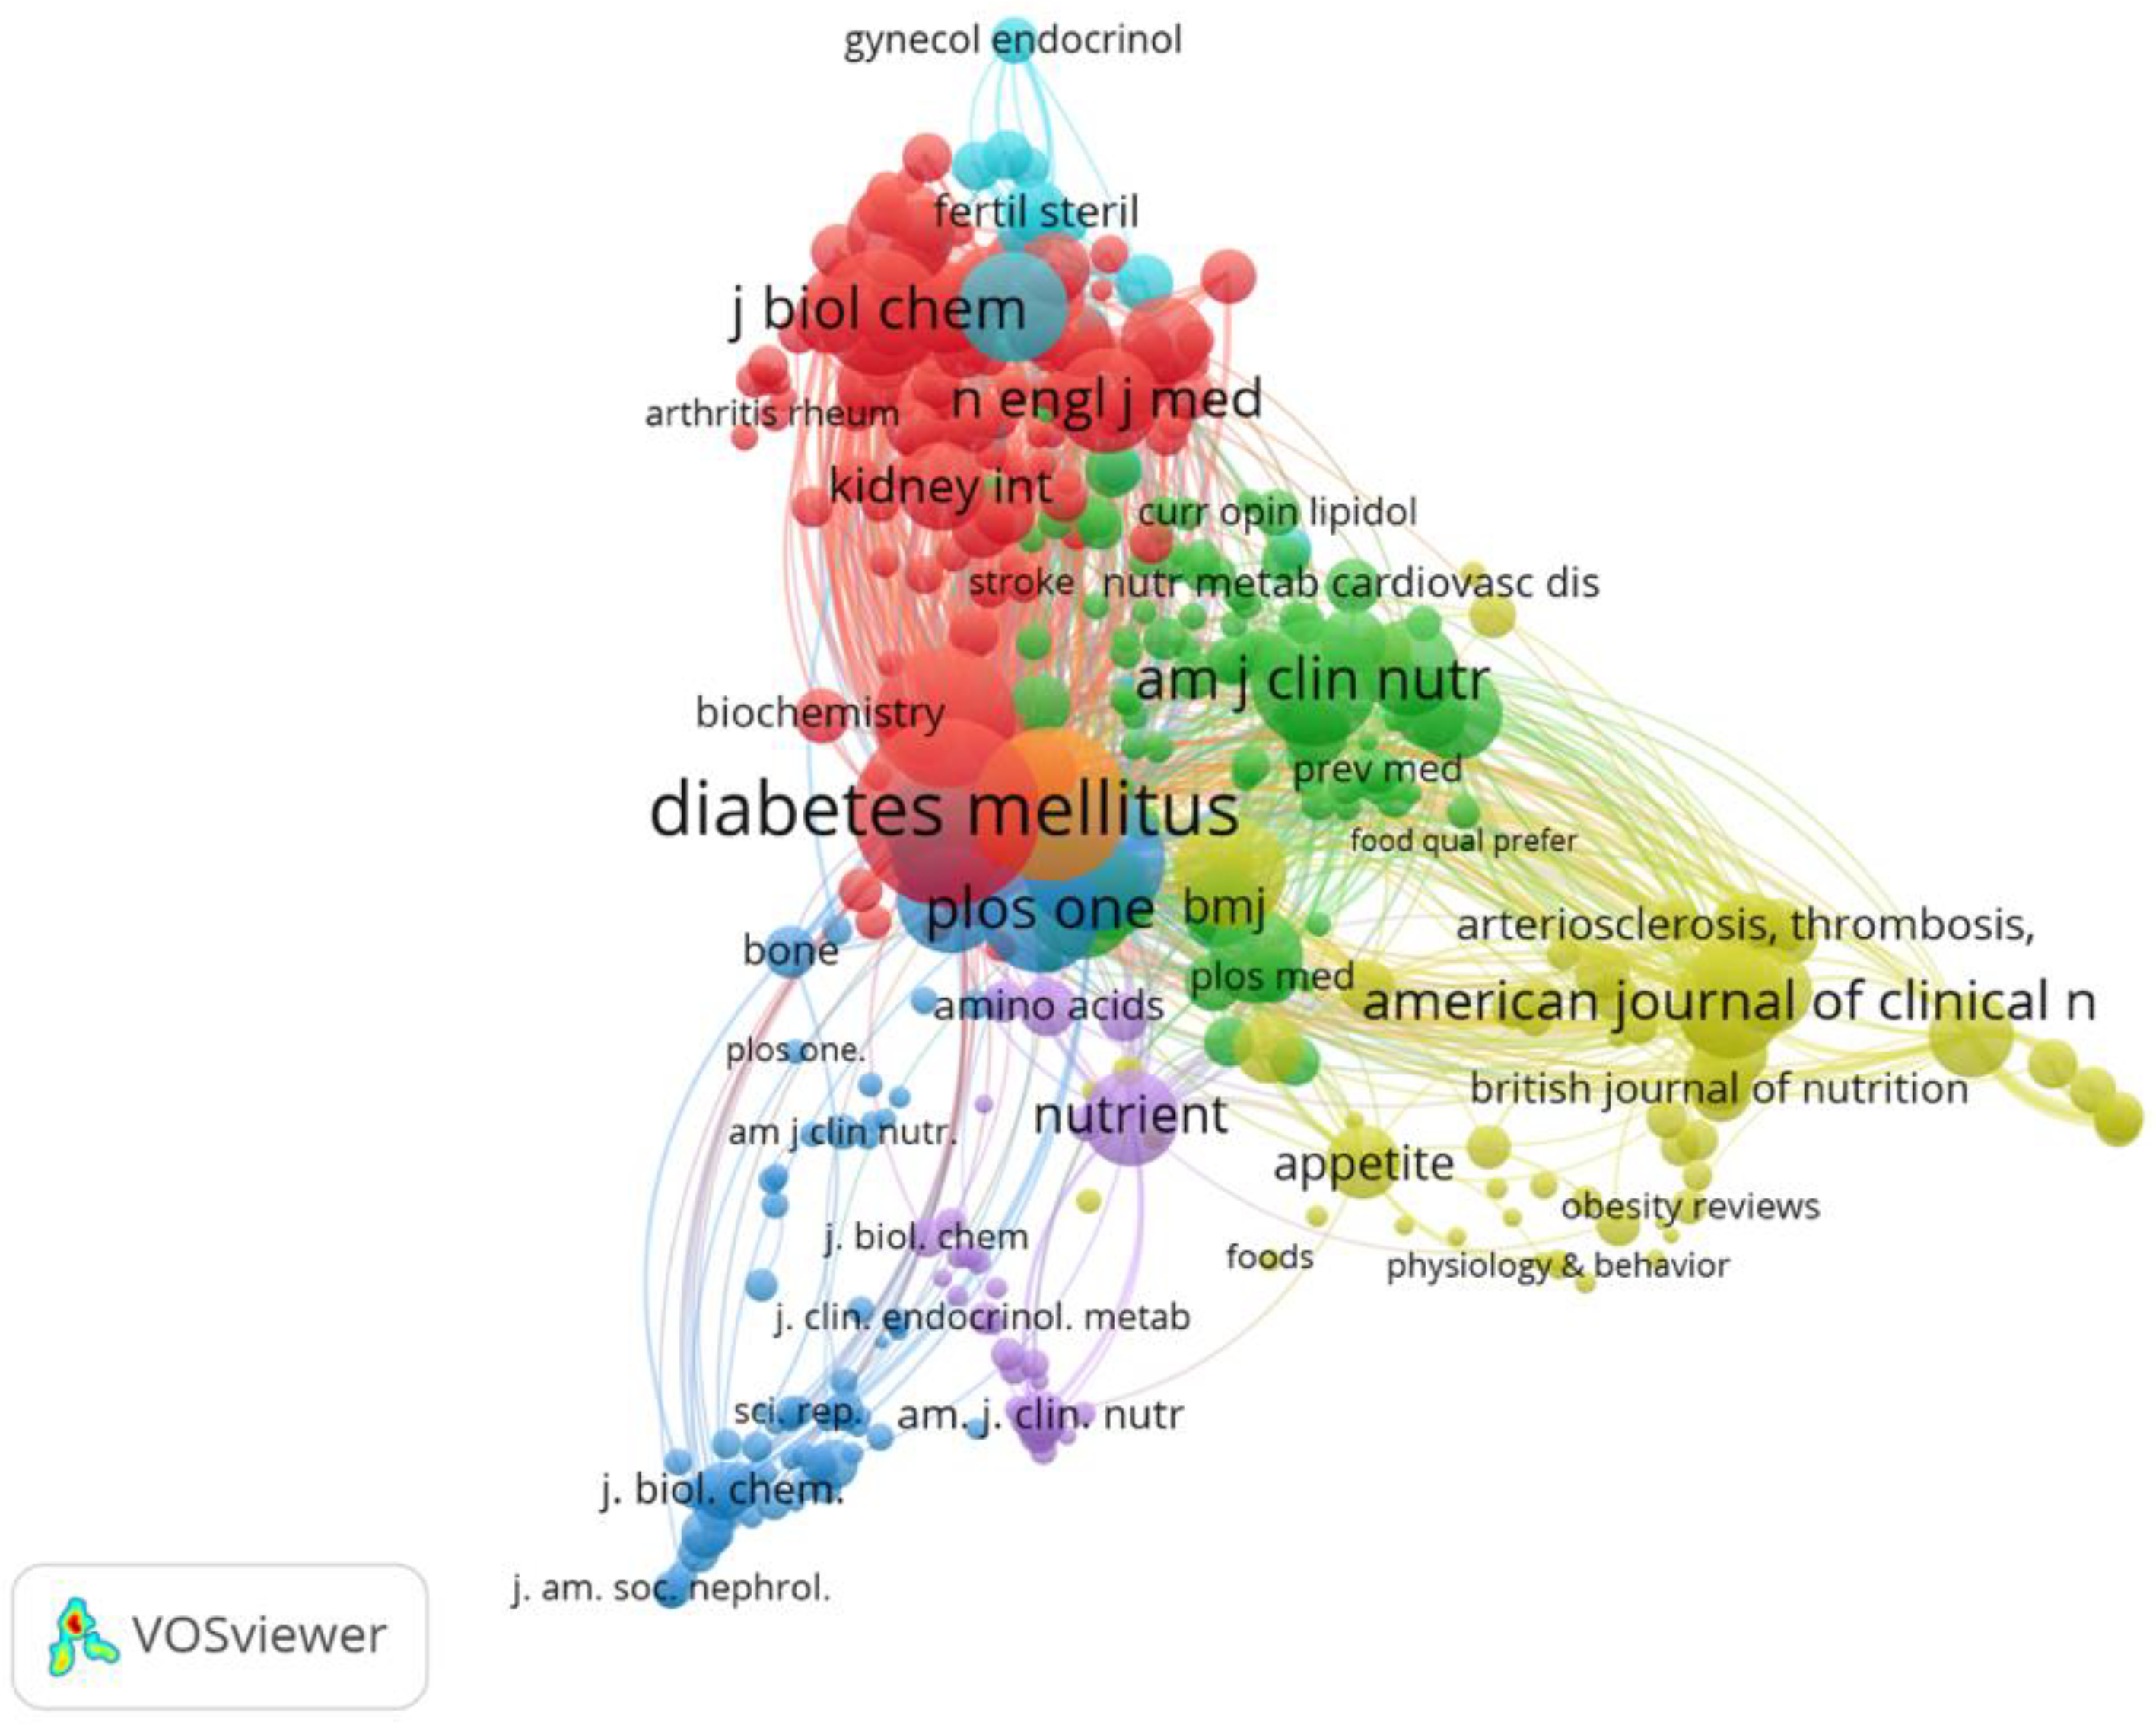
3.2.3. Co-Citation Source Networks

This analysis refers to direct observations on journals that have been repeatedly cited in AGE studies. The most active and influential scientific sources were identified using VOSviewer. There were 15,214 scientific sources in this study, and with the determined minimum threshold of 20 citations, we obtained 425 scientific sources that met the criteria for further discussion. The map below shows the results of the VOSviewer analysis, indicating the presence of six clusters in the network (Figure 9).
Table 8 below shows the top 15 scientific sources in AGE studies, which are the most-cited sources and have strong links with other scientific sources.
Diabetes occupies the top rank, with 1236 citations, 409 links with other scientific sources, and link strength of 30,087. The second rank is occupied by Diabetes Care with 845 citations, 420 links, and link strength of 20,139. PLoS ONE occupies the third rank, with 816 citations, 816 links, and link strength of 8106. The next ranking scientific sources are The American Journal of Clinical Nutrition, Circulation, Nutrients, Diabetologia, The Lancet, Journal of Biological Chemistry, Nature, The Journal of Clinical Endocrinology and Metabolism, The New England Journal of Medicine, Atherosclerosis, The Journal of Clinical Investigation, and American Journal of Clinical Nutrition, respectively.
Cluster 1 consists of 127 scientific sources, among which Diabetes is the most prominent, with 1236 citations, 409 links with other scientific sources, and link strength of 30,087. The New England Journal of Medicine and the Journal of Biological Chemistry are next in line. Cluster 2 consists of 102 sources, where Nutrients occupies first rank with the largest number of citations of 625, 209 links, and link strength of 3459.
Cluster 3 consists of 98 sources, with Public Health Nutrition being the most outstanding scientific source with 694 co-citations, 316 links, and link strength of 18,647. Cluster 4 consists of 64 sources, where Appetite is the scientific source having the highest number of co-citations in this cluster. Cluster 5 consists of 26 scientific sources, among which The Journal of Clinical Endocrinology and Metabolism is the first-ranking journal with the largest number of co-citations, whereas Cluster 6 has a single source, namely Circulation with 668 citations, 415 links, and link strength of 48,984.

4. Discussion

Our research showed there is an increase in references to AGEs in processed food publications especially from 2003 onwards. This increase in the number of publications may have been affected by several factors. The first is the increased prevalence of obesity in nearly all countries, both developed and developing countries [43,44]. Obesity is no longer limited to a certain socio-economic group [45]. Globalization, with changes in dietary patterns and sedentary lifestyles, both in urban and rural areas, also contributes to the occurrence of obesity. The second factor is the discovery of AGE pathways [29,46,47,48,49,50] and of databases of AGEs in foods from several countries [10,11,13,51,52]. The third factor is the open information system, where an increasing number of journals offer open access, [53,54] and the availability of big data to facilitate access to the most recent knowledge [55,56].
Nutrients is the journal that accepts the greatest number of articles in this field. The number of articles in Nutrients has increased sharply since 2018 with 7 documents, and continued to increase in 2019 and 2020 with, respectively, 16 and 22 documents per year. Although in 2021 the number of documents was 18, a decrease of 18.2% from the previous year, nevertheless this journal is still the largest contributor to the topics of AGEs and obesity. The decrease in the number of articles may have been caused by the current COVID-19 pandemic. The results of this study are in line with the study of Riccaboni, M. and Verginer, R., who showed a decrease in the number of non-COVID-19 publications by 10–12% during the pandemic in 2019 and 2020 [27].
In Figure 5, a thick line may be seen that connects PLoS ONE with Public Health Nutrition (link strength 12), showing the sufficiently high number of researchers preferring to publish articles in both the aforementioned journals. The node for Nutrients is adjacent to that of PLoS ONE, although differing in color. This may have been due to the fact that the accepted articles covered the same topics, although in general there is a difference in coverage between the two journals. The acceptance criteria in Nutrients are nutrition that is associated with human health and the methods for evaluating nutritional status, whereas PLoS ONE covers physics, medicine, engineering, social sciences, and the humanities. Nutrients has links to Public Health Nutrition (link strength 9) and PLoS ONE (link strength 5). This may be the referent in the selection of publications in similar research fields.
Our research showed the majority of journals are open access. A significant association of open access journal status with year of publication and number of citations exists. Several studies also show an increase in the number of open access journals [57,58]. Yang Li et al. also demonstrated a strong association between open access journals in medicine, biology, and science, based on the CiteScore [58]. It is known that the majority of articles on AGEs are in the subject area of medicine (Table 4). Citing articles takes time, as may be seen from the negative association between the CiteScore and year of publication (r = −0.64 [95% CI: −0.67, −0.60], p <0.001). The results of the present study agree with the study of Studenic, P. [59].
The Diabetes journal and the British Journal of Nutrition are the journals with the highest and second highest number of citations, namely 1080 and 1060 citations, respectively, although both journals are non-open access. This may have been caused by their age and ranking. Diabetes is known to have been in existence since 1952, with a q1 journal ranking and an h-index of 330. Similarly, the British Journal of Nutrition was established in 1947 and has a q1 journal ranking and an h-index of 188. PLoS ONE occupies the third highest rank for document citations with a total of 971 citations. PLoS ONE was founded in 2006; therefore, this journal may be said to be younger than Diabetes and the British Journal of Nutrition. In spite of this, the h-index of PLoS ONE (332) is the second highest after the American Journal of Clinical Nutrition (360). Apparently, in addition to journal age and impact factor, the open access status, quality, and the document topics [60] may play a role in determining the number of document citations.
The most frequently cited article is ‘Global nutrition transition and the pandemic of obesity in developing countries’, issued in 2012 by Popkin from the University of North Carolina, USA [28]. His article exposes the changes in lifestyle, i.e., an increased consumption of processed foods and decreased physical activity, which have attracted attention in low- and middle-income countries, both in urban and rural areas.
The hypothesis on the AGE pathways and the complications of type 2 diabetes was published by Evans, J. from the Medical Research Institute (J.L.E.), San Bruno, California, USA, in an article titled “Oxidative stress and stress-activated signaling pathways: A unifying hypothesis of type 2 diabetes” [29]. This document is the second most-cited one (1680 citations). The article ‘Dietary emulsifiers impact the mouse gut microbiota promoting colitis and metabolic syndrome’ is the third most-cited document [30]. Chassaing, B. discusses the metabolic syndrome induced by the emulsifiers carboxymethylcellulose and polysorbate-80, which were subsequently associated with changes in the species composition of the microbiota and the increase in pro-inflammatory potential [30].
Upon further analysis of these top 15 cited documents, it turns out that the most frequent topic is AGEs with noncommunicable disease (NCDs) complications, such as polycystic ovary syndrome (PCOS), diabetes mellitus, metabolic syndrome, or diabetic nephropathy [29,34,35,36,38,39,40]. The next most-cited topics are the increased consumption of processed foods and the effect of ultra-processed foods on obesity [28,31,32,37,42], and the association of AGEs with diet or of endogenous AGEs with inflammation [30,33,41].
Obesity is an abnormal condition due to an excess of fat in the body, which can be the cause of various pathological conditions. [1]. The fundamentally strong association between obesity and inflammatory mediators is caused by the chronic exposure to a high AGE diet, resulting in chronic inflammation and insulin resistance [61,62]. It was shown that binding between AGEs and receptor AGEs (membrane-bound receptors of AGE (mRAGE)) could cause cellular dysfunction interfering with cellular communication, changes in protein structure and function, and mitochondrial dysfunction, leading to cell death [63]. Binding to RAGE can also increase reactive oxygen species (ROS), activate inflammatory signaling such as the nuclear factor-k-light-chain-enhancer of activated β cells (NF-kβ), tumor necrosis factor-α (TNF-α), interleukin-6 (IL-6), and induce insulin resistance, which is often associated with obesity. Meanwhile, binding with other receptors such as AGE-R1, AGE-R2, and AGE-R3 plays a role in AGE clearance [64]. The close relationship between AGEs and the AGE receptors is also shown in several articles [29,39].
It has been observed that serum AGEs (ϵN-CML, methylglyoxal (MG)) are higher in patients with obesity and one other criterion of the metabolic syndrome than in patients without the metabolic syndrome criteria. This shows that obesity is correlated with a high AGE diet and not with a high calorie intake. Higher TNFα levels have also been reported in the same subjects, consistent with evidence that a high AGE level increases inflammation and insulin resistance [65]. Therefore, circulating AGEs have been suggested as biomarkers for the identification of the transition from obesity to metabolic syndrome, for detection of obesity at risk of metabolic syndrome, and for monitoring the efficacy of dietary interventions [66].
The close positive relationship between AGEs in foods and the level of calories consumed was reported by Baye et al., such that it is difficult to differentiate the individual contributions of each of these risk factors. Based on the tables and the database analysis included in the study paper, fats, meats, cheese, and pulses (if processed, canned, or grilled at high temperatures) have the highest AGE contents. The groups of fats and meats that have a high lipid and protein content tend to have higher AGE contents [9,67].
The study conducted by Uribarri also reported the same, in that although AGEs as a whole are not associated with markers of fat mass, in the presence of obesity and one or more criteria of metabolic syndrome, serum AGE levels are actually higher. Therefore, high AGE levels in obese adults may function as a signal for the transition from obesity to metabolic syndrome [68]. Bearing in mind that AGEs are modifiable non-traditional risk factors, these findings may assist in the timely and targeted prevention of the risk of metabolic syndrome [68,69].
Advanced glycation end products and inflammatory factors were not increased in subjects with obesity who did not have the other criteria of metabolic syndrome and were designated as being metabolically healthy, consistent with the view that an increase in body fat does not always indicate a risk for metabolic syndrome. In this context, the level of AGEs in healthy subjects with obesity may indicate a transition category of metabolic syndrome, such as high blood pressure, dyslipidemia, or subclinical cardiovascular disease, and determine the initial risk toward subsequent metabolic syndrome. Furthermore, outside of excessive nutrition, the exposure to AGE-rich foods may disclose important pointers and a temporal relationship between healthy and unhealthy obesity or obesity at risk for metabolic syndrome [68].
McGlashan, S.R. showed that a high fat diet has a positive correlation with AGEs in serum, tissues, and an increase in the total percentage of fat. High concentrations of AGEs in serum and tissues can be decreased with optimal physical activity intervention. In addition, reducing the intake of AGEs can also reduce the circulating levels of AGEs. From this study, it was found that a high-fat diet and physical activity affected the total body fat percentage, systemic inflammation, accumulation of AGEs, and increased the expression of proinflammatory cytokines. The effect of physical activity can increase the intra-hepatic breakdown process of AGEs that bind to proteins and peptides so that it will increase the elimination and reduction of AGEs in the kidneys [70,71].
Our study tried to identify the highly cited articles, journals, authors, countries, and the latest themes related to AGEs and obesity. Our study highlighted that there is an incremental increase in studies concerning ultra-processed food as part of a poor quality diet and relating to NCDs and obesity. There do not seem to be many data relating to ultra-processed food and the elderly. Therefore, there seems a need for research in this field. In the study of AGEs, procedure standardization in the laboratory between researchers is still needed.
One limitation of the present study is that the downloaded data may have been incomplete, because the extracted data were limited to titles and keywords, the Scopus database, published journal articles, and articles in English. There are other AGE structures that were not specifically written in the search terms such as Nϵ-(carboxyethyl)lysine (CEL), pentosidine, glyoxal (GO), and alpha-dicarbonyl compounds. Another limitation of this study is the possibility that other topics that are not related to this study were entered in the analysis and were visualized.

5. Conclusions

We present this bibliometric analysis to provide the most recent data on the description, visualization, and analysis of AGEs and obesity. There has been an increase in the study of processed foods that includes studies on AGEs and obesity. The United States are the largest contributors of studies in this field, with the highest total of citations. The Nutrients journal has published the largest number of articles on this topic, particularly in the last two years. The focus of the studies is currently centered on ultra-processed foods.

Supplementary Materials

The following supporting information can be downloaded at: https://www.mdpi.com/article/10.3390/nu14245255/s1, Table S1: The analyzed dataset.

Author Contributions

P.B.L.: conceptualization, methodology; P.B.L., K.S.A., N.M.S. and M.A.F. formal analysis, writing original draft, Y.Y. review and editing; P.B.L., K.S.A., N.M.S. and M.A.F. visualization. P.B.L. coordinated the final submission of the manuscript. All authors have read and agreed to the published version of the manuscript.

Funding

The study and article process charges (APC) were supported by Universitas Trisakti.

Institutional Review Board Statement

Not applicable.

Informed Consent Statement

Not applicable.

Data Availability Statement

The analyzed dataset is in the Supplementary Materials.

Acknowledgments

We gratefully acknowledge the stimulating discussions of Ade Gafar Abdullah, M.Si, during the study, and the proofreading of the manuscript by Richard Tjan, DTMH (Mahidol).

Conflicts of Interest

The authors declare that there is no conflict of interest. The funders had no role in the design of the study; in the collection, analyses, or interpretation of data; or in the decision to publish the results.

References

  1. Nurwanti:, E.; Hadi, H.; Chang, J.-S.; Chao, J.C.J.; Paramashanti, B.A.; Gittelsohn, J.; Bai, C.-H. Rural–urban differences in dietary behavior and obesity: Results of the Riskesdas study in 10–18-year-old Indonesian children and adolescents. Nutrients 2019, 11, 2813. [Google Scholar] [CrossRef] [PubMed] [Green Version]
  2. Popkin, B.M.; Ng, S.W. The nutrition transition to a stage of high obesity and noncommunicable disease prevalence dominated by ultra-processed foods is not inevitable. Obes. Rev. 2022, 23, e13366. [Google Scholar] [CrossRef] [PubMed]
  3. Tobias, D.K.; Hall, K.D. Eliminate or reformulate ultra-processed foods? Biological mechanisms matter. Cell Metab. 2021, 33, 2314–2315. [Google Scholar] [CrossRef] [PubMed]
  4. Van Waateringe, R.P.; Mook-Kanamori, M.J.; Slagter, S.N.; van der Klauw, M.M.; van Vliet-Ostaptchouk, J.V.; Graaff, R.; Lutgers, H.L.; Suhre, K.; El-Din Selim, M.M.; Mook-Kanamori, D.O.; et al. The association between various smoking behaviors, cotinine biomarkers and skin autofluorescence, a marker for advanced glycation end product accumulation. PLoS ONE 2017, 12, e0179330. [Google Scholar] [CrossRef] [PubMed]
  5. Puddu, A.; Sanguineti, R.; Maggi, D.; Nicolò, M.; Traverso, C.E.; Cordera, R.; Viviani, G.L. Advanced Glycation End-Products and hyperglycemia increase angiopoietin-2 production by impairing angiopoietin-1-tie-2 system. J. Diabetes Res. 2019, 2019, 6198495. [Google Scholar] [CrossRef]
  6. Lee, H.-W.; Gu, M.; Hur, J.; Park, H.-Y.; Kim, Y.; Ha, S.K. Glycolaldehyde disrupts insulin signaling and glucose uptake through adipogenesis. Appl. Biol. Chem. 2021, 64, 58. [Google Scholar] [CrossRef]
  7. Wolffenbuttel, B.H.; van Haeften, T.W. Prevention of complications in non-insulin-dependent diabetes mellitus (NIDDM). Drugs 1995, 50, 263–288. [Google Scholar] [CrossRef]
  8. Ames, J.M. Determination of N epsilon-(carboxymethyl)lysine in foods and related systems. Ann. N. Y. Acad. Sci. 2008, 1126, 20–24. [Google Scholar] [CrossRef]
  9. Uribarri, J.; Woodruff, S.; Goodman, S.; Cai, W.; Chen, X.; Pyzik, R.; Yong, A.; Striker, G.E.; Vlassara, H. Advanced glycation end products in foods and a practical guide to their reduction in the diet. J. Am. Diet. Assoc 2010, 110, 911–916. [Google Scholar] [CrossRef] [Green Version]
  10. Hull, G.L.J.; Woodside, J.V.; Ames, J.M.; Cuskelly, G.J. Ne-(carboxymethyl) lysine content of foods commonly consumed in a Western style diet. Food Chem. 2012, 131, 170–174. [Google Scholar] [CrossRef]
  11. Takeuchi, M.; Takino, J.-I.; Furuno, S.; Shirai, H.; Kawakami, M.; Muramatsu, M.; Kobayashi, Y.; Yamagishi, S.-I. Assessment of the concentrations of various advanced glycation end-products in beverages and foods that are commonly consumed in Japan. PLoS ONE 2015, 10, e0118652. [Google Scholar] [CrossRef] [PubMed] [Green Version]
  12. He, J.; Zeng, M.; Zheng, Z.; He, Z.; Chen, J. Simultaneous determination of Nε-(carboxymethyl) lysine and Nε-(carboxyethyl) lysine in cereal foods by LC–MS/MS. Eur. Food Res. Technol. 2014, 238, 367–374. [Google Scholar] [CrossRef]
  13. Scheijen, J.L.J.M.; Clevers, E.; Engelen, L.; Dagnelie, P.C.; Brouns, F.; Stehouwer, C.D.A.; Schalkwijk, C.G. Analysis of advanced glycation endproducts in selected food items by ultra-performance liquid chromatography tandem mass spectrometry: Presentation of a dietary AGE database. Food Chem. 2016, 190, 1145–1150. [Google Scholar] [CrossRef] [PubMed]
  14. Sharma, C.; Kaur, A.; Thind, S.S.; Singh, B.; Raina, S. Advanced glycation End-products (AGEs): An emerging concern for processed food industries. J. Food Sci. Technol. 2015, 52, 7561–7576. [Google Scholar] [CrossRef] [Green Version]
  15. Uribarri, J.; del Castillo, M.D.; de la Maza, M.P.; Filip, R.; Gugliucci, A.; Luevano-Contreras, C.; Macías-Cervantes, M.H.; Bastos, D.H.M.; Medrano, A.; Menini, T.; et al. Dietary Advanced Glycation End Products and their role in health and disease. Adv. Nutr. 2015, 6, 461–473. [Google Scholar] [CrossRef] [Green Version]
  16. Huang, S.; Huang, M.; Dong, X. Advanced Glycation End Products in meat during processing and storage: A review. Food Rev. Int. 2021, 1–17. [Google Scholar] [CrossRef]
  17. Popkin, B.M. Nutrition transition and the global diabetes epidemic. Curr. Diab. Rep. 2015, 15, 64. [Google Scholar] [CrossRef]
  18. Cai, W.; Ramdas, M.; Zhu, L.; Chen, X.; Striker, G.E.; Vlassara, H. Oral Advanced Glycation End Products (AGEs) promote insulin resistance and diabetes by depleting the antioxidant defenses AGE receptor-1 and sirtuin 1. Proc. Natl. Acad. Sci. USA 2012, 109, 15888–15893. [Google Scholar] [CrossRef] [Green Version]
  19. Uribarri, J.; Cai, W.; Sandu, O.; Peppa, M.; Goldberg, T.; Vlassara, H. Diet-derived advanced glycation end products are major contributors to the body’s AGE pool and induce inflammation in healthy subjects. Ann. N. Y. Acad. Sci. 2005, 1043, 461–466. [Google Scholar] [CrossRef]
  20. Henle, T. AGEs in foods: Do they play a role in uremia? Kidney Int. 2003, 63, S145–S147. [Google Scholar] [CrossRef]
  21. Öğretmenoğlu, M.; GöKtepe, S.; Atsız, O. A bibliometric analysis of food studies: Evidence from British Food Journal. J. Multidiscip. Acad. Tour. 2021, 7, 67–79. [Google Scholar] [CrossRef]
  22. Pranckutė, R. Web of Science (WoS) and Scopus: The titans of bibliographic information in today’s academic world. Publications 2021, 9, 12. [Google Scholar] [CrossRef]
  23. Donthu, N.; Kumar, S.; Mukherjee, D.; Pandey, N.; Lim, W.M. How to conduct a bibliometric analysis: An overview and guidelines. J. Bus. Res. 2021, 133, 285–296. [Google Scholar] [CrossRef]
  24. Mendez, J.; Xie, J.; Aguilar-Hernández, M.; Méndez-Valenzuela, V. Trends in advanced glycation end products research in diabetes mellitus and its complications. Mol. Cell Biochem. 2010, 341, 33–41. [Google Scholar] [CrossRef]
  25. Huang, Z.; Zhang, H.; Luo, Y.; Wei, C.; Zhao, Y.; Huang, Y.; Zhang, L.; Chen, W.; He, L.; Liu, H.; et al. The 100 top-cited articles in diabetic kidney disease: A bibliometric analysis. Ren. Fail. 2021, 43, 781–795. [Google Scholar] [CrossRef]
  26. Bajjou, M.S. List of Scopus Indexed Journals 2022. 2022. Available online: https://www.researchgate.net/publication/357884652_List_of_Scopus_Indexed_Journals_2022 (accessed on 29 March 2022).
  27. Riccaboni, M.; Verginer, L. The impact of the COVID-19 pandemic on scientific research in the life sciences. PLoS ONE 2022, 17, e0263001. [Google Scholar] [CrossRef]
  28. Popkin, B.M.; Adair, L.S.; Ng, S.W. Global nutrition transition and the pandemic of obesity in developing countries. Nutr. Rev 2012, 70, 3–21. [Google Scholar] [CrossRef] [Green Version]
  29. Evans, J.L.; Goldfine, I.D.; Maddux, B.A.; Grodsky, G.M. Oxidative stress and stress-activated signaling pathways: A unifying hypothesis of type 2 diabetes. Endocr. Rev. 2002, 23, 599–622. [Google Scholar] [CrossRef] [Green Version]
  30. Chassaing, B.; Koren, O.; Goodrich, J.K.; Poole, A.C.; Srinivasan, S.; Ley, R.E.; Gewirtz, A.T. Dietary emulsifiers impact the mouse gut microbiota promoting colitis and metabolic syndrome. Nature 2015, 519, 92–96. [Google Scholar] [CrossRef] [Green Version]
  31. Bibbins-Domingo, K.; Chertow, G.M.; Coxson, P.G.; Moran, A.; Lightwood, J.M.; Pletcher, M.J.; Goldman, L. Projected Effect of Dietary Salt Reductions on Future Cardiovascular Disease. N. Engl. J. Med. 2010, 362, 590–599. [Google Scholar] [CrossRef]
  32. WHO. Diet, nutrition and the prevention of chronic diseases: Report of a joint WHO/FAO expert consultation, Geneva, 28 January–1 February 2002. World Health Organ. Tech. Rep. Ser. 2003, 916, 1–149. Available online: https://apps.who.int/iris/handle/10665/42665 (accessed on 20 July 2022).
  33. Calder, P.C.; Ahluwalia, N.; Brouns, F.; Buetler, T.; Clement, K.; Cunningham, K.; Esposito, K.; Jönsson, L.S.; Kolb, H.; Lansink, M.; et al. Dietary factors and low-grade inflammation in relation to overweight and obesity. Br. J. Nutr. 2011, 106 (Suppl. S3), S1–S78. [Google Scholar] [CrossRef] [PubMed]
  34. Wada, J.; Makino, H. Inflammation and the pathogenesis of diabetic nephropathy. Clin. Sci. 2013, 124, 139–152. [Google Scholar] [CrossRef] [PubMed] [Green Version]
  35. Fiorentino, T.V.; Prioletta, A.; Zuo, P.; Folli, F. Hyperglycemia-induced oxidative stress and its role in diabetes mellitus related cardiovascular diseases. Curr. Pharm. Des. 2013, 19, 5695–5703. [Google Scholar] [CrossRef]
  36. Tanji, N.; Markowitz, G.S.; Fu, C.; Kislinger, T.; Taguchi, A.; Pischetsrieder, M.; Stern, D.; Schmidt, A.M.; D’Agati, V.D. Expression of advanced glycation end products and their cellular receptor RAGE in diabetic nephropathy and nondiabetic renal disease. J. Am. Soc. Nephrol. 2000, 11, 1656–1666. [Google Scholar] [CrossRef]
  37. Hall, K.D.; Ayuketah, A.; Brychta, R.; Cai, H.; Cassimatis, T.; Chen, K.Y.; Chung, S.T.; Costa, E.; Courville, A.; Darcey, V.; et al. Ultra-processed diets cause excess calorie intake and weight gain: An inpatient randomized controlled trial of ad libitum food intake. Cell Metab. 2019, 30, 67–77.e63. [Google Scholar] [CrossRef] [Green Version]
  38. Conway, G.; Dewailly, D.; Diamanti-Kandarakis, E.; Escobar-Morreale, H.F.; Franks, S.; Gambineri, A.; Kelestimur, F.; Macut, D.; Micic, D.; Pasquali, R.; et al. The polycystic ovary syndrome: A position statement from the European Society of Endocrinology. Eur. J. Endocrinol. 2014, 171, P1–P29. [Google Scholar] [CrossRef] [Green Version]
  39. Donath, M.Y.; Gross, D.J.; Cerasi, E.; Kaiser, N. Hyperglycemia-induced beta-cell apoptosis in pancreatic islets of Psammomys obesus during development of diabetes. Diabetes 1999, 48, 738–744. [Google Scholar] [CrossRef]
  40. Scuteri, A.; Najjar, S.S.; Muller, D.C.; Andres, R.; Hougaku, H.; Metter, E.J.; Lakatta, E.G. Metabolic syndrome amplifies the age-associated increases in vascular thickness and stiffness. J. Am. Coll. Cardiol. 2004, 43, 1388–1395. [Google Scholar] [CrossRef] [Green Version]
  41. Lontchi-Yimagou, E.; Sobngwi, E.; Matsha, T.E.; Kengne, A.P. Diabetes mellitus and inflammation. Curr. Diab. Rep. 2013, 13, 435–444. [Google Scholar] [CrossRef]
  42. Louzada, M.L.; Baraldi, L.G.; Steele, E.M.; Martins, A.P.; Canella, D.S.; Moubarac, J.C.; Levy, R.B.; Cannon, G.; Afshin, A.; Imamura, F.; et al. Consumption of ultra-processed foods and obesity in Brazilian adolescents and adults. Prev. Med. 2015, 81, 9–15. [Google Scholar] [CrossRef] [PubMed]
  43. Thamrin, S.A.; Arsyad, D.S.; Kuswanto, H.; Lawi, A.; Arundhana, A.I. Obesity risk-factor variation based on island clusters: A secondary analysis of Indonesian Basic Health Research 2018. Nutrients 2022, 14, 971. [Google Scholar] [CrossRef] [PubMed]
  44. Wulan, S.N.; Raza, Q.; Prasmita, H.S.; Martati, E.; Maligan, J.M.; Mageshwari, U.; Fatima, I.; Plasqui, G. Energy metabolism in relation to diet and physical activity: A South Asian perspective. Nutrients 2021, 13, 3776. [Google Scholar] [CrossRef] [PubMed]
  45. Zhou, M. The shifting income-obesity relationship: Conditioning effects from economic development and globalization. SSM Popul. Health 2021, 15, 100849. [Google Scholar] [CrossRef]
  46. Bucala, R.; Makita, Z.; Koschinsky, T.; Cerami, A.; Vlassara, H. Lipid advanced glycosylation: Pathway for lipid oxidation in vivo. Proc. Natl. Acad. Sci. USA 1993, 90, 6434–6438. [Google Scholar] [CrossRef] [Green Version]
  47. Leurs, P.; Lindholm, B. The AGE–RAGE pathway and its relation to cardiovascular disease in patients with chronic kidney disease. Arch. Med. Res 2013, 44, 601–610. [Google Scholar] [CrossRef] [PubMed]
  48. Zhuang, A.; Yap, F.Y.; Bruce, C.; Leung, C.; Plan, M.R.; Sullivan, M.A.; Herath, C.; McCarthy, D.; Sourris, K.C.; Kantharidis, P.; et al. Increased liver AGEs induce hepatic injury mediated through an OST48 pathway. Sci. Rep. 2017, 7, 12292. [Google Scholar] [CrossRef] [PubMed] [Green Version]
  49. Al-Dalaeen, A.; Al-Domi, H. Advanced Glycation End Products: Mechanisms in the pathogenesis of type 2 Diabetes and its complications. J. Res. Diabetes Metab. 2018, 4, 016–020. [Google Scholar]
  50. Goldin, A.; Beckman, J.A.; Scmidt, A.M.; Creagen, M.A. Advanced glycation end products: Sparking the development of diabetic vascular injury. Circulation 2006, 114, 597–605. [Google Scholar] [CrossRef] [Green Version]
  51. Goldberg, T.; Cai, W.; Peppa, M.; Dardaine, V.; Baliga, B.S.; Uribarri, J.; Vlassara, H. Advanced glycoxidation end products in commonly consumed foods. J. Am. Diet. Assoc. 2004, 104, 1287–1291. [Google Scholar] [CrossRef]
  52. Liman, P.B.; Djuwita, R.; Agustina, R. Database development of carboxymethyl lysine content in foods consumed by Indonesian women in two selected provinces. J. Int. Dent. Med. Res. 2019, 12, 268–277. [Google Scholar]
  53. Laakso, M.; Welling, P.; Bukvova, H.; Nyman, L.; Björk, B.-C.; Hedlund, T. The development of open access journal publishing from 1993 to 2009. PLoS ONE 2011, 6, e20961. [Google Scholar] [CrossRef] [PubMed] [Green Version]
  54. Björk, B.-C.; Solomon, D. Open access versus subscription journals: A comparison of scientific impact. BMC Med. 2012, 10, 73. [Google Scholar] [CrossRef] [PubMed]
  55. Xafis, V.; Labude, M.K. Openness in big data and data repositories. Asian Bioeth. Rev. 2019, 11, 255–273. [Google Scholar] [CrossRef] [Green Version]
  56. Raghupathi, W.; Raghupathi, V. Big data analytics in healthcare: Promise and potential. Health Inf. Sci. Syst. 2014, 2, 3. [Google Scholar] [CrossRef]
  57. Pandita, R.; Singh, S. A Study of Distribution and Growth of Open Access Research Journals Across the World. Publ. Res. Q. 2022, 38, 131–149. [Google Scholar] [CrossRef]
  58. Li, Y.; Wu, C.; Yan, E.; Li, K. Will open access increase journal CiteScores? An empirical investigation over multiple disciplines. PLoS ONE 2018, 13, e0201885. [Google Scholar] [CrossRef]
  59. Studenic, P.; Ospelt, C. Altimetric—Does social media impact citation rate in rheumatology journals? Ann. Rheum. Dis. 2020, 79, 208. [Google Scholar] [CrossRef]
  60. Sjögårde, P.; Didegah, F. The association between topic growth and citation impact of research publications. Scientometrics 2022, 127, 1903–1921. [Google Scholar] [CrossRef]
  61. Vlassara, H.; Striker, G.E. AGE restriction in diabetes mellitus: A paradigm shift. Nat. Rev. Endocrinol. 2011, 7, 526–539. [Google Scholar] [CrossRef] [Green Version]
  62. Vlassara, H.; Cai, W.; Goodman, S.; Pyzik, R.; Yong, A.; Chen, X.; Zhu, L.; Neade, T.; Beeri, M.; Silverman, J.M.; et al. Protection against loss of innate defenses in adulthood by low advanced glycation end products (AGE) intake: Role of the antiinflammatory AGE receptor-1. J. Clin. Endocrinol. Metab. 2009, 94, 4483–4491. [Google Scholar] [CrossRef] [PubMed] [Green Version]
  63. Cai, W.; He, J.C.; Zhu, L.; Peppa, M.; Lu, C.; Uribarri, J.; Vlassara, H. High levels of dietary advanced glycation end products transform low-density lipoprotein into a potent redox-sensitive mitogen-activated protein kinase stimulant in diabetic patients. Circulation 2004, 110, 285–291. [Google Scholar] [CrossRef] [PubMed] [Green Version]
  64. Gupta, A.; Uribarri, J. Dietary advanced glycation end products and their potential role in cardiometabolic disease in children. Horm. Res. Paediatr. 2016, 85, 291–300. [Google Scholar] [CrossRef] [PubMed]
  65. Uribarri, J.; Cai, W.; Pyzik, R.; Goodman, S.; Chen, X.; Zhu, L.; Ramdas, M.; Striker, G.E.; Vlassara, H. Suppression of native defense mechanisms, SIRT1 and PPARγ, by dietary glycoxidants precedes disease in adult humans; relevance to lifestyle-engendered chronic diseases. Amino Acids 2014, 46, 301–309. [Google Scholar] [CrossRef] [Green Version]
  66. Stefan, N.; Häring, H.U.; Hu, F.B.; Schulze, M.B. Metabolically healthy obesity: Epidemiology, mechanisms, and clinical implications. Lancet Diabetes Endocrinol. 2013, 1, 152–162. [Google Scholar] [CrossRef] [PubMed]
  67. Baye, E.; Kiriakova, V.; Uribarri, J.; Moran, L.J.; de Courten, B. Consumption of diets with low advanced glycation end products improves cardiometabolic parameters: Meta-analysis of randomised controlled trials. Sci. Rep. 2017, 7, 2266. [Google Scholar] [CrossRef] [Green Version]
  68. Uribarri, J.; Cai, W.; Woodward, M.; Tripp, E.; Goldberg, L.; Pyzik, R.; Yee, K.; Tansman, L.; Chen, X.; Mani, V.; et al. Elevated serum advanced glycation endproducts in obese indicate risk for the metabolic syndrome: A link between healthy and unhealthy obesity? J. Clin. Endocrinol. Metab. 2015, 100, 1957–1966. [Google Scholar] [CrossRef]
  69. De Courten, B.; Baye, E. Effects of a low-AGE diet on insulin sensitivity. In Dietary AGEs and Their Role in Health and Disease; Uribarri, J., Ed.; Taylor & Francis Group, LLC: New York, NY, USA, 2018; pp. 329–337. [Google Scholar]
  70. McGlashan, S.; Yu, L.; Vickers, M.; Haysom, S.S.; Barker, C.; Leung, S.; Firth, E. Diet-induced obesity may initiate advanced glycation end-product-mediated inflammation in articular cartilage. Osteoarthr. Cartil. 2016, 24, S142–S143. [Google Scholar] [CrossRef]
  71. Luévano-Contreras, C.; Gómez-Ojeda, A.; Macías-Cervantes, M.H.; Garay-Sevilla, M.E. Dietary Advanced Glycation End Products and Cardiometabolic Risk. Curr. Diab. Rep. 2017, 17, 63. [Google Scholar] [CrossRef]
Figure 2. Distribution of publications on AGEs in obesity for 1995–2022.
Nutrients 14 05255 g002
Figure 3. Distribution of publications by country.
Nutrients 14 05255 g003
Figure 4. Analysis of journals.
Nutrients 14 05255 g004
Figure 5. Bibliometric analysis of journals.
Nutrients 14 05255 g005
Figure 6. Author collaboration.
Nutrients 14 05255 g006
Figure 7. Visualization of the network of keywords used by authors, by co-occurrences.
Nutrients 14 05255 g007
Figure 8. Co-citation networks of cited authors.
Nutrients 14 05255 g008
Figure 9. Co-citation source maps.
Nutrients 14 05255 g009
Table 1. Distribution of top 15 countries by number of citations.
No.CountryRegionDocumentsCitationsLinksTotal Link Strength
1United StatesAmerica38219,36210355,724
2BrazilAmerica12636119427,028
3United KingdomEurope10242039827,961
4AustraliaOceania81255110018,628
5ItalyEurope7839889320,707
6GermanyEurope6127159416,838
7SpainEurope5826779718,193
8JapanAsia572028687452
9ChinaAsia531145876630
10FranceEurope4523379412,203
11CanadaAmerica441687949564
12NetherlandsEurope3820098813,575
13IndiaAsia37408833124
14South KoreaAsia30283834140
15PolandEurope29342692494
Table 2. Topmost ranking countries per cluster by number of documents.
ClusterDocumentsCitationsLinksTotal Link StrengthCountry
138219,36210155,676United States
Red16484784551New Zealand
(32 nodes)16457824448South Africa
2572028677451Japan
Green531145876630China
(15 nodes)37408833124India
37839889120,700Italy
Blue6127159216,835Germany
(14 nodes)14168601439Egypt
42464824648Sweden
Yellow1110111101Malaysia
(8 nodes)648648Nigeria
55826779418,123Spain
Violet27327885631Mexico
(7 nodes)161626743954Israel
63820098713,574Netherlands
Light Blue228218111,929Denmark
(7 nodes)201408733737Greece
7181369785208Belgium
Orange15517651908Portugal
(6 nodes)3147883Cyprus
88125519818,588Australia
Brown4523379212,116France
(5 nodes)130226467Cameroon
912636119126,909Brazil
Light Red441687949564Canada
(4 nodes)511458799Hong Kong
1010242039627,949United Kingdom
Peach114237Oman
(3 nodes)114237South Sudan
1112180865615Ireland
Light Violet7254583536Romania
(3 nodes)1431660El Salvador
Table 3. Association of open access journal status with year of publication and number of citations (n = 1170).
VariableNon-Open Access
(n = 457)
Open Access
(n = 713)
p Value
Year (in years)2016 (2012–2020) ‡,**2018 (2015–2020) ‡,**<0.001
Citations7 (2–23) ‡,*11 (2–31) ‡,*0.007
Data are presented as median (25th percentile–75th percentile); Mann–Whitney test, statistically significant at * p < 0.05; and ** p < 0.001.
Table 4. Top 15 journals by number of documents.
RankingJournalPrint ISSNE-ISSNCountryDocuments% of Document TotalCitationQh-IndexSJR (2020)SNIP (2020)Open Access (Feb 2022)
1Nutrients20726643 Switzerland655.668311151.4181.603Yes
2PLoS ONE19326203 United States292.597113320.9901.349Yes
3Public Health Nutrition1368980014752727United Kingdom221.984311371.1661.368Yes
4Appetite195666310958304United States181.517411441.1311.448Yes
5International Journal of Environmental Research and Public Health1661782716604601Switzerland161.43921130.7471.356Yes
6British Journal of Nutrition7114514752662United Kingdom151.3106011881.0731.194No
7Obesity19307381 United States110.937211991.4381.356No
8BMC Public Health14712458 United Kingdom100.911811431.2301.656Yes
9Medical Hypotheses306987715322777United States100.93243870.4410.530Yes
10European Journal of Nutrition1436620714366215Germany90.82181961.3211.532No
11Scientific Reports20452322 United Kingdom90.87012131.2401.377Yes
12Diabetes121797 United States80.7108013303.2191.901No
13Obesity Reviews146778811467789XUnited Kingdom80.761311622.8453.056Yes
14American Journal of Clinical Nutrition2916519383207United States70.636013362.6082.294Yes
15Clinical Nutrition261561415321983United States70.64911401.9152.517No
Abbreviations: ISSN: International Standard of Serial Number; E-ISSN: Electronic International Standard of Serial Number; SJR: Scimago journal & country rank; SNIP: Source Normalized Impact per Paper.
Table 5. Top ranks for citations of documents on AGEs and obesity.
No.AuthorsYearTitleNumber of CitationsReference Number
1Popkin, B.M.2012Global nutrition transition and the pandemic of obesity in developing countries2189[28]
2Evans, J.L.2002Oxidative Stress and Stress-Activated Signaling Pathways: A Unifying Hypothesis of Type 2 Diabetes1680[29]
3Chassaing, B.2015Dietary emulsifiers impact the mouse gut microbiota promoting colitis and metabolic syndrome902[30]
4Bibbins-Domingo, K.2010Projected effect of dietary salt reductions on future cardiovascular disease889[31]
5World Health Organization2003Diet, nutrition and the prevention of chronic diseases796[32]
6Calder, P.C.2011Dietary factors and low-grade inflammation in relation to overweight and obesity600[33]
7Wada, J.2013Inflammation and the pathogenesis of diabetic nephropathy430[34]
8Fiorentino, T.V.2013Hyperglycemia-induced Oxidative Stress and its Role in Diabetes Mellitus Related Cardiovascular Diseases401[35]
9Tanji, N.2000Expression of advanced glycation end products and their cellular receptor RAGE in diabetic nephropathy and nondiabetic renal disease390[36]
10Hall, K.D.2019Ultra-Processed Diets Cause Excess Calorie Intake and Weight Gain: An Inpatient Randomized Controlled Trial of Ad Libitum Food Intake368[37]
11Conway, G.2014The polycystic ovary syndrome: a position statement from the European Society of Endocrinology364[38]
12Donath, M.Y.1999Hyperglycemia-induced beta-cell apoptosis in pancreatic islets of Psammomys obesus during development of diabetes.352[39]
13Scuteri, A.2004Metabolic syndrome amplifies the age-associated increases in vascular thickness and stiffness348[40]
14Lontchi-Yimagou, E.2013Diabetes Mellitus and Inflammation302[41]
15Louzada, M.L.C.2015Consumption of ultra-processed foods and obesity in Brazilian adolescents and adults294[42]
Table 6. Most frequently used keywords by authors.
ClusterCo-OccurrencesLinksTotal Link StrengthAuthor Keyword
1
Red
(19 nodes)
13033195AGEs
8624132Diabetes Mellitus
6626119Oxidative stress
6523122Inflammation
582488Age receptor
5125101Insulin resistance
5134103Metabolic syndrome
462362Diabetes Mellitus, type 2
181031Biomarker
181837Glycation
14817Antioxidant
141325Atherosclerosis
141125Methylglyoxal
13711Diabetic nephropathy
121328High-fat diet
111016Aging
111425Bariatric surgery
101022PCOS
10818Skin autofluorescence
2
Green
(18 nodes)
6831105Ultra-processed food
5534107Diet
422483Overweight
402774Nutrition
302047Child
292257Adolescent
291837Dietary pattern
291943Processed food
261233Nutrition transition
252044Body mass index
191641Food consumption
161128Food processing
151228Diet quality
141432Risk factor
131024Food
12616Non-communicable diseases
101320Adult
10814Weight loss
3
Blue
(9 nodes)
31050517Obesity
161726Physical activity
151013Childhood obesity
15618Food addiction
131525Public health
121020Metabolism
111522Epidemiology
111016Food environment
1135Food policy
4
Yellow
(7 nodes)
302775Cardiovascular disease
161322Hypertension
151222Fast food
131528Hyperglycemia
11717Glucose
111016Sugar
10916Fructose
Table 7. Top 15 Co-citations of authors in references of AGEs and obesity.
RankingAuthorsCo-citationsLinksTotal Link Strength
1Monteiro, C.A.73721354,339
2Popkin, B.M.51727634,295
3Vlassara, H.49526958,763
4Schmidt, A.M.49423747,118
5Cannon, G.46420533,401
6Levy, R.B.44520432,228
7Cai, W.39227044.311
8Yamagishi, S.36923932,718
9Moubarac, J.C.33319525,603
10Uribarri, J.31924531,732
11Thornalley, P.J.28722658,303
12Takeuchi, M.24723724.424
13Hu, F.B.24229623,864
14Claro, R.M.23018115,166
15Brownlee, M.21227727,471
Table 8. Top 15 co-citations of scientific sources.
RankingSourceCitationsLinksTotal Link Strength
1Diabetes123640930,087
2Diabetes Care84542020,139
3PLoS ONE8168168106
4The American Journal of Clinical Nutrition6741239349
5Circulation66841514,980
6Nutrients6252093459
7Diabetologia58040317,875
8The Lancet571738304
9Journal of Biological Chemistry43519413,240
10Nature4311698228
11The Journal of Clinical Endocrinology and Metabolism4211747334
12The New England Journal of Medicine3643359194
13Atherosclerosis3283989055
14The Journal of Clinical Investigation3222309765
15American Journal of Clinical Nutrition1821997733
Publisher’s Note: MDPI stays neutral with regard to jurisdictional claims in published maps and institutional affiliations.

