
Differential Gene Expression of Subcutaneous Adipose Tissue among Lean, Obese, and after RYGB (Different Timepoints): Systematic Review and Analysis


 ,
,
Abstract
1. Introduction
2. Materials and Methods
2.1. Protocol and Data
2.2. Information Sources and Search Strategy
2.3. Eligibility Criteria
2.4. Study Selection
2.5. Data Collection and Risk of Bias Assessment
2.6. Synthesis Methods and Effect Measures
3. Results
3.1. Candidate Gene Approach
3.1.1. SAT Candidate Gene Differential Gene Expression between Post-RYGB vs. Obese
3.1.2. SAT Candidate Gene Differential Gene Expression between Post-RYGB or Lean vs. Obese
3.1.3. SAT Candidate Gene Differential Gene Expression between Lean vs. Obese
3.1.4. Analysis of SAT Candidate Gene Expression in Lean, Obese and Post-RYGB (Different Timepoints)

3.2. Transcriptomic Gene Approach
3.2.1. SAT Differential Gene Expression between Post-RYGB vs. Obese from Microarrays
3.2.2. SAT Differential Gene Expression between Post-RYGB or Lean vs. Obese from Microarrays
3.2.3. SAT Differential Gene Expression between Lean vs. Obese from Microarrays
4. Discussion
4.1. Candidate Gene Approach
4.2. Transcriptomic Gene Approach
4.3. Strength and Limitation of the Study
5. Conclusions
Supplementary Materials
Author Contributions
Funding
Institutional Review Board Statement
Informed Consent Statement
Data Availability Statement
Conflicts of Interest
References
- OMS Obesidad y Sobrepeso. Available online: https://www.who.int/es/news-room/fact-sheets/detail/obesity-and-overweight (accessed on 16 January 2022).
- Health Effects of Overweight and Obesity in 195 Countries over 25 Years. N. Engl. J. Med. 2017, 377, 13–27. [CrossRef] [PubMed]
- Von Schnurbein, J.; Manzoor, J.; Brandt, S.; Denzer, F.; Kohlsdorf, K.; Fischer-Posovszky, P.; Weißenberger, M.; Frank-Podlech, S.; Mahmood, S.; Wabitsch, M. Leptin Is Not Essential for Obesity-Associated Hypertension. Obes. Facts 2019, 12, 460–475. [Google Scholar] [CrossRef] [PubMed]
- Song, Z.; Xiaoli, A.M.; Yang, F. Regulation and metabolic significance of De Novo lipogenesis in adipose tissues. Nutrients 2018, 10, 1383. [Google Scholar] [CrossRef] [PubMed]
- Birsoy, K.; Festuccia, W.T.; Laplante, M. A comparative perspective on lipid storage in animals. J. Cell Sci. 2013, 126, 1541–1552. [Google Scholar] [CrossRef] [PubMed]
- Yu, B.L.; Zhao, S.P.; Hu, J.R. Cholesterol imbalance in adipocytes: A possible mechanism of adipocytes dysfunction in obesity. Obes. Rev. 2010, 11, 560–567. [Google Scholar] [CrossRef]
- Basu, S.K.; Ho, Y.K.; Brown, M.S.; Bilheimer, D.W.; Anderson, R.G.; Goldstein, J.L. Biochemical and genetic studies of the apoprotein E secreted by mouse macrophages and human monocytes. J. Biol. Chem. 1982, 257, 9788–9795. [Google Scholar] [CrossRef]
- Yamauchi, T.; Kamon, J.; Minokoshi, Y.; Ito, Y.; Waki, H.; Uchida, S.; Yamashita, S.; Noda, M.; Kita, S.; Ueki, K.; et al. Adiponectin stimulates glucose utilization and fatty-acid oxidation by activating AMP-activated protein kinase. Nat. Med. 2002, 8, 1288–1295. [Google Scholar] [CrossRef]
- Takemura, Y.; Ouchi, N.; Shibata, R.; Aprahamian, T.; Kirber, M.T.; Summer, R.S.; Kihara, S.; Walsh, K. Adiponectin modulates inflammatory reactions via calreticulin receptor-dependent clearance of early apoptotic bodies. J. Clin. Investig. 2007, 117, 375–386. [Google Scholar] [CrossRef]
- Bays, H.E.; González-Campoy, J.M.; Bray, G.A.; Kitabchi, A.E.; Bergman, D.A.; Schorr, A.B.; Rodbard, H.W.; Henry, R.R. Pathogenic potential of adipose tissue and metabolic consequences of adipocyte hypertrophy and increased visceral adiposity. Expert Rev. Cardiovasc. Ther. 2008, 6, 343–368. [Google Scholar] [CrossRef]
- Orsso, C.E.; Colin-Ramirez, E.; Field, C.J.; Madsen, K.L.; Prado, C.M.; Haqq, A.M. Adipose Tissue Development and Expansion from the Womb to Adolescence: An Overview. Nutrients 2020, 12, 2735. [Google Scholar] [CrossRef]
- Hausman, G.J.; Hausman, D.B. Search for the preadipocyte progenitor cell. J. Clin. Investig. 2006, 116, 3103–3106. [Google Scholar] [CrossRef] [PubMed]
- Herold, J.; Kalucka, J. Angiogenesis in Adipose Tissue: The Interplay Between Adipose and Endothelial Cells. Front. Physiol. 2021, 11, 624903. [Google Scholar] [CrossRef] [PubMed]
- Klöting, N.; Fasshauer, M.; Dietrich, A.; Kovacs, P.; Schön, M.R.; Kern, M.; Stumvoll, M.; Blüher, M. Insulin-sensitive obesity. Am. J. Physiol.-Endocrinol. Metab. 2010, 299, E506–E515. [Google Scholar] [CrossRef] [PubMed]
- O’Connell, J.; Lynch, L.; Cawood, T.J.; Kwasnik, A.; Nolan, N.; Geoghegan, J.; McCormick, A.; O’Farrelly, C.; O’Shea, D. The relationship of omental and subcutaneous adipocyte size to metabolic disease in severe obesity. PLoS ONE 2010, 5, e9997. [Google Scholar] [CrossRef]
- Primeau, V.; Coderre, L.; Karelis, A.D.; Brochu, M.; Lavoie, M.E.; Messier, V.; Sladek, R.; Rabasa-Lhoret, R. Characterizing the profile of obese patients who are metabolically healthy. Int. J. Obes. 2011, 35, 971–981. [Google Scholar] [CrossRef]
- Vishvanath, L.; Gupta, R.K. Contribution of adipogenesis to healthy adipose tissue expansion in obesity. J. Clin. Investig. 2019, 129, 4022–4031. [Google Scholar] [CrossRef]
- Gustafson, B.; Hedjazifar, S.; Gogg, S.; Hammarstedt, A.; Smith, U. Insulin resistance and impaired adipogenesis. Trends Endocrinol. Metab. 2015, 26, 193–200. [Google Scholar] [CrossRef]
- Lee, M.J.; Wu, Y.; Fried, S.K. Adipose tissue remodeling in pathophysiology of obesity. Curr. Opin. Clin. Nutr. Metab. Care 2010, 13, 371–376. [Google Scholar] [CrossRef]
- Sun, K.; Kusminski, C.M.; Scherer, P.E. Adipose tissue remodeling and obesity. J. Clin. Investig. 2011, 121, 2094–2101. [Google Scholar] [CrossRef]
- Ferrante, A.W. The immune cells in adipose tissue. Diabetes Obes. Metab. 2013, 15, 34–38. [Google Scholar] [CrossRef]
- Weisberg, S.P.; McCann, D.; Desai, M.; Rosenbaum, M.; Leibel, R.L.; Ferrante, A.W.J. Obesity is associated with macrophage accumulation in adipose tissue. J. Clin. Investig. 2003, 112, 1796–1808. [Google Scholar] [CrossRef] [PubMed]
- Castoldi, A.; De Souza, C.N.; Saraiva Câmara, N.O.; Moraes-Vieira, P.M. The macrophage switch in obesity development. Front. Immunol. 2016, 6, 637. [Google Scholar] [CrossRef] [PubMed]
- Unamuno, X.; Gómez-Ambrosi, J.; Rodríguez, A.; Becerril, S.; Frühbeck, G.; Catalán, V. Adipokine dysregulation and adipose tissue inflammation in human obesity. Eur. J. Clin. Investig. 2018, 48, e12997. [Google Scholar] [CrossRef] [PubMed]
- Danforth, E.J. Failure of adipocyte differentiation causes type II diabetes mellitus? Nat. Genet. 2000, 26, 13. [Google Scholar] [CrossRef]
- Vidal-Puig, A. Adipose tissue expandability, lipotoxicity and the metabolic syndrome. Endocrinol. Nutr. 2013, 60, 39–43. [Google Scholar] [CrossRef]
- Frikke-Schmidt, H.; O’Rourke, R.W.; Lumeng, C.N.; Sandoval, D.A.; Seeley, R.J. Does bariatric surgery improve adipose tissue function? Obes. Rev. 2016, 17, 795–809. [Google Scholar] [CrossRef]
- Baheeg, M.; Tag El-Din, M.; Labib, M.F.; Elgohary, S.A.; Hasan, A. Long-term durability of weight loss after bariatric surgery; a retrospective study. Int. J. Surg. Open 2021, 28, 37–40. [Google Scholar] [CrossRef]
- Arterburn, D.E.; Courcoulas, A.P. Bariatric surgery for obesity and metabolic conditions in adults. BMJ 2014, 349, g3961. [Google Scholar] [CrossRef]
- Chang, S.H.; Stoll, C.R.T.; Song, J.; Varela, J.E.; Eagon, C.J.; Colditz, G.A. The effectiveness and risks of bariatric surgery an updated systematic review and meta-analysis, 2003–2012. JAMA Surg. 2014, 149, 275–287. [Google Scholar] [CrossRef]
- Ferraz-Bannitz, R.; Welendorf, C.R.; Coelho, P.O.; Salgado, W.; Nonino, C.B.; Beraldo, R.A.; Foss-Freitas, M.C. Bariatric surgery can acutely modulate ER-stress and inflammation on subcutaneous adipose tissue in non-diabetic patients with obesity. Diabetol. Metab. Syndr. 2021, 13, 1–11. [Google Scholar] [CrossRef]
- Kerr, A.G.; Andersson, D.P.; Rydén, M.; Arner, P.; Dahlman, I. Long-term changes in adipose tissue gene expression following bariatric surgery. J. Intern. Med. 2020, 288, 219–233. [Google Scholar] [CrossRef] [PubMed]
- Ji, G.; Li, W.; Li, P.; Tang, H.; Yu, Z.; Sun, X.; Li, R.; Zhu, L.; Zhu, S. Effect of Roux-en-Y Gastric Bypass for Patients with Type 2 Diabetes Mellitus and a BMI < 32.5 kg/m2: A 6-Year Study in Chinese Patients. Obes. Surg. 2020, 30, 2631–2636. [Google Scholar] [CrossRef] [PubMed]
- Katsogiannos, P.; Kamble, P.G.; Boersma, G.J.; Karlsson, F.A.; Lundkvist, P.; Sundbom, M.; Pereira, M.J.; Eriksson, J.W. Early Changes in Adipose Tissue Morphology, Gene Expression, and Metabolism After RYGB in Patients With Obesity and T2D. J. Clin. Endocrinol. Metab. 2019, 104, 2601–2613. [Google Scholar] [CrossRef] [PubMed]
- Seridi, L.; Leo, G.C.; Lynis Dohm, G.; Pories, W.J.; Lenhard, J. Time course metabolome of Roux-en-Y gastric bypass confirms correlation between leptin, body weight and the microbiome. PLoS ONE 2018, 13, e0198156. [Google Scholar] [CrossRef]
- Hoffstedt, J.; Andersson, D.P.; Hogling, D.E.; Theorell, J.; Näslund, E.; Thorell, A.; Ehrlund, A.; Rydén, M.; Arner, P. Long-term protective changes in adipose tissue after gastric bypass. Diabetes Care 2017, 40, 77–84. [Google Scholar] [CrossRef] [PubMed]
- Page, M.J.; McKenzie, J.E.; Bossuyt, P.M.; Boutron, I.; Hoffmann, T.C.; Mulrow, C.D.; Shamseer, L.; Tetzlaff, J.M.; Akl, E.A.; Brennan, S.E.; et al. The PRISMA 2020 statement: An updated guideline for reporting systematic reviews. BMJ 2021, 372, 1–9. [Google Scholar] [CrossRef]
- McGuinness, L.A.; Higgins, J.P.T. Risk-of-bias VISualization (robvis):An R package and Shiny web app for visualizingrisk-of-bias assessments. Res. Synth. Methods 2021, 12, 55–61. [Google Scholar] [CrossRef]
- Karki, S.; Farb, M.G.; Myers, S.; Apovian, C.; Hess, D.T.; Gokce, N.; Sverdlov, A.L. Effect of Bariatric Weight Loss on the Adipose Lipolytic Transcriptome in Obese Humans. Mediat. Inflamm. 2015, 2015, 1–7. [Google Scholar] [CrossRef]
- Ortega, F.J.; Vilallonga, R.; Xifra, G.; Sabater, M.; Ricart, W.; Fernández-Real, J.M. Bariatric surgery acutely changes the expression of inflammatory and lipogenic genes in obese adipose tissue. Surg. Obes. Relat. Dis. 2016, 12, 357–362. [Google Scholar] [CrossRef]
- de Oliveira, B.A.P.; de Souza Pinhel, M.A.; Nicoletti, C.F.; de Oliveira, C.C.; Quinhoneiro, D.C.G.; Noronha, N.Y.; Fassini, P.G.; da Silva Júnior, W.A.; Junior, W.S.; Nonino, C.B. UCP2 and PLIN1 Expression Affects the Resting Metabolic Rate and Weight Loss on Obese Patients. Obes. Surg. 2017, 27, 343–348. [Google Scholar] [CrossRef]
- González-Plaza, J.J.; Gutiérrez-Repiso, C.; García-Serrano, S.; Rodriguez-Pacheco, F.; Garrido-Sánchez, L.; Santiago-Fernández, C.; García-Arnés, J.; Moreno-Ruiz, F.J.; Rodríguez-Cañete, A.; García-Fuentes, E. Effect of Roux-en-Y gastric bypass-induced weight loss on the transcriptomic profiling of subcutaneous adipose tissue. Surg. Obes. Relat. Dis. 2016, 12, 257–263. [Google Scholar] [CrossRef] [PubMed]
- González-Plaza, J.J.; Santiago-Fernández, C.; Gutiérrez-Repiso, C.; García-Serrano, S.; Rodriguez-Pacheco, F.; Ho-Plagaro, A.; Garrido-Sánchez, L.; Moreno-Ruiz, F.J.; Rodríguez-Cañete, A.; García-Fuentes, E. The changes in the transcriptomic profiling of subcutaneous adipose tissue after bariatric surgery depend on the insulin resistance state. Surg. Obes. Relat. Dis. 2018, 14, 1182–1191. [Google Scholar] [CrossRef] [PubMed]
- Latorre, J.; Moreno-Navarrete, J.M.; Sabater, M.; Buxo, M.; Rodriguez-Hermosa, J.I.; Girones, J.; Fort, J.M.; Vilallonga, R.; Ricart, W.; Simo, R.; et al. Decreased TLR3 in Hyperplastic Adipose Tissue, Blood and Inflamed Adipocytes is Related to Metabolic Inflammation. Cell. Physiol. Biochem. 2018, 51, 1051–1068. [Google Scholar] [CrossRef] [PubMed]
- Liu, Y.; Aron-Wisnewsky, J.; Marcelin, G.; Genser, L.; Le Naour, G.; Torcivia, A.; Bauvois, B.; Bouchet, S.; Pelloux, V.; Sasso, M.; et al. Accumulation and Changes in Composition of Collagens in Subcutaneous Adipose Tissue After Bariatric Surgery. J. Clin. Endocrinol. Metab. 2016, 101, 293–304. [Google Scholar] [CrossRef] [PubMed]
- Jahansouz, C.; Serrot, F.J.; Frohnert, B.I.; Foncea, R.E.; Dorman, R.B.; Slusarek, B.; Leslie, D.B.; Bernlohr, D.A.; Ikramuddin, S. Roux-en-Y Gastric Bypass Acutely Decreases Protein Carbonylation and Increases Expression of Mitochondrial Biogenesis Genes in Subcutaneous Adipose Tissue. Obes. Surg. 2015, 25, 2376–2385. [Google Scholar] [CrossRef][Green Version]
- Jürets, A.; Itariu, B.K.; Keindl, M.; Prager, G.; Langer, F.; Grablowitz, V.; Zeyda, M.; Stulnig, T.M. Upregulated TNF Expression 1 Year After Bariatric Surgery Reflects a Cachexia-Like State in Subcutaneous Adipose Tissue. Obes. Surg. 2017, 27, 1514–1523. [Google Scholar] [CrossRef]
- Ortega, F.J.; Mercader, J.M.; Moreno-Navarrete, J.M.; Nonell, L.; Puigdecanet, E.; Rodriquez-Hermosa, J.I.; Rovira, O.; Xifra, G.; Guerra, E.; Moreno, M.; et al. Surgery-Induced Weight Loss Is Associated With the Downregulation of Genes Targeted by MicroRNAs in Adipose Tissue. J. Clin. Endocrinol. Metab. 2015, 100, E1467–E1476. [Google Scholar] [CrossRef]
- Petrus, P.; Mejhert, N.; Corrales, P.; Lecoutre, S.; Li, Q.; Maldonado, E.; Kulyté, A.; Lopez, Y.; Campbell, M.; Acosta, J.R.; et al. Transforming Growth Factor-β3 Regulates Adipocyte Number in Subcutaneous White Adipose Tissue. Cell Rep. 2018, 25, 551–560. [Google Scholar] [CrossRef]
- Matulewicz, N.; Stefanowicz, M.; Nikołajuk, A.; Karczewska-Kupczewska, M. Markers of Adipogenesis, but Not Inflammation, in Adipose Tissue Are Independently Related to Insulin Sensitivity. J. Clin. Endocrinol. Metab. 2017, 102, 3040–3049. [Google Scholar] [CrossRef]
- Ronquillo, M.; Mellnyk, A.; Cárdenas-Rodríguez, N.; Martínez, E.; Comoto, D.; Carmona-Aparicio, L.; Herrera, N.; Lara, E.; Pereyra, A.; Floriano-Sánchez, E. Different gene expression profiles in subcutaneous & visceral adipose tissues from Mexican patients with obesity. Indian J. Med. Res. 2019, 149, 616–626. [Google Scholar] [CrossRef]
- Badoud, F.; Brewer, D.; Charchoglyan, A.; Cuthbertson, D.J.; Mutch, D.M. Multi-omics Integrative Investigation of Fatty Acid Metabolism in Obese and Lean Subcutaneous Tissue. Omi. A J. Integr. Biol. 2017, 21, 371–379. [Google Scholar] [CrossRef] [PubMed]
- Liu, D.F.; Ma, Z.Y.; Zhang, C.S.; Lin, Q.; Li, M.W.; Su, K.Z.; Dong, J. The effects of bariatric surgery on dyslipidemia and insulin resistance in overweight patients with or without type 2 diabetes: A systematic review and network meta-analysis. Surg. Obes. Relat. Dis. 2021, 17, 1655–1672. [Google Scholar] [CrossRef] [PubMed]
- Eissing, L.; Scherer, T.; Tödter, K.; Knippschild, U.; Greve, J.W.; Buurman, W.A.; Pinnschmidt, H.O.; Rensen, S.S.; Wolf, A.M.; Bartelt, A.; et al. De novo lipogenesis in human fat and liver is linked to ChREBP-β and metabolic health. Nat. Commun. 2013, 4, 1–11. [Google Scholar] [CrossRef] [PubMed]
- Kraus, D.; Yang, Q.; Kong, D.; Banks, A.S.; Zhang, L.; Rodgers, J.T.; Pirinen, E.; Pulinilkunnil, T.C.; Gong, F.; Wang, Y.C.; et al. Nicotinamide N-methyltransferase knockdown protects against diet-induced obesity. Nature 2014, 508, 258–262. [Google Scholar] [CrossRef] [PubMed]
- Poletto, A.C.; David-Silva, A.; de Yamamoto, A.P.M.; Machado, U.F.; Furuya, D.T. Reduced Slc2a4/GLUT4 expression in subcutaneous adipose tissue of monosodium glutamate obese mice is recovered after atorvastatin treatment. Diabetol. Metab. Syndr. 2015, 7, 1–6. [Google Scholar] [CrossRef] [PubMed]
- Yan, Y.; Sha, Y.; Yao, G.; Wang, S.; Kong, F.; Liu, H.; Zhang, G.; Zhang, H.; Hu, C.; Zhang, X. Roux-en-Y Gastric Bypass Versus Medical Treatment for Type 2 Diabetes Mellitus in Obese Patients: A Systematic Review and Meta-Analysis of Randomized Controlled Trials. Medicine 2016, 95, e3462. [Google Scholar] [CrossRef] [PubMed]
- Zhan, T.; Poppelreuther, M.; Ehehalt, R.; Füllekrug, J. Overexpressed FATP1, ACSVL4/FATP4 and ACSL1 Increase the Cellular Fatty Acid Uptake of 3T3-L1 Adipocytes but Are Localized on Intracellular Membranes. PLoS ONE 2012, 7, e45087. [Google Scholar] [CrossRef]
- Long, K.R.; Ma, J.D.; Chen, L.; Wang, P.J.; He, D.F.; Li, M.Z.; Li, X.W. Promoter and first exon methylation regulate porcine FASN gene expression. Genet. Mol. Res. 2015, 14, 8443–8450. [Google Scholar] [CrossRef]
- Méndez-Giménez, L.; Becerril, S.; Moncada, R.; Valentí, V.; Fernández, S.; Ramírez, B.; Catalán, V.; Gómez-Ambrosi, J.; Soveral, G.; Malagón, M.M.; et al. Gastric Plication Improves Glycemia Partly by Restoring the Altered Expression of Aquaglyceroporins in Adipose Tissue and the Liver in Obese Rats. Obes. Surg. 2017, 27, 1763–1774. [Google Scholar] [CrossRef]
- Rodríguez, A.; Gena, P.; Méndez-Giménez, L.; Rosito, A.; Valentí, V.; Rotellar, F.; Sola, I.; Moncada, R.; Silva, C.; Svelto, M.; et al. Reduced hepatic aquaporin-9 and glycerol permeability are related to insulin resistance in non-alcoholic fatty liver disease. Int. J. Obes. 2014, 38, 1213–1220. [Google Scholar] [CrossRef]
- Medina-Gomez, G.; Gray, S.L.; Yetukuri, L.; Shimomura, K.; Virtue, S.; Campbell, M.; Curtis, R.K.; Jimenez-Linan, M.; Blount, M.; Yeo, G.S.H.; et al. PPAR gamma 2 prevents lipotoxicity by controlling adipose tissue expandability and peripheral lipid metabolism. PLoS Genet. 2007, 3, 0634–0647. [Google Scholar] [CrossRef] [PubMed]
- Kadowaki, T.; Yamauchi, T.; Kubota, N.; Hara, K.; Ueki, K. Adiponectin and adiponectin receptors in obesity-linked insulin resistance. Novartis Found. Symp. 2007, 286, 164–203. [Google Scholar] [CrossRef] [PubMed]
- Kawai, T.; Autieri, M.V.; Scalia, R. Adipose tissue inflammation and metabolic dysfunction in obesity. Am. J. Physiol. Cell Physiol. 2021, 320, C375–C391. [Google Scholar] [CrossRef]
- Guebre-Egziabher, F.; Debard, C.; Drai, J.; Denis, L.; Pesenti, S.; Bienvenu, J.; Vidal, H.; Laville, M.; Fouque, D. Differential dose effect of fish oil on inflammation and adipose tissue gene expression in chronic kidney disease patients. Nutrition 2013, 29, 730–736. [Google Scholar] [CrossRef] [PubMed]
- Moreno-Navarrete, J.M.; Latorre, J.; Lluch, A.; Ortega, F.J.; Comas, F.; Arnoriaga-Rodríguez, M.; Ricart, W.; Fernández-Real, J.M. Lysozyme is a component of the innate immune system linked to obesity associated-chronic low-grade inflammation and altered glucose tolerance. Clin. Nutr. 2021, 40, 1420–1429. [Google Scholar] [CrossRef] [PubMed]
- Braune, J.; Weyer, U.; Hobusch, C.; Mauer, J.; Brüning, J.C.; Bechmann, I.; Gericke, M. IL-6 Regulates M2 Polarization and Local Proliferation of Adipose Tissue Macrophages in Obesity. J. Immunol. 2017, 198, 2927–2934. [Google Scholar] [CrossRef] [PubMed]
- Challier, J.C.; Basu, S.; Bintein, T.; Minium, J.; Hotmire, K.; Catalano, P.M.; Hauguel-de Mouzon, S. Obesity in Pregnancy Stimulates Macrophage Accumulation and Inflammation in the Placenta. Placenta 2008, 29, 274–281. [Google Scholar] [CrossRef]
- Hotamisligil, G.S.; Shargill, N.S.; Spiegelman, B.M. Adipose expression of tumor necrosis factor-α: Direct role in obesity-linked insulin resistance. Science 1993, 259, 87–91. [Google Scholar] [CrossRef]
- Tzanavari, T.; Giannogonas, P.; Karalis, K.P. TNF-α and obesity. Curr. Dir. Autoimmun. 2010, 11, 145–156. [Google Scholar] [CrossRef]
- Di Gregorio, G.B.; Hensley, L.; Lu, T.; Ranganathan, G.; Kern, P.A. Lipid and carbohydrate metabolism in mice with a targeted mutation in the IL-6 gene: Absence of development of age-related obesity. Am. J. Physiol. Endocrinol. Metab. 2004, 287, E182–E187. [Google Scholar] [CrossRef]
- Latorre, J.; Lluch, A.; Ortega, F.J.; Gavaldà-Navarro, A.; Comas, F.; Morón-Ros, S.; Rodríguez, A.; Becerril, S.; Villarroya, F.; Frühbeck, G.; et al. Adipose tissue knockdown of lysozyme reduces local inflammation and improves adipogenesis in high-fat diet-fed mice. Pharmacol. Res. 2021, 166, 105486. [Google Scholar] [CrossRef] [PubMed]
- Campbell, K.L.; Landells, C.E.; Fan, J.; Brenner, D.R. A Systematic Review of the Effect of Lifestyle Interventions on Adipose Tissue Gene Expression: Implications for Carcinogenesis. Obesity 2017, 25, S40–S51. [Google Scholar] [CrossRef] [PubMed]
- Zechner, R.; Moser, R.; Newman, T.C.; Fried, S.K.; Breslow, J.L. Apolipoprotein E gene expression in mouse 3T3-L1 adipocytes and human adipose tissue and its regulation by differentiation and lipid content. J. Biol. Chem. 1991, 266, 10583–10588. [Google Scholar] [CrossRef]
- Ewart, M.A.; Kennedy, S.; MacMillan, D.; Raja, A.L.N.; Watt, I.M.; Currie, S. Altered vascular smooth muscle function in the ApoE knockout mouse during the progression of atherosclerosis. Atherosclerosis 2014, 234, 154–161. [Google Scholar] [CrossRef] [PubMed]
- Lasrich, D.; Bartelt, A.; Grewal, T.; Heeren, J. Apolipoprotein E promotes lipid accumulation and differentiation in human adipocytes. Exp. Cell Res. 2015, 337, 94–102. [Google Scholar] [CrossRef] [PubMed]
- Kim, S.J.; Choi, Y.; Choi, Y.H.; Park, T. Obesity activates toll-like receptor-mediated proinflammatory signaling cascades in the adipose tissue of mice. J. Nutr. Biochem. 2012, 23, 113–122. [Google Scholar] [CrossRef] [PubMed]
- Ahmad, R.; Kochumon, S.; Thomas, R.; Atizado, V.; Sindhu, S. Increased adipose tissue expression of TLR8 in obese individuals with or without type-2 diabetes: Significance in metabolic inflammation. J. Inflamm. 2016, 13, 1–15. [Google Scholar] [CrossRef][Green Version]
- Horrillo, R.; González-Périz, A.; Martínez-Clemente, M.; López-Parra, M.; Ferré, N.; Titos, E.; Morán-Salvador, E.; Deulofeu, R.; Arroyo, V.; Clària, J. 5-Lipoxygenase Activating Protein Signals Adipose Tissue Inflammation and Lipid Dysfunction in Experimental Obesity. J. Immunol. 2010, 184, 3978–3987. [Google Scholar] [CrossRef]
- Kauts, M.L.; Pihelgas, S.; Orro, K.; Neuman, T.; Piirsoo, A. CCL5/CCR1 axis regulates multipotency of human adipose tissue derived stromal cells. Stem Cell Res. 2013, 10, 166–178. [Google Scholar] [CrossRef]
- Sindhu, S.; Kochumon, S.; Thomas, R.; Bennakhi, A.; Al-Mulla, F.; Ahmad, R. Enhanced Adipose Expression of Interferon Regulatory Factor (IRF)-5 Associates with the Signatures of Metabolic Inflammation in Diabetic Obese Patients. Cells 2020, 9, 730. [Google Scholar] [CrossRef]
- Ganz, T. The role of antimicrobial peptides in innate immunity. Integr. Comp. Biol. 2003, 43, 300–304. [Google Scholar] [CrossRef] [PubMed]
- Wang, J.; Yang, L.; Liang, F.; Chen, Y.; Yang, G. Integrin alpha x stimulates cancer angiogenesis through PI3K/Akt signaling–mediated VEGFR2/VEGF-A overexpression in blood vessel endothelial cells. J. Cell. Biochem. 2019, 120, 1807–1818. [Google Scholar] [CrossRef] [PubMed]
- Kong, X.; Liao, Y.; Zhou, L.; Zhang, Y.; Cheng, J.; Yuan, Z.; Wang, S. Hematopoietic Cell Kinase (HCK) Is Essential for NLRP3 Inflammasome Activation and Lipopolysaccharide-Induced Inflammatory Response In Vivo. Front. Pharmacol. 2020, 11, 581011. [Google Scholar] [CrossRef] [PubMed]
- Choi, K.S.; Jun, H.S.; Kim, H.N.; Park, H.J.; Eom, Y.W.; Noh, H.L.; Kwon, H.; Kim, H.M.; Yoon, J.W. Role of Hck in the Pathogenesis of Encephalomyocarditis Virus-Induced Diabetes in Mice. J. Virol. 2001, 75, 1949–1957. [Google Scholar] [CrossRef] [PubMed]
- Zhao, Y.; Lin, L.; Li, J.; Xiao, Z.; Chen, B.; Wan, L.; Li, M.; Wu, X.; Hin Cho, C.; Shen, J. CD4+ T cells in obesity and obesity-associated diseases. Cell Immunol. 2018, 332, 1–6. [Google Scholar] [CrossRef]
- Pecht, T.; Gutman-Tirosh, A.; Bashan, N.; Rudich, A. Peripheral blood leucocyte subclasses as potential biomarkers of adipose tissue inflammation and obesity subphenotypes in humans. Obes. Rev. 2014, 15, 322–337. [Google Scholar] [CrossRef]
- Peckert-Maier, K.; Royzman, D.; Langguth, P.; Marosan, A.; Strack, A.; Sadeghi Shermeh, A.; Steinkasserer, A.; Zinser, E.; Wild, A.B. Tilting the Balance: Therapeutic Prospects of CD83 as a Checkpoint Molecule Controlling Resolution of Inflammation. Int. J. Mol. Sci. 2022, 23, 732. [Google Scholar] [CrossRef]
- Hoggard, N.; Cruickshank, M.; Moar, K.M.; Bashir, S.; Mayer, C.D. Using gene expression to predict differences in the secretome of human omental vs. subcutaneous adipose tissue. Obesity 2012, 20, 1158–1167. [Google Scholar] [CrossRef]
- Liu, Y.; Jin, J.; Chen, Y.; Chen, C.; Chen, Z.; Xu, L. Integrative analyses of biomarkers and pathways for adipose tissue after bariatric surgery. Adipocyte 2020, 9, 384–400. [Google Scholar] [CrossRef]
- Chen, S.; Jiang, Y.; Qi, X.; Song, P.; Tang, L.; Liu, H. Bioinformatics analysis to obtain critical genes regulated in subcutaneous adipose tissue after bariatric surgery. Adipocyte 2022, 11, 550–561. [Google Scholar] [CrossRef]


| Pathways | Gene Abbreviation | Gene Name |
|---|---|---|
| Glucose metabolism | IRS-1 | Insulin Receptor Substrate 1 |
| GLUT4 | Solute Carrier Family 2 Member 4 | |
| Lipids metabolism | ACSL1 | Acyl-CoA Synthetase Long Chain Family Member 1 |
| FASN | Fatty Acid Synthase | |
| AQP9 | Aquaporin 9 | |
| PPARG | Peroxisome Proliferator Activated Receptor Gamma | |
| Endocrine function | ADIPOQ | Adiponectin |
| Inflammation | CD68 | Antigen CD68 |
| IL-6 | Interleukin 6 | |
| TNFα | Tumor Necrosis Factor | |
| LYZ | Lysozyme |
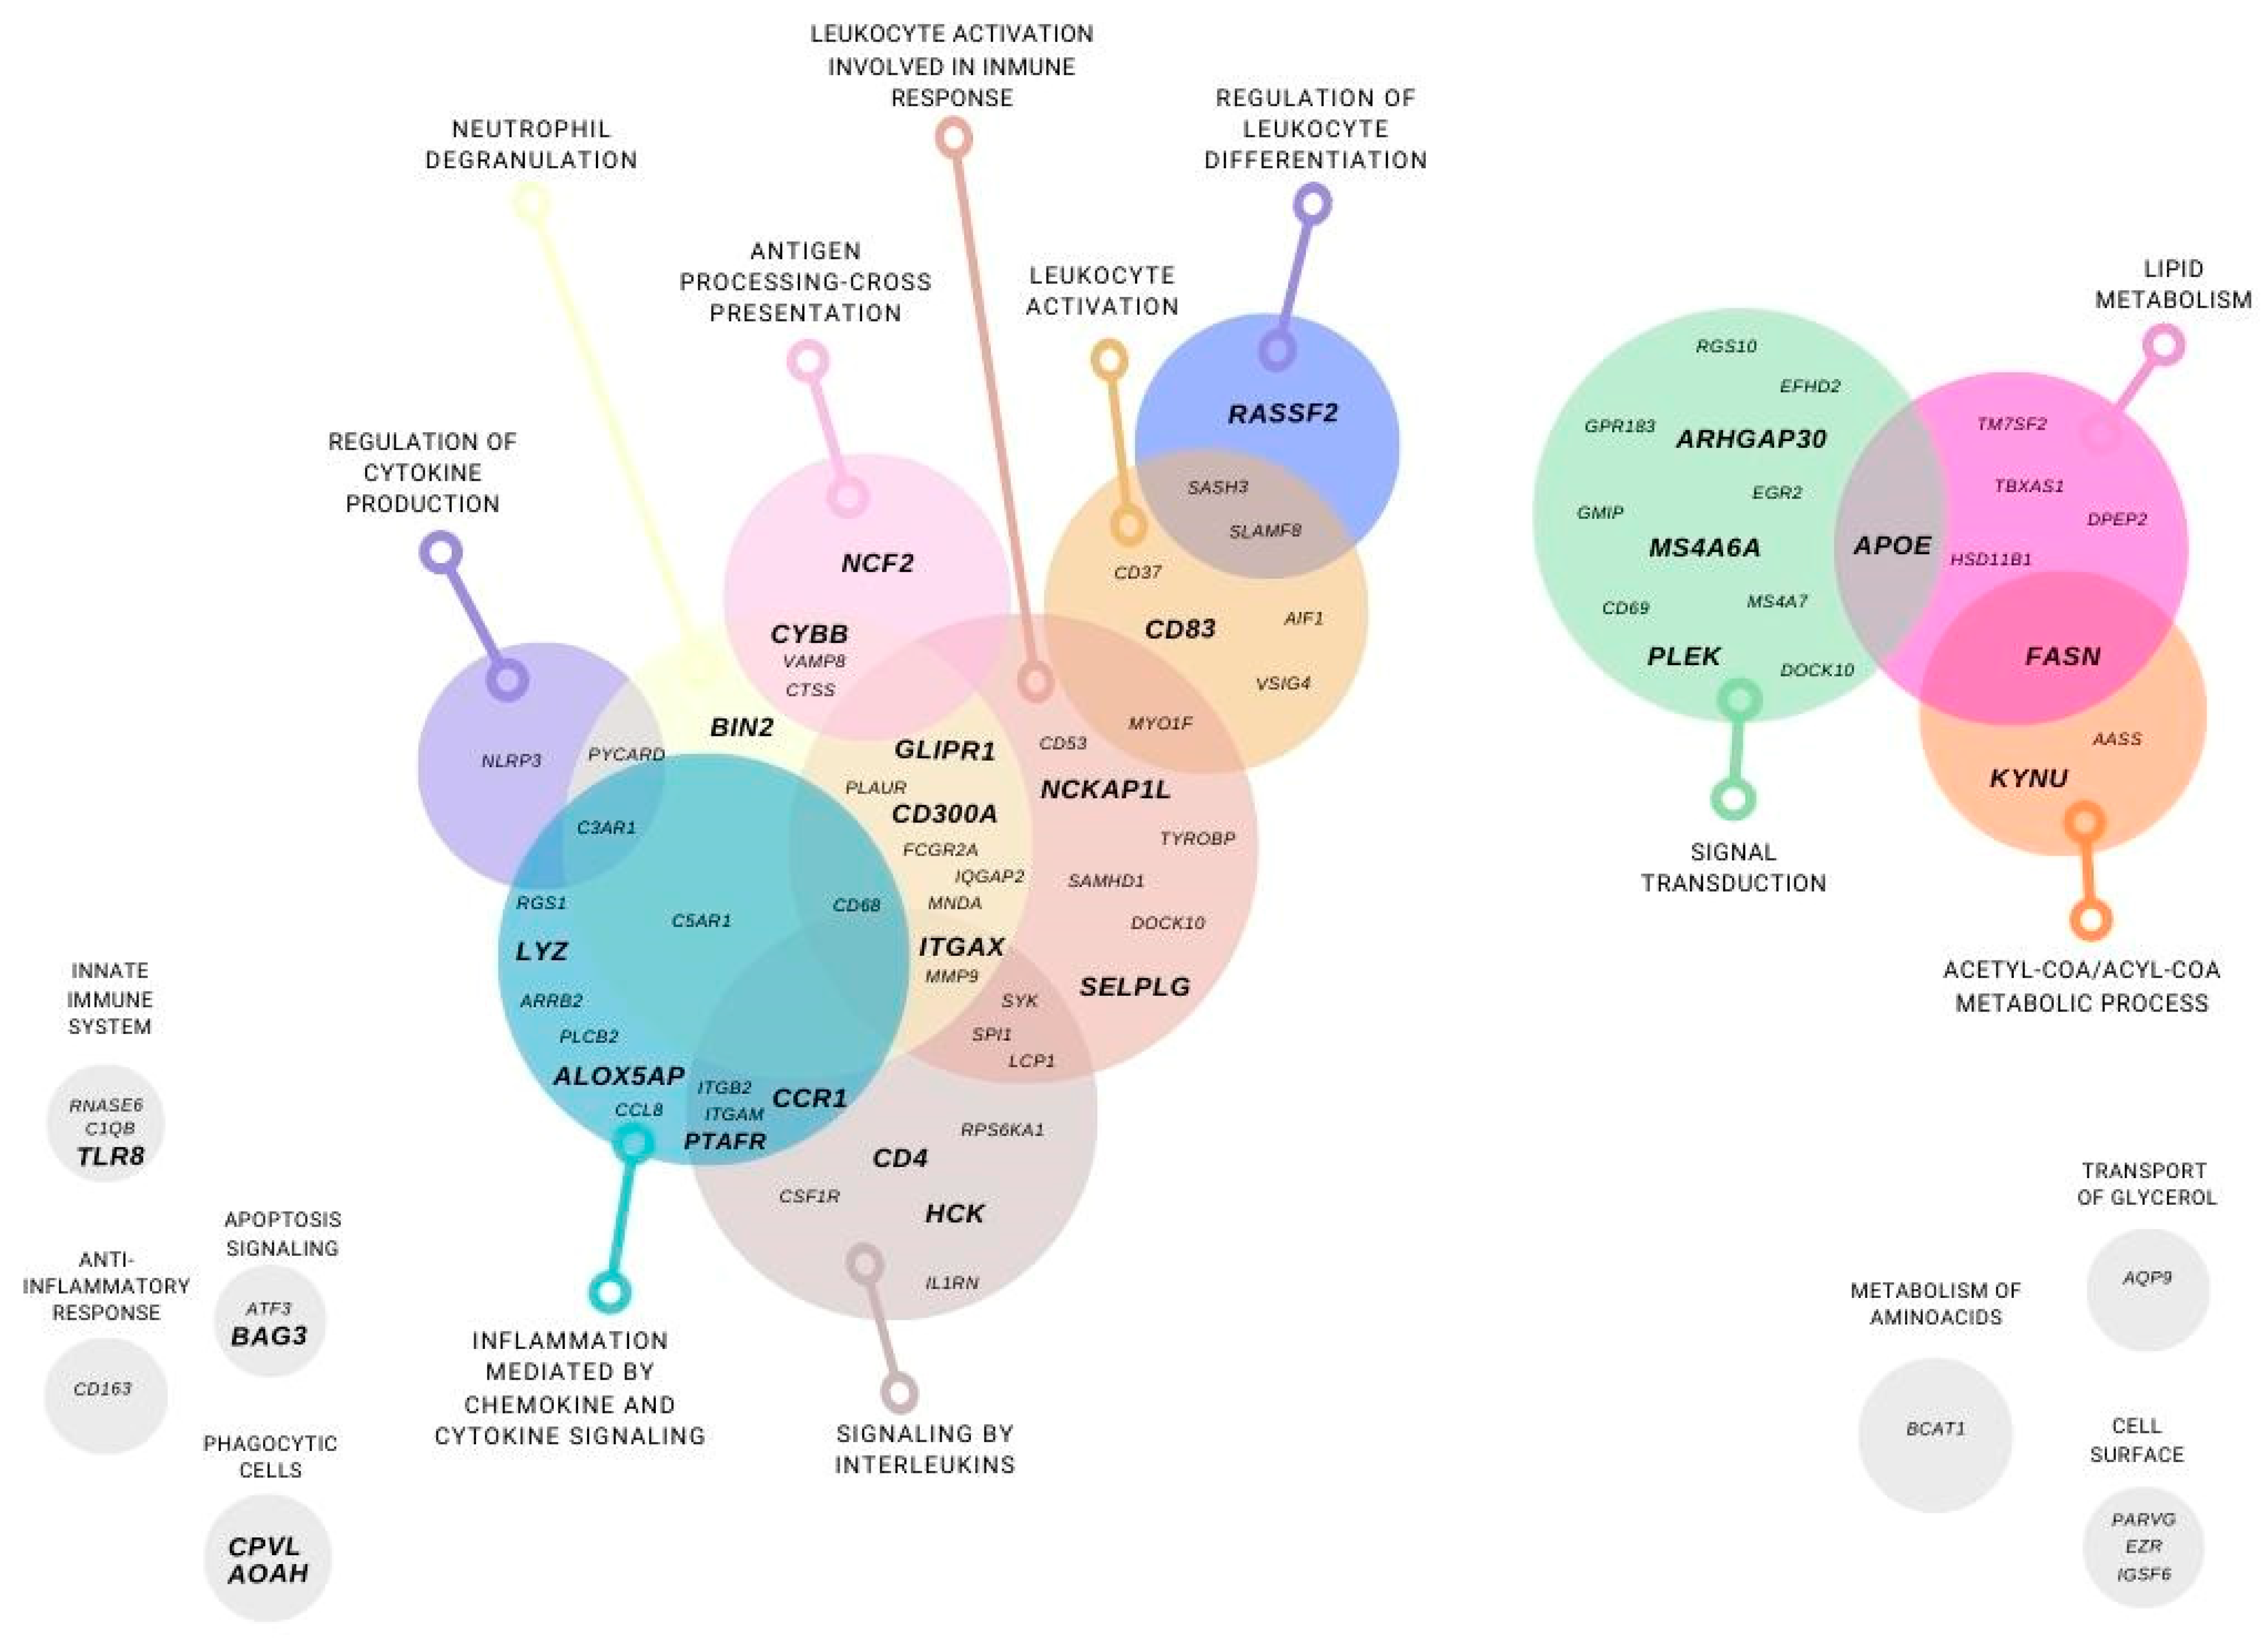
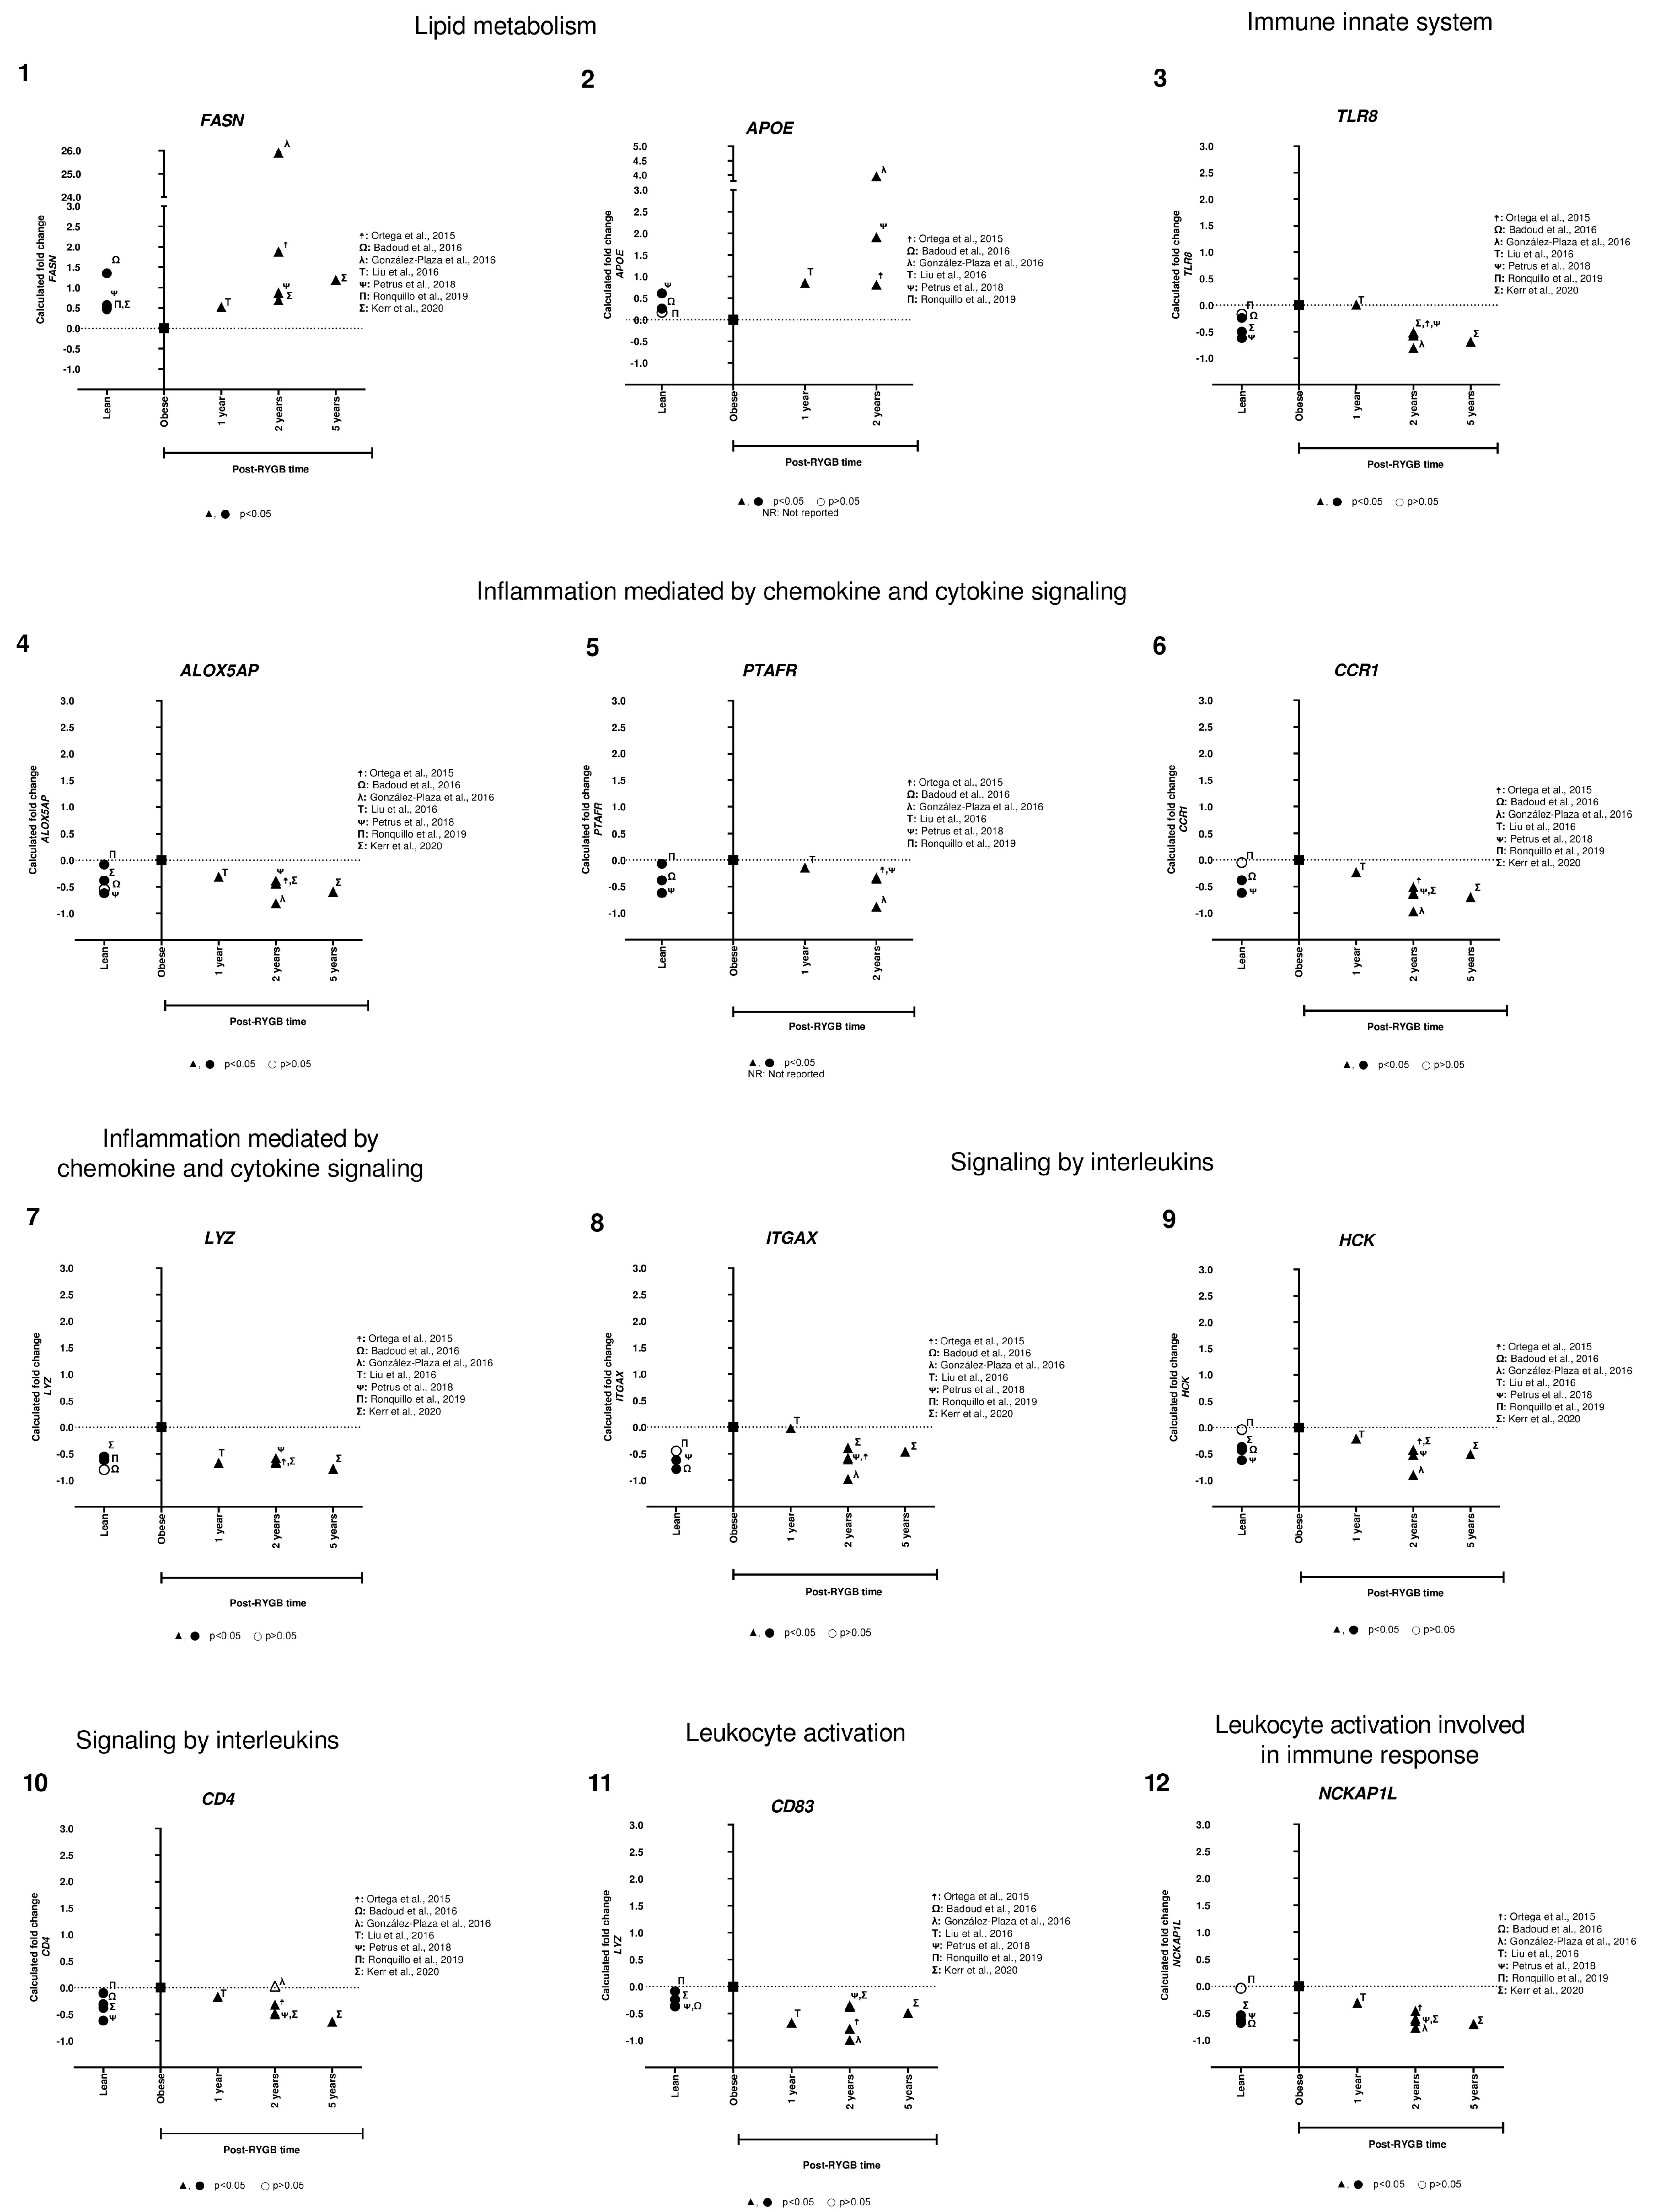
| Pathways | Gene Abbreviation | Gene Name |
|---|---|---|
| Lipids metabolism | FASN | Fatty Acid Synthase |
| APOE | Apolipoprotein E | |
| Innate immune system | TLR8 | Toll like receptor 8 |
| Inflammation mediated by chemokine and cytokine signaling pathway | ALOX5AP | Arachidonate 5-lipoxygenase activating protein |
| PTAFR | Platelet activating factor receptor | |
| CCR1 | Chemokine, cc motif, receptor 1 | |
| LYZ | Lysozyme | |
| Signaling by interleukins | ITGAX | Integrin Subunit Alpha X |
| HCK | HCK proto-oncogene, Src family tyrosine kinase | |
| CD4 | Antigen CD4 | |
| Leukocyte activation | CD83 | Antigen CD83 |
| Leukocyte activation involved in immune response | NCKAP1L | NCK Associated Protein 1 Like |
| SELPLG | Selectin P ligand | |
| Regulation of leukocyte differentiation | RASSF2 | Ras association domain family member 2 |
| Antigen processing-cross presentation | NCF2 | Neutrophil cytosolic factor 2 |
| CYBB | Cytochrome b (−245), beta subunit | |
| Neutrophil degranulation | BIN2 | Bridging Integrator 2 |
| CD300A | CD300a molecule | |
| GLIPR1 | Glioma pathogenesis-related protein 1 | |
| Phagocytic cells | CPVL | Carboxypeptidase Vitellogenic Like |
| AOAH | Acyloxyacyl hydrolase | |
| Apoptosis signaling pathway | BAG3 | BAG cochaperone 3 |
| Signaling transduction | ARHGAP30 | Rho GTPase activating protein 30 |
| MS4A6A | Membrane-spanning 4-domains, subfamily A, member 6A | |
| PLEK | Pleckstrin | |
| Acetyl-CoA/Acyl-CoA metabolic process | KYNU | Kynureninase |
Publisher’s Note: MDPI stays neutral with regard to jurisdictional claims in published maps and institutional affiliations. |
© 2022 by the authors. Licensee MDPI, Basel, Switzerland. This article is an open access article distributed under the terms and conditions of the Creative Commons Attribution (CC BY) license (https://creativecommons.org/licenses/by/4.0/).
Share and Cite
Cruz-García, E.M.; Frigolet, M.E.; Canizales-Quinteros, S.; Gutiérrez-Aguilar, R. Differential Gene Expression of Subcutaneous Adipose Tissue among Lean, Obese, and after RYGB (Different Timepoints): Systematic Review and Analysis. Nutrients 2022, 14, 4925. https://doi.org/10.3390/nu14224925
Cruz-García EM, Frigolet ME, Canizales-Quinteros S, Gutiérrez-Aguilar R. Differential Gene Expression of Subcutaneous Adipose Tissue among Lean, Obese, and after RYGB (Different Timepoints): Systematic Review and Analysis. Nutrients. 2022; 14(22):4925. https://doi.org/10.3390/nu14224925
Chicago/Turabian StyleCruz-García, Elena Marisol, María E. Frigolet, Samuel Canizales-Quinteros, and Ruth Gutiérrez-Aguilar. 2022. "Differential Gene Expression of Subcutaneous Adipose Tissue among Lean, Obese, and after RYGB (Different Timepoints): Systematic Review and Analysis" Nutrients 14, no. 22: 4925. https://doi.org/10.3390/nu14224925
APA StyleCruz-García, E. M., Frigolet, M. E., Canizales-Quinteros, S., & Gutiérrez-Aguilar, R. (2022). Differential Gene Expression of Subcutaneous Adipose Tissue among Lean, Obese, and after RYGB (Different Timepoints): Systematic Review and Analysis. Nutrients, 14(22), 4925. https://doi.org/10.3390/nu14224925