Article

Effects of Intestinal Bacterial Hydrogen Gas Production on Muscle Recovery following Intense Exercise in Adult Men: A Pilot Study

1
Waseda Institute for Sport Sciences, Waseda University, Tokorozawa 359-1192, Japan
2
Department of Fundamental Education, Dokkyo Medical University, Tochigi 321-0293, Japan
3
Dairy Science and Technology Institute, Kyodo Milk Industry Co., Ltd., 20-1 Hirai, Hinode 190-0182, Japan
4
Faculty of Sport Sciences, Waseda University, Tokorozawa 359-1192, Japan
5
Japan Institute of Sports Sciences, Kita-ku, Tokyo 115-0056, Japan
*
Author to whom correspondence should be addressed.
These authors contributed equally to this work.
Current address: Faculty of International Agriculture and Food Studies, Tokyo University of Agriculture, Tokyo 156-8502, Japan.
Nutrients 2022, 14(22), 4875; https://doi.org/10.3390/nu14224875
Submission received: 21 August 2022 / Revised: 9 November 2022 / Accepted: 14 November 2022 / Published: 18 November 2022
(This article belongs to the Section Sports Nutrition)

Abstract

:
This study aimed to examine the effects of hydrogen gas (H2) produced by intestinal microbiota on participant conditioning to prevent intense exercise-induced damage. In this double-blind, randomized, crossover study, participants ingested H2-producing milk that induced intestinal bacterial H2 production or a placebo on the trial day, 4 h before performing an intense exercise at 75% maximal oxygen uptake for 60 min. Blood marker levels and respiratory variables were measured before, during, and after exercise. Visual analog scale scores of general and lower limb muscle soreness evaluated were 3.8- and 2.3-fold higher, respectively, on the morning after treatment than that before treatment during the placebo trial, but not during the test beverage consumption. Urinary 8-hydroxy-2′-deoxyguanosine (8-OHdG) concentrations and production rates significantly increased with placebo consumption; no changes were observed with test beverage consumption. After exercise, relative blood lactate levels with H2-producing milk consumption were lower than those with placebo consumption. A negative correlation was observed between the variation of 8-OHdG and the area under the curve (AUC) of breath H2 concentrations. Lipid oxidation AUC was 1.3-fold higher significantly with H2-producing milk than with placebo consumption. Conclusively, activating intestinal bacterial H2 production by consuming a specific beverage may be a new strategy for promoting recovery and conditioning in athletes frequently performing intense exercises.

1. Introduction

During exercise, oxygen consumption in active tissues noticeably increases and followed by an increase in reactive oxygen species (ROS) production [1,2]. Although ROS produced by regular moderate training have physiological roles, such as modulating cellular signaling pathways and controlling numerous redox-sensitive transcription factors, ROS overproduction by acute and strenuous bouts of aerobic exercise cause oxidative damage of lipids, proteins, and DNA [3], which leads to delayed recovery from muscle damage and fatigue, reduced muscle contractility, inflammation, and immune deficiency [4,5]. Normally, antioxidant defense systems are upregulated and the high levels of oxidative stress markers decrease with time after acute exercise; however, extreme intense exercise can induce high baseline oxidative stress markers and low plasma antioxidant capacity for more than 1 month [6]. As such, reducing or quickly eliminating the excessive ROS generated by acute intense exercise is important for athletic conditioning.
Since it was discovered in 2007 that hydrogen gas (H2) has selective antioxidant properties [7], multiple studies have shown that H2 has beneficial effects in diverse animal models and human disease. For example, H2 supplementation positively affects numerous biological phenomena, including inflammation, allergies, and metabolic syndrome [8]. In sports science, the antioxidative effects of H2 on athletes who repeatedly perform high-intensity exercise have been demonstrated [9]. The intake of H2 induces improvements in exercise performance [10,11] and recovery from muscle inflammation and fatigue [12,13]. Furthermore, H2 supplementation has been shown to enhance fatty acid metabolism [14].
H2-rich water ingestion has been the primary method of supplying H2 to the body. H2-rich water and saline can be easily administered; however, ingested H2 obtained through this method remains in the body for approximately 20–30 min [15,16]. When indigestible dietary fiber reaches the large intestine, the intestinal bacteria utilize it to produce H2, short-chain fatty acids, carbon dioxide, and other substances [17]. Subsequently, H2 is dispersed systemically via the portal circulation [18,19]. A beverage comprising cow milk and indigestible dietary fiber was developed to enable H2 production in the colon of most Japanese individuals, irrespective of personal differences in the intestinal microbiota [16]. Therefore, this study investigated the effect of H2-producing milk and intestinal microbiota-derived H2 on muscle damage, antioxidant activity, and energy metabolism recovery after high-intensity exercise.

2. Materials and Methods

2.1. Participants

Participants were provided with detailed explanations of the risks, inconveniences, and potential benefits of the study before signing an informed consent form. All participants who had completed a comprehensive medical examination within the preceding year were recruited at Waseda University for 1 month (October 2017). Participants with milk allergy, lactose intolerance, and those without intestinal H2 production after test beverage (H2-producing milk) ingestion were excluded. This study was approved by the Ethics Committee on Human Research of Waseda University (#2017-092) and was conducted in accordance with the principles of the Declaration of Helsinki.

2.2. Experimental Protocol

All study participants were involved in two trials. The first and second trials involved test beverage and placebo ingestions, respectively, before exercise. This study had a double-blind, randomized, crossover design (Trial registration: UMIN000029238). Participants and observers were blinded to the assignment throughout the trial period. Double-blinding was achieved by labeling the test beverage with an identification number only, and randomization was based on a table of random numbers. Participants underwent the trials at the same time of the day with intervals of >5 days in the Tokorozawa campus of Waseda University. They consumed the prescribed diets, which did not produce H2 during digestion, excluding test beverages, at 8:00 pm the night before the trial date and at 9:00 am, 10:30 am, and 8:00 pm on the day of the trial. No food or fluids, except mineral water, were consumed until after the measurements were performed in the morning after the trial. Participants ingested the test beverage or placebo at 9:00 am on the day of trial, 4 h before performing the exercise. They performed a pedaling exercise at 75% maximal oxygen uptake (VO2max) for 60 min in a climate-controlled room with a temperature of 21 °C and 50% relative humidity. During exercise, the pedaling rate was maintained at 60 revolutions per minute (rpm). Measurements were performed before, immediately after, 30 min after, and 60 min after exercise and the morning after the trial. After the completion of the trial, participants were interviewed to confirm appropriate test beverages and diet intake and the maintenance of their usual routine activities.

2.3. Preparation of the Test Beverage

H2-producing milk was prepared by adding galacto-oligosaccharide (2 g), maltitol (2 g), and glucomannan (0.2 g) together, which are active ingredients that produce intestinal H2 in cow’s milk, as described in our previous report [20]. Details are described in the Supplementary Methods. These beverages had the same color and taste and were packed separately into unlabeled pots. A questionnaire was used to ascertain whether participants were aware of the allocation.

2.4. Determination of VO2max

Participants performed a pedaling exercise on a cycle ergometer (AEROBIKE75XLII; Combi Wellness, Tokyo, Japan) at least 1 week before the trial to determine the VO2max. After a standardized warm-up for 3 min, the protocol began at 90 W and was increased by 15 W/min until volitional exhaustion [21]. During the test, the respiratory gas levels were analyzed using a pre-calibrated automatic gas analyzer (AE-310s; Minato Medical Science, Tokyo, Japan). The heart rate (HR) was monitored continuously using an HR monitor (BSM-2401; Nihon Kohden, Tokyo, Japan). At least three of the following five criteria were used to verify the attainment of VO2max: oxygen consumption reaching a plateau, respiratory exchange ratio > 1.1, HR >90% of the predicted maximal value (220—age), Borg scale score >18 [22], and pedaling rate <50 rpm.

2.5. Respiratory Gas Analyses

During the exercise sessions in both trials, the respiratory exchange ratio, lipid oxidation, carbohydrate oxidation, oxygen uptake (VO2), and ventilation (VE)/volume of exhaled carbon dioxide (VCO2) were measured using a pre-calibrated automatic gas analyzer (AE-310s; Minato Medical Science, Tokyo, Japan). Respiratory gas concentrations and HR were analyzed at 0, 3, 15, 30, 45, and 60 min during the exercise sessions. Energy expenditure was calculated based on the method of Livesey and Elia [23]: energy expenditure (kcal/min) = [oxygen consumption × (15.480 + 5.550 × respiratory exchange ratio)/4.184]/1000.

2.6. Blood Sample Measurements

Blood samples were obtained from the antecubital vein, and the blood leukocyte count was measured. Blood samples obtained in blood-collecting vessels for serum separation or containing perchloric acid were maintained for 30 min at room temperature; thereafter, the serum and deproteinized supernatants were collected from clotted blood samples after centrifugation at 3000 rpm for 15 min. Blood parameters were measured in the laboratory of BML Inc. (Tokyo, Japan) and were corrected using hematocrit values and hemoglobin concentrations to account for the effects of blood concentration [24].

2.7. Determination of 8-Hydroxy-2′-deoxyguanosine (8-OHdG) Concentration

The 8-OHdG concentration was measured as a primary outcome using an enzyme-linked immunosorbent assay kit (New 8-OHdG check; Japan Institute for the Control of Aging, Shizuoka, Japan). The procedural details are described in the Supplementary Methods.

2.8. Fatigue and Muscle Soreness

Feelings of fatigue, whole-body and lower limb muscle soreness were assessed using a visual analog scale (VAS) comprising of a 100 mm horizontal line. Participants were informed that the left and right ends of the scale represented “no fatigue or pain” and “most severe fatigue or pain imaginable”, respectively.

2.9. Breath H2 Concentration Measurements

The breath H2 concentration was measured at 0, 5, 6, and 7 h after test beverage or placebo ingestion, in accordance with a previously described method using a gas analyzer (TRIlyzer mBA-3000; TAIYO Instrument Inc., Osaka, Japan) [16]. Our previous study confirmed that the breath H2 concentrations of nearly all Japanese participants increased 5–7 h after beverage ingestion [16]. Majority of the studies reported the mean small intestinal transit time of food, water, and various dosage forms to be about 3 to 4 h after consumption [25]. Hence, H2 produced by gut microbiota from beverage ingredients that reached the colon was measured.

2.10. Fecal Microbiota Analysis

The first feces defecated within 24 h after the end of the exercise were collected. Subjects used feces collection sheets “Nagaseru” (Atleta, Osaka, Japan) for fecal collection to prevent contamination with water and chemicals from the toilet. Immediately after defecation, a part of the feces (approximately 1–2 g) was collected in a tube and kept in a freezer at −80 °C until use. Intestinal microbiota was analyzed using 16S rRNA gene amplicon sequencing to identify intestinal bacteria involved in H2 production. The methods of fecal bacterial DNA extraction, 16S rRNA gene amplicon sequencing, data processing, and sequence alignment are described in the Supplementary Methods.

2.11. Statistical Analysis

The Shapiro–Wilk normality test was used to investigate whether a variable is normally distributed in each data set. The breath H2 concentration at each time point was converted to the rank value and evaluated using a two-way repeated-measures analysis of variance (ANOVA) and an estimated marginal means test. The area under the curve (AUC) of the breath H2 concentration and other AUCs were evaluated using the Wilcoxon signed-rank test and paired t-test, respectively. VAS scores were converted to the rank value and analyzed using two-way repeated-measures ANOVA; they were adjusted using the Bonferroni method. Serum, urine, and breath marker levels were analyzed using a two-way repeated-measures ANOVA adjusted using Dunnett’s multiple comparison test or Bonferroni method via the Friedman test. Correlations were analyzed using Pearson’s product-moment correlation coefficient. The relative abundance ratio of fecal bacteria was determined using the Wilcoxon signed-rank or rank-sum test, which was adjusted using the Benjamini–Hochberg method. All statistical analyses, except those involving the Benjamini–Hochberg method, were performed using SPSS version 25.0.0 (IBM, Armonk, NY, USA) and R statistical software version 3.4.4 (R Foundation for Statistical Computing, Vienna, Austria). The Benjamini–Hochberg method was performed using R statistical software version 3.4.4 (R Foundation for Statistical Computing, Vienna, Austria). All differences were considered significant at p < 0.05. The sample size was estimated using G*Power 3 [26]. To detect the changes in the respiratory exchange ratio, blood lactate, and oxidative stress by test beverage and placebo ingestions with a power of 80% and alpha level of 5%, a sample size of ≥6 participants was required.

3. Results

3.1. Breath H2 Concentration Changes

Although 10 people participated in this study, we excluded the data of two participants (participants Nos. 5 and 9) whose breath H2 concentration AUCs with H2-producing milk ingestion were smaller than the maximum value of the breath H2 concentration AUC with placebo ingestion (participant 5, 6.55; participant 9, 17.18; maximum value with placebo, 20.31) because their data were not suitable for determining the effects of H2 produced by consuming the test beverage. The result showed that there were 20% non-responders to the test beverage. Data from eight men (age, 25.6 ± 3.3 years; height, 171.8 ± 4.0 cm; body mass, 63.6 ± 9.3 kg; body mass index, 21.5 ± 2.5 kg/m2; body fat percentage, 14.9 ± 4.6%; and VO2max, 49.7 ± 9.1 mL/kg/min) were analyzed. The breath H2 concentration and its AUC after H2-producing milk ingestion were significantly higher at 4–6 h after test beverage ingestion than that after placebo ingestion (Figure 1).

3.2. Muscle Soreness and Fatigue

The VAS scores of general (p < 0.01) and lower limb (p < 0.05) muscle soreness were significantly higher the morning after treatment than that before treatment during the placebo trial but not during the H2-producing milk trial (Table 1). The VAS score for fatigue the morning after treatment was significantly higher during both trials than that before treatment, and there was no significant difference between the scores during both the trials.

3.3. Blood Samples

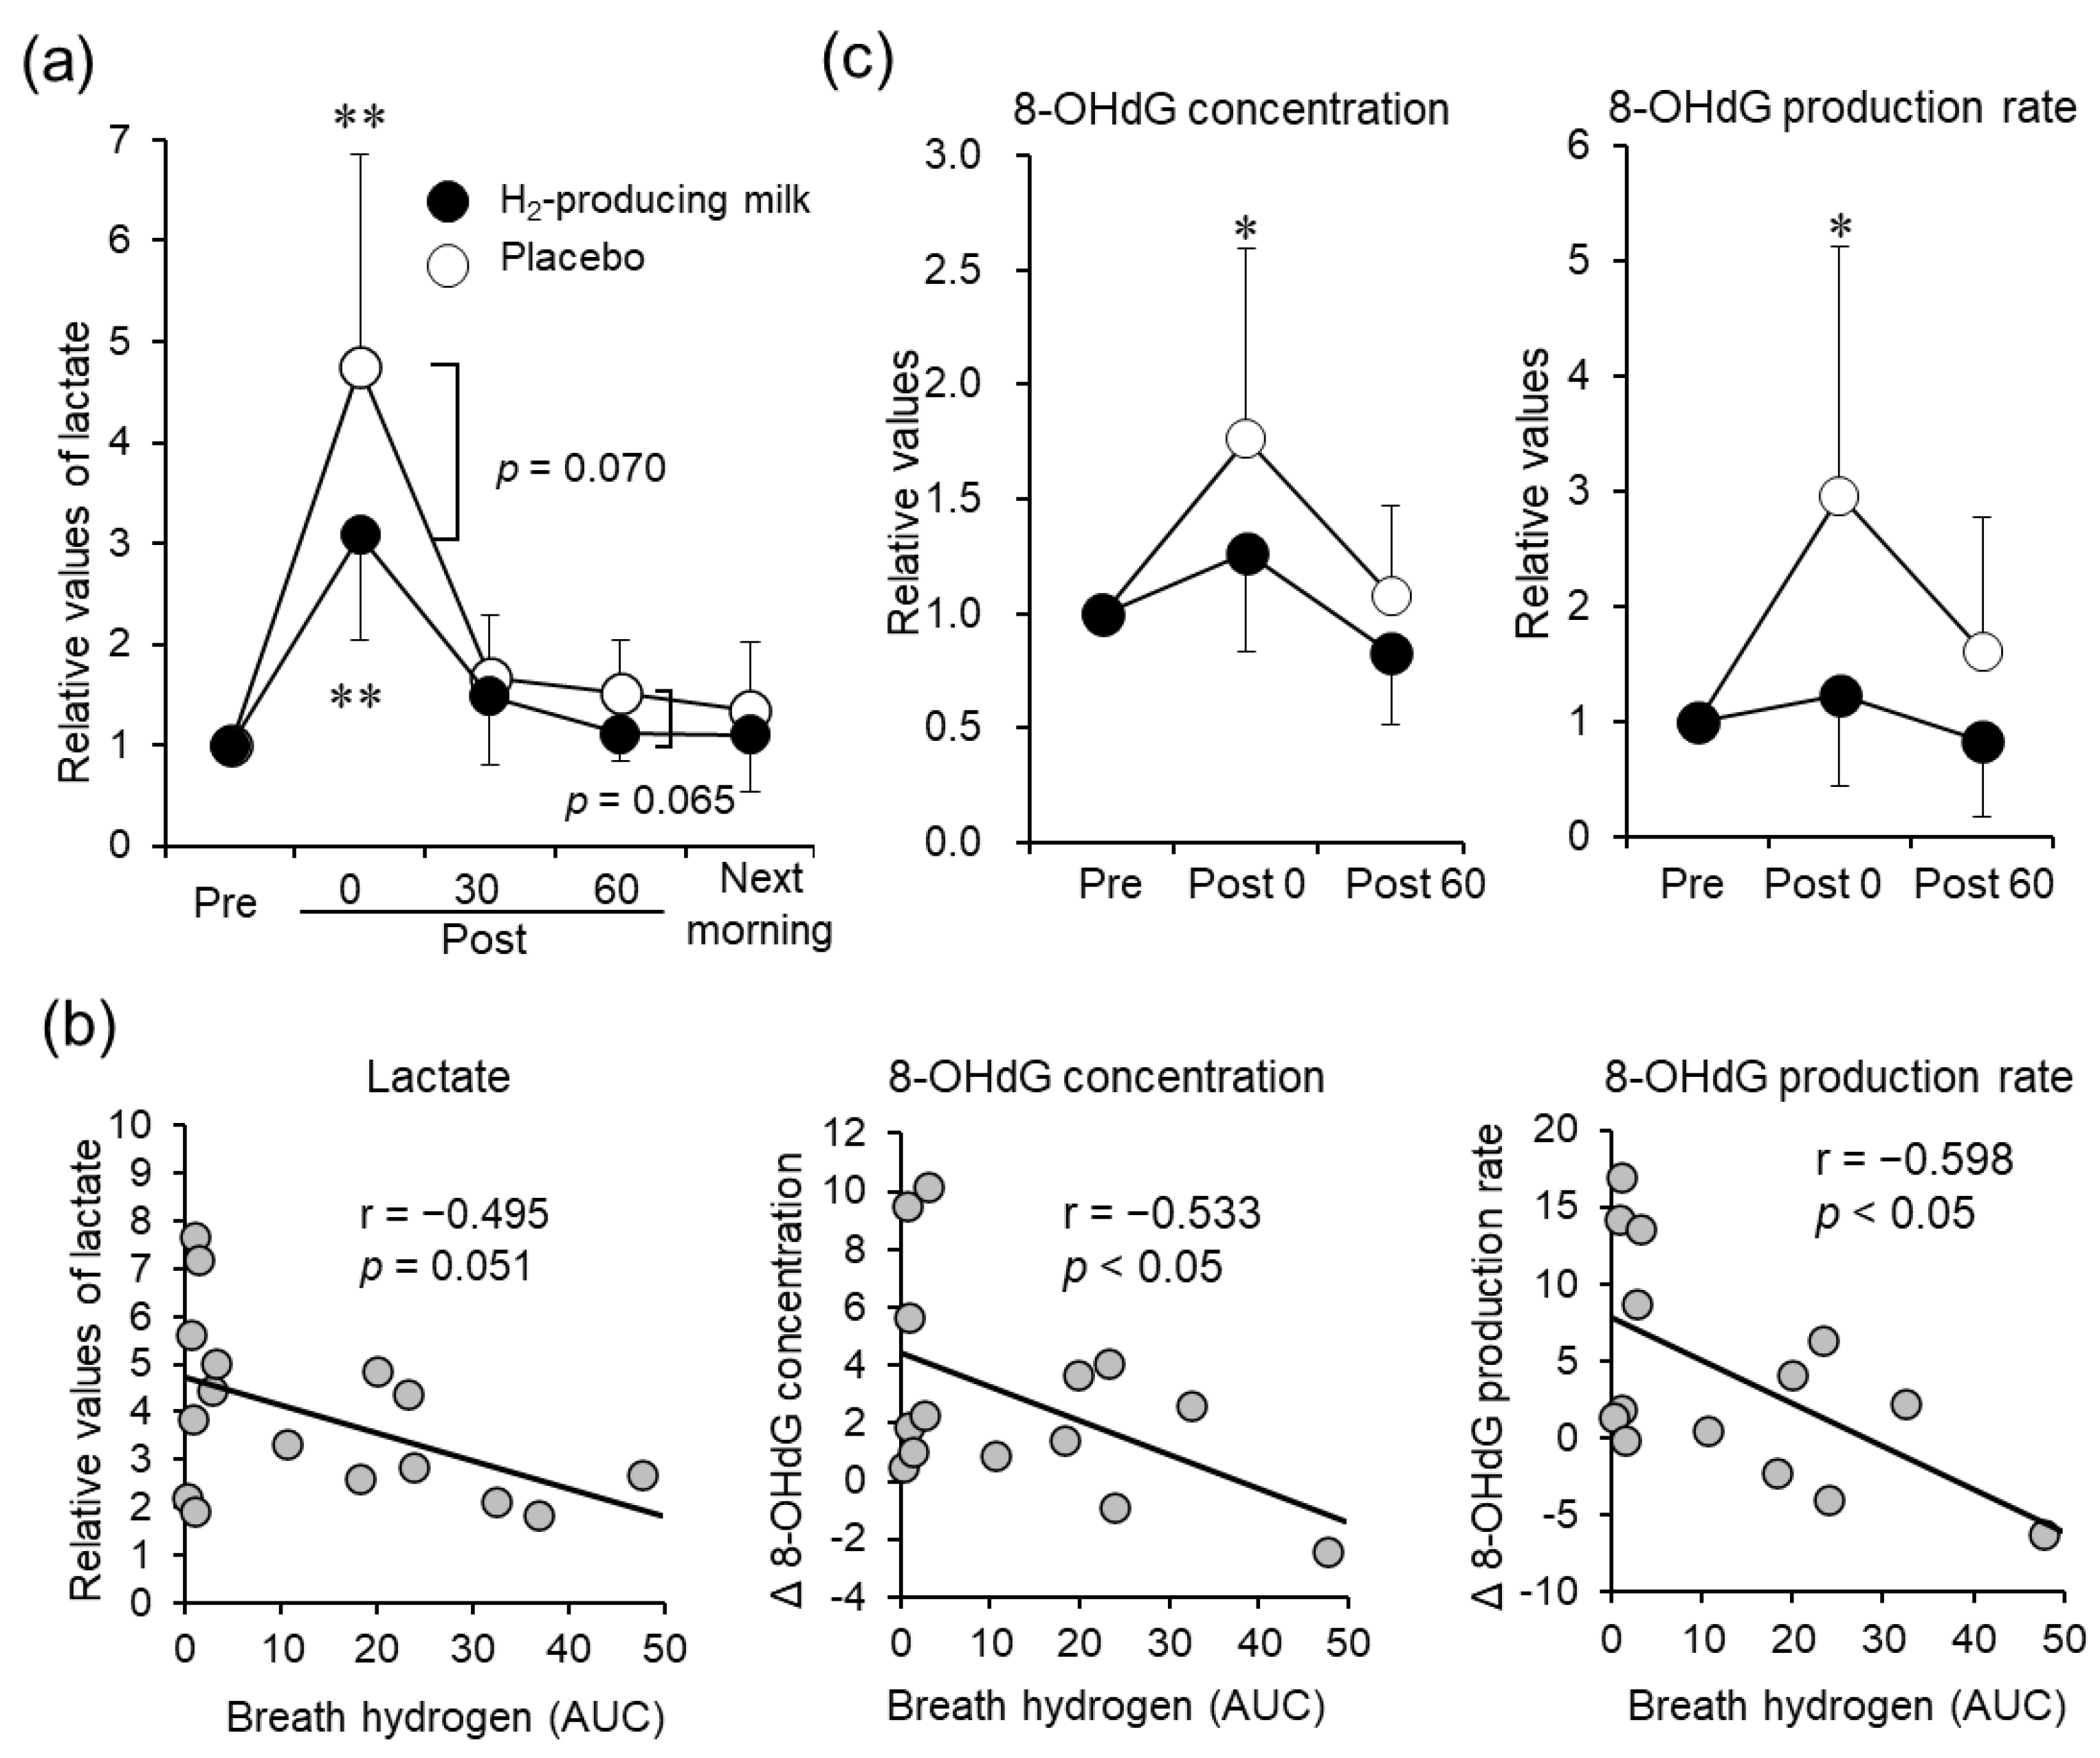
Almost all serum and urine marker levels significantly increased after exercise; however, no significant interactions and differences between trials were observed (Table 1 and Table S1). Relative lactate levels during the H2-producing milk trial tended to be lower than those during the placebo trial immediately after exercise (p = 0.070; Figure 2a). We observed a negative correlation between the relative lactate levels and the AUC of the breath H2 concentration (r = −0.495; p = 0.051; Figure 2b).

3.4. Urinary 8-OHdG

The urinary 8-OHdG concentration and production rate significantly increased immediately after exercise during the H2-producing milk and placebo trials (p < 0.01; Supplementary Table S1). Moreover, the relative 8-OHdG concentration (p < 0.05) and production rate (p < 0.05; Figure 2b) increased immediately after exercise only during the placebo trial. Variations in the 8-OHdG concentration (r = −0.533; p < 0.05) and production rate (r = −0.598; p < 0.05; Figure 2b) during the trials showed significant negative correlations with the AUC of the breath H2 concentration.

3.5. Respiratory Variables

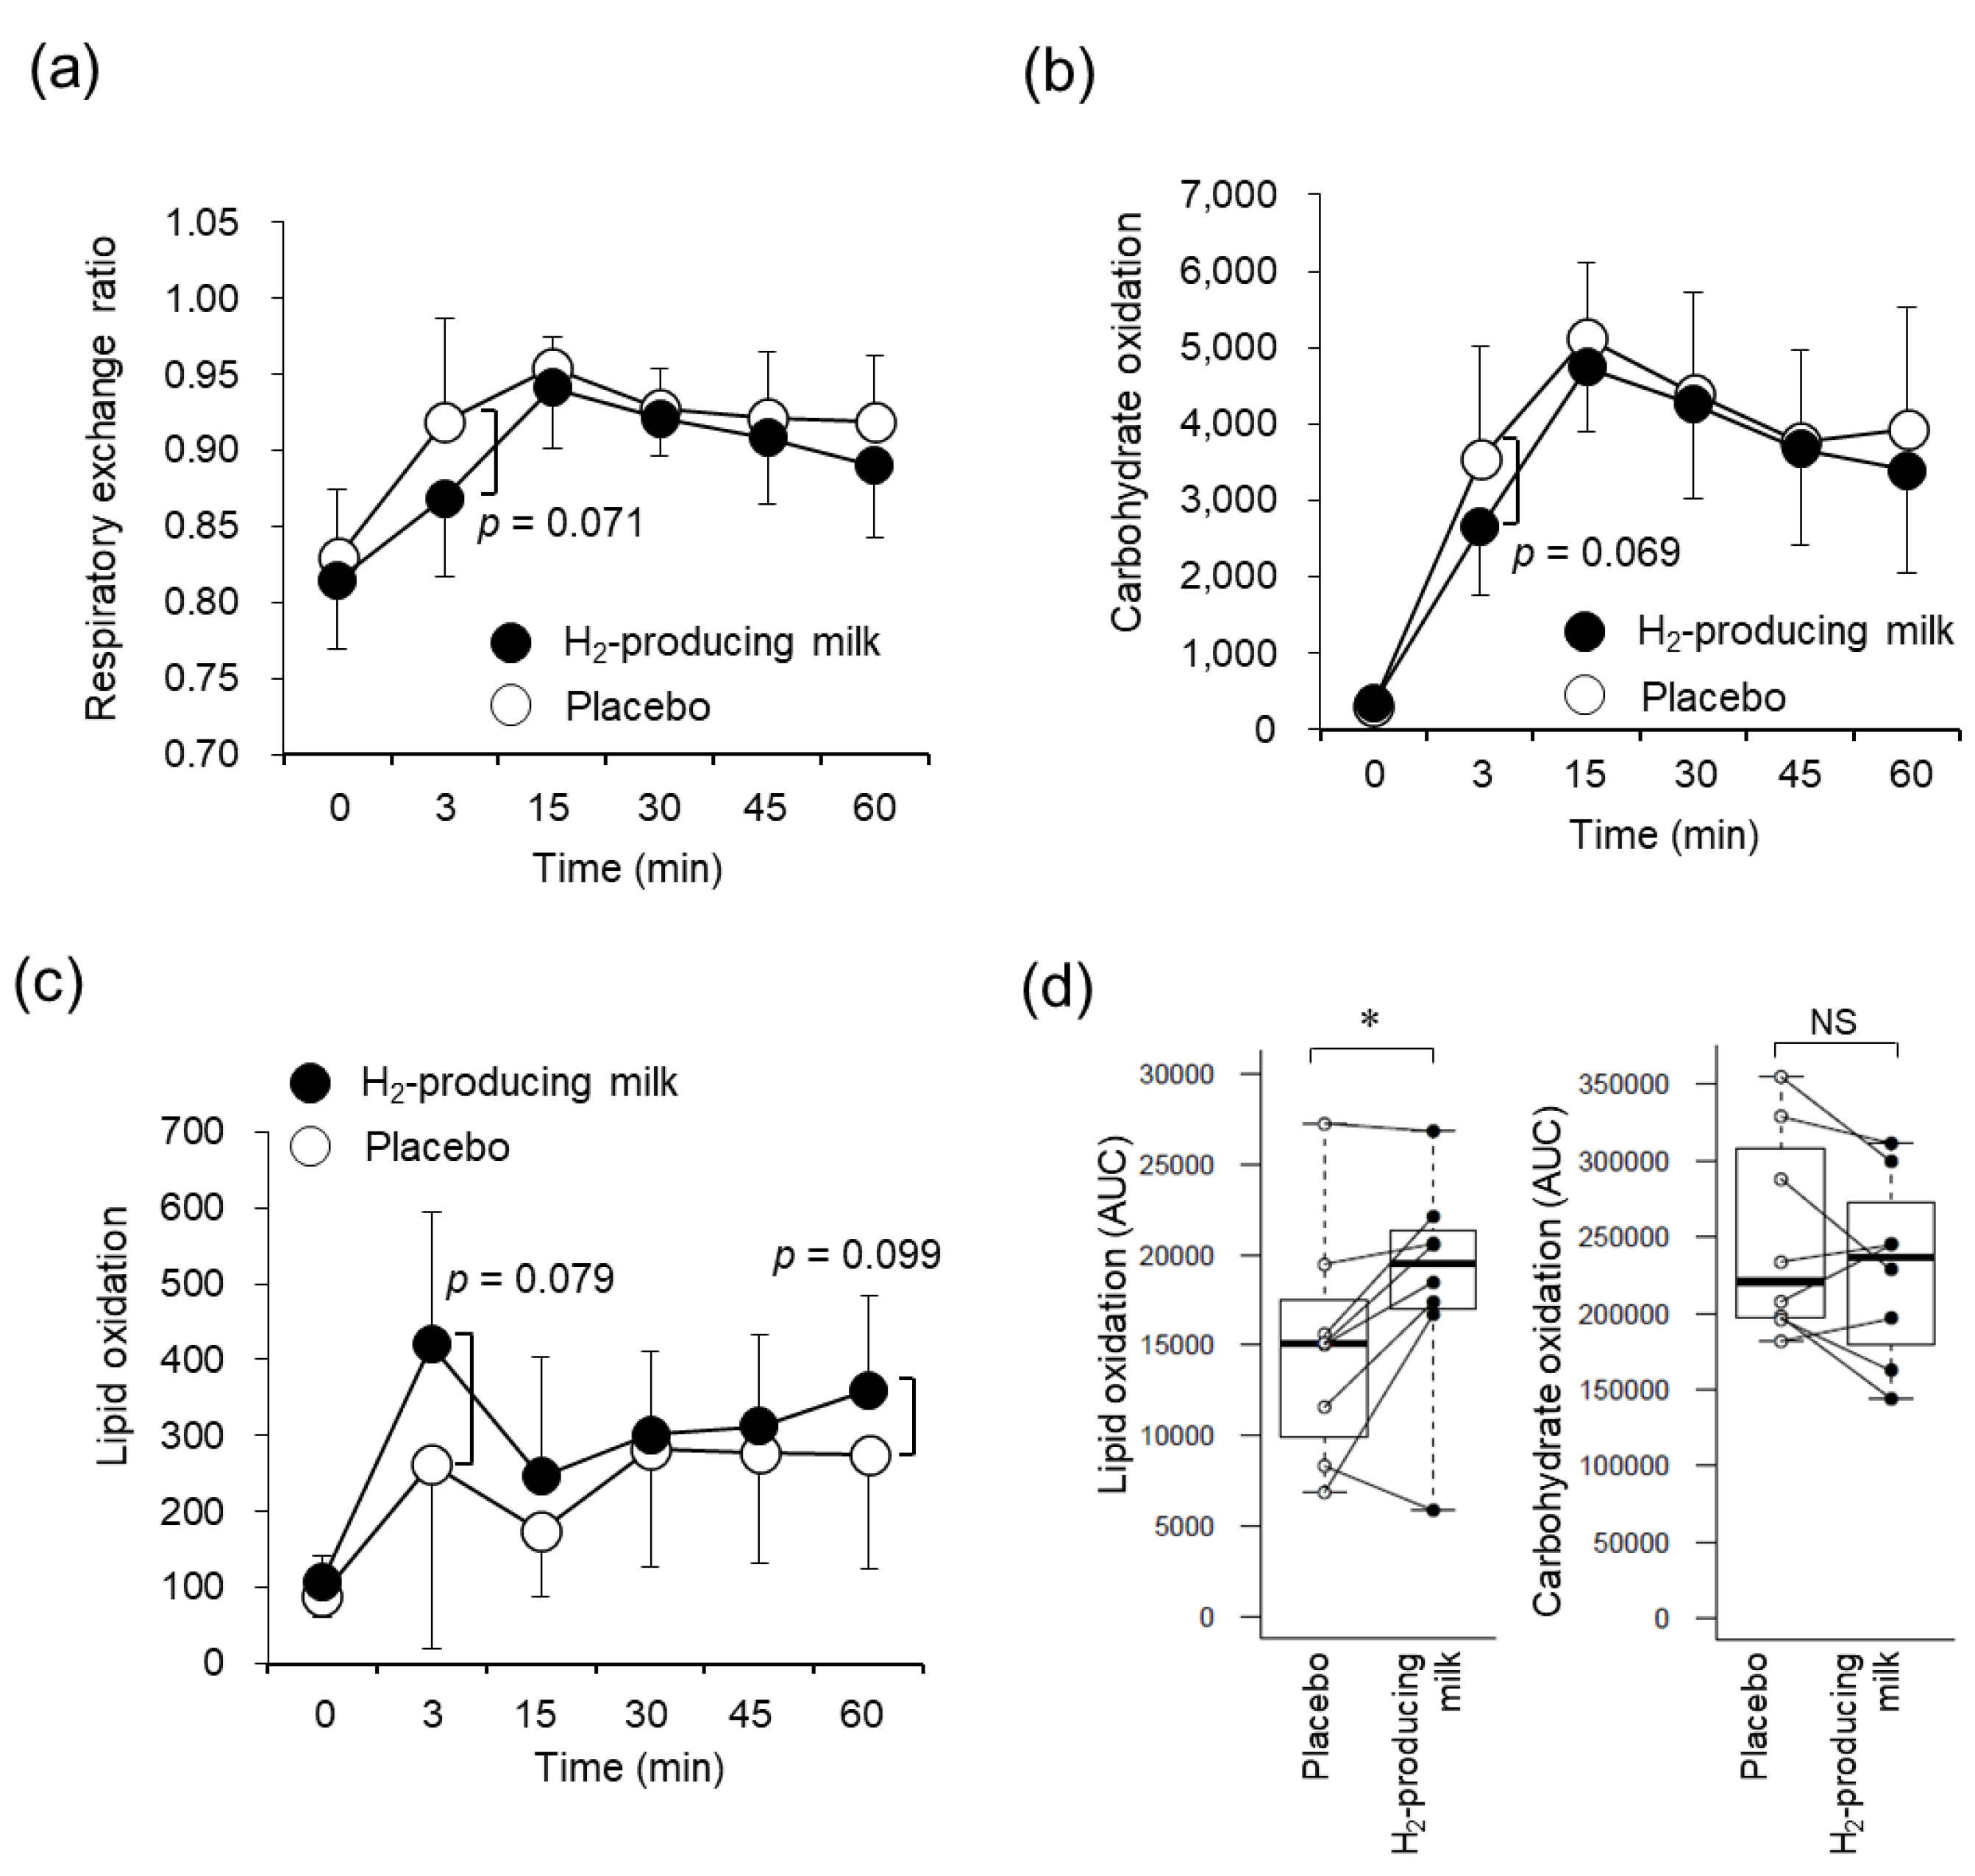
There were significant main effects for time for VO2, HR, and VE/VCO2; however, no significant interactions and main effects were observed between the trials (Supplementary Table S2). In addition, there were no significant differences in the VE, VCO2, and VE/VO2 during the placebo and H2-producing milk trials. The respiratory exchange ratio (p = 0.071; Figure 3a) and carbohydrate oxidation (p = 0.069; Figure 3b) during the H2-producing milk trial at 3 min after starting the exercise tended to be lower than those during the placebo trial. In contrast, lipid oxidation during the H2-producing milk trial at 3 min (p = 0.079) and 60 min (p = 0.099) after starting the exercise tended to be higher than that during the placebo trial (Figure 3c). During exercise, there was a significant difference in the lipid oxidation AUCs (p < 0.05), but not in the carbohydrate oxidation AUCs, during the placebo and H2-producing milk trials (Figure 3d). There was no significant difference in energy expenditure between both the trials (Supplementary Table S3).

3.6. Fecal Microbiota

The principal component analyses of the fecal microbiota revealed no specific cluster for either trial (Supplementary Figure S1A, left). Each participant had similar fecal microbiota throughout the study period, indicating that the intestinal microbiota was not significantly altered by the trials (Supplementary Figure S1A, right). There was no difference in the relative abundance of each bacterial group during both the trials at the phylum to genus levels. Additionally, the relative abundance of each bacterial group was not altered by the consumption of either beverage (Supplementary Figure S1B). All sequence data were deposited in the DDBJ Sequence Read Archive database under the accession number DRA013790.

4. Discussion

In this study, we examined the effects of a functional milk beverage that induces intestinal bacterial H2 production on fatigue prevention after intense exercise; moreover, estimations were made on the muscle damage prevention mechanisms based on data regarding oxidative stress, blood markers, and respiratory variables.
Levels of creatine kinase and myoglobin, which are muscle damage markers [27], and the total number of blood leukocytes, which indicates the level of inflammation [28] increased by intense exercise during both trials, demonstrating that intense exercise inflicts damage to the body. H2 has an antioxidant effect that selectively reduces the level of ROS [7], which would have the potential to induce oxidative stress that may cause a delay in recovery after muscle damage and fatigue, reduction of muscle contractility, inflammation, and immune deficiency [5]. Although the 8-OHdG concentration and production rate significantly increased with intense exercise during the placebo trial, no increase was observed during the H2-producing milk trial, indicating that intestinal bacteria-derived H2 inhibits oxidative damage caused by intense exercise. In addition, a negative correlation between the concentration or production of 8-OHdG and the breath H2 concentration AUC supports this suggestion. Whether 8-OHdG can be used as an oxidative marker after exercise is controversial, since there are reports stating that 8-OHdG increases by acute bout of exercise [29] and also that it is not changed by a fairly intense bout of exercise [30]. This seems to be because the change in 8-OHdG level due to exercise varies depending on exercise mode, intensity, and duration level of the individuals. In a previous study of an acute intense exercise (60 min of cycling exercise at 70% VO2 peak), which is similar to this study (60 min of cycling exercise at 75% VO2 peak), urinary 8-OHdG was reported to increase after exercise [29]; hence, urinary 8-OHdG was used as an oxidative stress marker in this study.
By ingesting H2-producing milk, the participants recovered from the muscle soreness the next morning, based on VAS score findings; this indicated that consuming this beverage effectively improves muscle recovery after intense exercise. Free radicals are unquestionably produced during and after various forms of muscle contractile activity [31] and are known to result in skeletal muscle damage [32]. Animal and human studies have demonstrated that antioxidant polyphenols have anti-inflammatory effects in an exercise-induced muscle damage model [33,34]. Rats that ran until exhaustion on a sealed treadmill while inhaling an H2-containing mixture were shown to have reduced oxidative stress, post-exercise muscle damage, and inflammation [35]. Therefore, the antioxidant effects of the H2-producing milk may have contributed to muscle recovery in this study. However, several reports have shown that ROS act as signaling molecules that specifically activate redox-sensitive transcription factors, which are necessary for muscle recovery after damage [36]. Hence, the antioxidant effects on muscle recovery are controversial. The differences between the harmful and beneficial effects of ROS may depend on the level of ROS produced by exercise [4]. We speculated that the beneficial effects of muscle recovery observed in our study occurred because the intense exercise-induced ROS was reduced to a level suitable to induce the recovery of muscle damage by the antioxidant power of H2. However, further studies are required to clarify this.
Interestingly, reduced lactate levels and upregulated lipid oxidation were caused by H2-producing milk consumption, and a negative correlation between lactate levels and the breath H2 concentration AUC was observed. Recent studies have shown that lactate is the energy source for ATP resynthesis during continuous exercise [37]; however, an increased lactate level is thought to be an indicator of muscle fatigue. During the early stage of the exercise, glycolysis—which can produce ATP for a short time—preferentially occurs, leading to lactate production. Energy production via the mitochondria occurs when more energy is needed; carbohydrates are used more when a large amount of energy is needed during a short period, while when exercise is performed for a long period, lipids are used more [38]. Therefore, it is suggested that the energy production system preferentially utilizes lipids as an energy source with H2-producing milk consumption; moreover, glycolysis was downregulated, resulting in lactate production reduction. On the other hand, H2 produced by the intestinal microbiota may facilitate the use of lipids as an energy source. Kamimura et al. [14] reported that drinking H2-rich water induced Pgc-1α gene expression and enhanced fatty acid metabolism in mice, thereby supporting the abovementioned finding. However, the effects of consuming the H2-producing beverage on energy metabolism should be further studied.
To the best of our knowledge, this is the first study to investigate the effects of H2 produced by intestinal microbiota on the human body during a high-intensity exercise. Several studies have shown that exercise induces changes in the microbiota composition [39]. Furthermore, the metabolites of various gut microbiota are essential for improving mitochondrial oxidative stress, inflammatory response, metabolism, and energy expenditure during exercise [40]. However, during this study no significant alteration of the intestinal microbiota was observed with a single dose of the test beverage, suggesting that these effects are not dependent on the alteration of the bacterial composition of the gut.

Limitations

This study had several limitations. First, this was a pilot study that included only eight participants, which increased the likelihood of a type II error skewing the results. Second, the participants were healthy individuals, albeit not athletes. Therefore, whether these results apply to athletes who frequently perform intense exercise is unclear. Third, recovery following exercise was measured by using only VAS and there was no difference in the objective measures. Fourth, the intestinal microbiota probably produces metabolites other than H2 after consuming this beverage; therefore, it is possible that those unknown metabolites may have caused these effects. Finally, we may not have been able to perfectly identify the fecal site from the whole fecal sample influenced by the single dose of test beverage. Thus, further research to identify and collect the fecal site which receives the test beverage or food, required to estimate H2-producing bacteria, using visible indigested food item or ingredient such as seaweed is required [41].
In conclusion, this study is the first to investigate the effects of H2 produced by intestinal microbiota preventing muscle fatigue caused by intense exercise. H2-producing milk consumption reduces muscle soreness after an intense exercise; hence, this new strategy may possibly prevent overtraining syndrome and enhance the recovery and conditioning of athletes.

Supplementary Materials

The following supporting information can be downloaded at: https://www.mdpi.com/article/10.3390/nu14224875/s1, Supplementary Methods; Table S1: The measurement values of serum and urine during trial; Table S2: Respiratory variables during exercise session; Table S3: The value of energy expenditure (kcal/min); Figure S1: Alterations of the fecal microbiota with the consumption of H2-producing milk and placebo; Raw data. References [42,43,44,45,46,47,48] are cited in the supplementary materials.

Author Contributions

N.E., S.T. and M.M. designed the study and prepared the protocol. N.E., N.N. and R.S. performed the exercise trial and measured respiratory variables and blood markers. S.T. analyzed intestinal microbiota. N.E., S.T. and M.M. interpreted the data. N.E. and S.T. wrote the paper. T.A. supervised this study. M.M. critically revised the manuscript. All authors have read and agreed to the published version of the manuscript.

Funding

Kyodo Milk Industry Co., Ltd. funded this research. The funder had no role in the study design, data collection and analysis, decision to publish, or manuscript preparation.

Institutional Review Board Statement

The study was conducted in accordance with the Declaration of Helsinki, and approved by the Ethics Committee on Human Research of Waseda University (#2017-092/ 25 September 2017).

Informed Consent Statement

Informed consent was obtained from all subjects involved in the study.

Data Availability Statement

All sequence data of fecal microbiota are available in the DDBJ Sequence Read Archive database under the accession number DRA013790.

Acknowledgments

We thank Masahiko Hoshino for preparing the test beverages. The authors would also like to thank the participants who supported this study.

Conflicts of Interest

N.N. and R.S. have no competing interests to disclose that are relevant to the content of this article. S.T. and M.M are employees of Kyodo Milk Industry Co., Ltd., which has a patent for H2-producing milk. N.E. and T.A. received research fund from Kyodo Milk Industry Co., Ltd.

References

  1. Davies, K.J.; Quintanilha, A.T.; Brooks, G.A.; Packer, L. Free radicals and tissue damage produced by exercise. Biochem. Biophys. Res. Commun. 1982, 107, 1198–1205. [Google Scholar] [CrossRef]
  2. Lovlin, R.; Cottle, W.; Pyke, I.; Kavanagh, M.; Belcastro, A.N. Are indices of free radical damage related to exercise intensity. Eur. J. Appl. Physiol. Occup. Physiol. 1987, 56, 313–316. [Google Scholar] [CrossRef]
  3. Sachdev, S.; Davies, K.J. Production, detection, and adaptive responses to free radicals in exercise. Free Radic. Biol. Med. 2008, 44, 215–223. [Google Scholar] [CrossRef]
  4. Powers, S.K.; Jackson, M.J. Exercise-induced oxidative stress: Cellular mechanisms and impact on muscle force production. Physiol. Rev. 2008, 88, 1243–1276. [Google Scholar] [CrossRef] [PubMed] [Green Version]
  5. Kawamura, T.; Muraoka, I. Exercise-Induced Oxidative Stress and the Effects of Antioxidant Intake from a Physiological Viewpoint. Antioxidants 2018, 7, 119. [Google Scholar] [CrossRef] [PubMed] [Green Version]
  6. Turner, J.E.; Hodges, N.J.; Bosch, J.A.; Aldred, S. Prolonged depletion of antioxidant capacity after ultraendurance exercise. Med. Sci. Sports Exerc. 2011, 43, 1770–1776. [Google Scholar] [CrossRef] [PubMed] [Green Version]
  7. Ohsawa, I.; Ishikawa, M.; Takahashi, K.; Watanabe, M.; Nishimaki, K.; Yamagata, K.; Katsura, K.; Katayama, Y.; Asoh, S.; Ohta, S. Hydrogen acts as a therapeutic antioxidant by selectively reducing cytotoxic oxygen radicals. Nat. Med. 2007, 13, 688–694. [Google Scholar] [CrossRef] [PubMed]
  8. Ge, L.; Yang, M.; Yang, N.N.; Yin, X.X.; Song, W.G. Molecular hydrogen: A preventive and therapeutic medical gas for various diseases. Oncotarget 2017, 8, 102653–102673. [Google Scholar] [CrossRef] [Green Version]
  9. Kawamura, T.; Higashida, K.; Muraoka, I. Application of Molecular Hydrogen as a Novel Antioxidant in Sports Science. Oxid. Med. Cell. Longev. 2020, 2020, 2328768. [Google Scholar] [CrossRef] [Green Version]
  10. Da Ponte, A.; Giovanelli, N.; Nigris, D.; Lazzer, S. Effects of hydrogen rich water on prolonged intermittent exercise. J. Sports Med. Phys. Fitness 2018, 58, 612–621. [Google Scholar] [CrossRef]
  11. Shibayama, Y.; Dobashi, S.; Arisawa, T.; Fukuoka, T.; Koyama, K. Impact of hydrogen-rich gas mixture inhalation through nasal cannula during post-exercise recovery period on subsequent oxidative stress, muscle damage, and exercise performances in men. Med. Gas Res. 2020, 10, 155–162. [Google Scholar] [CrossRef] [PubMed]
  12. Aoki, K.; Nakao, A.; Adachi, T.; Matsui, Y.; Miyakawa, S. Pilot study: Effects of drinking hydrogen-rich water on muscle fatigue caused by acute exercise in elite athletes. Med. Gas Res. 2012, 2, 12. [Google Scholar] [CrossRef] [PubMed] [Green Version]
  13. Ostojic, S.M.; Vukomanovic, B.; Calleja-Gonzalez, J.; Hoffman, J.R. Effectiveness of oral and topical hydrogen for sports-related soft tissue injuries. Postgrad. Med. 2014, 126, 187–195. [Google Scholar] [CrossRef] [PubMed]
  14. Kamimura, N.; Ichimiya, H.; Iuchi, K.; Ohta, S. Molecular hydrogen stimulates the gene expression of transcriptional coactivator PGC-1alpha to enhance fatty acid metabolism. NPJ Aging Mech. Dis. 2016, 2, 16008. [Google Scholar] [CrossRef] [PubMed] [Green Version]
  15. Shimouchi, A.; Nose, K.; Yamaguchi, M.; Ishiguro, H.; Kondo, T. Breath hydrogen produced by ingestion of commercial hydrogen water and milk. Biomark. Insights 2009, 4, 27–32. [Google Scholar] [CrossRef] [Green Version]
  16. Matsumoto, M.; Fujita, A.; Yamashita, A.; Kameoka, S.; Shimomura, Y.; Kitada, Y.; Tamada, H.; Nakamura, S.; Tsubota, K. Effects of functional milk containing galactooligosaccharide, maltitol, and glucomannan on the production of hydrogen gas in the human intestine. J. Funct. Foods 2017, 35, 13–23. [Google Scholar] [CrossRef]
  17. Fischbach, M.A.; Sonnenburg, J.L. Eating for two: How metabolism establishes interspecies interactions in the gut. Cell Host Microbe 2011, 10, 336–347. [Google Scholar] [CrossRef] [Green Version]
  18. Levitt, M.D. Production and excretion of hydrogen gas in man. N. Engl. J. Med. 1969, 281, 122–127. [Google Scholar] [CrossRef]
  19. Hammer, H.F. Colonic hydrogen absorption: Quantification of its effect on hydrogen accumulation caused by bacterial fermentation of carbohydrates. Gut 1993, 34, 818–822. [Google Scholar] [CrossRef] [Green Version]
  20. Kawashima, M.; Tsuno, S.; Matsumoto, M.; Tsubota, K. Hydrogen-producing milk to prevent reduction in tear stability in persons using visual display terminals. Ocul. Surf. 2019, 17, 714–721. [Google Scholar] [CrossRef]
  21. Kawano, H.; Mineta, M.; Asaka, M.; Miyashita, M.; Numao, S.; Gando, Y.; Ando, T.; Sakamoto, S.; Higuchi, M. Effects of different modes of exercise on appetite and appetite-regulating hormones. Appetite 2013, 66, 26–33. [Google Scholar] [CrossRef] [PubMed]
  22. Borg, G.A. Psychophysical bases of perceived exertion. Med. Sci. Sports Exerc. 1982, 14, 377–381. [Google Scholar] [CrossRef] [PubMed]
  23. Livesey, G.; Elia, M. Estimation of energy expenditure, net carbohydrate utilization, and net fat oxidation and synthesis by indirect calorimetry: Evaluation of errors with special reference to the detailed composition of fuels. Am. J. Clin. Nutr. 1988, 47, 608–628. [Google Scholar] [CrossRef]
  24. Dill, D.B.; Costill, D.L. Calculation of percentage changes in volumes of blood, plasma, and red cells in dehydration. J. Appl. Physiol. 1974, 37, 247–248. [Google Scholar] [CrossRef] [Green Version]
  25. Yuen, K.H. The transit of dosage forms through the small intestine. Int. J. Pharm. 2010, 395, 9–16. [Google Scholar] [CrossRef]
  26. Faul, F.; Erdfelder, E.; Lang, A.G.; Buchner, A. G*Power 3: A flexible statistical power analysis program for the social, behavioral, and biomedical sciences. Behav. Res. Methods 2007, 39, 175–191. [Google Scholar] [CrossRef] [PubMed]
  27. Baumert, P.; Lake, M.J.; Stewart, C.E.; Drust, B.; Erskine, R.M. Genetic variation and exercise-induced muscle damage: Implications for athletic performance, injury and ageing. Eur. J. Appl. Physiol. 2016, 116, 1595–1625. [Google Scholar] [CrossRef] [PubMed] [Green Version]
  28. Chmielewski, P.P.; Strzelec, B. Elevated leukocyte count as a harbinger of systemic inflammation, disease progression, and poor prognosis: A review. Folia Morphol. 2018, 77, 171–178. [Google Scholar] [CrossRef] [Green Version]
  29. Orhan, H.; van Holland, B.; Krab, B.; Moeken, J.; Vermeulen, N.P.; Hollander, P.; Meerman, J.H. Evaluation of a multi-parameter biomarker set for oxidative damage in man: Increased urinary excretion of lipid, protein and DNA oxidation products after one hour of exercise. Free Radic. Res. 2004, 38, 1269–1279. [Google Scholar] [CrossRef]
  30. Yasuda, N.; Bolin, C.; Cardozo-Pelaez, F.; Ruby, B.C. Effects of repeated bouts of long-duration endurance exercise on muscle and urinary levels of 8-hydroxy-2’-deoxyguanosine in moderately trained cyclists. J. Sports Sci. 2015, 33, 1692–1701. [Google Scholar] [CrossRef]
  31. Bejma, J.; Ji, L.L. Aging and acute exercise enhance free radical generation in rat skeletal muscle. J. Appl. Physiol. 1999, 87, 465–470. [Google Scholar] [CrossRef] [PubMed] [Green Version]
  32. Aoi, W.; Naito, Y.; Takanami, Y.; Kawai, Y.; Sakuma, K.; Ichikawa, H.; Yoshida, N.; Yoshikawa, T. Oxidative stress and delayed-onset muscle damage after exercise. Free Radic. Biol. Med. 2004, 37, 480–487. [Google Scholar] [CrossRef] [PubMed]
  33. Davis, J.M.; Murphy, E.A.; Carmichael, M.D.; Zielinski, M.R.; Groschwitz, C.M.; Brown, A.S.; Gangemi, J.D.; Ghaffar, A.; Mayer, E.P. Curcumin effects on inflammation and performance recovery following eccentric exercise-induced muscle damage. Am. J. Physiol. Regul. Integr. Comp. Physiol. 2007, 292, R2168–R2173. [Google Scholar] [CrossRef] [PubMed] [Green Version]
  34. Howatson, G.; McHugh, M.P.; Hill, J.A.; Brouner, J.; Jewell, A.P.; van Someren, K.A.; Shave, R.E.; Howatson, S.A. Influence of tart cherry juice on indices of recovery following marathon running. Scand. J. Med. Sci. Sports 2010, 20, 843–852. [Google Scholar] [CrossRef]
  35. Nogueira, J.E.; Amorim, M.R.; Pinto, A.P.; da Rocha, A.L.; da Silva, A.S.R.; Branco, L.G.S. Molecular hydrogen downregulates acute exhaustive exercise-induced skeletal muscle damage. Can. J. Physiol. Pharmacol. 2021, 99, 812–820. [Google Scholar] [CrossRef]
  36. Close, G.L.; Ashton, T.; McArdle, A.; Maclaren, D.P. The emerging role of free radicals in delayed onset muscle soreness and contraction-induced muscle injury. Comp. Biochem. Physiol. A Mol. Integr. Physiol. 2005, 142, 257–266. [Google Scholar] [CrossRef]
  37. Brooks, G.A. The Science and Translation of Lactate Shuttle Theory. Cell Metab. 2018, 27, 757–785. [Google Scholar] [CrossRef] [Green Version]
  38. Romijn, J.A.; Coyle, E.F.; Sidossis, L.S.; Gastaldelli, A.; Horowitz, J.F.; Endert, E.; Wolfe, R.R. Regulation of endogenous fat and carbohydrate metabolism in relation to exercise intensity and duration. Am. J. Physiol. 1993, 265, E380–E391. [Google Scholar] [CrossRef] [Green Version]
  39. Mach, N.; Fuster-Botella, D. Endurance exercise and gut microbiota: A review. J. Sport Health Sci. 2017, 6, 179–197. [Google Scholar] [CrossRef]
  40. Clark, A.; Mach, N. The Crosstalk between the Gut Microbiota and Mitochondria during Exercise. Front. Physiol. 2017, 8, 319. [Google Scholar] [CrossRef] [Green Version]
  41. Kibe, R.; Kurihara, S.; Sakai, Y.; Suzuki, H.; Ooga, T.; Sawaki, E.; Muramatsu, K.; Nakamura, A.; Yamashita, A.; Kitada, Y.; et al. Upregulation of colonic luminal polyamines produced by intestinal microbiota delays senescence in mice. Sci. Rep. 2014, 4, 4548. [Google Scholar] [CrossRef] [PubMed] [Green Version]
  42. Costea, P.I.; Zeller, G.; Sunagawa, S.; Pelletier, E.; Alberti, A.; Levenez, F.; Tramontano, M.; Driessen, M.; Hercog, R.; Jung, F.E.; et al. Towards standards for human fecal sample processing in metagenomic studies. Nat. Biotechnol. 2017, 35, 1069–1076. [Google Scholar] [CrossRef] [PubMed] [Green Version]
  43. Kim, S.W.; Suda, W.; Kim, S.; Oshima, K.; Fukuda, S.; Ohno, H.; Morita, H.; Hattori, M. Robustness of gut microbiota of healthy adults in response to probiotic intervention revealed by high-throughput pyrosequencing. DNA Res. 2013, 20, 241–253. [Google Scholar] [CrossRef] [PubMed]
  44. Caporaso, J.G.; Kuczynski, J.; Stombaugh, J.; Bittinger, K.; Bushman, F.D.; Costello, E.K.; Fierer, N.; Pena, A.G.; Goodrich, J.K.; Gordon, J.I.; et al. QIIME allows analysis of high-throughput community sequencing data. Nat. Methods 2010, 7, 335–336. [Google Scholar] [CrossRef] [Green Version]
  45. Edgar, R.C. Search and clustering orders of magnitude faster than BLAST. Bioinformatics 2010, 26, 2460–2461. [Google Scholar] [CrossRef] [Green Version]
  46. Caporaso, J.G.; Bittinger, K.; Bushman, F.D.; DeSantis, T.Z.; Andersen, G.L.; Knight, R. PyNAST: A flexible tool for aligning sequences to a template alignment. Bioinformatics 2010, 26, 266–267. [Google Scholar] [CrossRef] [Green Version]
  47. DeSantis, T.Z.; Hugenholtz, P.; Larsen, N.; Rojas, M.; Brodie, E.L.; Keller, K.; Huber, T.; Dalevi, D.; Hu, P.; Andersen, G.L. Greengenes, a chimera-checked 16S rRNA gene database and workbench compatible with ARB. Appl. Environ. Microbiol. 2006, 72, 5069–5072. [Google Scholar] [CrossRef] [Green Version]
  48. Wang, Q.; Garrity, G.M.; Tiedje, J.M.; Cole, J.R. Naive Bayesian classifier for rapid assignment of rRNA sequences into the new bacterial taxonomy. Appl. Environ. Microbiol. 2007, 73, 5261–5267. [Google Scholar] [CrossRef]
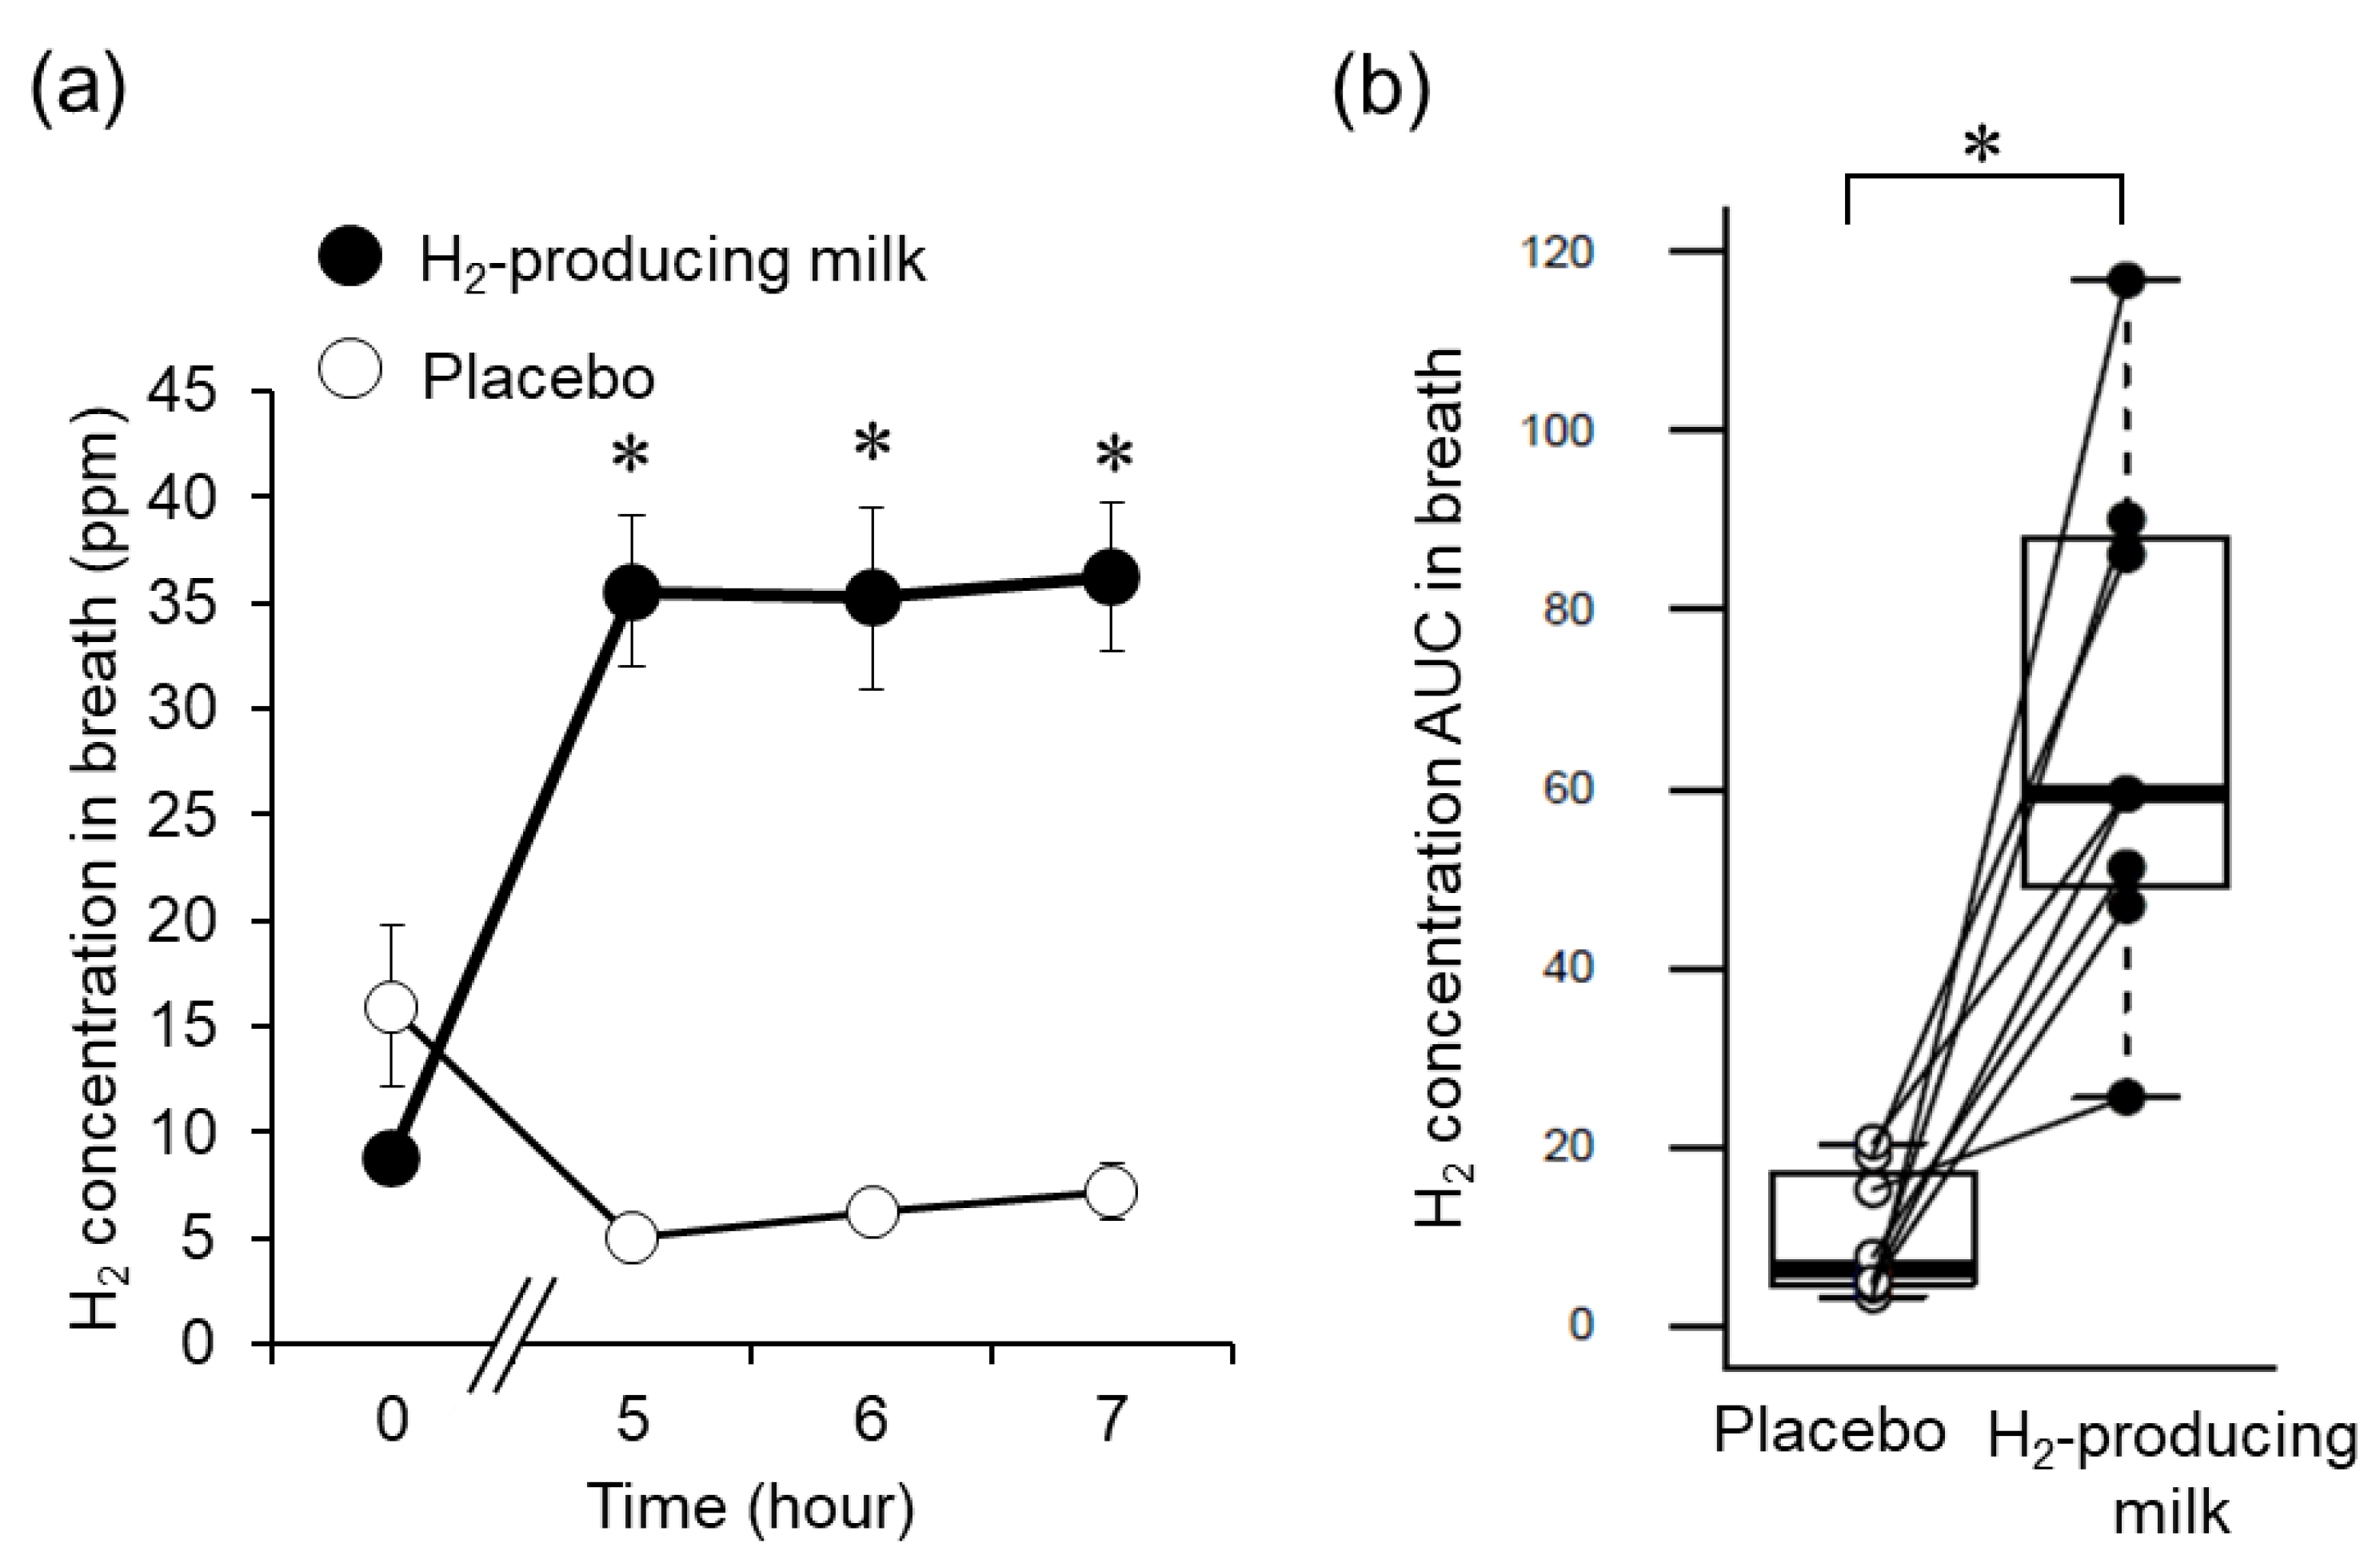
Figure 1. Changes in H2 production with the ingestion of H2-producing milk. (a) Time course of the breath H2 concentrations during the first 6 h after ingestion of the test beverage. Error bars represent standard error of the mean. * q < 0.05 (vs. placebo; Friedman and Wilcoxon signed-rank tests with the Benjamini–Hochberg correction). (b) Between-trial comparison of the area under the curve (AUC) of the breath H2 concentrations (0–6 h). * p < 0.05 (Wilcoxon signed-rank test performed after the F-test). Each part of the boxplot diagram shows the following: upper line, maximum value; lower line, minimum value; box, interquartile range; bold line inside the box, median; and white and black plots, values during the placebo and H2-producing milk trials, respectively.
Nutrients 14 04875 g001
Figure 2. Effects of H2-producing milk and placebo use on blood lactate and 8-OHdG levels. (a) Time course of the relative lactate levels before and after exercise. (b) 8-OHdG concentration and production rate before and after exercise. The black and white plots represent the means during the H2-producing milk and placebo trials, respectively. Error bars represent the standard deviation of the mean. * p < 0.05, ** p < 0.01 (vs. before exercise; two-way repeated measures analysis of variance and Dunnett’s multiple comparison test). (c) Correlation between blood lactate and 8-OHdG levels and the AUC of the breath (Pearson’s product-moment correlation coefficient). 8-OHdG, 8-hydroxy-2′-deoxyguanosine; AUC, area under the curve.
Nutrients 14 04875 g002
Figure 3. Effects of H2-producing milk and placebo use on energy metabolism during exercise. Time courses of the respiratory exchange ratio (a), lipid oxidation (b), and carbohydrate oxidation (c) during exercise are shown. Error bars represent the standard deviation of the mean. The black and white plots represent the means during the H2-producing milk and placebo trials, respectively. A comparison of the AUC for lipid oxidation and that for carbohydrate oxidation (d) is also shown (paired t-test, * p < 0.05). Each part of the boxplot diagram shows the following: upper line, maximum value; lower line, minimum value; box, interquartile range; bold line inside the box, median; and white and black plots, values during the placebo and H2-producing milk trials, respectively. AUC, area under the curve.
Nutrients 14 04875 g003
Table 1. Visual analog scale scores during trial.
MeasurementsInteractionTimeTrial
PrePostPost 30Post 60Next Morningp2)p2)p2)
General muscle sorenessHPM2.5 (4.5)27.0 (28.3) a25.0 (22.3) a10.0 (22.5)6.5 (16.0)0.418<0.0010.113
Placebo3.0 (7.3)41.5 (27.8) a29.0 (21.3) a18.5 (19.5)24.5 (17.5) b(0.126)(0.637)(0.319)
Lower limbs sorenessHPM3.0 (6.3)34.5 (33.8) a27.0 (31.5)11.0 (29.5)12.5 (30.5)0.351<0.0010.400
Placebo3.5 (6.5)48.5 (40.3) a28.5 (27.0) a21.5 (37.0)28.5 (32.8) a(0.142)(0.646)(0.103)
FatigueHPM2.0 (9.0)58.5 (22.0) b49.0 (26.3) a38.0 (38.0)27.0 (28.0) a0.878<0.0010.680
Placebo12.0 (14.3)67.0 (13.0) b43.0 (31.8)38.0 (24.3)38.5 (15.8) a(0.041)(0.744)(0.026)
All data are represented as median and (interquartile range). HPM: H2-producing milk, Pre: before exercise, Post 0: immediately after exercise, Post 30: 30 min after exercise, Post 60: 60 min after exercise, Next morning: the first morning after the trial. Significant differences are shown as follows: a p < 0.05, b p < 0.01 vs. Pre (Converted to the rank value and evaluated using two-way repeated measures analysis of variance and adjusted using the Bonferroni method).
Publisher’s Note: MDPI stays neutral with regard to jurisdictional claims in published maps and institutional affiliations.