
Face Validity of Observed Meal Patterns Reported with 7-Day Diet Diaries in a Large Population-Based Cohort Using Diurnal Variation in Concentration Biomarkers of Dietary Intake

 , , ,
, , ,
Abstract
:
1. Introduction
2. Materials and Methods
2.1. Study Design
2.2. Eating Pattern Assessment
2.3. Diurnal Variation in Non-Fasting Biomarkers
2.4. Adjustment Variables
2.5. Stratification/Subgroup Variables
2.6. Participant Selection
2.7. Statistical Analysis
3. Results
3.1. Participant Characteristics
3.2. Diurnal Variation in Non-Fasting Triglyceride and Glucose Concentrations
3.3. Meal Pattern Description and Correlations between Size, Frequency and Timing of EDO
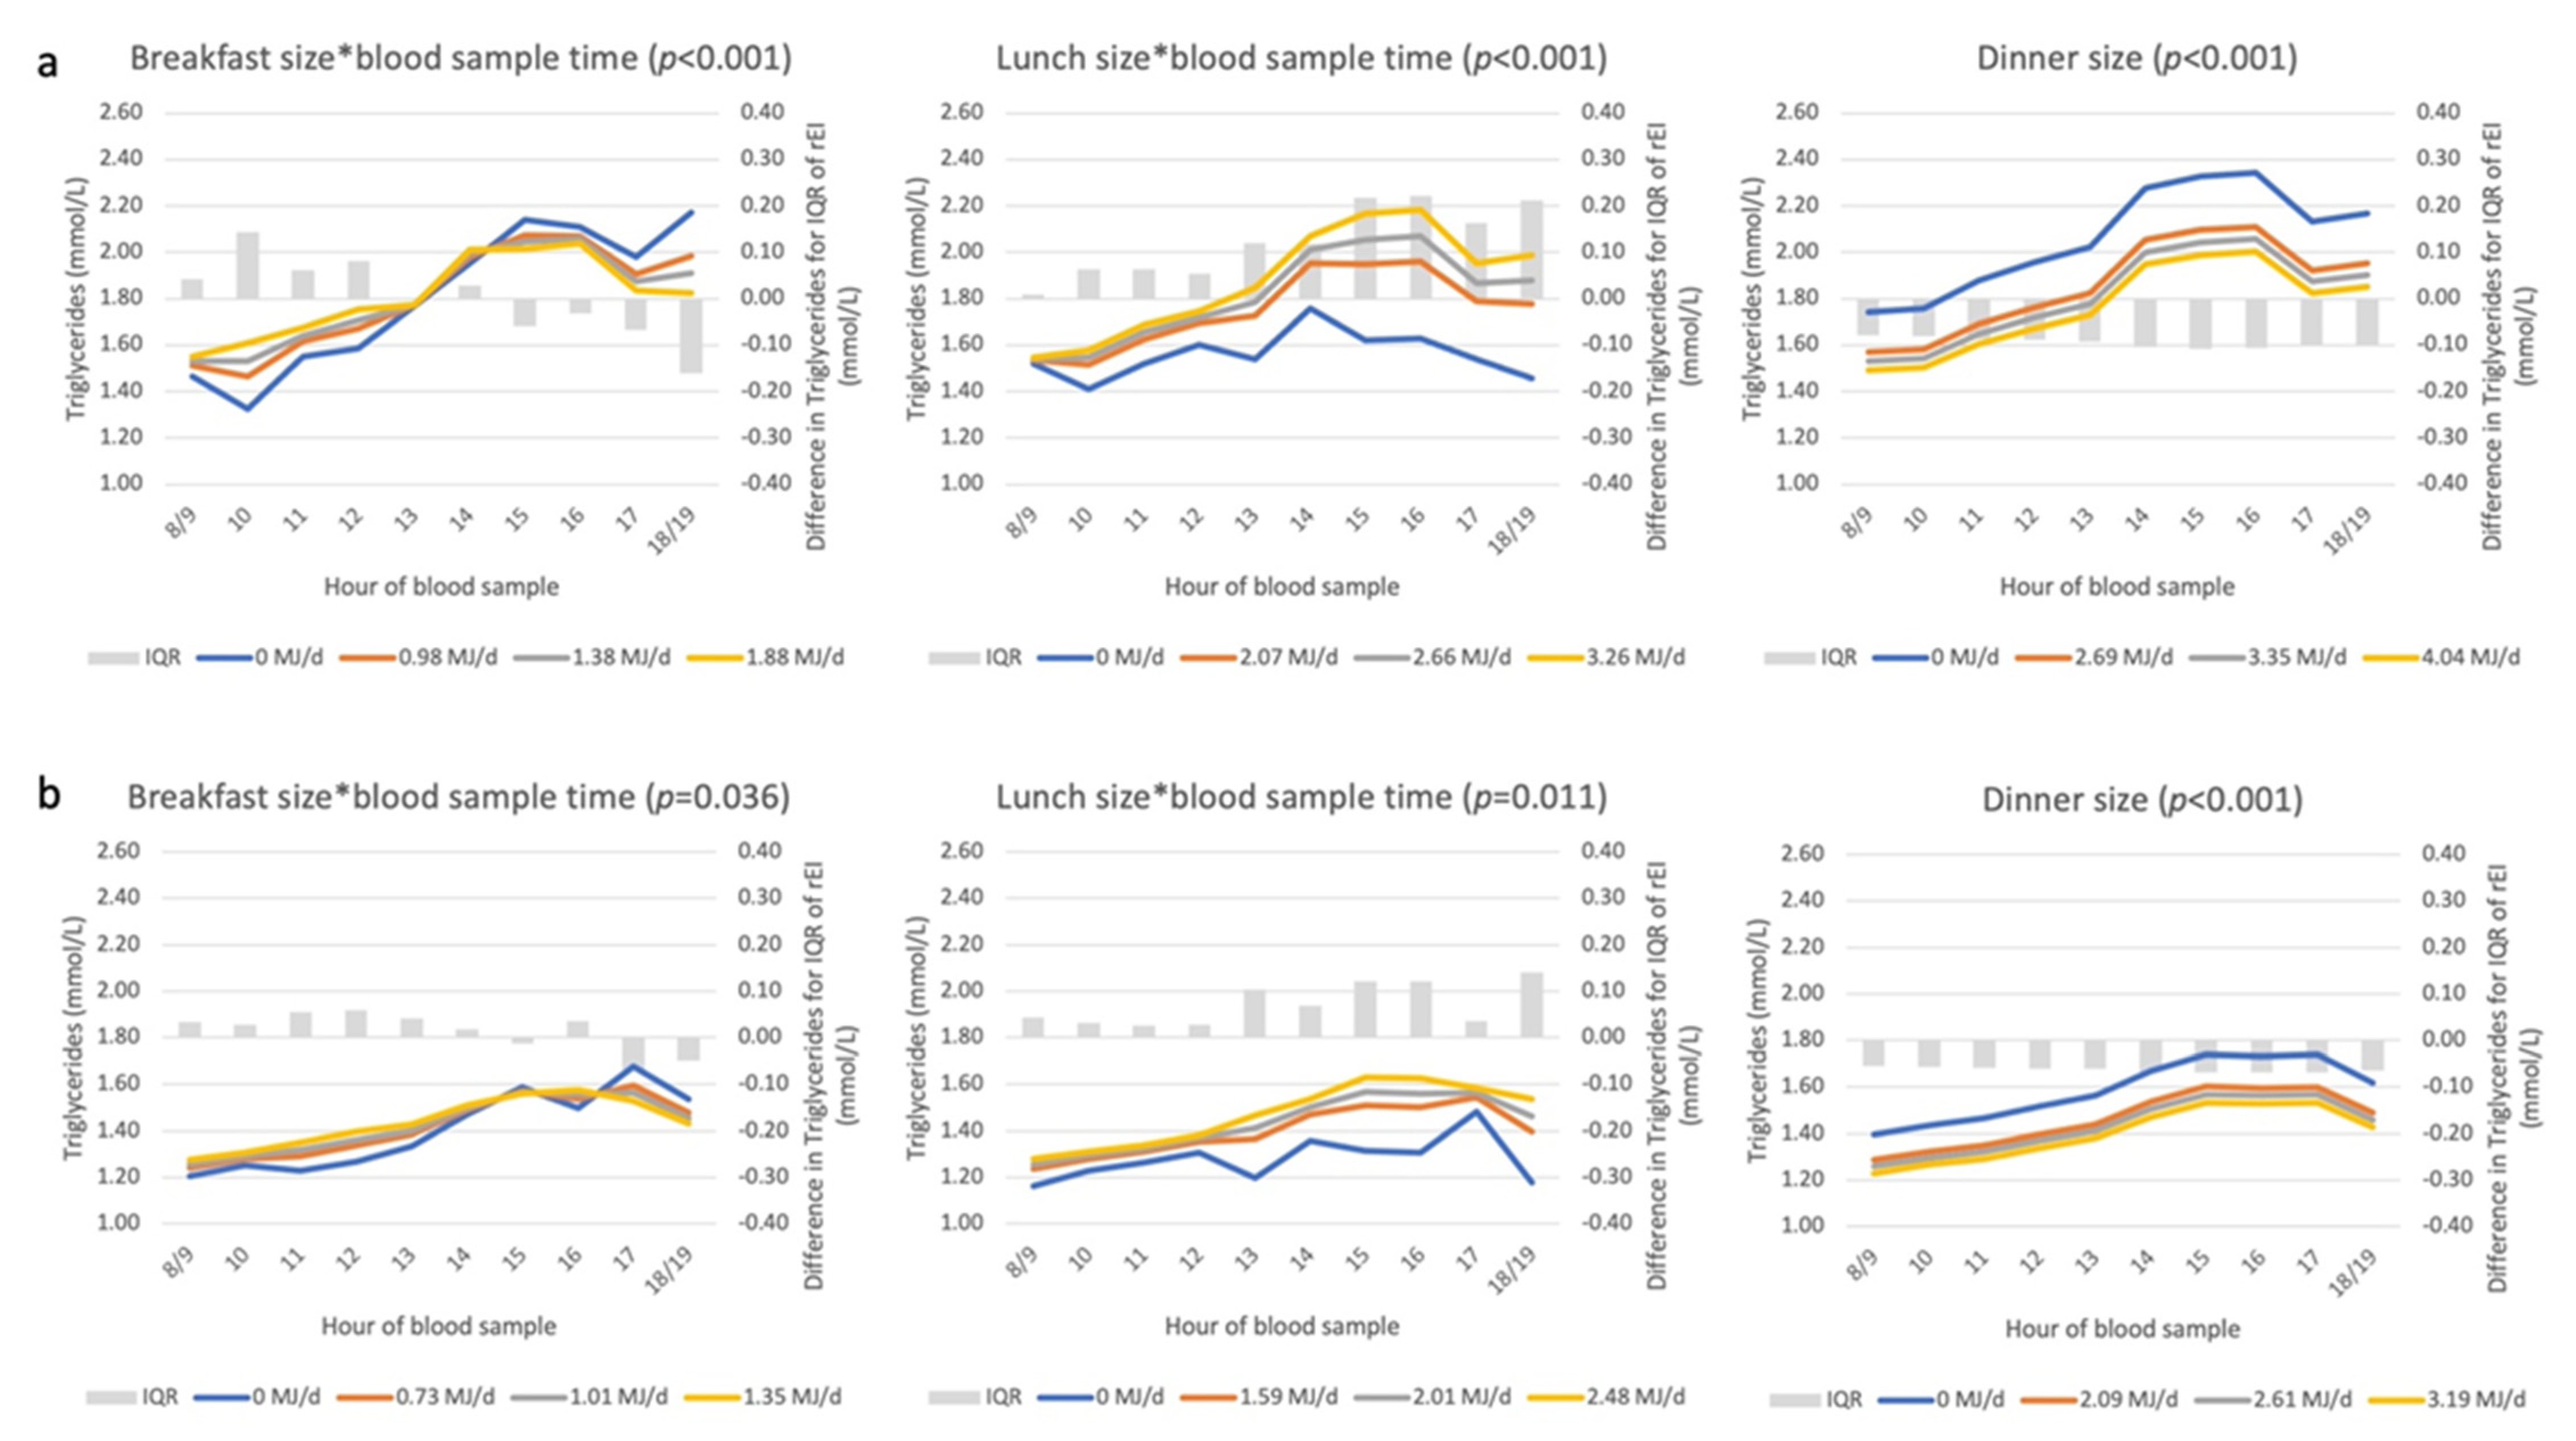
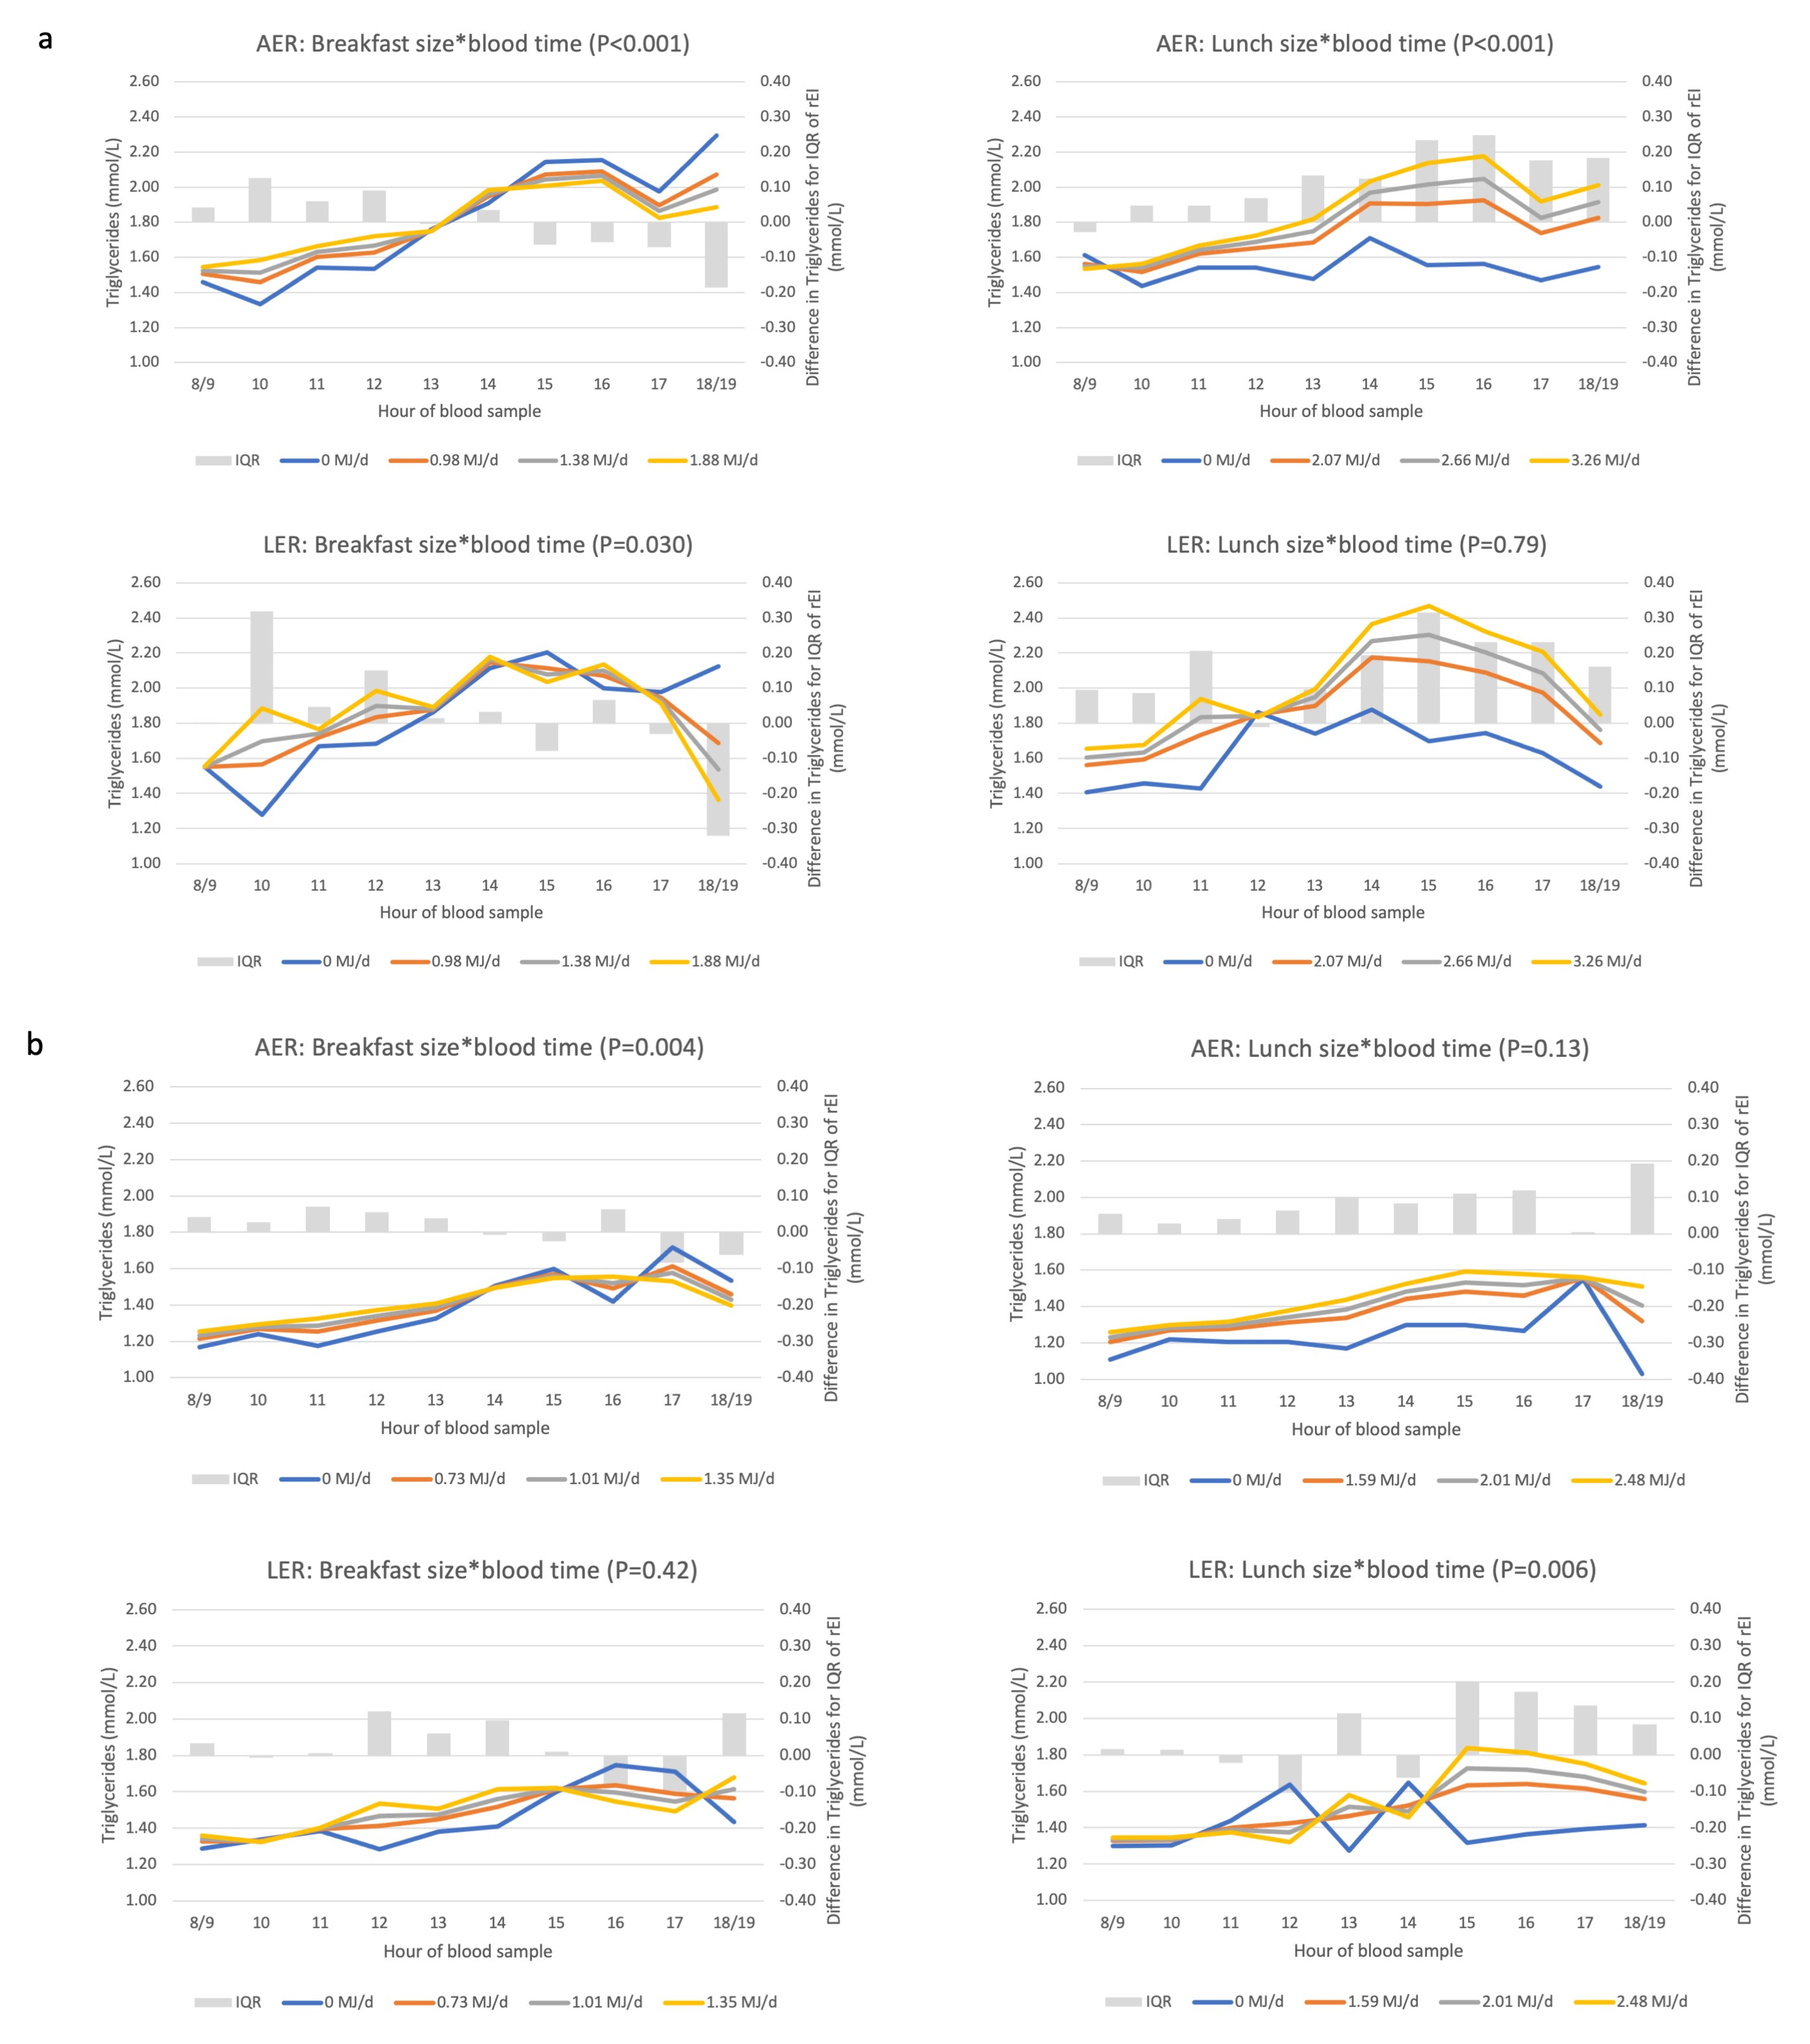
3.4. Associations between Eating Patterns and Triglyceride Concentrations
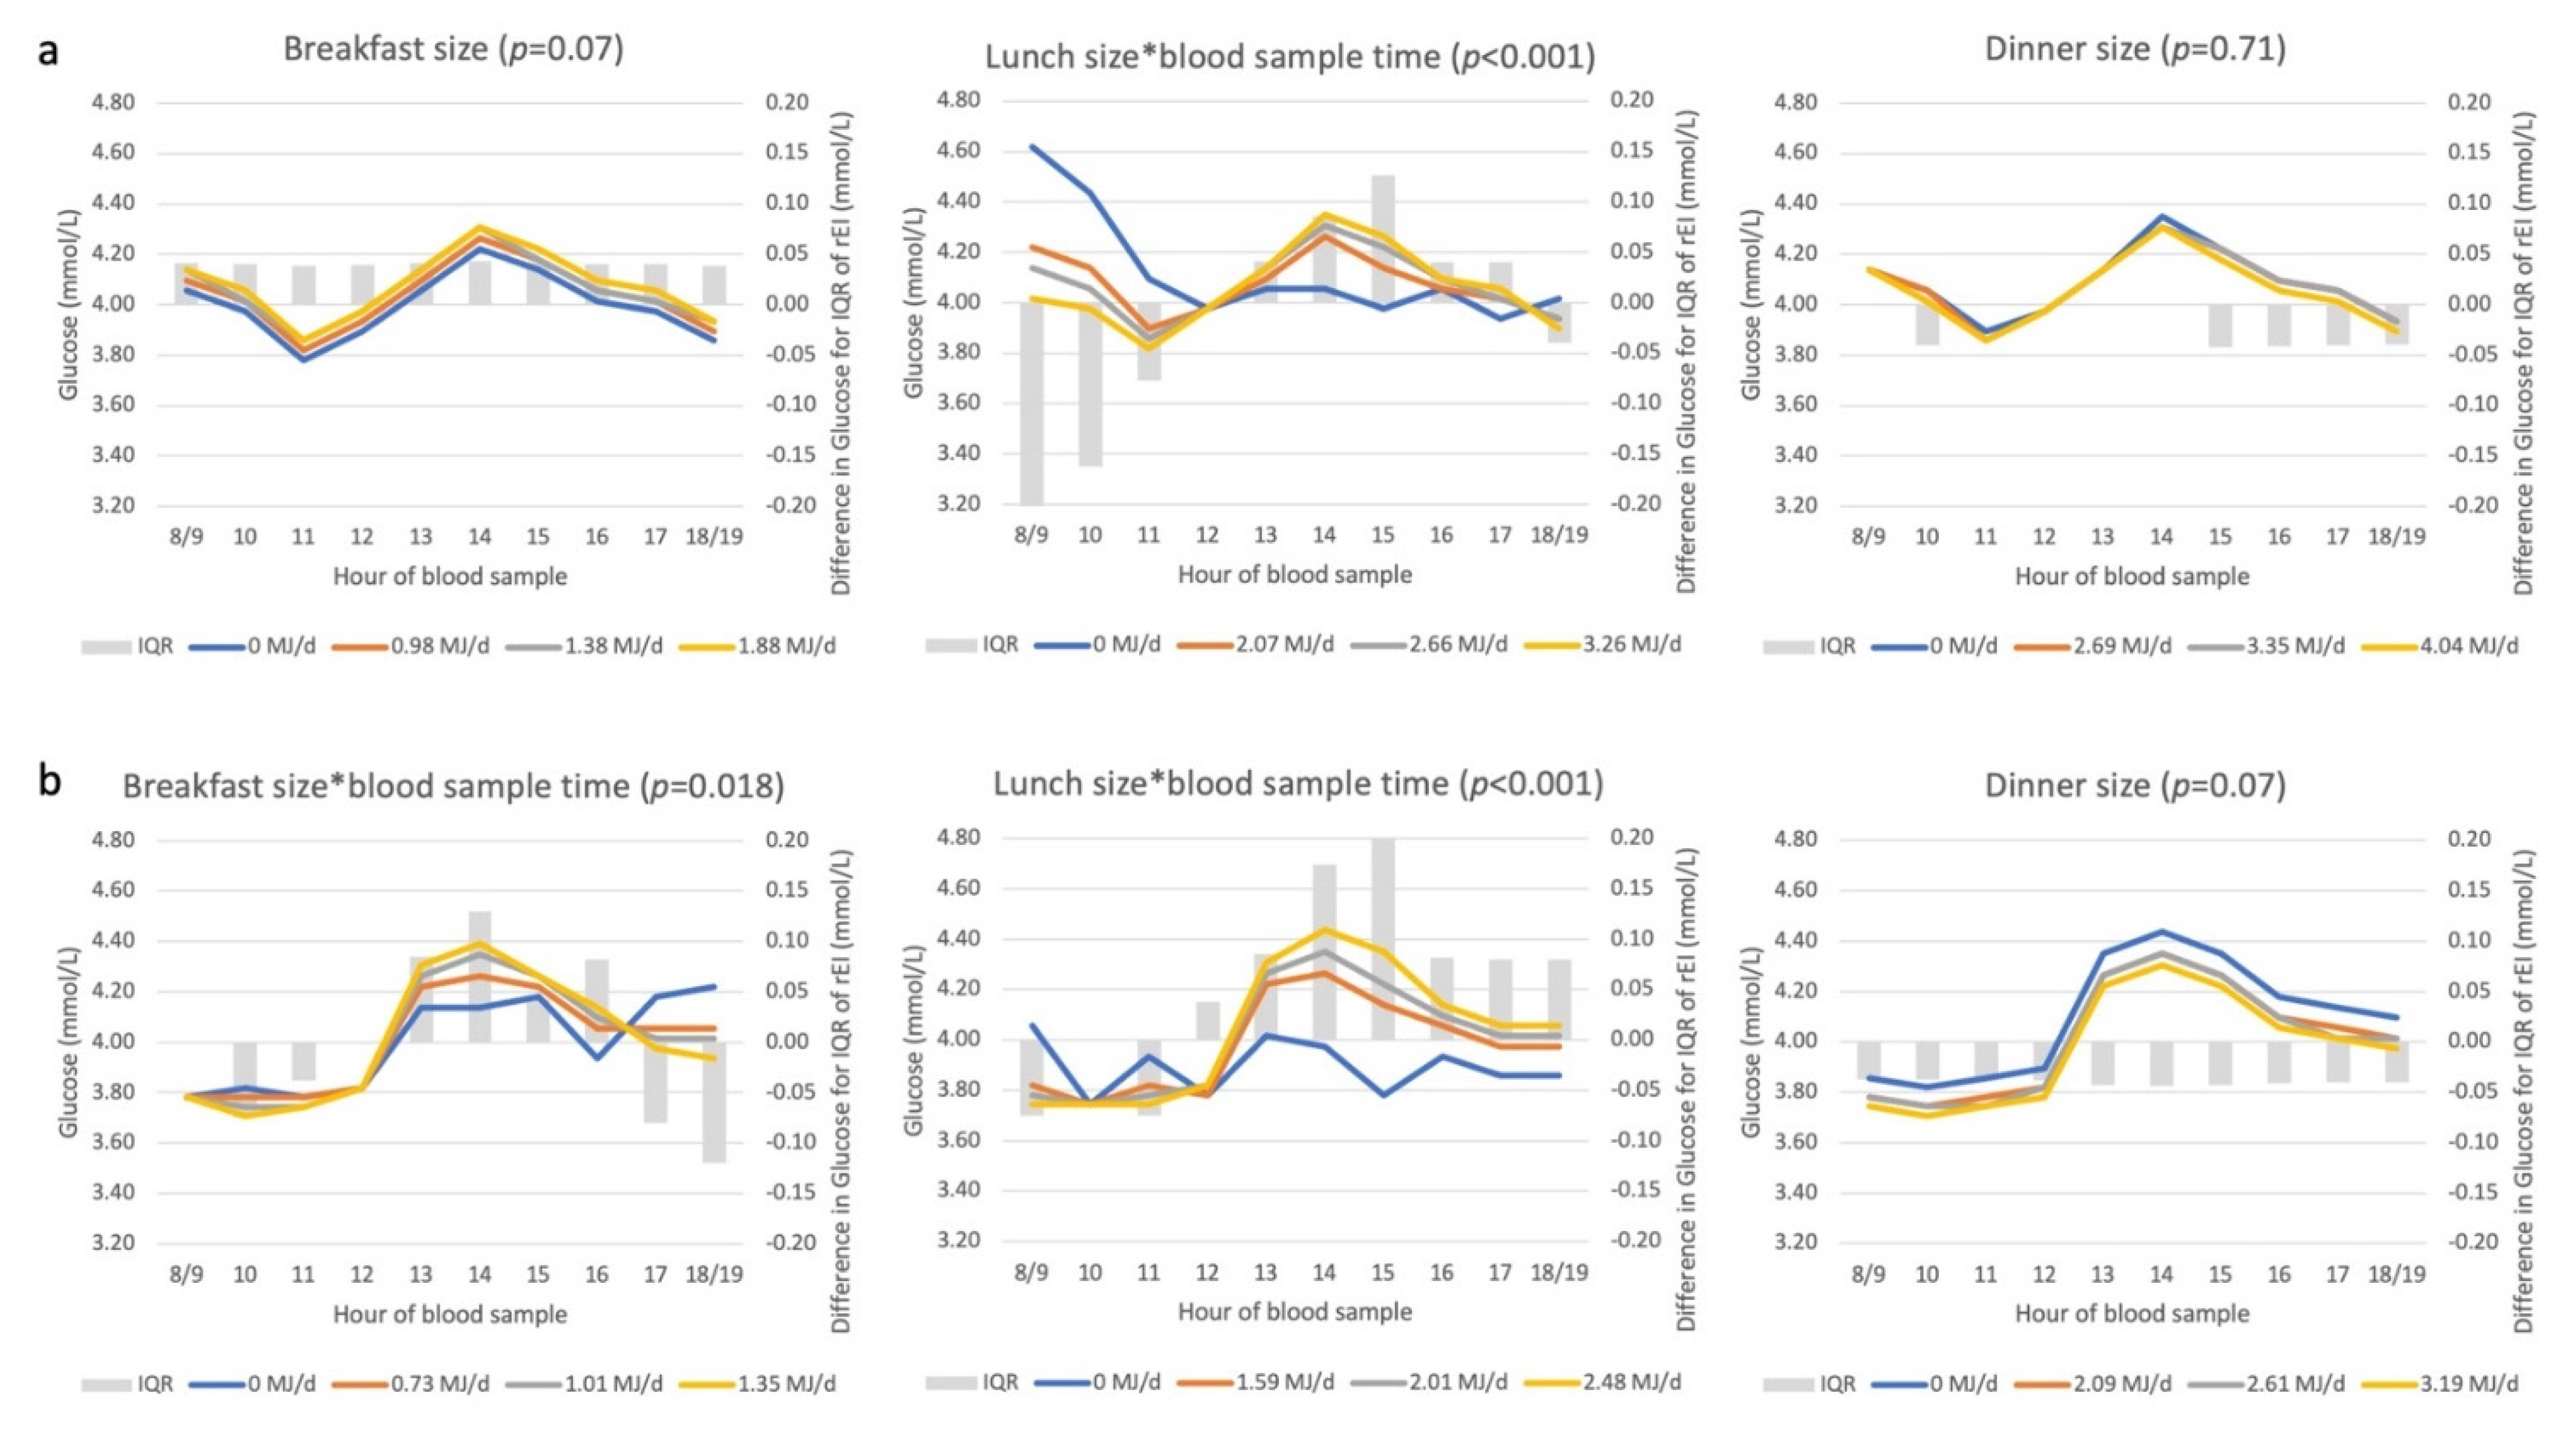
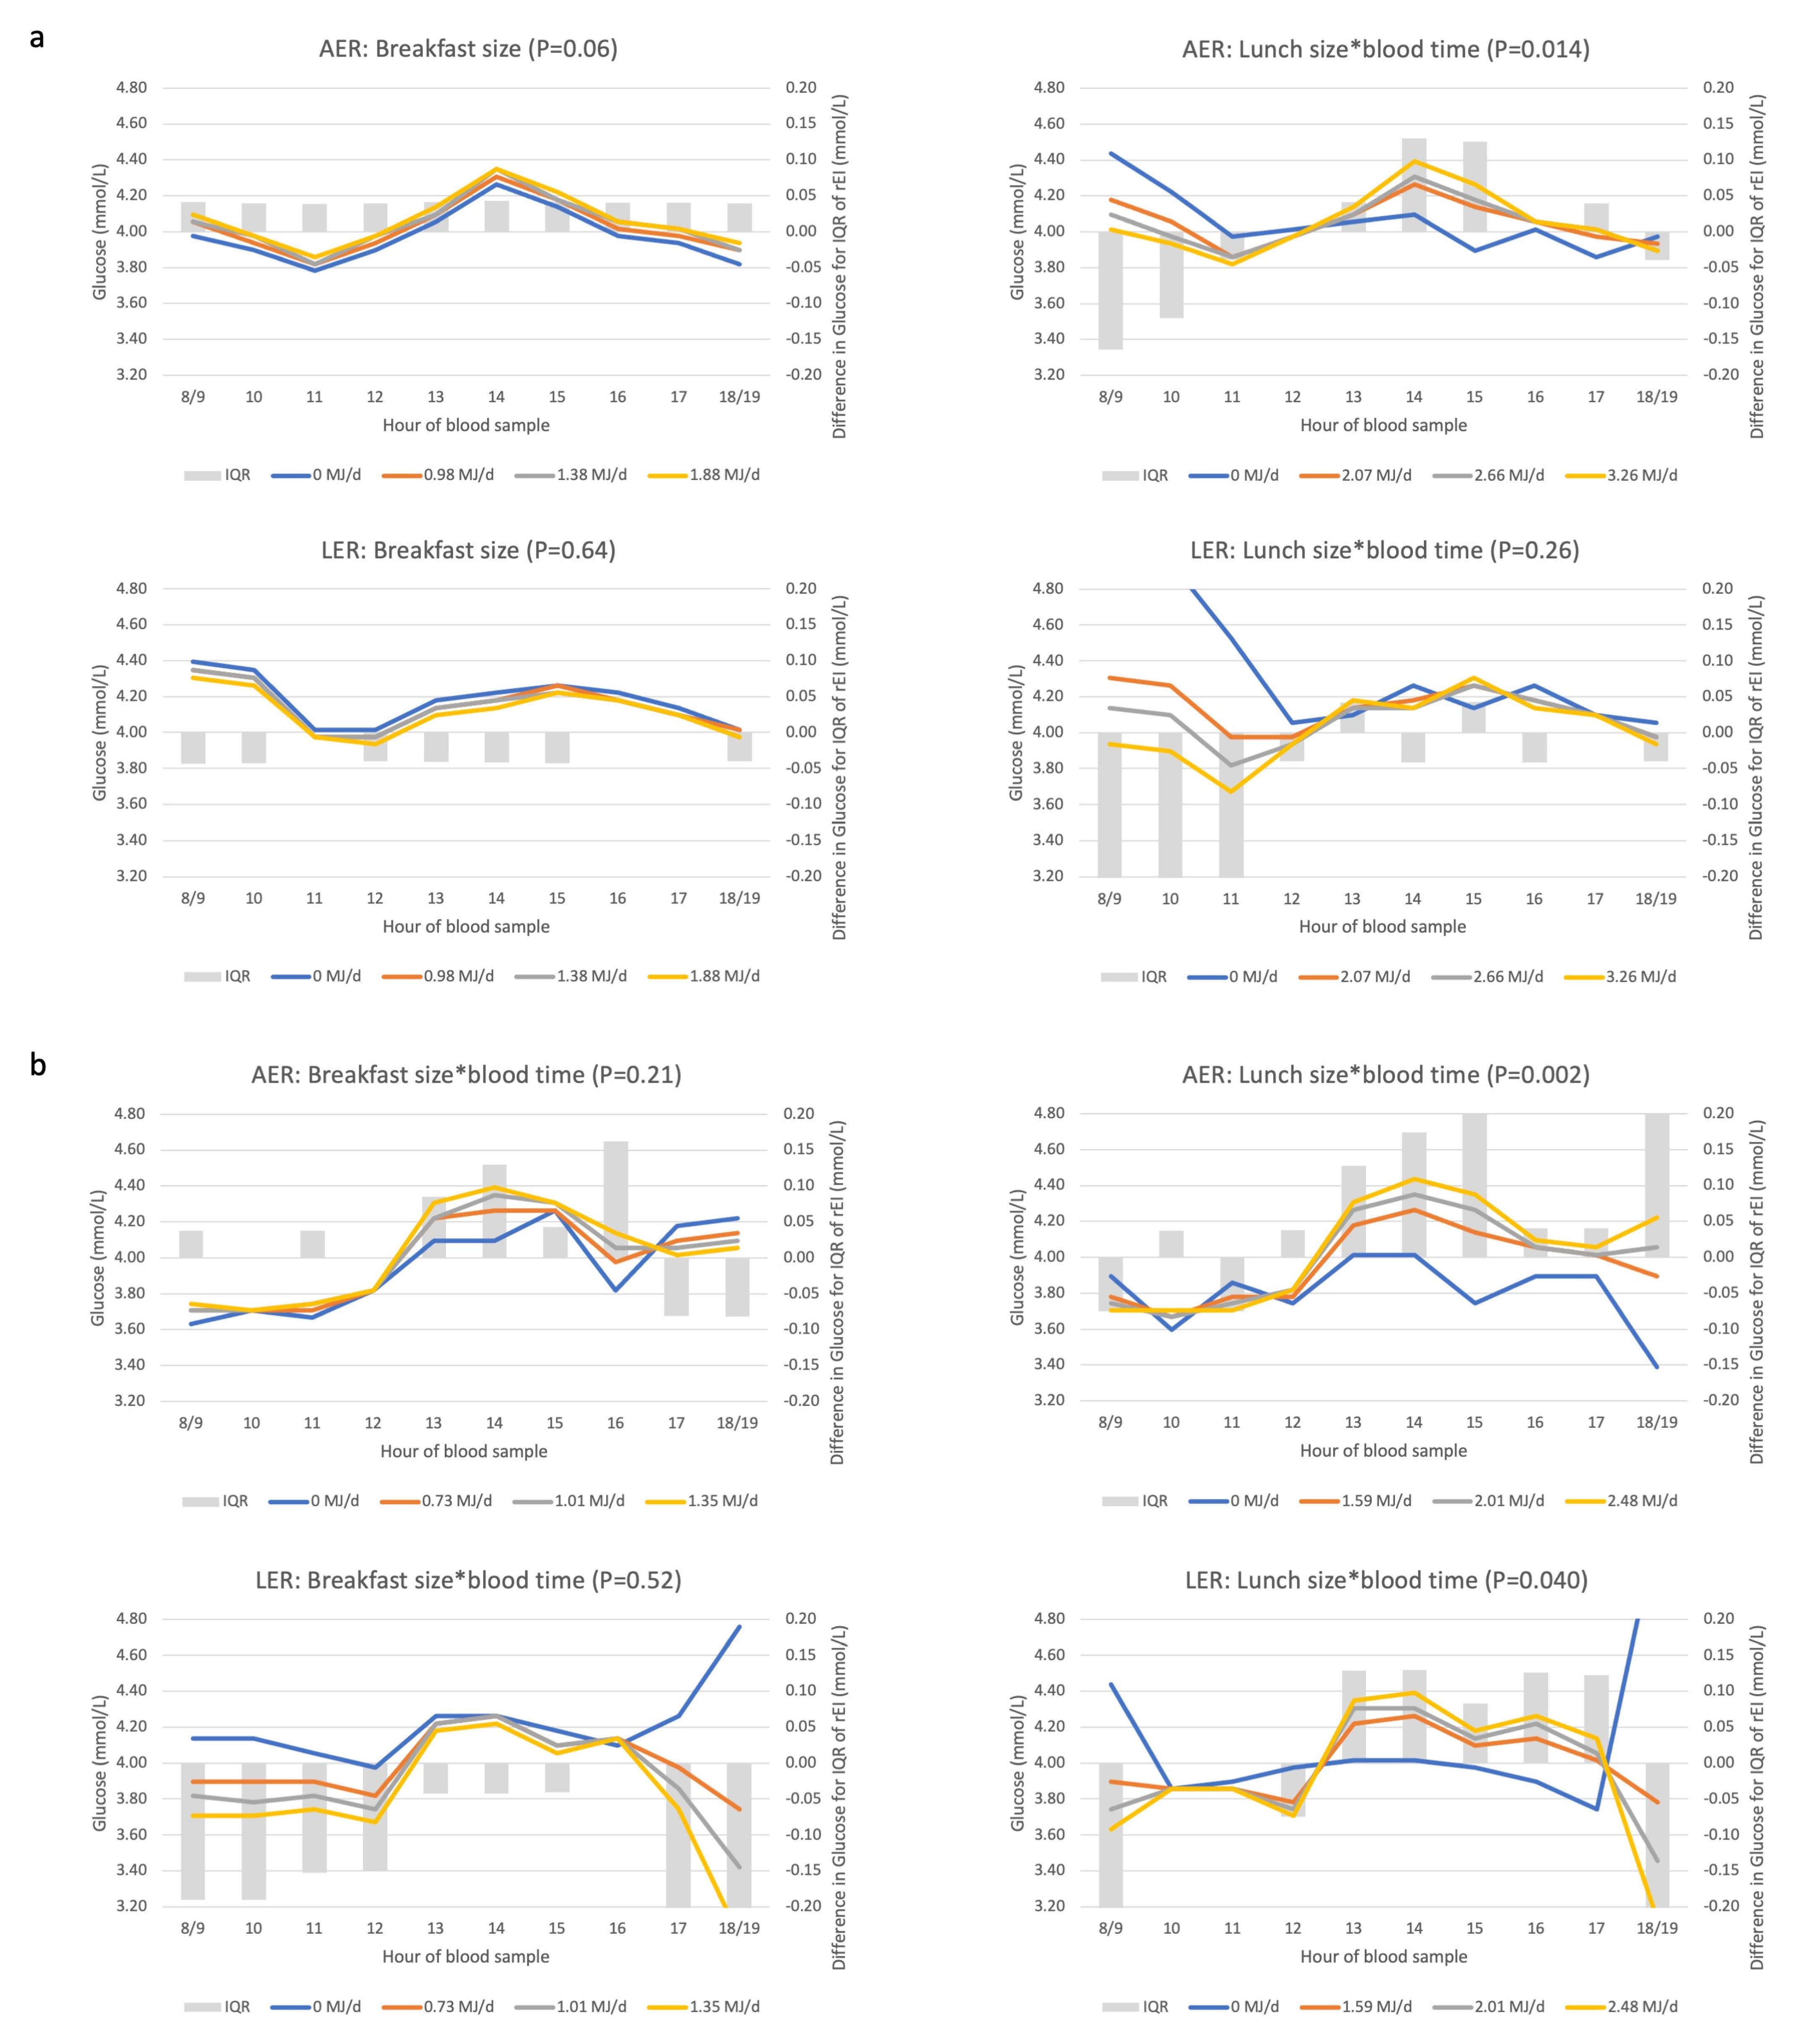
3.5. Associations between Eating Patterns and Glucose Concentrations
3.6. Underreporting Modifies Associations between Biomarkers and Eating Patterns
4. Discussion
4.1. Statement of Principal Findings
4.2. Strengths and Limitations of This Study
4.3. Results in Context of Other Studies
4.4. Relevance
5. Conclusions
Supplementary Materials
Author Contributions
Funding
Institutional Review Board Statement
Informed Consent Statement
Data Availability Statement
Acknowledgments
Conflicts of Interest
Abbreviations
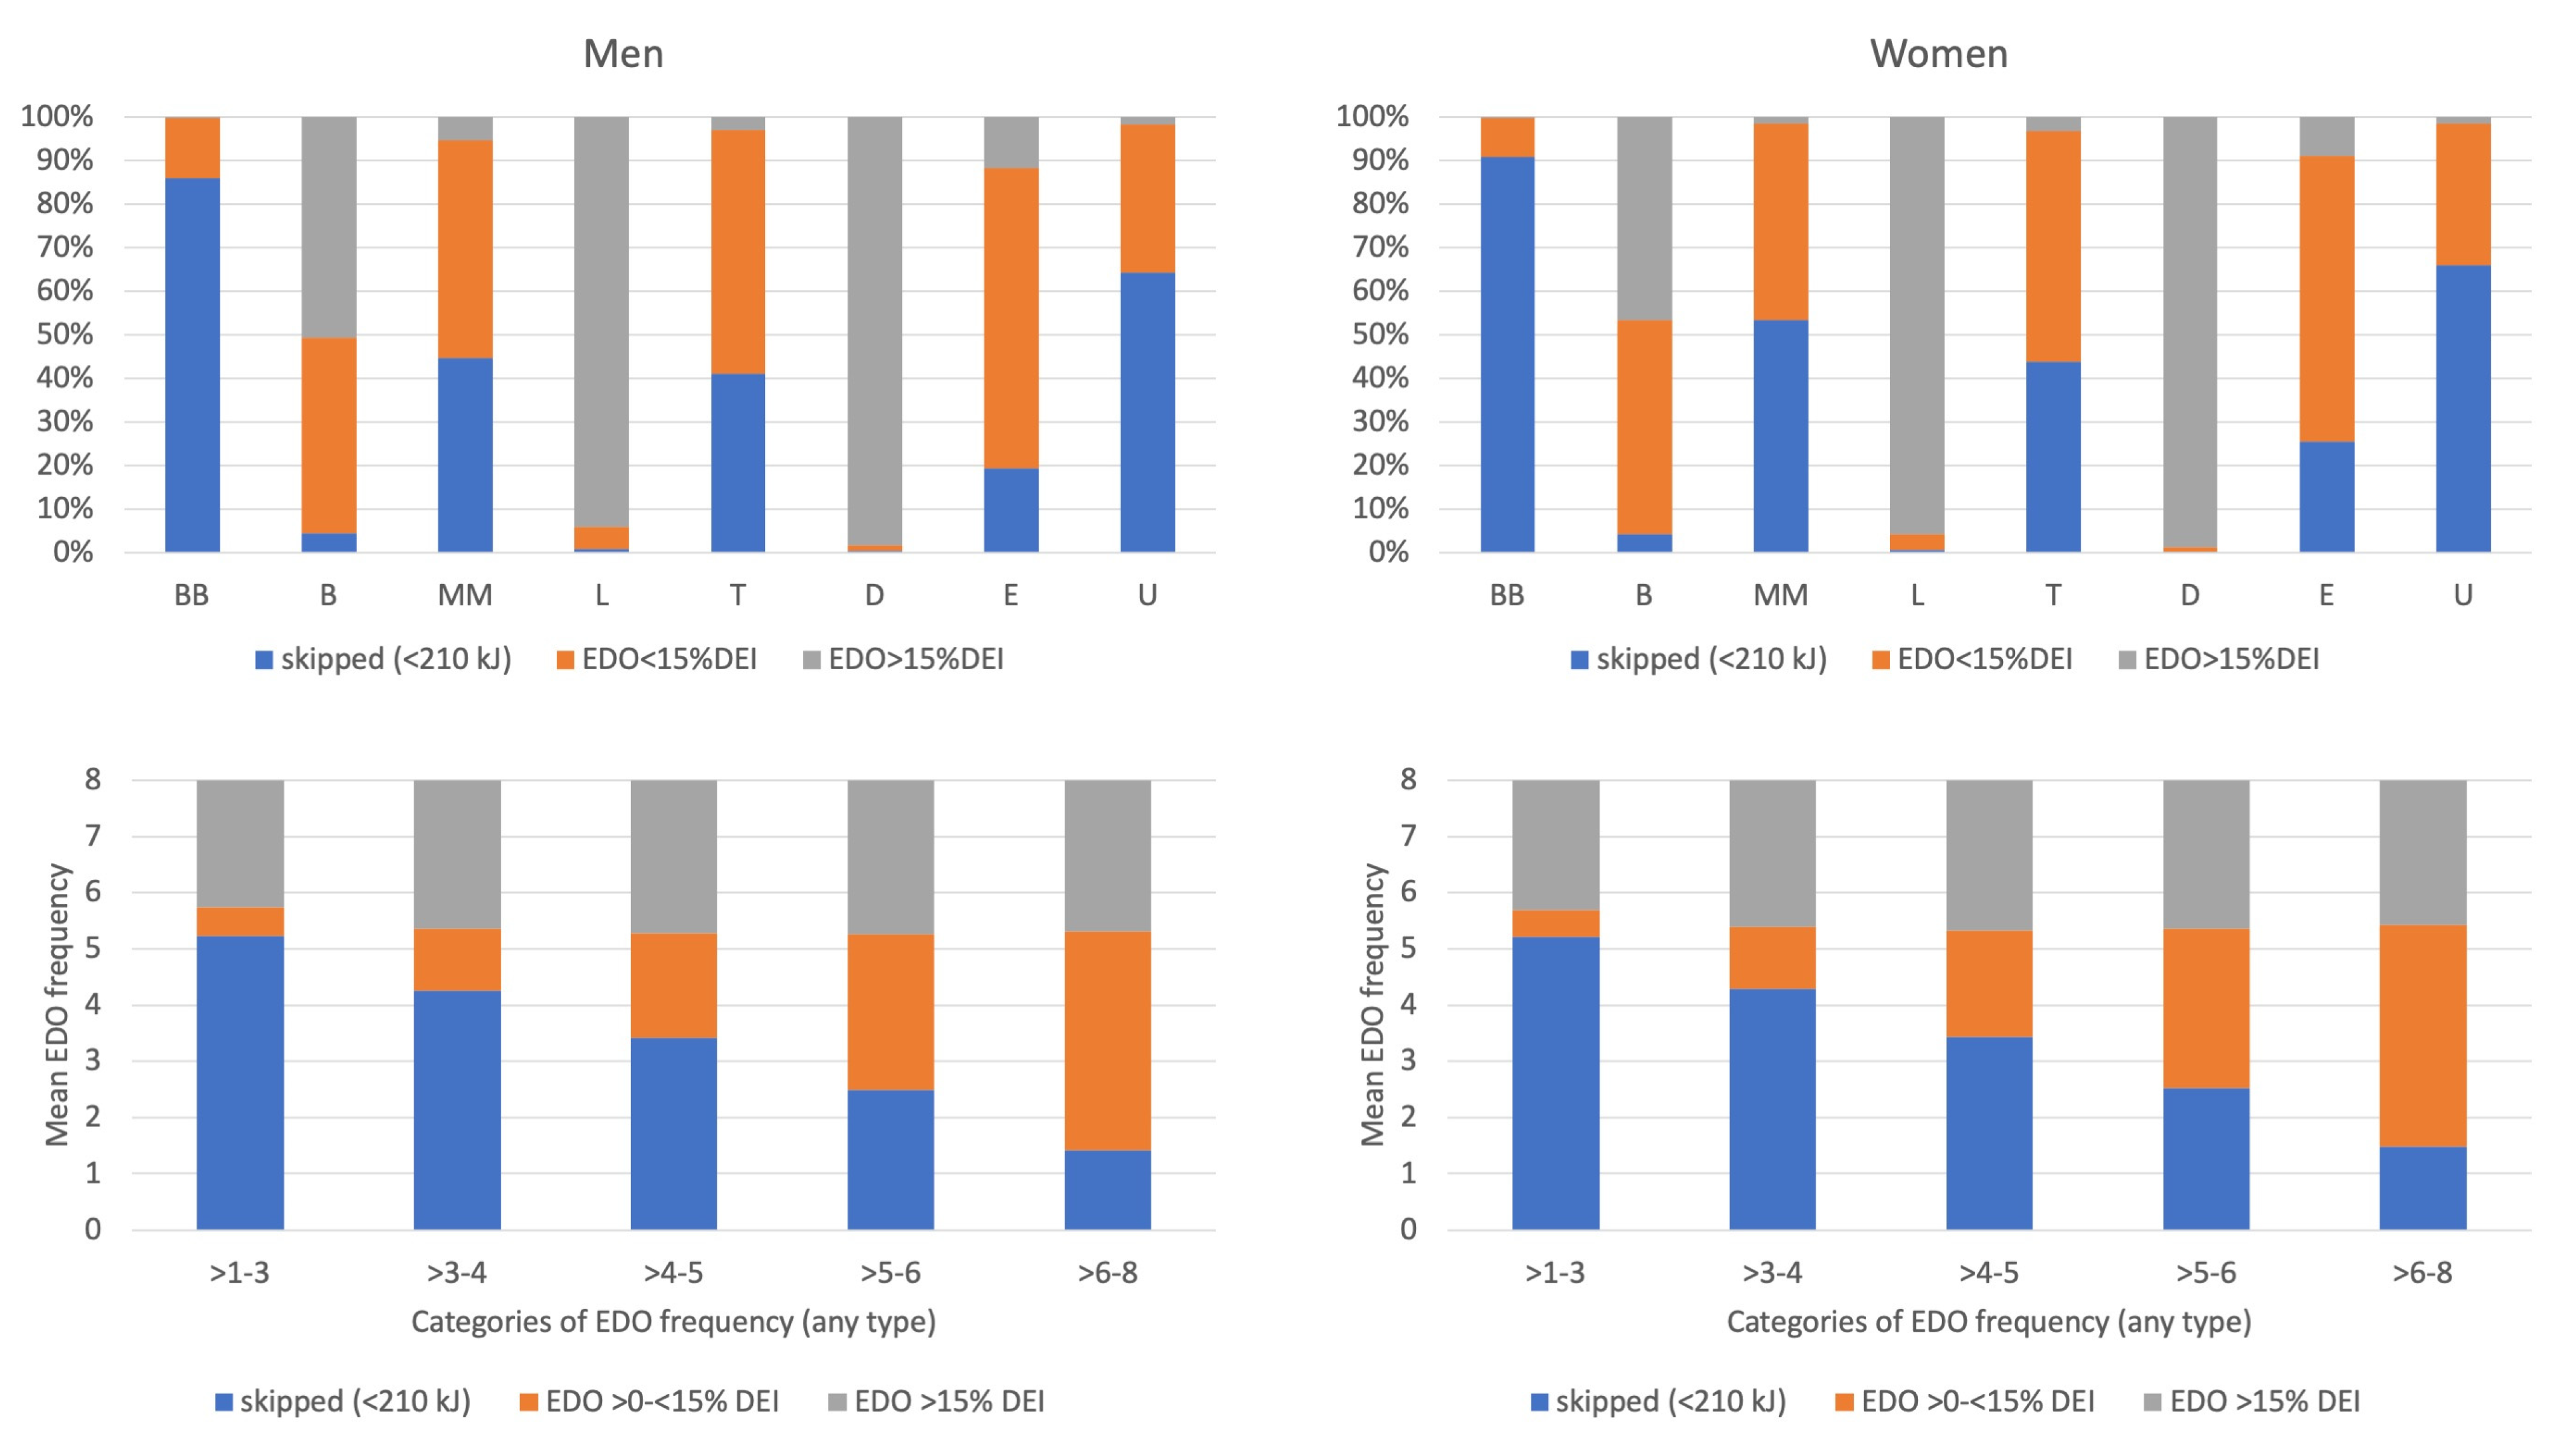
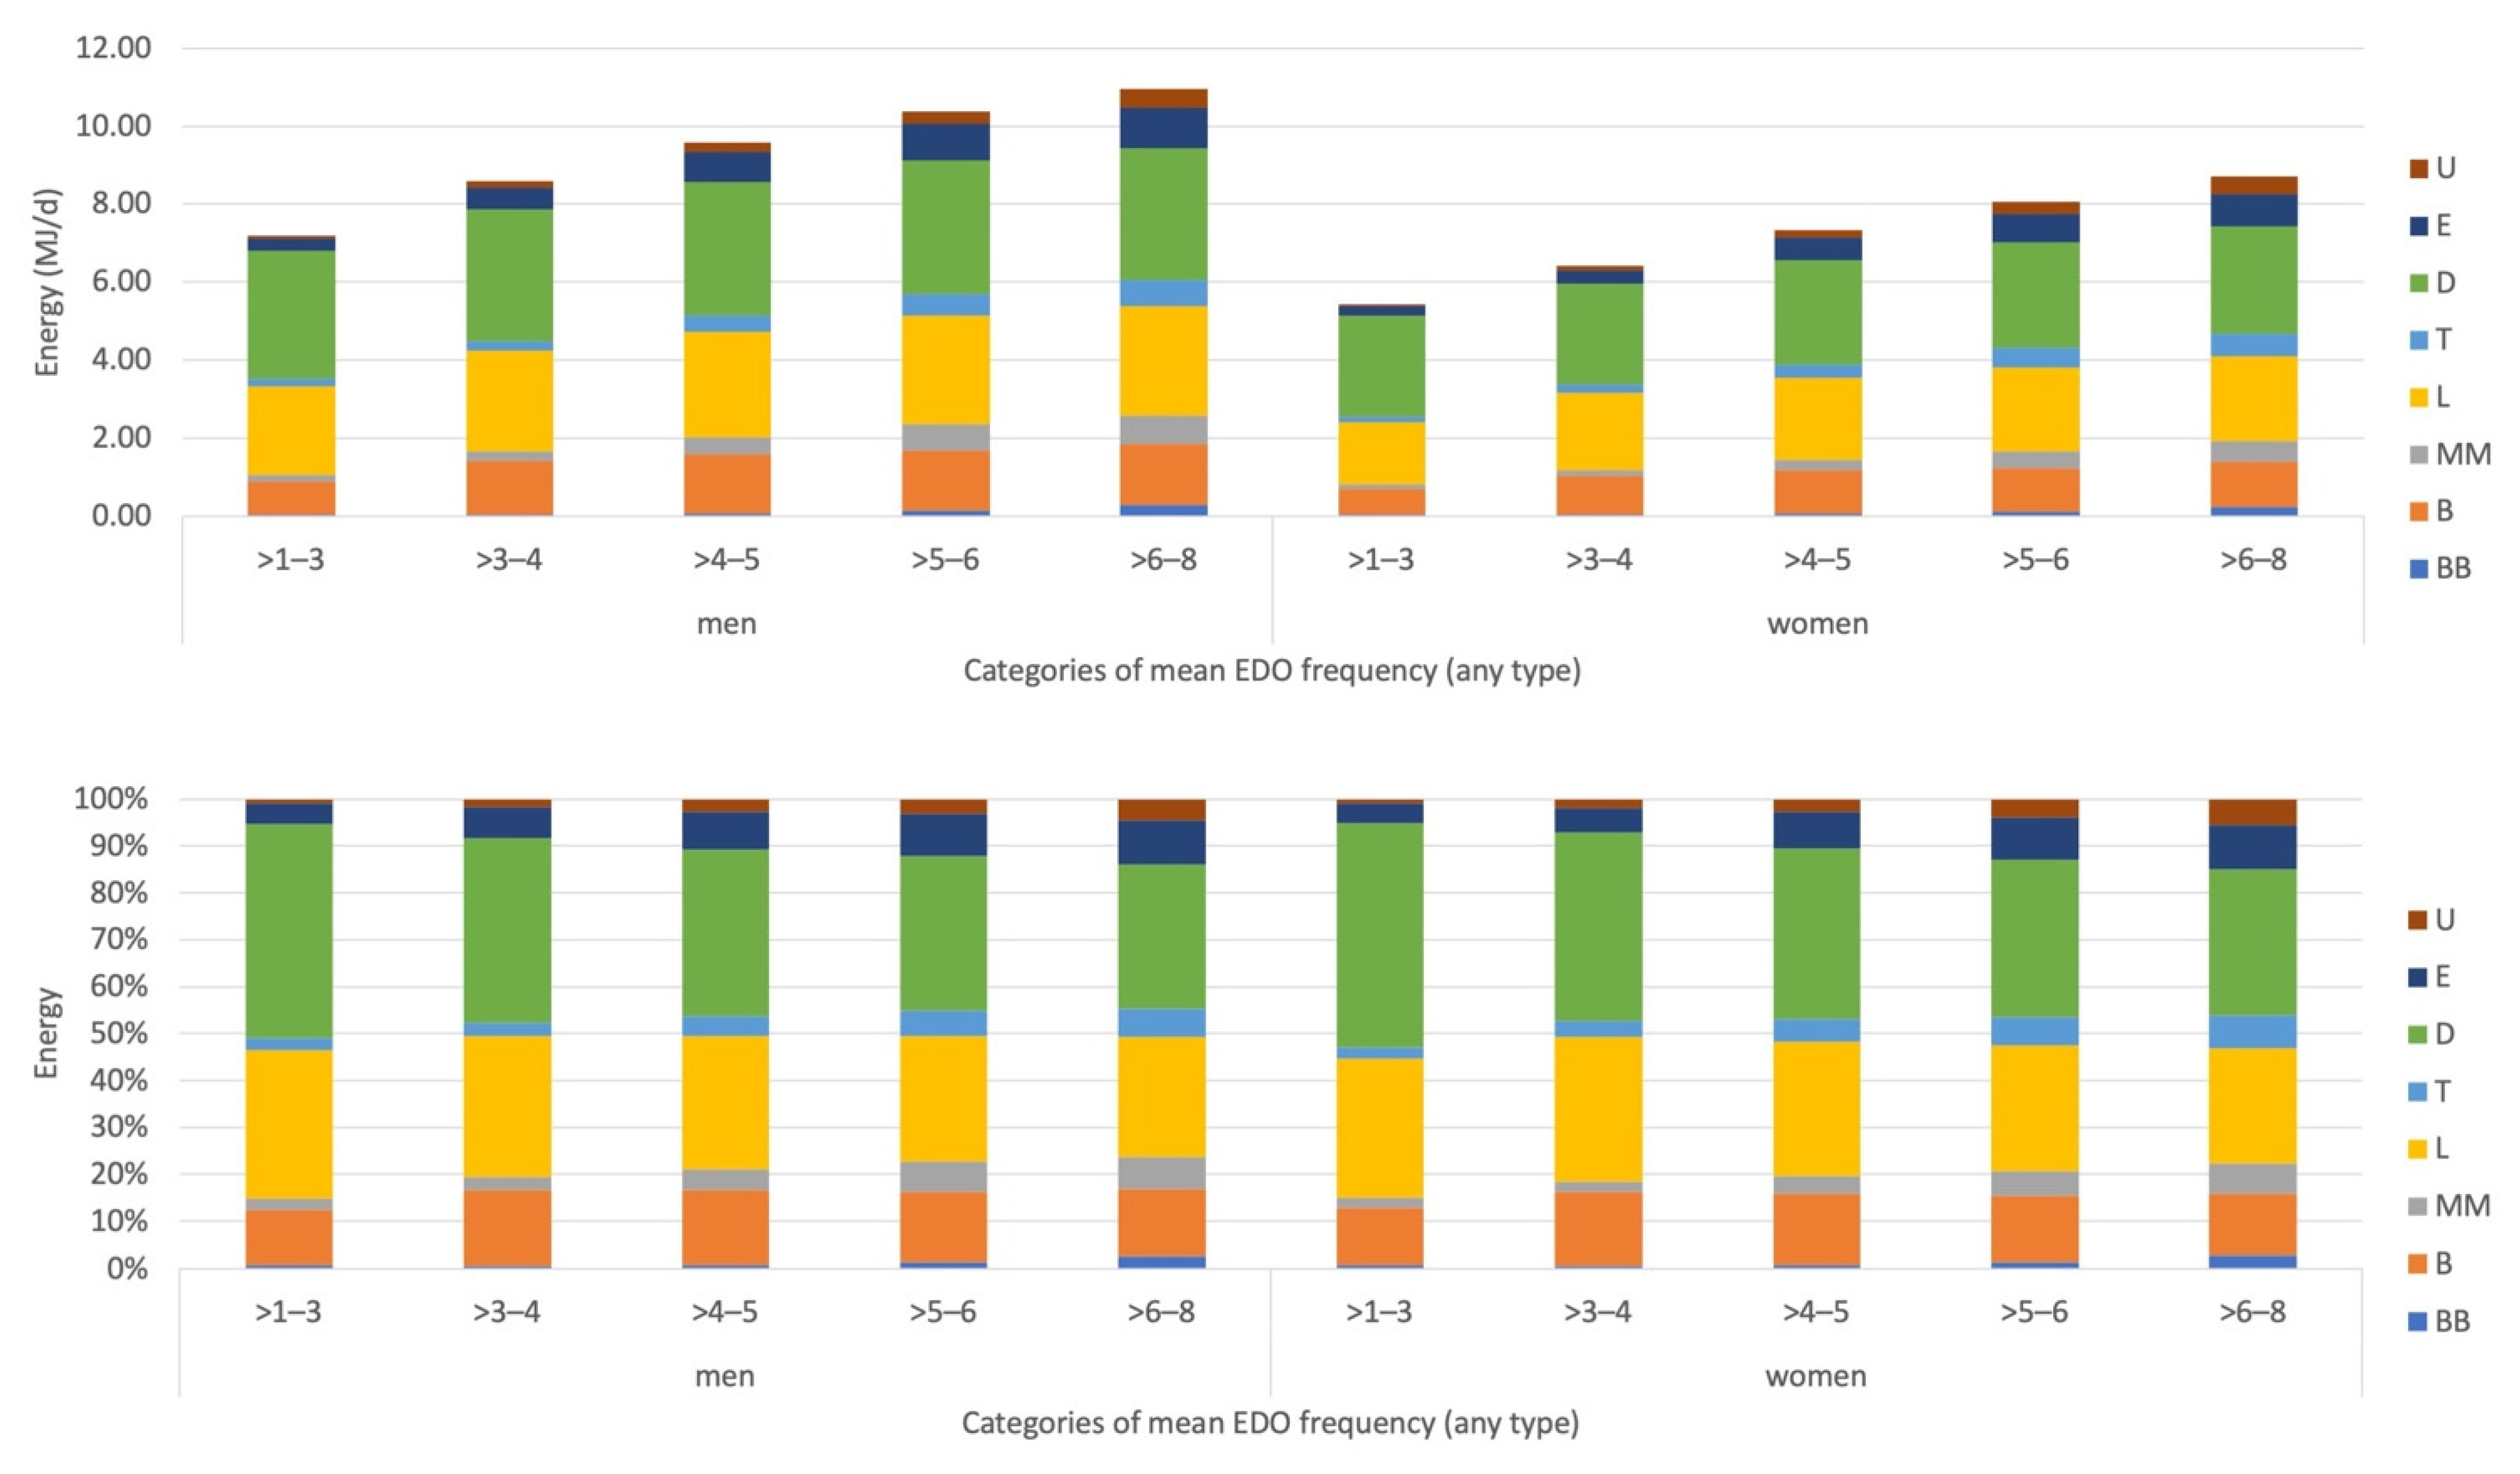
Appendix A. EDO Size and EDO Skipping by Recording Section and by EDO Frequency
Appendix B. Correlations between DEI and the Percentages of DEI Consumed at the Eight Recording Sections in the Pre-Structured 7dDD

| DEI (MJ/d) | BB (%DEI) | B (%DEI) | MM (%DEI) | L (%DEI) | T (%DEI) | D (%DEI) | E (%DEI) | U (%DEI) | ||
|---|---|---|---|---|---|---|---|---|---|---|
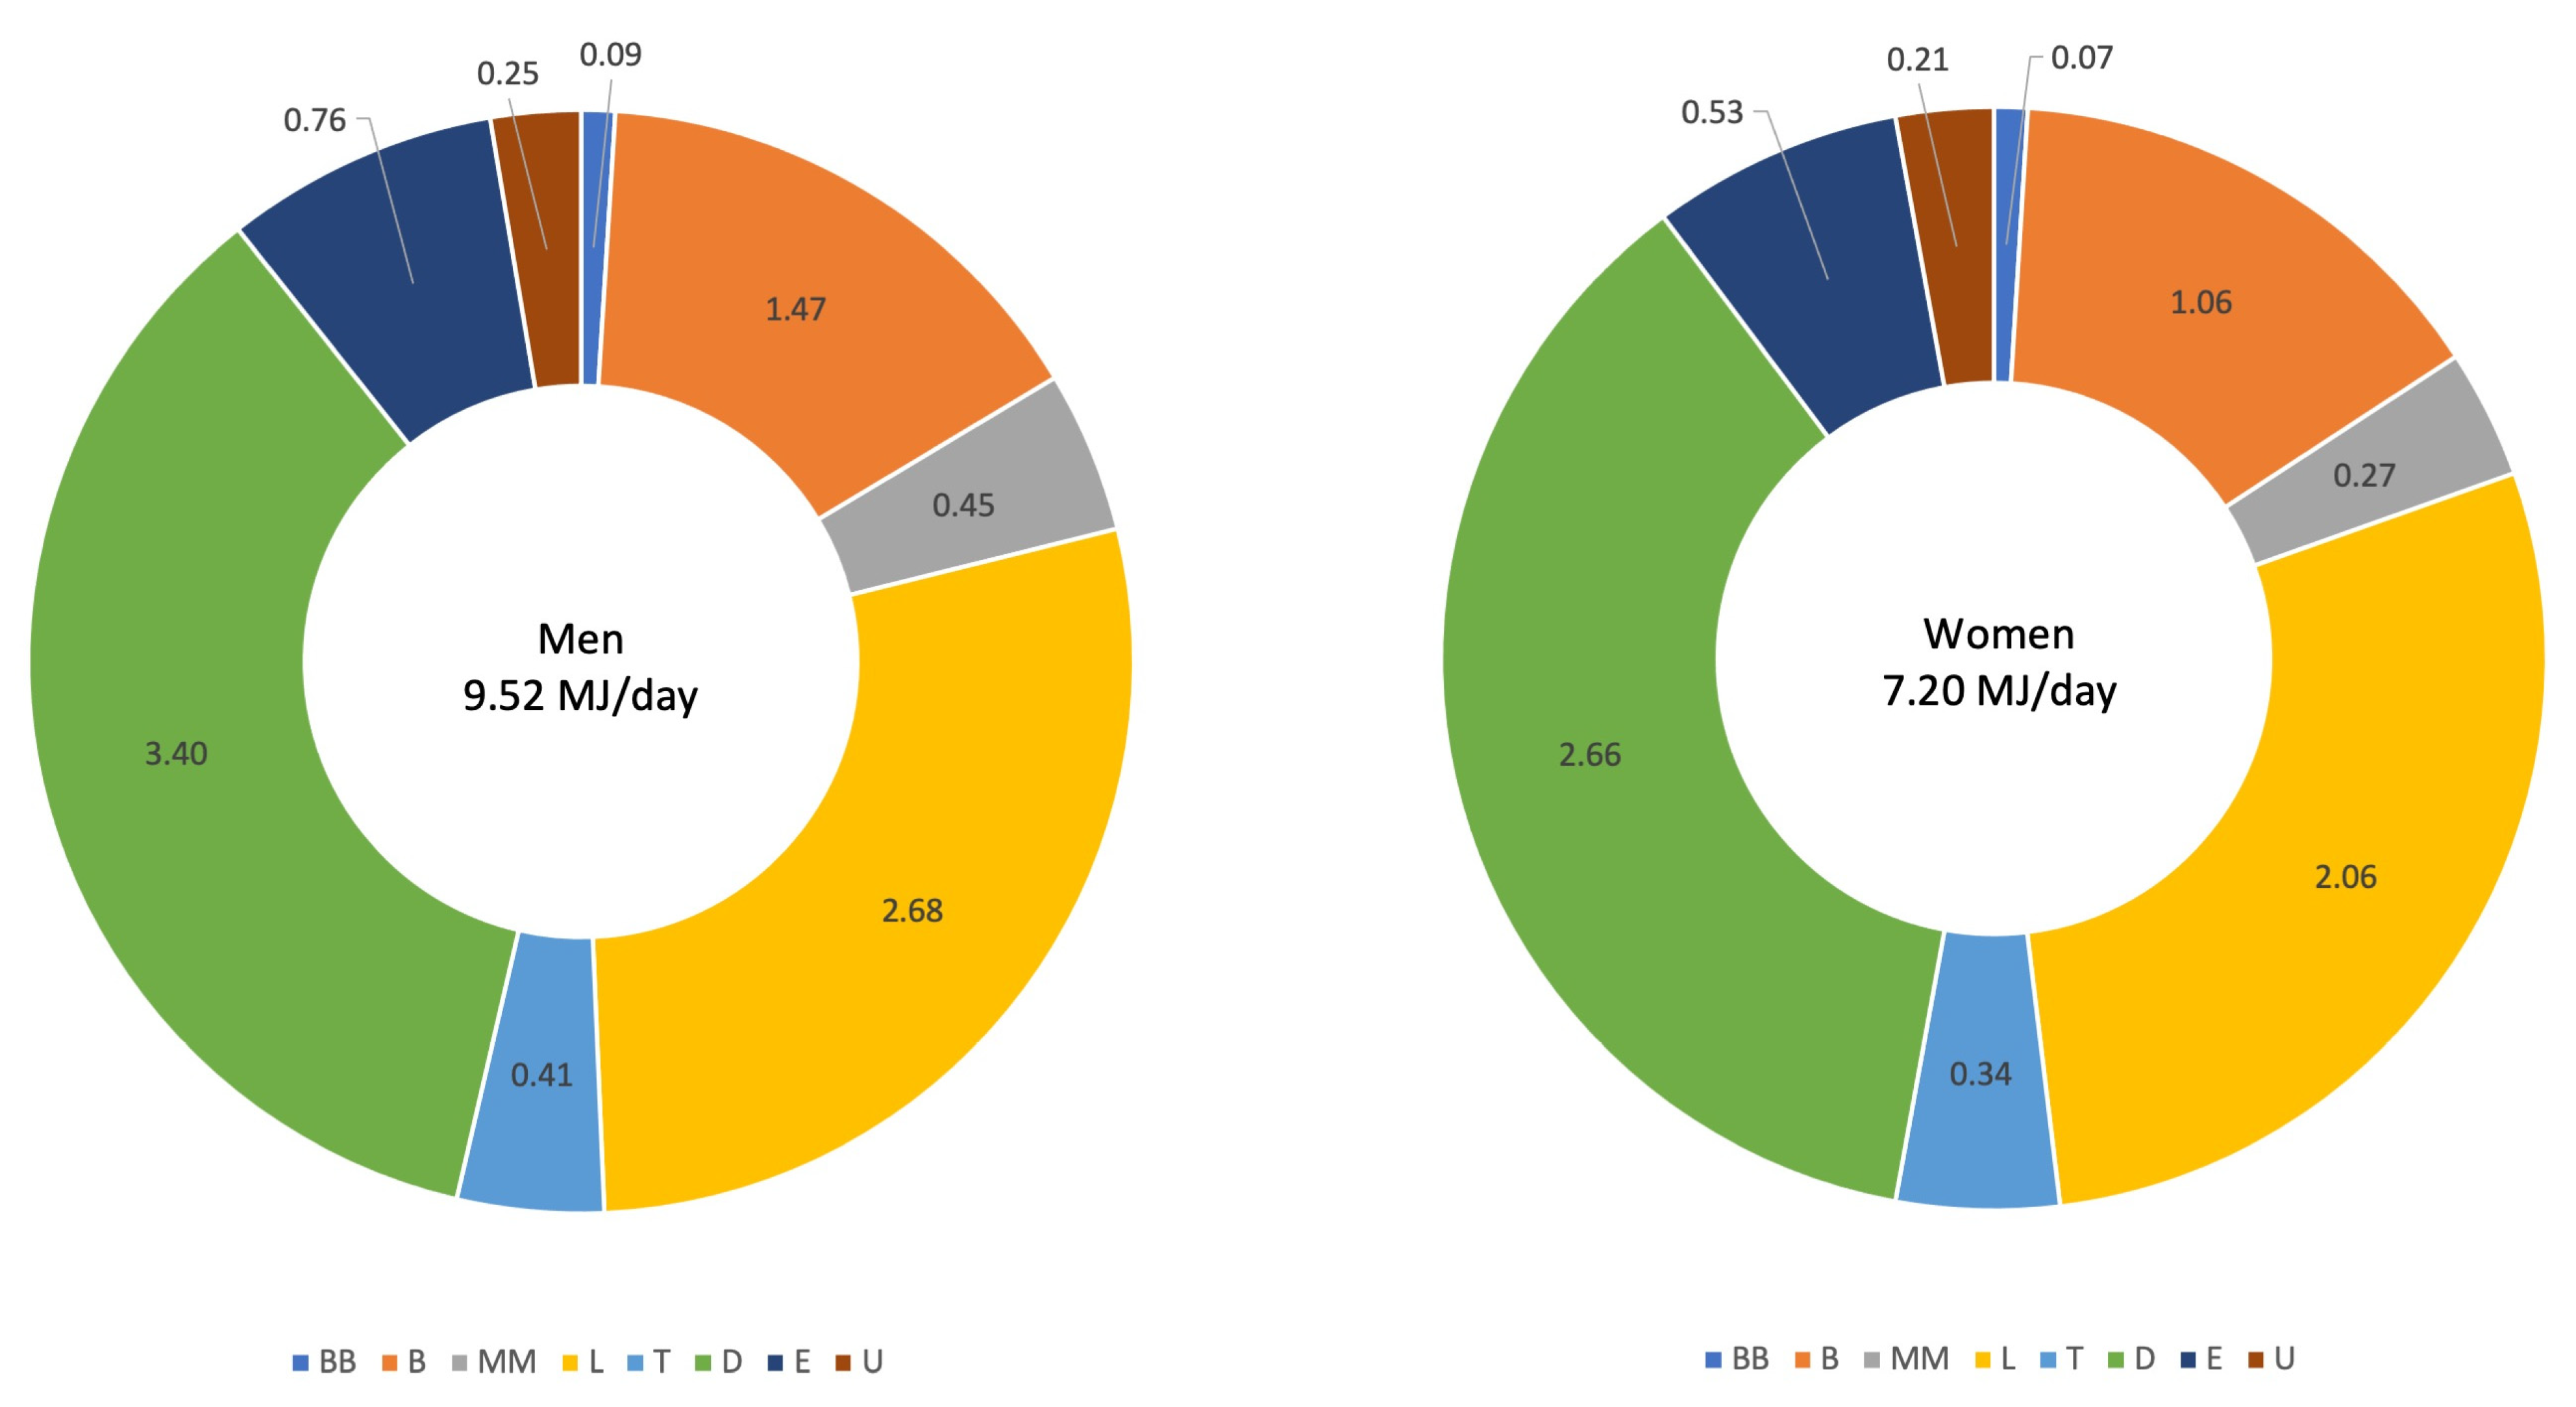
| men | 9.52 (2.19) | 1.0 (1.8) | 15.4 (7.3) | 4.5 (5.2) | 28.0 (8.9) | 4.2 (4.5) | 36.0 (9.8) | 7.8 (6.4) | 2.6 (4.0) | |
| women | ||||||||||
| DEI (MJ/d) | 7.20 (1.63) | −0.004 | −0.016 | 0.161 ** | −0.096 ** | 0.059 ** | −0.110 ** | 0.129 ** | 0.033 ** | |
| BB (%DEI) | 1.0 (1.6) | −0.009 | −0.088 ** | 0.022 * | −0.102 ** | 0.080 ** | −0.089 ** | 0.022 * | 0.016 | |
| B (%DEI) | 14.8 (6.4) | 0.007 | −0.090 ** | −0.239 ** | −0.121 ** | −0.091 ** | −0.253 ** | −0.237 ** | −0.108 ** | |
| MM (%DEI) | 3.7 (3.6) | 0.125 ** | 0.056 ** | −0.187 ** | −0.235 ** | 0.106 ** | −0.181 ** | 0.002 | −0.035 ** | |
| L (%DEI) | 28.7 (8.4) | −0.114 ** | −0.096 ** | −0.101 ** | −0.202 ** | −0.187 ** | −0.394 ** | −0.223 ** | −0.127 ** | |
| T (%DEI) | 4.7 (4.4) | 0.116 ** | 0.054 ** | −0.117 ** | 0.140 ** | −0.180 ** | −0.276 ** | −0.020 * | −0.011 | |
| D (%DEI) | 37.1 (9.6) | −0.097 ** | −0.099 ** | −0.253 ** | −0.167 ** | −0.465 ** | −0.287 ** | −0.240 ** | −0.149 ** | |
| E (%DEI) | 7.2 (5.7) | 0.107 ** | 0.024 ** | −0.221 ** | 0.024 ** | −0.209 ** | −0.007 | −0.242 ** | −0.057 ** | |
| U (%DEI) | 2.8 (3.8) | 0.074 ** | 0.030 ** | −0.143 ** | 0.003 | −0.120 ** | 0.004 | −0.163 ** | −0.069 ** |
Appendix C. Interpretation of the Association between DEI and/or EDO Frequency and Biomarker Concentrations
Appendix D. Description and Interpretation of the Line Graphs
References
- Leech, R.M.; Worsley, A.; Timperio, A.; McNaughton, S.A. Understanding meal patterns: Definitions, methodology and impact on nutrient intake and diet quality. Nutr. Res. Rev. 2015, 28, 1–21. [Google Scholar] [CrossRef] [Green Version]
- St-Onge, M.-P.; Ard, J.; Baskin, M.L.; Chiuve, S.E.; Johnson, H.M.; Kris-Etherton, P.; Varady, K. Meal timing and frequency: Implications for cardiovascular disease prevention: A scientific statement from the American Heart Association. Circulation 2017, 135, e96–e121. [Google Scholar] [CrossRef]
- Hutchison, A.T.; Heilbronn, L.K. Metabolic impacts of altering meal frequency and timing-does when we eat matter? Biochimie 2016, 124, 187–197. [Google Scholar] [CrossRef] [PubMed]
- Leech, R.M.; Worsley, A.; Timperio, A.; McNaughton, S.A. Characterizing eating patterns: A comparison of eating occasion definitions. Am. J. Clin. Nutr. 2015, 102, 1229–1237. [Google Scholar] [CrossRef]
- Murakami, K.; Livingstone, M.B.E. Associations between meal and snack frequency and diet quality and adiposity measures in British adults: Findings from the National Diet and Nutrition Survey. Public Health Nutr. 2016, 19, 1624–1634. [Google Scholar] [CrossRef] [PubMed] [Green Version]
- Leech, R.M.; Worsley, A.; Timperio, A.; McNaughton, S.A. The role of energy intake and energy misreporting in the associations between eating patterns and adiposity. Eur. J. Clin. Nutr. 2018, 72, 142–147. [Google Scholar] [CrossRef]
- Blaak, E.E.; Antoine, J.M.; Benton, D.; Björck, I.; Bozzetto, L.; Brouns, F.; Diamant, M.; Dye, L.; Hulshof, T.; Holst, J.J.; et al. Impact of postprandial glycaemia on health and prevention of disease. Obes. Rev. 2012, 13, 923–984. [Google Scholar] [CrossRef]
- Bansal, S.; Buring, J.E.; Rifai, N.; Mora, S.; Sacks, F.M.; Ridker, P.M. Fasting compared with nonfasting triglycerides and risk of cardiovascular events in women. JAMA 2007, 298, 309–316. [Google Scholar] [CrossRef] [Green Version]
- Rui, L. Energy metabolism in the liver. Compr. Physiol. 2014, 4, 177–197. [Google Scholar] [CrossRef] [PubMed] [Green Version]
- Sanders, F.W.B.; Griffin, J.L. De novo lipogenesis in the liver in health and disease: More than just a shunting yard for glucose. Biol. Rev. 2016, 91, 452–468. [Google Scholar] [CrossRef] [Green Version]
- Lambert, J.E.; Parks, E.J. Postprandial metabolism of meal triglyceride in humans. Biochim. Biophys. Acta 2012, 1821, 721–726. [Google Scholar] [CrossRef] [Green Version]
- Bonham, M.P.; Kaias, E.; Zimberg, I.; Leung, G.K.W.; Davis, R.; Sletten, T.L.; Windsor-Aubrey, H.; Huggins, C.E. Effect of night time eating on postprandial triglyceride metabolism in healthy adults: A systematic literature review. J. Biol. Rhythms 2019, 34, 119–130. [Google Scholar] [CrossRef]
- Morgan, L.; Arendt, J.; Owens, D.; Folkard, S.; Hampton, S.; Deacon, S.; English, J.; Ribeiro, D.; Taylor, K. Effects of the endogenous clock and sleep time on melatonin, insulin, glucose and lipid metabolism. J. Endocrinol. 1998, 157, 443–451. [Google Scholar] [CrossRef] [PubMed] [Green Version]
- Van Cauter, E.; Polonsky, K.S.; Scheen, A.J. Roles of circadian rhythmicity and sleep in human glucose regulation. Endocr. Rev. 1997, 18, 716–738. [Google Scholar] [CrossRef] [Green Version]
- Berry, S.E.; Valdes, A.M.; Drew, D.A.; Asnicar, F.; Mazidi, M.; Wolf, J.; Capdevila, J.; Hadjigeorgiou, G.; Davies, R.; Al Khatib, H.; et al. Human postprandial responses to food and potential for precision nutrition. Nat. Med. 2020, 26, 964–973. [Google Scholar] [CrossRef]
- McCrory, M.A.; Howarth, N.C.; Roberts, S.B.; Huang, T.T.-K. Eating frequency and energy regulation in free-living adults consuming self-selected diets. J. Nutr. 2010, 141, 148–153. [Google Scholar] [CrossRef] [Green Version]
- Park, Y.; Dodd, K.W.; Kipnis, V.; Thompson, F.E.; Potischman, N.; Schoeller, D.A.; Baer, D.J.; Midthune, D.; Troiano, R.P.; Bowles, H.; et al. Comparison of self-reported dietary intakes from the Automated Self-Administered 24-h recall, 4-d food records, and food-frequency questionnaires against recovery biomarkers. Am. J. Clin. Nutr. 2018, 107, 80–93. [Google Scholar] [CrossRef] [PubMed] [Green Version]
- Gemming, L.; Ni Mhurchu, C. Dietary under-reporting: What foods and which meals are typically under-reported? Eur. J. Clin. Nutr. 2016, 70, 640–641. [Google Scholar] [CrossRef] [PubMed]
- Day, N.; Oakes, S.; Luben, R.; Khaw, K.T.; Bingham, S.; Welch, A.; Wareham, N. EPIC-Norfolk: Study design and characteristics of the cohort. European Prospective Investigation of Cancer. Br. J. Cancer 1999, 80, 95–103. [Google Scholar]
- Bingham, S.A.; Welch, A.A.; McTaggart, A.; Mulligan, A.A.; Runswick, S.A.; Luben, R.; Oakes, S.; Khaw, K.T.; Wareham, N.; Day, N.E. Nutritional methods in the European Prospective Investigation of Cancer in Norfolk. Public Health Nutr. 2001, 4, 847–858. [Google Scholar] [CrossRef]
- Welch, A.A.; McTaggart, A.; Mulligan, A.A.; Luben, R.; Walker, N.; Khaw, K.T.; Day, N.E.; Bingham, S.A. DINER (Data Into Nutrients for Epidemiological Research)-a new data-entry program for nutritional analysis in the EPIC-Norfolk cohort and the 7-day diary method. Public Health Nutr. 2001, 4, 1253–1265. [Google Scholar] [CrossRef] [PubMed] [Green Version]
- Lentjes, M.A.H.; McTaggart, A.; Mulligan, A.A.; Powell, N.A.; Parry-Smith, D.; Luben, R.N.; Bhaniani, A.; Welch, A.A.; Khaw, K.-T. Dietary intake measurement using 7 d diet diaries in British men and women in the European Prospective Investigation into Cancer-Norfolk study: A focus on methodological issues. Br. J. Nutr. 2014, 111, 516–526. [Google Scholar] [CrossRef] [PubMed]
- Shohaimi, S.; Bingham, S.; Welch, A.; Luben, R.; Day, N.; Wareham, N.; Khaw, K.-T. Occupational social class, educational level and area deprivation independently predict plasma ascorbic acid concentration: A cross-sectional population based study in the Norfolk cohort of the European Prospective Investigation into Cancer (EPIC-Norfolk). Eur. J. Clin. Nutr. 2004, 58, 1432–1435. [Google Scholar] [CrossRef] [PubMed] [Green Version]
- Wareham, N.J.; Jakes, R.W.; Rennie, K.L.; Schuit, J.; Mitchell, J.; Hennings, S.; Day, N.E. Validity and repeatability of a simple index derived from the short physical activity questionnaire used in the European Prospective Investigation into Cancer and Nutrition (EPIC) study. Public Health Nutr. 2003, 6, 407–413. [Google Scholar] [CrossRef] [Green Version]
- Scientific Advisory Committee on Nutrition (SACN). Dietary Reference Values for Energy; The Stationery Office (TSO): London, UK, 2011. [Google Scholar]
- Subar, A.F.; Kipnis, V.; Troiano, R.P.; Midthune, D.; Schoeller, D.A.; Bingham, S.; Sharbaugh, C.O.; Trabulsi, J.; Runswick, S.; Ballard-Barbash, R.; et al. Using intake biomarkers to evaluate the extent of dietary misreporting in a large sample of adults: The OPEN study. Am. J. Epidemiol. 2003, 158, 1–13. [Google Scholar] [CrossRef]
- Millen, A.E.; Tooze, J.A.; Subar, A.F.; Kahle, L.L.; Schatzkin, A.; Krebs-Smith, S.M. Differences between food group reports of low-energy reporters and non-low-energy reporters on a food frequency questionnaire. J. Am. Diet. Assoc. 2009, 109, 1194–1203. [Google Scholar] [CrossRef] [Green Version]
- Neeland, I.J.; Poirier, P.; Després, J.P. Cardiovascular and metabolic heterogeneity of obesity: Clinical challenges and implications for management. Circulation 2018, 137, 1391–1406. [Google Scholar] [CrossRef]
- Black, A.E. Critical evaluation of energy intake using the Goldberg cut-off for energy intake:basal metabolic rate. A practical guide to its calculation, use and limitations. Int. J. Obes. Relat. Metab. Disord. 2000, 24, 1119–1130. [Google Scholar] [CrossRef] [Green Version]
- Chiuve, S.E.; Jensen, M.K.; Cahill, L.E.; Flint, A.J.; Rimm, E.B.; Hu, F.B.; Mekary, R.A. Prospective study of breakfast eating and incident coronary heart disease in a cohort of male US health professionals. Circulation 2013, 128, 337–343. [Google Scholar] [CrossRef]
- Huseinovic, E.; Winkvist, A.; Slimani, N.; Park, M.K.; Freisling, H.; Boeing, H.; Buckland, G.; Schwingshackl, L.; Weiderpass, E.; Rostgaard-Hansen, A.L.; et al. Meal patterns across ten European countries-results from the European Prospective Investigation into Cancer and Nutrition (EPIC) calibration study. Public Health Nutr. 2016, 19, 2769–2780. [Google Scholar] [CrossRef] [PubMed] [Green Version]
- Huseinovic, E.; Winkvist, A.; Freisling, H.; Slimani, N.; Boeing, H.; Buckland, G.; Schwingshackl, L.; Olsen, A.; Tjonneland, A.; Stepien, M.; et al. Timing of eating across ten European countries-results from the European Prospective Investigation into Cancer and Nutrition (EPIC) calibration study. Public Health Nutr. 2019, 22, 324–335. [Google Scholar] [CrossRef] [PubMed] [Green Version]
- McCrory, M.A.; Shaw, A.C.; Lee, J.A. Energy and nutrient timing for weight control: Does timing of ingestion matter? Endocrinol. Metab. Clin. North Am. 2016, 45, 689–718. [Google Scholar] [CrossRef] [PubMed]
- Leech, R.M.; Worsley, A.; Timperio, A.; McNaughton, S.A. Temporal eating patterns: A latent class analysis approach. Int. J. Behav. Nutr. Phys. Act. 2017, 14, 1–9. [Google Scholar] [CrossRef] [Green Version]
- Almoosawi, S.; Vingeliene, S.; Karagounis, L.G.; Pot, G.K. Chrono-nutrition: A review of current evidence from observational studies on global trends in time-of-day of energy intake and its association with obesity. Proc. Nutr. Soc. 2016, 75, 487–500. [Google Scholar] [CrossRef] [PubMed] [Green Version]
- Marty, N.; Dallaporta, M.; Thorens, B. Brain glucose sensing, counterregulation, and energy homeostasis. Physiology 2007, 22, 241–251. [Google Scholar] [CrossRef] [Green Version]
- Munsters, M.J.M.; Saris, W.H.M. Effects of meal frequency on metabolic profiles and substrate partitioning in lean healthy males. PLoS ONE 2012, 7, e38632. [Google Scholar] [CrossRef] [Green Version]
- Manolopoulos, K.N.; Karpe, F.; Frayn, K.N. Gluteofemoral body fat as a determinant of metabolic health. Int. J. Obes. 2010, 34, 949–959. [Google Scholar] [CrossRef] [Green Version]
- Tchernof, A.; Després, J.-P. Pathophysiology of human visceral obesity: An update. Physiol. Rev. 2013, 93, 359–404. [Google Scholar] [CrossRef]
- Xiao, C.; Lewis, G.F. Regulation of chylomicron production in humans. Biochim. Biophys. Acta Mol. Cell Biol. Lipids 2012, 1821, 736–746. [Google Scholar] [CrossRef]
- Neeland, I.J.; Hughes, C.; Ayers, C.R.; Malloy, C.R.; Jin, E.S. Effects of visceral adiposity on glycerol pathways in gluconeogenesis. Metabolism 2017, 67, 80–89. [Google Scholar] [CrossRef] [Green Version]
- Oosterman, J.E.; Kalsbeek, A.; La Fleur, S.E.; Belsham, D.D. Impact of nutrients on circadian rhythmicity. Am. J. Physiol. Regul. Integr. Comp. Physiol. 2015, 308, R337–R350. [Google Scholar] [CrossRef] [PubMed] [Green Version]
- Robertson, M.D.; Henderson, R.A.; Vist, G.E.; Rumsey, R.D.E. Extended effects of evening meal carbohydrate-to-fat ratio on fasting and postprandial substrate metabolism. Am. J. Clin. Nutr. 2002, 75, 505–510. [Google Scholar] [CrossRef] [PubMed] [Green Version]
- Subar, A.F.; Freedman, L.S.; Tooze, J.A.; Kirkpatrick, S.I.; Boushey, C.; Neuhouser, M.L.; Thompson, F.E.; Potischman, N.; Guenther, P.M.; Tarasuk, V.; et al. Addressing current criticism regarding the value of self-report dietary data. J. Nutr. 2015, 145, 2639–2645. [Google Scholar] [CrossRef] [Green Version]
- Johnston, J.D. Physiological responses to food intake throughout the day. Nutr. Res. Rev. 2014, 27, 107–118. [Google Scholar] [CrossRef] [Green Version]
- Potter, G.D.M.; Cade, J.E.; Grant, P.J.; Hardie, L.J. Nutrition and the circadian system. Br. J. Nutr. 2016, 116, 434–442. [Google Scholar] [CrossRef] [Green Version]
- Schwedhelm, C.; Schwingshackl, L.; Agogo, G.O.; Sonestedt, E.; Boeing, H.; Knüppel, S. Associations of food groups and cardiometabolic and inflammatory biomarkers: Does the meal matter? Br. J. Nutr. 2019, 122, 707–716. [Google Scholar] [CrossRef] [Green Version]
- Almoosawi, S.; Prynne, C.J.; Hardy, R.; Stephen, A.M. Time-of-day and nutrient composition of eating occasions: Prospective association with the metabolic syndrome in the 1946 British birth cohort. Int. J. Obes. 2013, 37, 725–731. [Google Scholar] [CrossRef] [PubMed] [Green Version]
- Gibney, M.J.; Barr, S.I.; Bellisle, F.; Drewnowski, A.; Fagt, S.; Livingstone, B.; Masset, G.; Moreiras, G.V.; Moreno, L.A.; Smith, J.; et al. Breakfast in human nutrition: The international breakfast research initiative. Nutrients 2018, 10, 559. [Google Scholar] [CrossRef] [Green Version]
- Almoosawi, S.; Vingeliene, S.; Gachon, F.; Voortman, T.; Palla, L.; Johnston, J.D.; Van Dam, R.M.; Darimont, C.; Karagounis, L.G. Chronotype: Implications for epidemiologic studies on chrono-nutrition and cardiometabolic health. Adv. Nutr. 2019, 10, 30–42. [Google Scholar] [CrossRef] [PubMed] [Green Version]
- Almoosawi, S.; Prynne, C.J.; Hardy, R.; Stephen, A.M. Time-of-day of energy intake: Association with hypertension and blood pressure 10 years later in the 1946 British Birth Cohort. J. Hypertens. 2013, 31, 882–892. [Google Scholar] [CrossRef]
- Lentjes, M.; Mulligan, A.A.; Welch, A.A.; Bhaniani, A.; Luben, R.N.; Khaw, K.T. Participants who ’eat like a King in the Morning’ have lower Cholesterol concentrations. Proc. Nutr. Soc. 2013, 72, E297. [Google Scholar] [CrossRef] [Green Version]
- Purslow, L.R.; Sandhu, M.S.; Forouhi, N.; Young, E.H.; Luben, R.N.; Welch, A.A.; Khaw, K.-T.; Bingham, S.A.; Wareham, N.J. Energy intake at breakfast and weight change: Prospective study of 6764 middle-aged men and women. Am. J. Epidemiol. 2007, 167, 188–192. [Google Scholar] [CrossRef] [PubMed]

| Exposure | Adjustment b | Log-Triglycerides (mmoL/L) Beta (95%CI) | |
|---|---|---|---|
| Men (n 9724) | Women (n 11 594) | ||
| DEI (MJ/d) | Model 0 | −0.008 (−0.012, −0.003) | −0.018 (−0.023, −0.012) |
| DEI (MJ/d) | Model 1 | −0.002 (−0.006, 0.003) | 0.004 (−0.001, 0.009) |
| DEI (MJ/d) | Model 2 | 0.001 (−0.003, 0.006) | 0.007 (0.002, 0.012) |
| DEI (MJ/d) c | Model 2 + EDO | −0.004 (−0.009, 0.001) | 0.003 (−0.003, 0.009) |
| EDO (1 EDO/day) | Model 0 | 0.007 (−0.005, 0.018) | 0.011 (−0.000, 0.021) |
| EDO (1 EDO/day) | Model 1 | 0.025 (0.014, 0.035) | 0.021 (0.011, 0.031) |
| EDO (1 EDO/day) | Model 2 | 0.024 (0.013, 0.034) | 0.020 (0.011, 0.030) |
| EDO (1 EDO/day) c | Model 2 + DEI | 0.027 (0.016, 0.039) | 0.018 (0.007, 0.029) |
| EDO > 15%DEI | Model 2 + DEI | 0.056 (0.033, 0.079) | 0.050 (0.030, 0.070) |
| EDO > 15%DEI | Model 2 + EDO | 0.050 (0.028, 0.073) | 0.049 (0.029, 0.069) |
| EDO < 15%DEI | Model 2 + DEI | 0.011 (0.000, 0.021) | 0.003 (−0.007, 0.012) |
| EDO < 15%DEI | Model 2 + EDO | −0.050 (−0.073, −0.028) | −0.049 (−0.069, −0.029) |
| EDO > 15%DEI d | Model 2 + EDO < 15%DEI | 0.071 (0.047, 0.095) | 0.067 (0.046, 0.088) |
| EDO < 15%DEI d | Model 2 + EDO > 15%DEI | 0.021 (0.010, 0.031) | 0.018 (0.009, 0.028) |
| EDO > 15%DEI e | Model 2 + EDO < 15%DEI + DEI | 0.078 (0.054, 0.103) | 0.064 (0.042, 0.086) |
| EDO < 15%DEI e | Model 2 + EDO > 15%DEI + DEI | 0.026 (0.014, 0.037) | 0.016 (0.005, 0.027) |
| Among AER | |||
| EDO > 15%DEI f | Model 2 + EDO < 15%DEI + DEI | 0.078 (0.050, 0.106) | 0.071 (0.045, 0.096) |
| EDO < 15%DEI f | Model 2 + EDO > 15%DEI + DEI | 0.024 (0.011, 0.036) | 0.020 (0.008, 0.032) |
| Among LER | |||
| EDO > 15%DEI g | Model 2 + EDO < 15%DEI + DEI | 0.075 (0.022, 0.127) | 0.050 (0.008, 0.093) |
| EDO < 15%DEI g | Model 2 + EDO > 15%DEI + DEI | 0.027 (−0.002, 0.056) | 0.002 (−0.023, 0.027) |
| Exposure | Adjustment b | Log-Glucose (mmoL/L) Beta (95%CI) | |
|---|---|---|---|
| Men (n 7395) | Women (n 9121) | ||
| DEI (MJ/d) | Model 0 | −0.002 (−0.005, 0.001) | −0.002 (−0.005, 0.002) |
| DEI (MJ/d) | Model 1 | 0.001 (−0.002, 0.005) | 0.003 (−0.001, 0.007) |
| DEI (MJ/d) | Model 2 | 0.002 (−0.002, 0.005) | 0.004 (0.000, 0.007) |
| DEI (MJ/d) c | Model 2 + EDO | 0.003 (−0.000, 0.007) | 0.004 (−0.000, 0.008) |
| EDO (1 EDO/day) | Model 0 | −0.007 (−0.014, 0.001) | 0.004 (−0.003, 0.011) |
| EDO (1 EDO/day) | Model 1 | −0.006 (−0.013, 0.002) | 0.005 (−0.002, 0.011) |
| EDO (1 EDO/day) | Model 2 | −0.006 (−0.014, 0.001) | 0.003 (−0.004, 0.009) |
| EDO (1 EDO/day) c | Model 2 + DEI | −0.009 (−0.018, −0.001) | −0.001 (−0.009, 0.007) |
| EDO > 15%DEI | Model 2 + DEI | −0.002 (−0.019, 0.014) | 0.022 (0.007, 0.036) |
| EDO > 15%DEI | Model 2 + EDO | 0.000 (−0.016, 0.017) | 0.022 (0.008, 0.037) |
| EDO > 15%DEI d | Model 2 + EDO < 15%DEI | −0.006 (−0.023, 0.011) | 0.024 (0.008, 0.039) |
| EDO < 15%DEI | Model 2 + DEI | −0.007 (−0.015, 0.000) | −0.006 (−0.013, 0.001) |
| EDO < 15%DEI | Model 2 + EDO | 0.000 (−0.017, 0.016) | −0.022 (−0.037, −0.008) |
| EDO < 15%DEI d | Model 2 + EDO > 15%DEI | −0.006 (−0.014, 0.001) | 0.001 (−0.005, 0.008) |
| EDO > 15%DEI e | Model 2 + EDO < 15%DEI + DEI | −0.011 (−0.028, 0.007) | 0.020 (0.004, 0.036) |
| EDO < 15%DEI e | Model 2 + EDO > 15%DEI + DEI | −0.009 (−0.018, −0.001) | −0.002 (−0.009, 0.006) |
| Among AER | |||
| EDO > 15%DEI f | Model 2 + EDO < 15%DEI + DEI | −0.014 (−0.034, 0.007) | 0.030 (0.012, 0.049) |
| EDO < 15%DEI f | Model 2 + EDO > 15%DEI + DEI | −0.012 (−0.021, −0.003) | 0.003 (−0.006, 0.011) |
| Among LER | |||
| EDO > 15%DEI g | Model 2 + EDO < 15%DEI + DEI | −0.003 (−0.040, 0.035) | −0.003 (−0.033, 0.028) |
| EDO < 15%DEI g | Model 2 + EDO > 15%DEI + DEI | 0.001 (−0.020, 0.021) | −0.015 (−0.033, 0.003) |
Publisher’s Note: MDPI stays neutral with regard to jurisdictional claims in published maps and institutional affiliations. |
© 2022 by the authors. Licensee MDPI, Basel, Switzerland. This article is an open access article distributed under the terms and conditions of the Creative Commons Attribution (CC BY) license (https://creativecommons.org/licenses/by/4.0/).
Share and Cite
Lentjes, M.A.H.; Oude Griep, L.M.; Mulligan, A.A.; Montgomery, S.; Wareham, N.J.; Khaw, K.-T. Face Validity of Observed Meal Patterns Reported with 7-Day Diet Diaries in a Large Population-Based Cohort Using Diurnal Variation in Concentration Biomarkers of Dietary Intake. Nutrients 2022, 14, 238. https://doi.org/10.3390/nu14020238
Lentjes MAH, Oude Griep LM, Mulligan AA, Montgomery S, Wareham NJ, Khaw K-T. Face Validity of Observed Meal Patterns Reported with 7-Day Diet Diaries in a Large Population-Based Cohort Using Diurnal Variation in Concentration Biomarkers of Dietary Intake. Nutrients. 2022; 14(2):238. https://doi.org/10.3390/nu14020238
Chicago/Turabian StyleLentjes, Marleen A. H., Linda M. Oude Griep, Angela A. Mulligan, Scott Montgomery, Nick J. Wareham, and Kay-Tee Khaw. 2022. "Face Validity of Observed Meal Patterns Reported with 7-Day Diet Diaries in a Large Population-Based Cohort Using Diurnal Variation in Concentration Biomarkers of Dietary Intake" Nutrients 14, no. 2: 238. https://doi.org/10.3390/nu14020238
APA StyleLentjes, M. A. H., Oude Griep, L. M., Mulligan, A. A., Montgomery, S., Wareham, N. J., & Khaw, K.-T. (2022). Face Validity of Observed Meal Patterns Reported with 7-Day Diet Diaries in a Large Population-Based Cohort Using Diurnal Variation in Concentration Biomarkers of Dietary Intake. Nutrients, 14(2), 238. https://doi.org/10.3390/nu14020238