

Higher Total Cholesterol Concentration May Be Associated with Better Cognitive Performance among Elderly Females

Abstract
1. Introduction
2. Methods
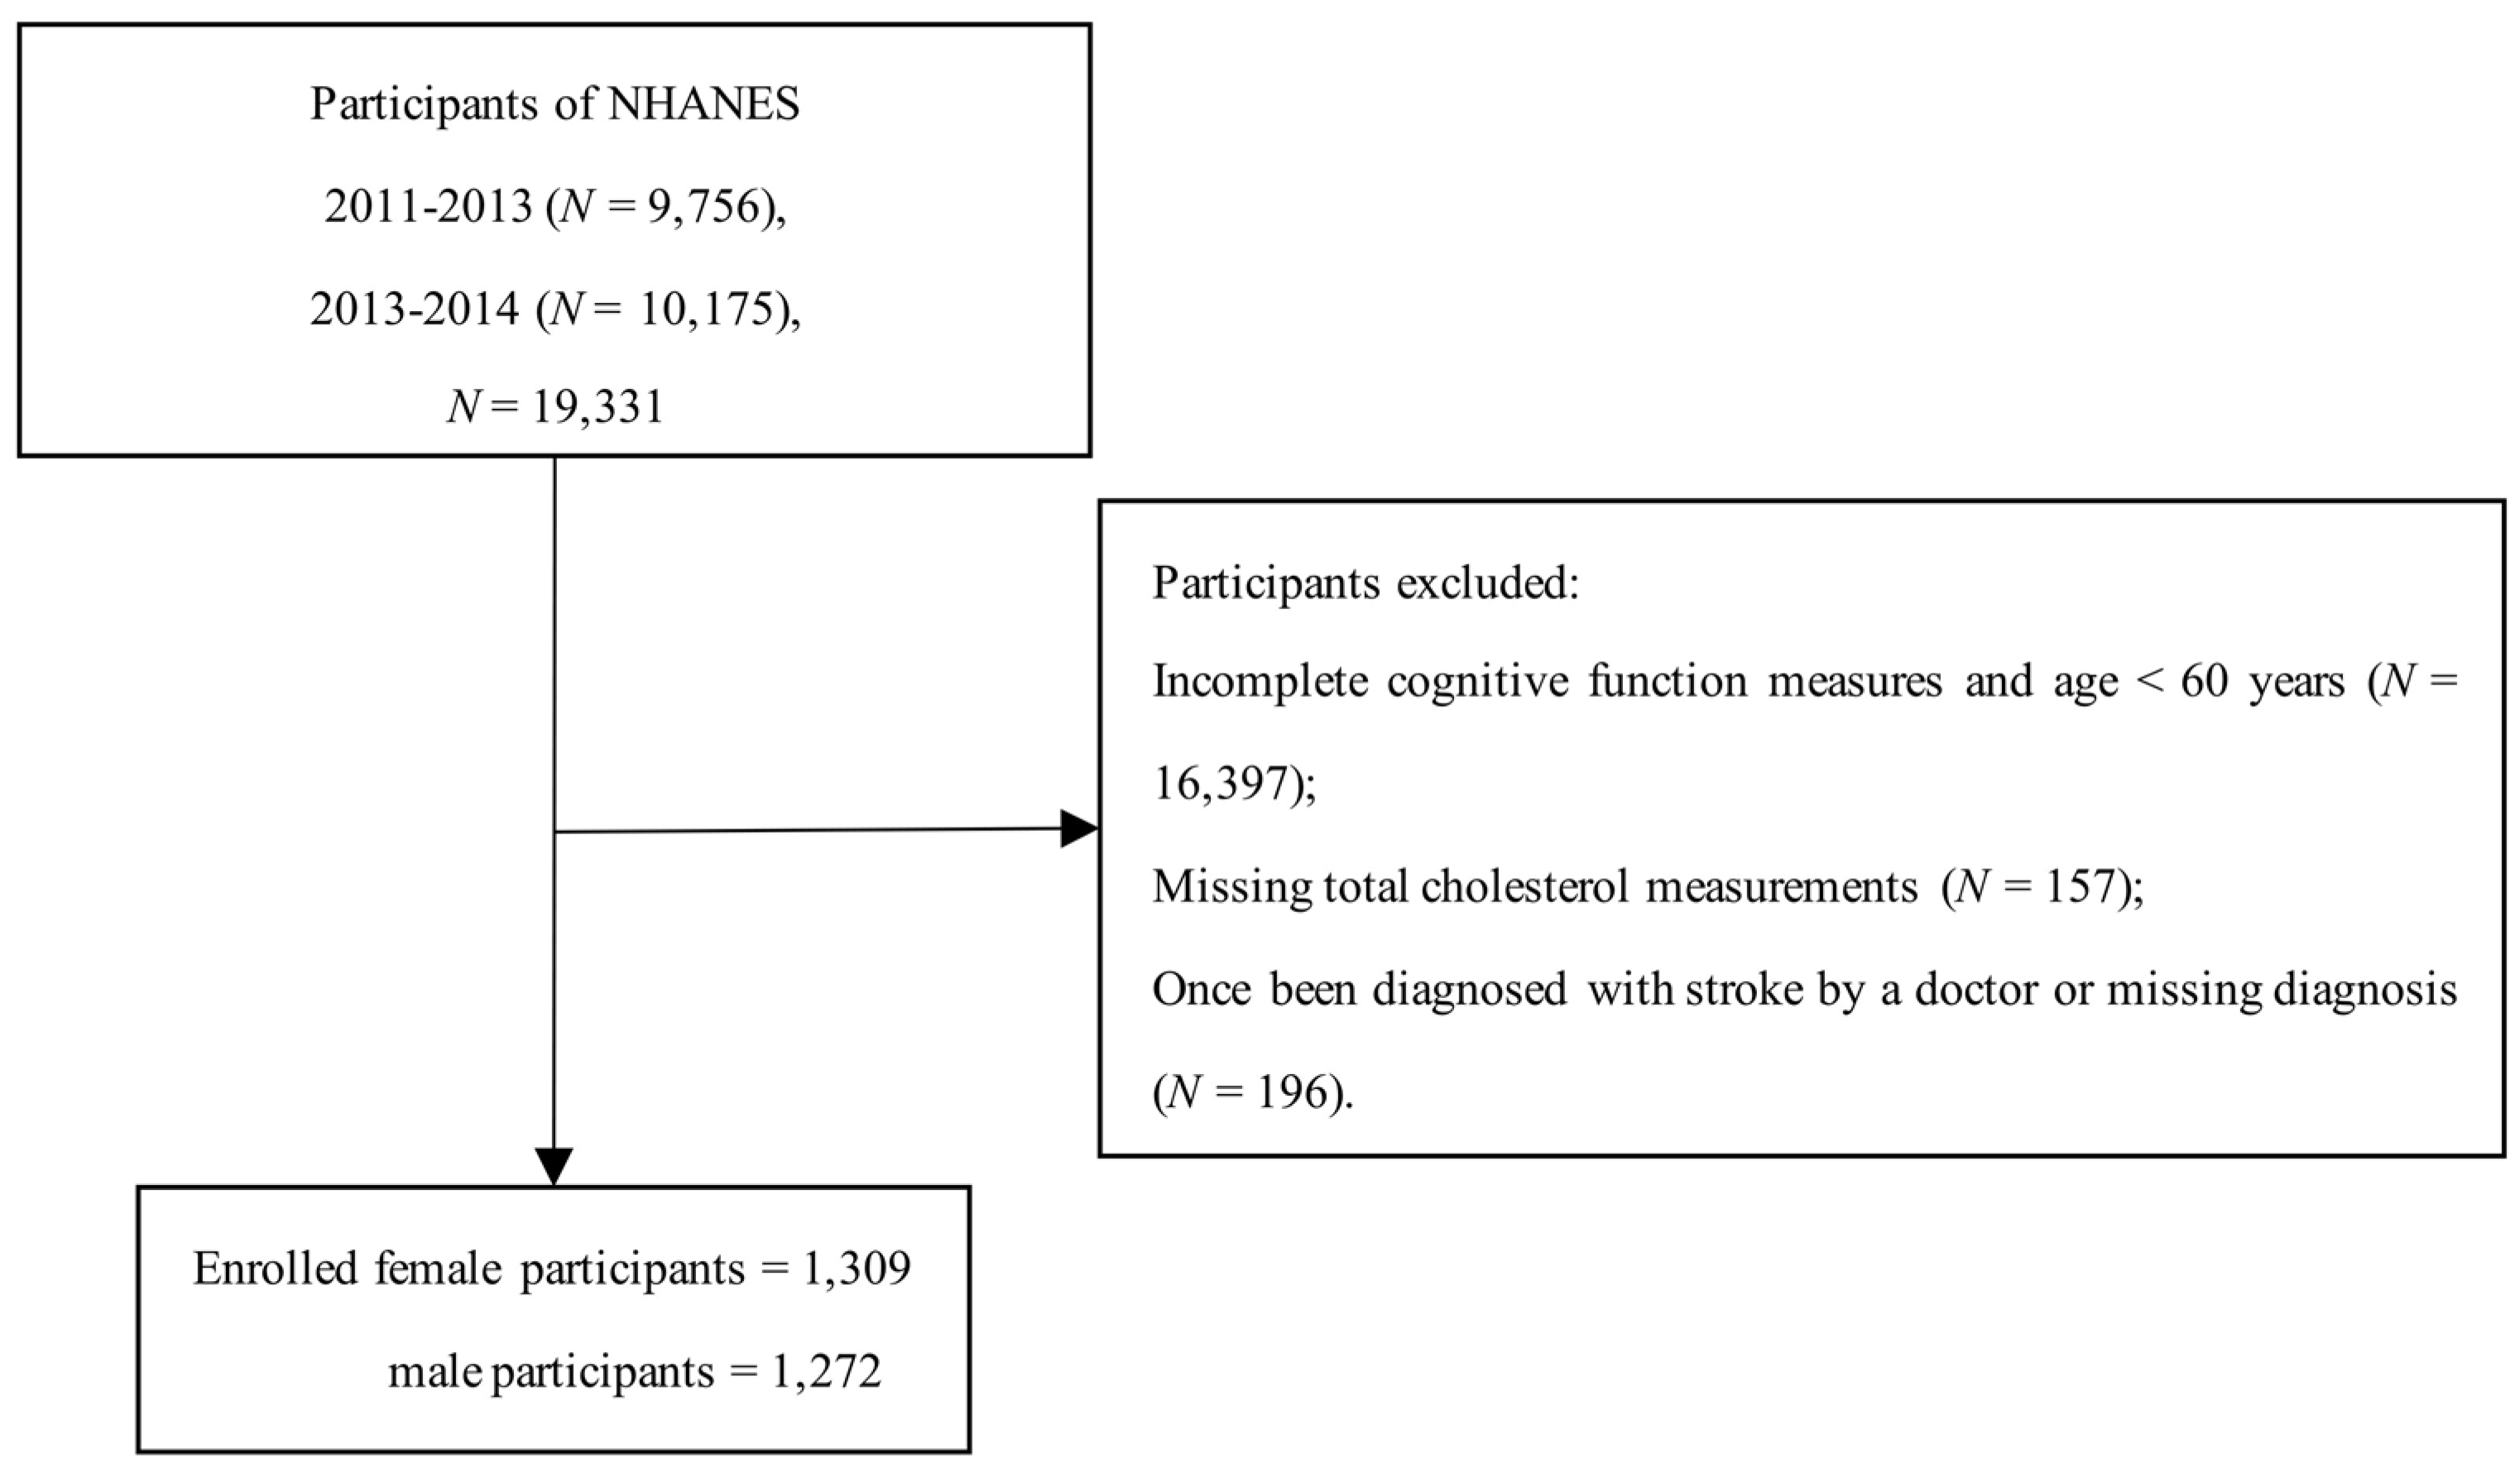
2.1. Study Population
2.2. Cholesterol Measurement
2.3. Cognitive Performance Assessment
2.4. Covariates
2.5. Statistical Analysis
3. Results
4. Discussion
5. Limitations
6. Conclusions
Supplementary Materials
Author Contributions
Funding
Institutional Review Board Statement
Informed Consent Statement
Data Availability Statement
Acknowledgments
Conflicts of Interest
References
- Arruda, E.H.; Paun, O. Dementia Caregiver Grief and Bereavement: An Integrative Review. West. J. Nurs. Res. 2017, 39, 825–851. [Google Scholar] [CrossRef]
- Anderson, N.D. State of the science on mild cognitive impairment (MCI). CNS Spectr. 2019, 24, 78–87. [Google Scholar] [CrossRef]
- Pei, H.; Ma, L.; Cao, Y.; Wang, F.; Li, Z.; Liu, N.; Liu, M.; Wei, Y.; Li, H. Traditional Chinese Medicine for Alzheimer’s Disease and Other Cognitive Impairment: A Review. Am. J. Chin. Med. 2020, 48, 487–511. [Google Scholar] [CrossRef] [PubMed]
- Sherman, J.C.; Henderson, C.R.; Flynn, S.; Gair, J.W.; Lust, B. Language Decline Characterizes Amnestic Mild Cognitive Impairment Independent of Cognitive Decline. J. Speech Lang. Hear. Res. 2021, 64, 4287–4307. [Google Scholar] [CrossRef] [PubMed]
- Centers for Disease Control and Prevention & Alzheimer’s Association. The Healthy Brain Initiative: The Public Health Road Map for State and National Partnerships, 2013–2018; Alzheimer’s Association: Chicago, IL, USA, 2013. [Google Scholar]
- Kim, A.S.; Conte, M.S. Specialized pro-resolving lipid mediators in cardiovascular disease, diagnosis, and therapy. Adv. Drug Deliv. Rev. 2020, 159, 170–179. [Google Scholar] [CrossRef]
- Morley, J.E.; Banks, W.A. Lipids and cognition. J. Alzheimers Dis. 2010, 20, 737–747. [Google Scholar] [CrossRef] [PubMed]
- Lauritzen, L.; Brambilla, P.; Mazzocchi, A.; Harsløf, L.B.S.; Ciappolino, V.; Agostoni, C. DHA Effects in Brain Development and Function. Nutrients 2016, 8, 6. [Google Scholar] [CrossRef] [PubMed]
- Björkhem, I.; Meaney, S.J. Brain cholesterol: Long secret life behind a barrier. Arterioscler. Thromb. Vasc. Biol. 2004, 24, 806–815. [Google Scholar] [CrossRef]
- Poitelon, Y.; Kopec, A.M.; Belin, S. Myelin Fat Facts: An Overview of Lipids and Fatty Acid Metabolism. Cells 2020, 9, 812. [Google Scholar] [CrossRef]
- Zeppelin, T.; Ladefoged, L.K.; Sinning, S.; Periole, X.; Schiøtt, B. A direct interaction of cholesterol with the dopamine transporter prevents its out-to-inward transition. PLoS Comput. Biol. 2018, 14, e1005907. [Google Scholar] [CrossRef]
- Jones, K.T.; Zhen, J.; Reith, M.E.A. Importance of cholesterol in dopamine transporter function. J. Neurochem. 2012, 123, 700–715. [Google Scholar] [CrossRef] [PubMed]
- Shrivastava, S.; Pucadyil, T.J.; Paila, Y.D.; Ganguly, S.; Chattopadhyay, A. Chronic cholesterol depletion using statin impairs the function and dynamics of human serotonin(1A) receptors. Biochemistry 2010, 49, 5426–5435. [Google Scholar] [CrossRef]
- Schmitt, J.A.J.; Wingen, M.; Ramaekers, J.G.; Evers, E.A.T.; Riedel, W.J. Serotonin and human cognitive performance. Curr. Pharm. Des. 2006, 12, 2473–2486. [Google Scholar] [CrossRef] [PubMed]
- Hara, Y.; Waters, E.M.; McEwen, B.S.; Morrison, J.H. Estrogen Effects on Cognitive and Synaptic Health Over the Lifecourse. Physiol. Rev. 2015, 95, 785–807. [Google Scholar] [CrossRef]
- Henderson, V.W. Progesterone and human cognition. Climacteric 2018, 21, 333–340. [Google Scholar] [CrossRef] [PubMed]
- de Menezes, K.J.; Peixoto, C.; Nardi, A.E.; Carta, M.G.; Machado, S.; Veras, A.B. Dehydroepiandrosterone, Its Sulfate and Cognitive Functions. Clin. Pract. Epidemiol. Ment. Health CP EMH 2016, 12, 24–37. [Google Scholar] [CrossRef]
- Beauchet, O. Testosterone and cognitive function: Current clinical evidence of a relationship. Eur. J. Endocrinol. 2006, 155, 773–781. [Google Scholar] [CrossRef]
- McFarlane, O.; Kędziora-Kornatowska, K. Cholesterol and Dementia: A Long and Complicated Relationship. Curr. Aging Sci. 2020, 13, 42–51. [Google Scholar] [CrossRef]
- Van Vliet, P. Cholesterol and late-life cognitive decline. J. Alzheimers Dis. 2012, 30, S147–S162. [Google Scholar] [CrossRef] [PubMed]
- Van Vliet, P.; van de Water, W.; de Craen, A.J.M.; Westendorp, R.G.J. The influence of age on the association between cholesterol and cognitive function. Exp. Gerontol. 2009, 44, 112–122. [Google Scholar] [CrossRef] [PubMed]
- Zambón, D.; Quintana, M.; Mata, P.; Alonso, R.; Benavent, J.; Cruz-Sánchez, F.; Gich, J.; Pocoví, M.; Civeira, F.; Capurro, S.; et al. Higher incidence of mild cognitive impairment in familial hypercholesterolemia. Am. J. Med. 2010, 123, 267–274. [Google Scholar] [CrossRef]
- Yaffe, K.; Vittinghoff, E.; Pletcher, M.J.; Hoang, T.D.; Launer, L.J.; Whitmer, R.; Coker, L.H.; Sidney, S. Early adult to midlife cardiovascular risk factors and cognitive function. Circulation 2014, 129, 1560–1567. [Google Scholar] [CrossRef] [PubMed]
- Reynolds, C.A.; Gatz, M.; Prince, J.A.; Berg, S.; Pedersen, N.L. Serum lipid levels and cognitive change in late life. J. Am. Geriatr. Soc. 2010, 58, 501–509. [Google Scholar] [CrossRef] [PubMed]
- Eskelinen, M.H.; Ngandu, T.; Helkala, E.-L.; Tuomilehto, J.; Nissinen, A.; Soininen, H.; Kivipelto, M. Fat intake at midlife and cognitive impairment later in life: A population-based CAIDE study. Int. J. Geriatr. Psychiatry 2008, 23, 741–747. [Google Scholar] [CrossRef]
- Beydoun, M.A.; Beason-Held, L.L.; Kitner-Triolo, M.H.; Beydoun, H.A.; Ferrucci, L.; Resnick, S.M.; Zonderman, A.B. Statins and serum cholesterol’s associations with incident dementia and mild cognitive impairment. J. Epidemiol. Community Health 2011, 65, 949–957. [Google Scholar] [CrossRef]
- Anstey, K.J.; Ashby-Mitchell, K.; Peters, R. Updating the Evidence on the Association between Serum Cholesterol and Risk of Late-Life Dementia: Review and Meta-Analysis. J. Alzheimers Dis. 2017, 56, 215–228. [Google Scholar] [CrossRef]
- Kivipelto, M.; Helkala, E.L.; Hänninen, T.; Laakso, M.P.; Hallikainen, M.; Alhainen, K.; Soininen, H.; Tuomilehto, J.; Nissinen, A. Midlife vascular risk factors and late-life mild cognitive impairment: A population-based study. Neurology 2001, 56, 1683–1689. [Google Scholar] [CrossRef] [PubMed]
- Solomon, A.; Kåreholt, I.; Ngandu, T.; Winblad, B.; Nissinen, A.; Tuomilehto, J.; Soininen, H.; Kivipelto, M. Serum cholesterol changes after midlife and late-life cognition: Twenty-one-year follow-up study. Neurology 2007, 68, 751–756. [Google Scholar] [CrossRef]
- Wendell, C.R.; Waldstein, S.R.; Zonderman, A.B. Nonlinear longitudinal trajectories of cholesterol and neuropsychological function. Neuropsychology 2014, 28, 106–112. [Google Scholar] [CrossRef] [PubMed]
- Centers for Disease Control and Prevention. 2011–2012 Data Documentation, Codebook, and Frequencies: Cholesterol-Total (TCHOL H) 2013. Available online: https://wwwn.cdc.gov/Nchs/Nhanes/2011-2012/TCHOL_G.htm (accessed on 26 March 2022).
- Centers for Disease Control and Prevention. 2011–2012 Data Documentation, Codebook, and Frequencies: Cholesterol-HDL(HDL_G) 2013. Available online: https://wwwn.cdc.gov/Nchs/Nhanes/2011-2012/HDL_G.htm (accessed on 26 March 2022).
- Centers for Disease Control and Prevention. 2013–2014 Data Documentation, Codebook, and Frequencies: Cholesterol-HDL (HDL_H). Available online: https://wwwn.cdc.gov/Nchs/Nhanes/2013-2014/HDL_H.htm (accessed on 26 March 2022).
- Centers for Disease Control and Prevention. 2013–2014 Data Documentation, Codebook, and Frequencies: Cholesterol-Total (TCHOL H). Available online: https://wwwn.cdc.gov/Nchs/Nhanes/2013-2014/TCHOL_H.htm (accessed on 26 March 2022).
- Centers for Disease Control and Prevention. 2013–2014 Data Documentation, Codebook, and Frequencies: Cognitive Functioning (CFQ H). Available online: https://wwwn.cdc.gov/Nchs/Nhanes/2013-2014/CFQ_H.htm (accessed on 26 March 2022).
- Centers for Disease Control and Prevention. 2011–2012 Data Documentation, Codebook, and Frequencies: Cognitive Functioning (CFQ-G). Available online: https://wwwn.cdc.gov/Nchs/Nhanes/2011-2012/CFQ_G.htm (accessed on 26 March 2022).
- Lee, S.; Min, J.-Y.; Kim, B.; Ha, S.-W.; Han, J.H.; Min, K.-B. Serum sodium in relation to various domains of cognitive function in the elderly US population. BMC Geriatr. 2021, 21, 328. [Google Scholar] [CrossRef]
- Botelho, J.; Leira, Y.; Viana, J.; Machado, V.; Lyra, P.; Aldrey, J.M.; Pías-Peleteiro, J.M.; Blanco, J.; Sobrino, T.; Mendes, J.J. The Role of Inflammatory Diet and Vitamin D on the Link between Periodontitis and Cognitive Function: A Mediation Analysis in Older Adults. Nutrients 2021, 13, 924. [Google Scholar] [CrossRef]
- Katzman, E.W.; Nielsen, S.J. The Association between Peanut and Peanut Butter Consumption and Cognitive Function among Community-Dwelling Older Adults. J. Prev. Alzheimers Dis. 2021, 8, 436–441. [Google Scholar] [CrossRef]
- Morris, J.C.; Heyman, A.; Mohs, R.C.; Hughes, J.P.; van Belle, G.; Fillenbaum, G.; Mellits, E.D.; Clark, C. The Consortium to Establish a Registry for Alzheimer’s Disease (CERAD). Part I. Clinical and neuropsychological assessment of Alzheimer’s disease. Neurology 1989, 39, 1159–1165. [Google Scholar]
- Aka, A.; Phan, T.D.; Kahana, M.J. Predicting recall of words and lists. J. Exp. Psychol. Learn. Mem. Cogn. 2021, 47, 765–784. [Google Scholar] [CrossRef] [PubMed]
- Santos-Galduróz, R.F.; Oliveira, F.G.; Galduróz, J.C.F.; Bueno, O.F.A. Cognitive performance of young and elderly subjects on the free word recall memory test: Effect of presentation order on recall order. Braz. J. Med. Biol. Res. 2009, 42, 988–992. [Google Scholar] [CrossRef]
- Lucas, J.A.; Ivnik, R.J.; Smith, G.E.; Ferman, T.J.; Willis, F.B.; Petersen, R.C.; Graff-Radford, N.R. Mayo’s Older African Americans Normative Studies: Norms for Boston Naming Test, Controlled Oral Word Association, Category Fluency, Animal Naming, Token Test, WRAT-3 Reading, Trail Making Test, Stroop Test, and Judgment of Line Orientation. Clin. Neuropsychol. 2005, 19, 243–269. [Google Scholar] [CrossRef]
- Rinehardt, E.; Eichstaedt, K.; Schinka, J.A.; Loewenstein, D.A.; Mattingly, M.; Fils, J.; Duara, R.; Schoenberg, M.R. Verbal fluency patterns in mild cognitive impairment and Alzheimer’s disease. Dement. Geriatr. Cogn. Disord. 2014, 38, 1–9. [Google Scholar] [CrossRef] [PubMed]
- Sebaldt, R.; Dalziel, W.; Massoud, F.; Tanguay, A.; Ward, R.; Thabane, L.; Melnyk, P.; Landry, P.-A.; Lescrauwaet, B. Detection of cognitive impairment and dementia using the animal fluency test: The DECIDE study. Can. J. Neurol. Sci. 2009, 36, 599–604. [Google Scholar] [CrossRef]
- García-Herranz, S.; Díaz-Mardomingo, M.C.; Venero, C.; Peraita, H. Accuracy of verbal fluency tests in the discrimination of mild cognitive impairment and probable Alzheimer’s disease in older Spanish monolingual individuals. Neuropsychol. Dev. Cogn. B Aging Neuropsychol. Cogn. 2020, 27, 826–840. [Google Scholar] [CrossRef] [PubMed]
- Brukner, P.; Khan, K.; Kron, J. The Encyclopedia of Exercise, Sport and Health; George Allen & Unwin: Crows Nest, Australia, 2004. [Google Scholar]
- Lim, C.R.; Harris, K.; Dawson, J.; Beard, D.J.; Fitzpatrick, R.; Price, A.J. Floor and ceiling effects in the OHS: An analysis of the NHS PROMs data set. BMJ Open 2015, 5, e007765. [Google Scholar] [CrossRef] [PubMed]
- Vogt, W.P.; Johnson, B. Dictionary of Statistics & Methodology: A Nontechnical Guide for the Social Sciences; Sage: Thousand Oaks, CA, USA, 2005. [Google Scholar] [CrossRef]
- Li, H.; Wang, Z.; Fu, Z.; Yan, M.; Wu, N.; Wu, H.; Yin, P. Associations between blood cadmium levels and cognitive function in a cross-sectional study of US adults aged 60 years or older. BMJ Open 2018, 8, e020533. [Google Scholar] [CrossRef] [PubMed]
- Scherr, M.; Kunz, A.; Doll, A.; Mutzenbach, J.S.; Broussalis, E.; Bergmann, H.J.; Kirschner, M.; Trinka, E.; Killer-Oberpfalzer, M. Ignoring floor and ceiling effects may underestimate the effect of carotid artery stenting on cognitive performance. J. Neurointerv. Surg. 2016, 8, 747–751. [Google Scholar] [CrossRef]
- Chen, S.P.; Bhattacharya, J.; Pershing, S. Association of Vision Loss With Cognition in Older Adults. JAMA Ophthalmol. 2017, 135, 963–970. [Google Scholar] [CrossRef] [PubMed]
- Li, S.; Sun, W.; Zhang, D. Association of Zinc, Iron, Copper, and Selenium Intakes with Low Cognitive Performance in Older Adults: A Cross-Sectional Study from National Health and Nutrition Examination Survey (NHANES). J. Alzheimers Dis. 2019, 72, 1145–1157. [Google Scholar] [CrossRef] [PubMed]
- Dong, X.; Li, S.; Sun, J.; Li, Y.; Zhang, D. Association of Coffee, Decaffeinated Coffee and Caffeine Intake from Coffee with Cognitive Performance in Older Adults: National Health and Nutrition Examination Survey (NHANES) 2011–2014. Nutrients 2020, 12, 840. [Google Scholar] [CrossRef] [PubMed]
- Cefalu, W.T.; Berg, E.G.; Saraco, M.; Petersen, M.P.; Uelmen, S.; Robinson, S. Classification and Diagnosis of Diabetes. Diabetes Care 2020, 43, S14–S31. [Google Scholar] [CrossRef]
- Schork, A.; Moll, K.; Haap, M.; Riessen, R.; Wagner, R. Course of lactate, pH and base excess for prediction of mortality in medical intensive care patients. PLoS ONE 2021, 16, e0261564. [Google Scholar] [CrossRef]
- Pais, R.; Ruano, L.; Carvalho, O.P.; Barros, H.J. Global cognitive impairment prevalence and incidence in community dwelling older adults—A systematic review. Geriatrics 2020, 5, 84. [Google Scholar] [CrossRef]
- Lee, H.B.; Richardson, A.K.; Black, B.S.; Shore, A.D.; Kasper, J.D.; Rabins, P.V. Race and cognitive decline among community-dwelling elders with mild cognitive impairment: Findings from the Memory and Medical Care Study. Aging Ment. Health 2012, 16, 372–377. [Google Scholar] [CrossRef][Green Version]
- Thorvaldsson, V.; Skoog, I.; Johansson, B. Cholesterol and cognitive aging: Between-person and within-person associations in a population-based representative sample not on lipid-lowering medication. Psychol. Aging 2020, 35, 508–516. [Google Scholar] [CrossRef]
- Corley, J.; Starr, J.M.; Deary, I.J. Serum cholesterol and cognitive functions: The Lothian Birth Cohort 1936. Int. Psychogeriatr. 2015, 27, 439–453. [Google Scholar] [CrossRef] [PubMed]
- Ma, C.; Yin, Z.; Zhu, P.; Luo, J.; Shi, X.; Gao, X. Blood cholesterol in late-life and cognitive decline: A longitudinal study of the Chinese elderly. Mol. Neurodegener. 2017, 12, 24. [Google Scholar] [CrossRef] [PubMed]
- Guo, Y.; Li, P.; Ma, X.; Huang, X.; Liu, Z.; Ren, X.; Yang, Y.; Halm-Lutterodt, N.V.; Yuan, L. Association of Circulating Cholesterol Level with Cognitive Function and Mild Cognitive Impairment in the Elderly: A Community-based Population Study. Curr. Alzheimer Res. 2020, 17, 556–565. [Google Scholar] [CrossRef] [PubMed]
- Yi, Z.; Vaupel, J.W. Functional capacity and self–evaluation of health and life of oldest old in China. J. Soc. Issues 2002, 58, 733–748. [Google Scholar] [CrossRef]
- Han, Y.; He, Y.; Lyu, J.; Yu, C.; Bian, M.; Lee, L. Aging in China: Perspectives on public health. Glob. Health J. 2020, 4, 11–17. [Google Scholar] [CrossRef]
- Peters, R.; Xu, Y.; Antikainen, R.; Beckett, N.; Gussekloo, J.; Jagger, C.; Jukema, J.W.; Keinanen-Kiukaanniemi, S.; Rydén, L.; Skoog, I.; et al. Evaluation of High Cholesterol and Risk of Dementia and Cognitive Decline in Older Adults Using Individual Patient Meta-Analysis. Dement. Geriatr. Cogn. Disord. 2021, 50, 318–325. [Google Scholar] [CrossRef]
- Iwagami, M.; Qizilbash, N.; Gregson, J.; Douglas, I.; Johnson, M.; Pearce, N.; Evans, S.; Pocock, S. Blood cholesterol and risk of dementia in more than 1·8 million people over two decades: A retrospective cohort study. Lancet Healthy Longev. 2021, 2, e498–e506. [Google Scholar] [CrossRef]
- Panza, F.; D’Introno, A.; Colacicco, A.M.; Capurso, C.; Pichichero, G.; Capurso, S.A.; Capurso, A.; Solfrizzi, V. Lipid metabolism in cognitive decline and dementia. Brain Res. Rev. 2006, 51, 275–292. [Google Scholar] [CrossRef]
- Pavón, S.; Lázaro, E.; Martínez, O.; Amayra, I.; López-Paz, J.F.; Caballero, P.; Al-Rashaida, M.; Luna, P.M.; García, M.; Pérez, M.; et al. Ketogenic diet and cognition in neurological diseases: A systematic review. Nutr. Rev. 2021, 79, 802–813. [Google Scholar] [CrossRef]
- Tussing-Humphreys, L.; Lamar, M.; Blumenthal, J.A.; Babyak, M.; Fantuzzi, G.; Blumstein, L.; Schiffer, L.; Fitzgibbon, M.L. Building research in diet and cognition: The BRIDGE randomized controlled trial. Contemp. Clin. Trials 2017, 59, 87–97. [Google Scholar] [CrossRef]
- Swan, G.E.; Lessov-Schlaggar, C.N. The effects of tobacco smoke and nicotine on cognition and the brain. Neuropsychol. Rev. 2007, 17, 259–273. [Google Scholar] [CrossRef] [PubMed]
- Lövdén, M.; Fratiglioni, L.; Glymour, M.M.; Lindenberger, U.; Tucker-Drob, E.M. Education and Cognitive Functioning Across the Life Span. Psychol. Sci. Public Interest 2020, 21, 6–41. [Google Scholar] [CrossRef] [PubMed]
- Tomasi, D.; Volkow, N.D. Associations of family income with cognition and brain structure in USA children: Prevention implications. Mol. Psychiatry 2021, 26, 6619–6629. [Google Scholar] [CrossRef] [PubMed]
- Jeong, S.-M.; Choi, S.; Kim, K.; Kim, S.M.; Lee, G.; Park, S.Y.; Kim, Y.-Y.; Son, J.S.; Yun, J.-M.; Park, S.M. Effect of Change in Total Cholesterol Levels on Cardiovascular Disease Among Young Adults. J. Am. Heart Assoc. 2018, 7, e008819. [Google Scholar] [CrossRef] [PubMed]
- Abbott, C.; Meadows, A.B.; Lier, K. Low cholesterol and noncardiovascular mortality. Mil. Med. 2000, 165, 466–469. [Google Scholar] [CrossRef] [PubMed][Green Version]
- Wang, X.; Dong, Y.; Qi, X.; Huang, C.; Hou, L. Cholesterol levels and risk of hemorrhagic stroke: A systematic review and meta-analysis. Stroke 2013, 44, 1833–1839. [Google Scholar] [CrossRef] [PubMed]
- Olsen, T.S.; Christensen, R.H.B.; Kammersgaard, L.P.; Andersen, K.K. Higher total serum cholesterol levels are associated with less severe strokes and lower all-cause mortality: Ten-year follow-up of ischemic strokes in the Copenhagen Stroke Study. Stroke 2007, 38, 2646–2651. [Google Scholar] [CrossRef] [PubMed]
- Weverling-Rijnsburger, A.W.; Blauw, G.J.; Lagaay, A.M.; Knook, D.L.; Meinders, A.E.; Westendorp, R.G. Total cholesterol and risk of mortality in the oldest old. Lancet 1997, 350, 1119–1123. [Google Scholar] [CrossRef]
- Hyattsville, M.U.S.; Centers for Disease Control and Prevention (CDC); National Center for Health Statistics (NCHS). National Health and Nutrition Examination Survey Data. Available online: https://wwwn.cdc.gov/nchs/nhanes/Default.aspx (accessed on 26 March 2022).


| Overall | Female | Male | |
|---|---|---|---|
| N | 2581 | 1309 | 1272 |
| Age in years at screening (mean (SD)) | 69.29 (6.74) | 69.33 (6.71) | 69.24 (6.78) |
| Age (%) | |||
| 60–70 years | 1432 (55.5) | 722 (55.2) | 710 (55.8) |
| 70–80 years | 746 (28.9) | 387 (29.6) | 359 (28.2) |
| ≥80 years | 403 (15.6) | 200 (15.3) | 203 (16.0) |
| Race (%) | |||
| Mexican American | 236 (9.1) | 110 (8.4) | 126 (9.9) |
| Other Hispanic | 269 (10.4) | 141 (10.8) | 128 (10.1) |
| Non-Hispanic White | 1247 (48.3) | 660 (50.4) | 587 (46.1) |
| Non-Hispanic Black | 580 (22.5) | 279 (21.3) | 301 (23.7) |
| Other Race | 249 (9.6) | 119 (9.1) | 130 (10.2) |
| Ratio of family income to poverty (mean (SD)) | 2.65 (1.61) | 2.53 (1.60) | 2.77 (1.61) |
| Poverty–income ratio ≥ 1 (%) | 1981 (83.8) | 973 (81.0) | 1008 (86.6) |
| Body Mass Index (mean (SD)) | 29.05 (6.28) | 29.52 (6.91) | 28.56 (5.53) |
| Body mass index (%) | |||
| <25 kg/m2 | 680 (26.7) | 355 (27.4) | 325 (25.9) |
| 25–30 kg/m2 | 917 (35.9) | 399 (30.8) | 518 (41.3) |
| ≥30 kg/m2 | 954 (37.4) | 542 (41.8) | 412 (32.8) |
| Diabetes (%) | 694 (26.9) | 329 (25.2) | 365 (28.7) |
| Had at least 12 alcohol drinks/year (%) | 1746 (68.8) | 707 (54.7) | 1039 (83.4) |
| Hypertension (%) | 1570 (60.9) | 834 (63.8) | 736 (58.0) |
| Marital status (%) | |||
| Widowed/divorced/separated/never married | 1067 (41.3) | 705 (53.8) | 362 (28.4) |
| Married/living with partner | 1514 (58.7) | 604 (46.2) | 910 (71.6) |
| Smoking status (%) | |||
| Never | 1295 (50.2) | 819 (62.6) | 476 (37.5) |
| Former | 962 (37.3) | 356 (27.2) | 606 (47.7) |
| Current | 322 (12.5) | 133 (10.2) | 189 (14.9) |
| Educational level (%) | |||
| Below high school | 634 (24.6) | 319 (24.4) | 315 (24.8) |
| High school | 606 (23.5) | 318 (24.3) | 288 (22.7) |
| Above high school | 1339 (51.9) | 672 (51.3) | 667 (52.5) |
| Total Cholesterol (mean (SD)) | 192.24 (43.16) | 202.88 (41.71) | 181.28 (41.89) |
| Statin drugs used (%) | 1071 (41.5) | 502 (38.3) | 569 (44.7) |
| The Animal Fluency Test | The Digit Symbol Substitution Test | The CERAD Test | The Global Performance | |||||||||
|---|---|---|---|---|---|---|---|---|---|---|---|---|
| Normal Cognitive Performance | Low Cognitive Performance | p Value | Normal Cognitive Performance | Low Cognitive Performance | p Value | Normal Cognitive Performance | Low Cognitive Performance | p Value | Normal Cognitive Performance | Low Cognitive Performance | p Value | |
| N (%) | 922.00 (70.44) | 387.00 (29.56) | 972.00 (74.26) | 337.00 (25.74) | 947.00 (72.35) | 362 (27.65) | 981 (74.94) | 328 (25.06) | ||||
| Age in years at screening 2 | 69.22 (6.70) | 69.58 (6.74) | 0.3 | 69.17 (6.79) | 69.77 (6.45) | 0.083 | 69.05 (6.75) | 70.06 (6.56) | 0.009 | 69.12 (6.80) | 69.94 (6.41) | 0.024 |
| Age (%) 1 | 0.4 | >0.9 | 0.5 | >0.9 | ||||||||
| 60–70 years | 508.00 (55.10) | 214.00 (55.30) | 534.00 (54.94) | 188.00 (55.79) | 530.00 (55.97) | 192.00 (53.04) | 541.00 (55.15) | 181.00 (55.18) | ||||
| 70–80 years | 280.00 (30.37) | 107.00 (27.65) | 290.00 (29.84) | 97.00 (28.78) | 272.00 (28.72) | 115.00 (31.77) | 290.00 (29.56) | 97.00 (29.57) | ||||
| ≥80 years | 134.00 (14.53) | 66.00 (17.05) | 148.00 (15.23) | 52.00 (15.43) | 145.00 (15.31) | 55.00 (15.19) | 150.00 (15.29) | 50.00 (15.24) | ||||
| Race (%) 1 | <0.001 | <0.001 | <0.001 | <0.001 | ||||||||
| Mexican American | 75.00 (8.13) | 35.00 (9.04) | 54.00 (5.56) | 56.00 (16.62) | 69.00 (7.29) | 41.00 (11.33) | 64.00 (6.52) | 46.00 (14.02) | ||||
| Other Hispanic | 82.00 (8.89) | 59.00 (15.25) | 74.00 (7.61) | 67.00 (19.88) | 80.00 (8.45) | 61.00 (16.85) | 77.00 (7.85) | 64.00 (19.51) | ||||
| Non-Hispanic White | 536.00 (58.13) | 124.00 (32.04) | 583.00 (59.98) | 77.00 (22.85) | 507.00 (53.54) | 153.00 (42.27) | 571.00 (58.21) | 89.00 (27.13) | ||||
| Non-Hispanic Black | 157.00 (17.03) | 122.00 (31.52) | 170.00 (17.49) | 109.00 (32.34) | 203.00 (21.44) | 76.00 (20.99) | 178.00 (18.14) | 101.00 (30.79) | ||||
| Other Race | 72.00 (7.81) | 47.00 (12.14) | 91.00 (9.36) | 28.00 (8.31) | 88.00 (9.29) | 31.00 (8.56) | 91.00 (9.28) | 28.00 (8.54) | ||||
| Ratio of family income to poverty 2 | 2.72 (1.62) | 2.05 (1.45) | <0.001 | 2.85 (1.59) | 1.58 (1.20) | <0.001 | 2.72 (1.60) | 2.03 (1.48) | <0.001 | 2.78 (1.59) | 1.76 (1.39) | <0.001 |
| Poverty–income ratio (%) 1 | <0.001 | <0.001 | <0.001 | <0.001 | ||||||||
| ≤0.99 | 129.00 (15.09) | 99.00 (28.61) | 108.00 (12.03) | 120.00 (39.60) | 126.00 (14.53) | 102.00 (30.54) | 116.00 (12.87) | 112.00 (37.33) | ||||
| ≥1 | 726.00 (84.91) | 247.00 (71.39) | 790.00 (87.97) | 183.00 (60.40) | 741.00 (85.47) | 232.00 (69.46) | 785.00 (87.13) | 188.00 (62.67) | ||||
| Body mass index (%) 1 | 0.2 | 0.6 | 0.7 | 0.7 | ||||||||
| <25 kg/m2 | 252.00 (27.45) | 103.00 (27.25) | 261.00 (26.91) | 94.00 (28.83) | 255.00 (27.13) | 100.00 (28.09) | 272.00 (27.93) | 83.00 (25.78) | ||||
| 25–30 kg/m2 | 295.00 (32.14) | 104.00 (27.51) | 306.00 (31.55) | 93.00 (28.53) | 296.00 (31.49) | 103.00 (28.93) | 301.00 (30.90) | 98.00 (30.43) | ||||
| ≥30 kg/m2 | 371.00 (40.41) | 171.00 (45.24) | 403.00 (41.55) | 139.00 (42.64) | 389.00 (41.38) | 153.00 (42.98) | 401.00 (41.17) | 141.00 (43.79) | ||||
| Body Mass Index (kg/m2) 2 | 29.33 (6.74) | 29.99 (7.29) | 0.2 | 29.35 (6.78) | 30.03 (7.25) | 0.2 | 29.50 (6.98) | 29.59 (6.73) | 0.7 | 29.32 (6.86) | 30.12 (7.02) | 0.079 |
| Diabetes (%) | 198.00 (21.48) | 131.00 (33.94) | <0.001 | 208.00 (21.40) | 121.00 (36.01) | <0.001 | 212.00 (22.41) | 117.00 (32.32) | <0.001 | 201.00 (20.51) | 128.00 (39.02) | <0.001 |
| Had at least 12 alcohol drinks/year (%) 1 | 520.00 (57.21) | 187.00 (48.83) | 0.006 | 576.00 (59.75) | 131.00 (39.94) | <0.001 | 534.00 (57.05) | 173.00 (48.60) | 0.006 | 568.00 (58.44) | 139.00 (43.44) | <0.001 |
| Hypertension (%) 1 | 558.00 (60.59) | 276.00 (71.50) | <0.001 | 593.00 (61.13) | 241.00 (71.51) | <0.001 | 593.00 (61.13) | 241.00 (71.51) | 0.3 | 598.00 (61.02) | 236.00 (72.17) | <0.001 |
| Marital status (%) 1 | 0.036 | <0.001 | 0.012 | 0.009 | ||||||||
| Widowed/divorced/separated/never married | 479.00 (51.95) | 225.00 (58.29) | 494.00 (50.88) | 210.00 (62.31) | 489.00 (51.69) | 215.00 (59.39) | 507.00 (51.73) | 197.00 (60.06) | ||||
| Married/living with partner | 443.00 (48.05) | 161.00 (41.71) | 477.00 (49.12) | 127.00 (37.69) | 457.00 (48.31) | 147.00 (40.61) | 473.00 (48.27) | 131.00 (39.94) | ||||
| Smoking status (%) 1 | 0.2 | 0.005 | 0.4 | 0.2 | ||||||||
| Never | 562.00 (61.02) | 257.00 (66.41) | 587.00 (60.45) | 232.00 (68.84) | 591.00 (62.47) | 228.00 (62.98) | 604.00 (61.63) | 215.00 (65.55) | ||||
| Former | 262.00 (28.45) | 94.00 (24.29) | 287.00 (29.56) | 69.00 (20.47) | 264.00 (27.91) | 92.00 (25.41) | 280.00 (28.57) | 76.00 (23.17) | ||||
| Current | 97.00 (10.53) | 36.00 (9.30) | 97.00 (9.99) | 36.00 (10.68) | 91.00 (9.62) | 42.00 (11.60) | 96.00 (9.80) | 37.00 (11.28) | ||||
| Educational level (%) 1 | <0.001 | <0.001 | <0.001 | <0.001 | ||||||||
| Below high school | 169.00 (18.33) | 150.00 (38.76) | 127.00 (13.07) | 192.00 (56.97) | 172.00 (18.16) | 147.00 (40.61) | 144.00 (14.68) | 175.00 (53.35) | ||||
| High school | 219.00 (23.75) | 99.00 (25.58) | 243.00 (25.00) | 75.00 (22.26) | 228.00 (24.08) | 90.00 (24.86) | 235.00 (23.96) | 83.00 (25.30) | ||||
| Above high school | 534.00 (57.92) | 138.00 (35.66) | 602.00 (61.93) | 70.00 (20.77) | 547.00 (57.76) | 125.00 (34.53) | 602.00 (61.37) | 70.00 (21.34) | ||||
| Total Cholesterol (mg/dL) 2 | 205.62 (41.43) | 196.36 (41.71) | <0.001 | 204.66 (40.52) | 197.75 (44.63) | 0.003 | 204.41 (41.82) | 198.88 (41.22) | 0.039 | 206.13 (41.15) | 193.17 (41.94) | <0.001 |
| Total Cholesterol (%) 1 | 0.002 | 0.003 | 0.14 | <0.001 | ||||||||
| <174 mg/dL | 208.00 (22.56) | 120.00 (31.01) | 221.00 (22.74) | 107.00 (31.75) | 227.00 (23.97) | 101.00 (27.90) | 215.00 (21.92) | 113.00 (34.45) | ||||
| 174–201 mg/dL | 232.00 (25.16) | 96.00 (24.81) | 242.00 (24.90) | 86.00 (25.52) | 230.00 (24.29) | 98.00 (27.07) | 238.00 (24.26) | 90.00 (27.44) | ||||
| 201–229 mg/dL | 235.00 (25.49) | 98.00 (25.32) | 265.00 (27.26) | 68.00 (20.18) | 245.00 (25.87) | 88.00 (24.31) | 265.00 (27.01) | 68.00 (20.73) | ||||
| >229 mg/dL | 247.00 (26.79) | 73.00 (18.86) | 244.00 (25.10) | 76.00 (22.55) | 245.00 (25.87) | 75.00 (20.72) | 263.00 (26.81) | 57.00 (17.38) | ||||
| Statin drugs used (%) 1 | 337.00 (36.55) | 165.00 (42.64) | 0.039 | 362.00 (37.24) | 140.00 (41.54) | 0.2 | 351.00 (37.06) | 151.00 (41.71) | 0.12 | 353.00 (35.98) | 149.00 (45.43) | 0.002 |
| The Animal Fluency Test | The Digit Symbol Substitution Test | The CERAD Test | The Global Performance | |||||||||
|---|---|---|---|---|---|---|---|---|---|---|---|---|
| Normal Cognitive Performance | Low Cognitive Performance | p Value | Normal Cognitive Performance | Low Cognitive Performance | p Value | Normal Cognitive Performance | Low Cognitive Performance | p Value | Normal Cognitive Performance | Low Cognitive Performance | p Value | |
| N (%) | 893 (70.20) | 379 (29.80) | 939 (73.82) | 333 (26.18) | 918 (72.17) | 354 (27.83) | 952 (74.84) | 320 (25.16) | ||||
| Age in years at screening 2 | 69.28 (6.73) | 69.16 (6.91) | 0.7 | 69.16 (6.78) | 69.48 (6.81) | 0.5 | 69.06 (6.78) | 69.73 (6.78) | 0.12 | 69.17 (6.74) | 69.45 (6.91) | 0.6 |
| Age (%) 1 | 0.4 | >0.9 | 0.4 | >0.9 | ||||||||
| 60–70 years | 491.00 (54.98%) | 219.00 (57.78%) | 525.00 (55.91%) | 185.00 (55.56%) | 522.00 (56.86%) | 188.00 (53.11%) | 531.00 (55.78%) | 179.00 (55.94%) | ||||
| 70–80 years | 262.00 (29.34%) | 97.00 (25.59%) | 265.00 (28.22%) | 94.00 (28.23%) | 250.00 (27.23%) | 109.00 (30.79%) | 269.00 (28.26%) | 90.00 (28.12%) | ||||
| ≥80 years | 140.00 (15.68%) | 63.00 (16.62%) | 149.00 (15.87%) | 54.00 (16.22%) | 146.00 (15.90%) | 57.00 (16.10%) | 152.00 (15.97%) | 51.00 (15.94%) | ||||
| Race (%) 1 | <0.001 | <0.001 | <0.001 | <0.001 | ||||||||
| Mexican American | 92.00 (10.30%) | 34.00 (8.97%) | 79.00 (8.41%) | 47.00 (14.11%) | 80.00 (8.71%) | 46.00 (12.99%) | 85.00 (8.93%) | 41.00 (12.81%) | ||||
| Other Hispanic | 85.00 (9.52%) | 43.00 (11.35%) | 61.00 (6.50%) | 67.00 (20.12%) | 80.00 (8.71%) | 48.00 (13.56%) | 75.00 (7.88%) | 53.00 (16.56%) | ||||
| Non-Hispanic White | 470.00 (52.63%) | 117.00 (30.87%) | 511.00 (54.42%) | 76.00 (22.82%) | 456.00 (49.67%) | 131.00 (37.01%) | 504.00 (52.94%) | 83.00 (25.94%) | ||||
| Non-Hispanic Black | 173.00 (19.37%) | 128.00 (33.77%) | 175.00 (18.64%) | 126.00 (37.84%) | 206.00 (22.44%) | 95.00 (26.84%) | 188.00 (19.75%) | 113.00 (35.31%) | ||||
| Other Race | 73.00 (8.17%) | 57.00 (15.04%) | 113.00 (12.03%) | 17.00 (5.11%) | 96.00 (10.46%) | 34.00 (9.60%) | 100.00 (10.50%) | 30.00 (9.38%) | ||||
| Ratio of family income to poverty 2 | 2.93 (1.62) | 2.40 (1.52) | <0.001 | 3.10 (1.58) | 1.85 (1.30) | <0.001 | 2.92 (1.61) | 2.38 (1.55) | <0.001 | 3.01 (1.59) | 2.04 (1.43) | <0.001 |
| Poverty-income ratio (%) 1 | 0.07 | <0.001 | 0.008 | <0.001 | ||||||||
| ≤0.99 | 101.00 (12.24%) | 55.00 (16.22%) | 80.00 (9.27%) | 76.00 (25.25%) | 100.00 (11.79%) | 56.00 (17.72%) | 95.00 (10.80%) | 61.00 (21.48%) | ||||
| ≥1 | 724.00 (87.76%) | 284.00 (83.78%) | 783.00 (90.73%) | 225.00 (74.75%) | 748.00 (88.21%) | 260.00 (82.28%) | 785.00 (89.20%) | 223.00 (78.52%) | ||||
| Body mass index (kg/m2) 2 | 28.74 (5.43) | 28.13 (5.74) | 0.02 | 28.66 (5.51) | 28.28 (5.58) | 0.3 | 28.65 (5.41) | 28.32 (5.83) | 0.2 | 28.66 (5.42) | 28.28 (5.83) | 0.2 |
| Body Mass Index (%) 1 | 0.2 | 0.8 | 0.7 | 0.8 | ||||||||
| <25 kg/m2 | 217.00 (24.63%) | 108.00 (28.88%) | 236.00 (25.46%) | 89.00 (27.13%) | 230.00 (25.39%) | 95.00 (27.22%) | 242.00 (25.77%) | 83.00 (26.27%) | ||||
| 25–30 kg/m2 | 362.00 (41.09%) | 156.00 (41.71%) | 383.00 (41.32%) | 135.00 (41.16%) | 374.00 (41.28%) | 144.00 (41.26%) | 384.00 (40.89%) | 134.00 (42.41%) | ||||
| ≥30kg/m2 | 302.00 (34.28%) | 110.00 (29.41%) | 308.00 (33.23%) | 104.00 (31.71%) | 302.00 (33.33%) | 110.00 (31.52%) | 313.00 (33.33%) | 99.00 (31.33%) | ||||
| Diabetes (%) 1 | 236.00 (26.43%) | 129.00 (34.04%) | 0.006 | 235.00 (25.03%) | 130.00 (39.04%) | <0.001 | 257.00 (28.00%) | 108.00 (30.51%) | 0.4 | 251.00 (26.37%) | 114.00 (35.62%) | 0.002 |
| Had at least 12 alcohol drinks/year (%) 1 | 748.00 (84.90%) | 291.00 (79.73%) | 0.025 | 783.00 (84.65%) | 256.00 (79.75%) | 0.042 | 765.00 (84.62%) | 274.00 (80.12%) | 0.056 | 794.00 (84.65%) | 245.00 (79.55%) | 0.037 |
| Hypertension (%) 1 | 508.00 (56.95%) | 228.00 (60.32%) | 0.3 | 529.00 (56.46%) | 207.00 (62.16%) | 0.07 | 532.00 (58.02%) | 204.00 (57.79%) | >0.9 | 545.00 (57.31%) | 191.00 (59.87%) | 0.4 |
| Marriage status (%) 1 | 0.2 | <0.001 | 0.15 | <0.001 | ||||||||
| Widowed/divorced/separated/never married | 244.00 (27.35%) | 117.00 (30.87%) | 231.00 (24.63%) | 130.00 (39.04%) | 250.00 (27.26%) | 111.00 (31.36%) | 244.00 (25.66%) | 117.00 (36.56%) | ||||
| Married/living with partner | 648.00 (72.65%) | 262.00 (69.13%) | 707.00 (75.37%) | 203.00 (60.96%) | 667.00 (72.74%) | 243.00 (68.64%) | 707.00 (74.34%) | 203.00 (63.44%) | ||||
| Smoking status (%) 1 | 0.093 | <0.001 | 0.007 | 0.001 | ||||||||
| Never | 339.00 (38.00%) | 137.00 (36.15%) | 370.00 (39.40%) | 106.00 (31.93%) | 329.00 (35.88%) | 147.00 (41.53%) | 365.00 (38.38%) | 111.00 (34.69%) | ||||
| Former | 433.00 (48.54%) | 173.00 (45.65%) | 459.00 (48.88%) | 147.00 (44.28%) | 462.00 (50.38%) | 144.00 (40.68%) | 465.00 (48.90%) | 141.00 (44.06%) | ||||
| Current | 120.00 (13.45%) | 69.00 (18.21%) | 110.00 (11.71%) | 79.00 (23.80%) | 126.00 (13.74%) | 63.00 (17.80%) | 121.00 (12.72%) | 68.00 (21.25%) | ||||
| Educational Level (%) 1 | <0.001 | <0.001 | <0.001 | <0.001 | ||||||||
| Below high school | 173.00 (19.37%) | 142.00 (37.67%) | 123.00 (13.10%) | 192.00 (58.01%) | 176.00 (19.19%) | 139.00 (39.38%) | 150.00 (15.76%) | 165.00 (51.89%) | ||||
| High school | 191.00 (21.39%) | 97.00 (25.73%) | 214.00 (22.79%) | 74.00 (22.36%) | 209.00 (22.79%) | 79.00 (22.38%) | 219.00 (23.00%) | 69.00 (21.70%) | ||||
| Above high school | 529.00 (59.24%) | 138.00 (36.60%) | 602.00 (64.11%) | 65.00 (19.64%) | 532.00 (58.02%) | 135.00 (38.24%) | 583.00 (61.24%) | 84.00 (26.42%) | ||||
| Total Cholesterol (mg/dL) 2 | 182.95 (42.69) | 177.36 (39.72) | 0.081 | 181.53 (41.96) | 180.58 (41.74) | >0.9 | 180.91 (42.42) | 182.25 (40.52) | 0.3 | 181.00 (42.08) | 182.12 (41.37) | 0.4 |
| Total Cholesterol (%) 1 | 0.4 | 0.7 | 0.4 | 0.2 | ||||||||
| <151 mg/dL | 216.00 (24.19%) | 107.00 (28.23%) | 235.00 (25.03%) | 88.00 (26.43%) | 240.00 (26.14%) | 83.00 (23.45%) | 251.00 (26.37%) | 72.00 (22.50%) | ||||
| 151–178 mg/dL | 224.00 (25.08%) | 95.00 (25.07%) | 242.00 (25.77%) | 77.00 (23.12%) | 227.00 (24.73%) | 92.00 (25.99%) | 229.00 (24.05%) | 90.00 (28.12%) | ||||
| 178–208 mg/dL | 226.00 (25.31%) | 92.00 (24.27%) | 237.00 (25.24%) | 81.00 (24.32%) | 236.00 (25.71%) | 82.00 (23.16%) | 245.00 (25.74%) | 73.00 (22.81%) | ||||
| >208 mg/dL | 227.00 (25.42%) | 85.00 (22.43%) | 225.00 (23.96%) | 87.00 (26.13%) | 215.00 (23.42%) | 97.00 (27.40%) | 227.00 (23.84%) | 85.00 (26.56%) | ||||
| Statin drugs used (%) 1 | 406.00 (45.46%) | 163.00 (43.01%) | 0.4 | 426.00 (45.37%) | 143.00 (42.94%) | 0.4 | 417.00 (45.42%) | 152.00 (42.94%) | 0.4 | 441.00 (46.32%) | 128.00 (40.00%) | 0.049 |
| Animal Fluency Test | DSST | CERAD Test | Global Cognitive Performance | |||||||||
|---|---|---|---|---|---|---|---|---|---|---|---|---|
| Model 1 | Model 2 | Model 3 | Model 1 | Model 2 | Model 3 | Model 1 | Model 2 | Model 3 | Model 1 | Model 2 | Model 3 | |
| 0–174 | 1.00 (Ref.) | 1.00 (Ref.) | 1.00 (Ref.) | 1.00 (Ref.) | 1.00 (Ref.) | 1.00 (Ref.) | 1.00 (Ref.) | 1.00 (Ref.) | 1.00 (Ref.) | 1.00 (Ref.) | 1.00 (Ref.) | 1.00 (Ref.) |
| 174–201 | 0.72 * (0.52–0.99) | 0.76 (0.53–1.10) | 0.82 (0.56–1.20) | 0.73 (0.52–1.03) | 0.77 (0.50–1.19) | 0.83 (0.53–1.29) | 0.96 (0.69–1.34) | 1.10 (0.76–1.58) | 1.20 (0.83–1.76) | 0.72 (0.52–1.00) | 0.85 (0.57–1.26) | 0.94 (0.62–1.42) |
| 201–229 | 0.72 (0.52–1.00) | 0.80 (0.55–1.16) | 0.88 (0.59–1.29) | 0.53 *** (0.37–0.75) | 0.56 * (0.35–0.87) | 0.62 * (0.39–0.99) | 0.81 (0.58–1.13) | 0.86 (0.59–1.25) | 0.95 (0.64–1.41) | 0.49 *** (0.34–0.69) | 0.50 ** (0.33–0.77) | 0.58 * (0.37–0.90) |
| >229 | 0.51 *** (0.36–0.72) | 0.52 ** (0.35–0.77) | 0.57 ** (0.38–0.85) | 0.64 * (0.45–0.91) | 0.72 (0.46–1.13) | 0.79 (0.50–1.26) | 0.69 * (0.48–0.97) | 0.70 (0.48–1.04) | 0.78 (0.52–1.16) | 0.41 *** (0.28–0.59) | 0.34 *** (0.22–0.54) | 0.40 *** (0.25–0.63) |
| ptrend | <0.001 | <0.003 | 0.015 | 0.003 | 0.061 | 0.177 | 0.022 | 0.042 | 0.134 | <0.001 | <0.001 | <0.001 |
| Animal Fluency Test | DSST | CERAD Test | Global Cognitive Performance | |||||||||
|---|---|---|---|---|---|---|---|---|---|---|---|---|
| Model 1 | Model 2 | Model 3 | Model 1 | Model 2 | Model 3 | Model 1 | Model 2 | Model 3 | Model 1 | Model 2 | Model 3 | |
| 0–151 | 1.00 (Ref.) | 1.00 (Ref.) | 1.00 (Ref.) | 1.00 (Ref.) | 1.00 (Ref.) | 1.00 (Ref.) | 1.00 (Ref.) | 1.00 (Ref.) | 1.00 (Ref.) | 1.00 (Ref.) | 1.00 (Ref.) | 1.00 (Ref.) |
| 151–178 | 0.86 (0.61–1.19) | 0.78 (0.54–1.14) | 0.80 (0.54–1.18) | 0.85 (0.60–1.21) | 0.97 (0.62–1.53) | 1.16 (0.72–1.85) | 1.17 (0.83–1.66) | 1.10 (0.76–1.61) | 1.16 (0.78–1.72) | 1.37 (0.96–1.96) | 1.45 (0.95–2.22) | 1.51 (0.97–2.34) |
| 178–208 | 0.82 (0.59–1.15) | 0.75 (0.51–1.08) | 0.79 (0.53–1.17) | 0.91 (0.64–1.30) | 0.96 (0.61–1.51) | 1.25 (0.77–2.03) | 1.00 (0.70–1.43) | 0.91 (0.61–1.34) | 0.93 (0.61–1.40) | 1.04 (0.72–1.50) | 0.97 (0.63–1.50) | 1.09 (0.69–1.74) |
| >208 | 0.76 (0.54–1.06) | 0.70 (0.47–1.02) | 0.76 (0.51–1.15) | 1.03 (0.73–1.46) | 0.99 (0.63–1.56) | 1.26 (0.78–2.06) | 1.30 (0.92–1.85) | 1.26 (0.86–1.85) | 1.30 (0.86–1.96) | 1.31 (0.91–1.88) | 1.23 (0.80–1.90) | 1.36 (0.86–2.16) |
| ptrend | 0.107 | 0.063 | 0.206 | 0.777 | 0.943 | 0.325 | 0.246 | 0.433 | 0.392 | 0.377 | 0.734 | 0.416 |
| Animal Fluency Test | DSST | CERAD Test | Global Cognitive Performance | ||||||||||
|---|---|---|---|---|---|---|---|---|---|---|---|---|---|
| Model 1 | Model 2 | Model 3 | Model 1 | Model 2 | Model 3 | Model 1 | Model 2 | Model 3 | Model 1 | Model 2 | Model 3 | ||
| Less than 9th grade | 0–174 | 1.00 (Ref.) | 1.00 (Ref.) | 1.00 (Ref.) | 1.00 (Ref.) | 1.00 (Ref.) | 1.00 (Ref.) | 1.00 (Ref.) | 1.00 (Ref.) | 1.00 (Ref.) | 1.00 (Ref.) | 1.00 (Ref.) | 1.00 (Ref.) |
| 174–201 | 0.54 (0.29–1.01) | 0.49 * (0.24–0.99) | 0.58 (0.28–1.19) | 0.78 (0.42–1.46) | 0.57 (0.26–1.24) | 0.62 (0.27–1.41) | 1.42 (0.77–2.63) | 1.43 (0.72–2.85) | 1.57 (0.76–3.28) | 0.93 (0.51–1.73) | 0.98 (0.49–2.00) | 1.08 (0.51–2.31) | |
| 201–229 | 1.21 (0.66–2.25) | 1.43 (0.71–2.91) | 1.60 (0.76–3.42) | 0.69 (0.37–1.30) | 0.68 (0.30–1.53) | 0.66 (0.28–1.58) | 1.59 (0.86–2.95) | 1.59 (0.78–3.29) | 1.66 (0.77–3.59) | 1.05 (0.57–1.95) | 1.36 (0.65–2.91) | 1.56 (0.71–3.51) | |
| >229 | 0.54 * (0.29–0.98) | 0.63 (0.32–1.24) | 0.64 (0.31–1.30) | 0.76 (0.41–1.40) | 0.74 (0.34–1.62) | 0.84 (0.37–1.89) | 0.93 (0.51–1.70) | 1.06 (0.53–2.11) | 1.24 (0.60–2.57) | 0.60 (0.33–1.10) | 0.54 (0.26–1.09) | 0.63- (0.30–1.31) | |
| 9–11th grade | 0–174 | 1.00 (Ref.) | 1.00 (Ref.) | 1.00 (Ref.) | 1.00 (Ref.) | 1.00 (Ref.) | 1.00 (Ref.) | 1.00 (Ref.) | 1.00 (Ref.) | 1.00 (Ref.) | 1.00 (Ref.) | 1.00 (Ref.) | 1.00 (Ref.) |
| 174–201 | 1.11 (0.60–2.08) | 1.02 (0.52–2.01) | 1.14 (0.56–2.33) | 0.75 (0.38–1.48) | 0.70 (0.32–1.50) | 0.71 (0.32–1.58) | 1.22 (0.64–2.35) | 1.24 (0.63–2.45) | 1.46 (0.72–2.99) | 0.83 (0.44–1.57) | 0.86 (0.43–1.71) | 1.06 (0.52–2.20) | |
| 201–229 | 0.61 (0.30–1.21) | 0.51 (0.23–1.10) | 0.60 (0.26–1.36) | 0.51 (0.23–1.07) | 0.40 * (0.16–0.96) | 0.49 (0.19–1.20) | 0.93 (0.46–1.86) | 0.90 (0.42–1.91) | 1.11 (0.50–2.46) | 0.35 ** (0.16–0.73) | 0.27 ** (0.11–0.64) | 0.35 * (0.13–0.83) | |
| >229 | 0.75 (0.37–1.53) | 0.53 (0.22–1.21) | 0.60 (0.24–1.44) | 1.00 (0.48–2.07) | 0.88 (0.37–2.05) | 1.10 (0.45–2.63) | 0.86 (0.40–1.79) | 0.69 (0.29–1.58) | 0.83 (0.34–1.95) | 0.59 (0.28–1.22) | 0.44 (0.18–1.02) | 0.54 (0.22–1.30) | |
| above 11th grade | 0–174 | 1.00 (Ref.) | 1.00 (Ref.) | 1.00 (Ref.) | 1.00 (Ref.) | 1.00 (Ref.) | 1.00 (Ref.) | 1.00 (Ref.) | 1.00 (Ref.) | 1.00 (Ref.) | 1.00 (Ref.) | 1.00 (Ref.) | 1.00 (Ref.) |
| 174–201 | 0.74 (0.44–1.26) | 0.71 (0.39–1.26) | 0.68 (0.37–1.23) | 1.09 (0.57–2.11) | 0.98 (0.46–2.10) | 1.06 (0.48–2.34) | 0.74 (0.43–1.27) | 0.72 (0.40–1.27) | 0.78 (0.44–1.40) | 0.68 (0.37–1.26) | 0.56 (0.28–1.11) | 0.59 (0.29–1.18) | |
| 201–229 | 0.72 (0.43–1.20) | 0.73 (0.41–1.29) | 0.78 (0.43–1.42) | 0.60 (0.29–1.22) | 0.67 (0.30–1.46) | 0.74 (0.33–1.67) | 0.58 * (0.33–0.99) | 0.55 * (0.31–0.98) | 0.61 (0.33–1.11) | 0.37 ** (0.18–0.71) | 0.33 ** (0.15–0.68) | 0.37 * (0.16–0.78) | |
| >229 | 0.47 ** (0.27–0.81) | 0.47 * (0.25–0.86) | 0.47 * (0.25–0.90) | 0.52 (0.24–1.09) | 0.63 (0.28–1.43) | 0.65 (0.28–1.53) | 0.57 * (0.32–0.98) | 0.52 * (0.29–0.93) | 0.57 (0.31–1.04) | 0.18 *** (0.07–0.40) | 0.14 *** (0.05–0.35) | 0.15 *** (0.05–0.38) | |
Publisher’s Note: MDPI stays neutral with regard to jurisdictional claims in published maps and institutional affiliations. |
© 2022 by the authors. Licensee MDPI, Basel, Switzerland. This article is an open access article distributed under the terms and conditions of the Creative Commons Attribution (CC BY) license (https://creativecommons.org/licenses/by/4.0/).
Share and Cite
Pang, K.; Liu, C.; Tong, J.; Ouyang, W.; Hu, S.; Tang, Y. Higher Total Cholesterol Concentration May Be Associated with Better Cognitive Performance among Elderly Females. Nutrients 2022, 14, 4198. https://doi.org/10.3390/nu14194198
Pang K, Liu C, Tong J, Ouyang W, Hu S, Tang Y. Higher Total Cholesterol Concentration May Be Associated with Better Cognitive Performance among Elderly Females. Nutrients. 2022; 14(19):4198. https://doi.org/10.3390/nu14194198
Chicago/Turabian StylePang, Ke, Chunxia Liu, Jianbin Tong, Wen Ouyang, Shuntong Hu, and Yongzhong Tang. 2022. "Higher Total Cholesterol Concentration May Be Associated with Better Cognitive Performance among Elderly Females" Nutrients 14, no. 19: 4198. https://doi.org/10.3390/nu14194198
APA StylePang, K., Liu, C., Tong, J., Ouyang, W., Hu, S., & Tang, Y. (2022). Higher Total Cholesterol Concentration May Be Associated with Better Cognitive Performance among Elderly Females. Nutrients, 14(19), 4198. https://doi.org/10.3390/nu14194198