

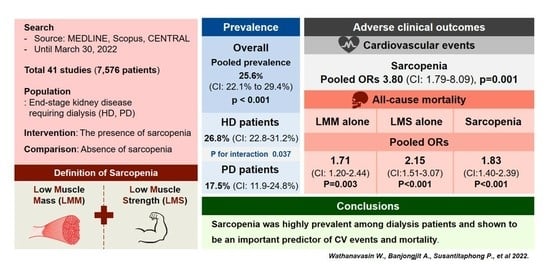
Prevalence of Sarcopenia and Its Impact on Cardiovascular Events and Mortality among Dialysis Patients: A Systematic Review and Meta-Analysis

 , , ,
, , ,
Abstract
1. Introduction
2. Methods
2.1. Searching Strategy
2.2. Study Outcomes
2.3. Eligibility Criteria
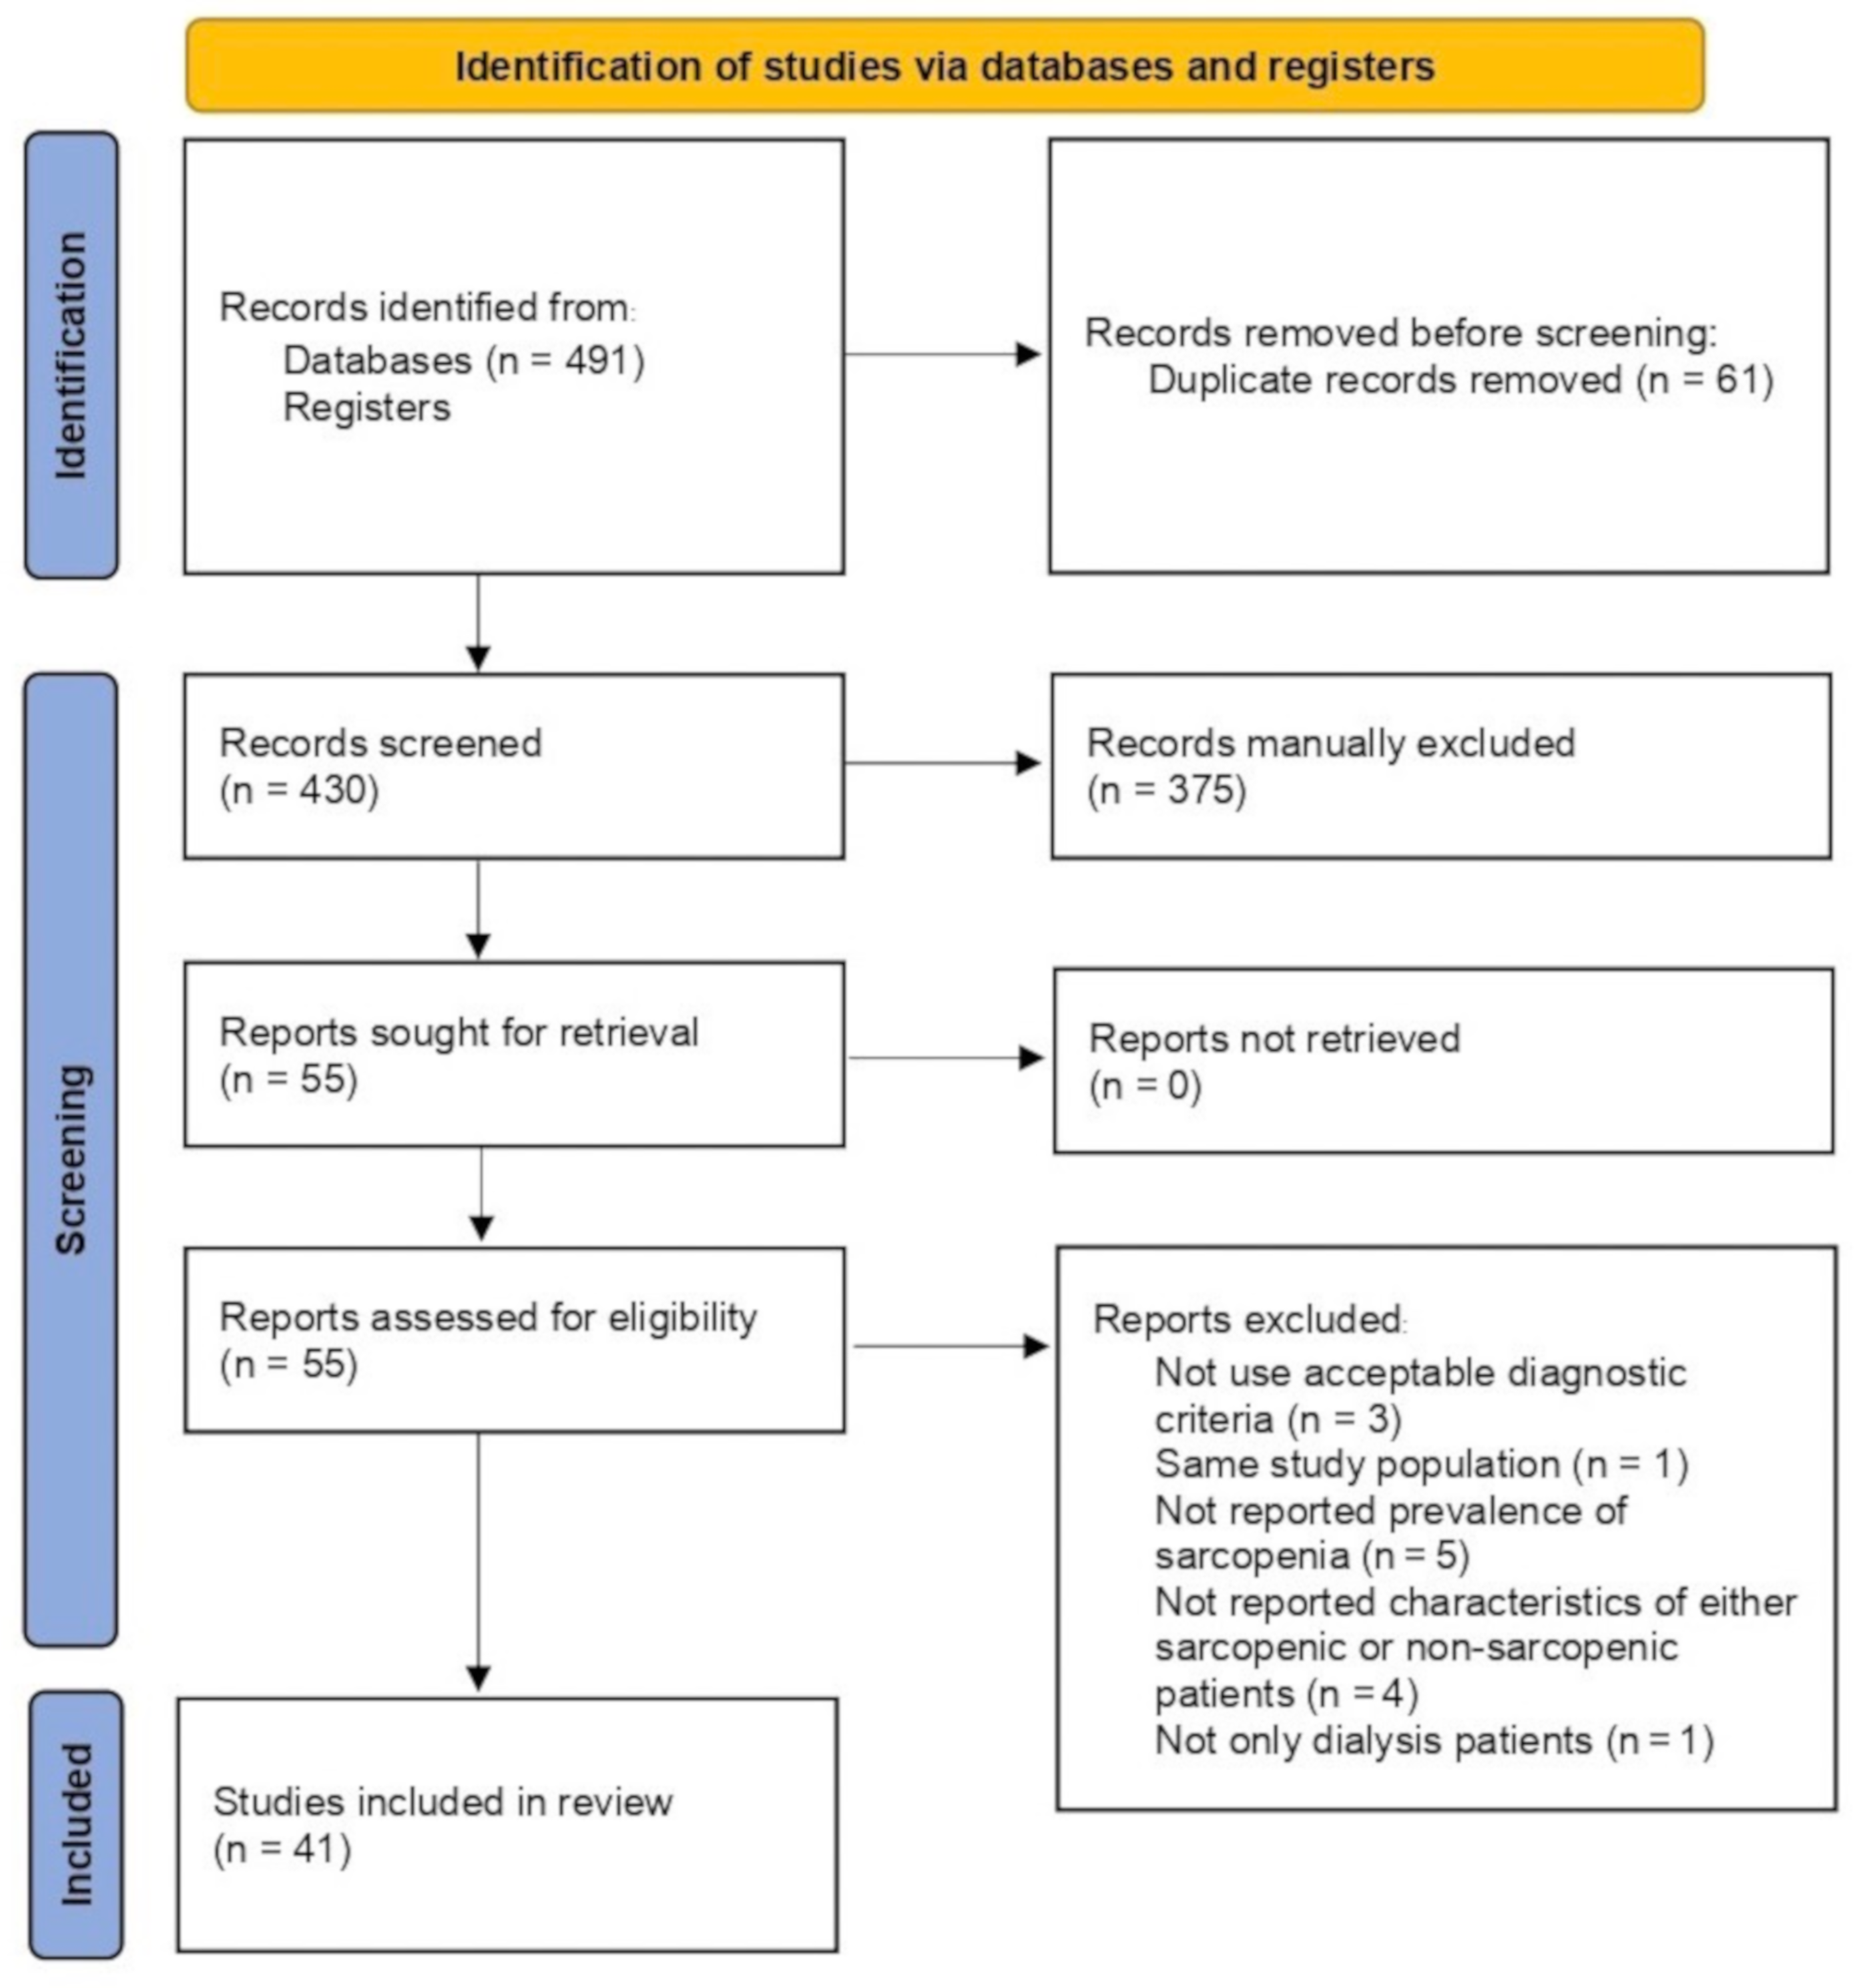
2.4. Study Selection
2.5. Data Extraction and Risk of Bias Assessment
2.6. Statistical Analysis
3. Results
3.1. Characteristics of the Included Studies
3.2. Operational Criteria for the Diagnosis of Sarcopenia
3.3. Methodological Quality
3.4. Prevalence of Sarcopenia in Dialysis Patients
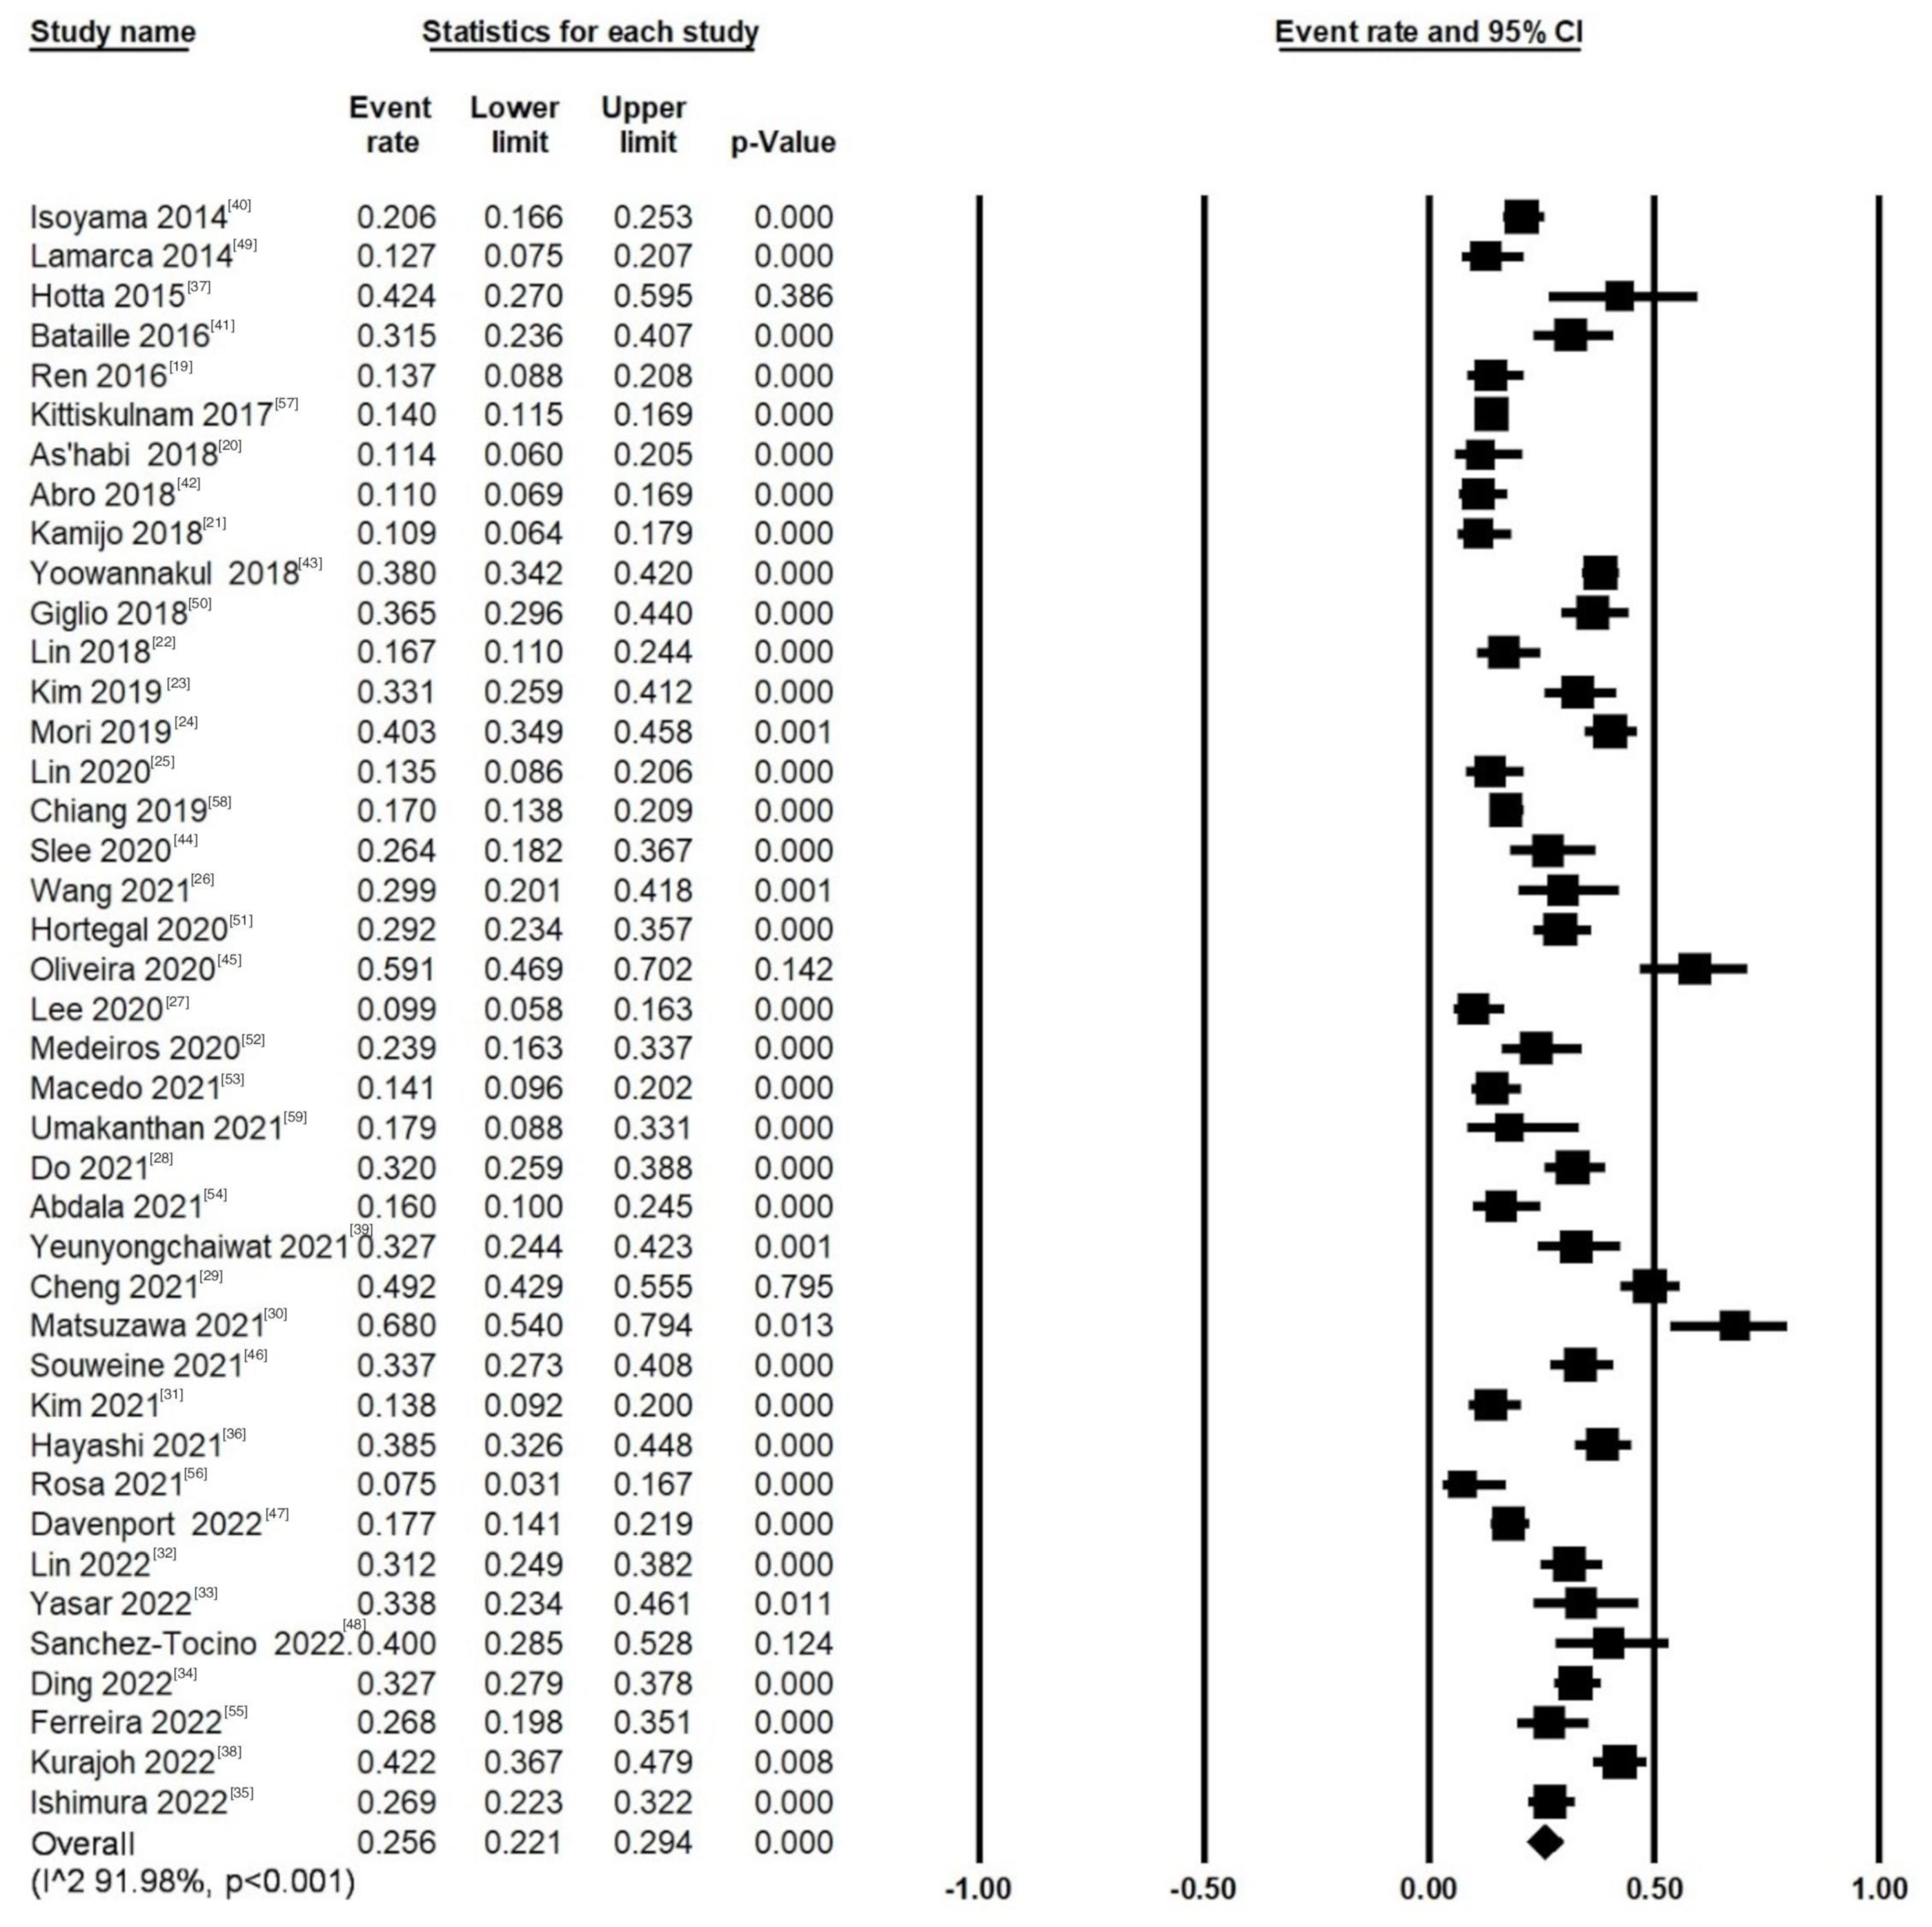
3.4.1. The Overall Pooled Prevalence of Sarcopenia in Dialysis Patients
3.4.2. Subgroup Analysis
3.5. Meta-Analysis of Baseline Characteristics between Patients with or without Sarcopenia
3.6. Association between Sarcopenia and Clinical Outcomes
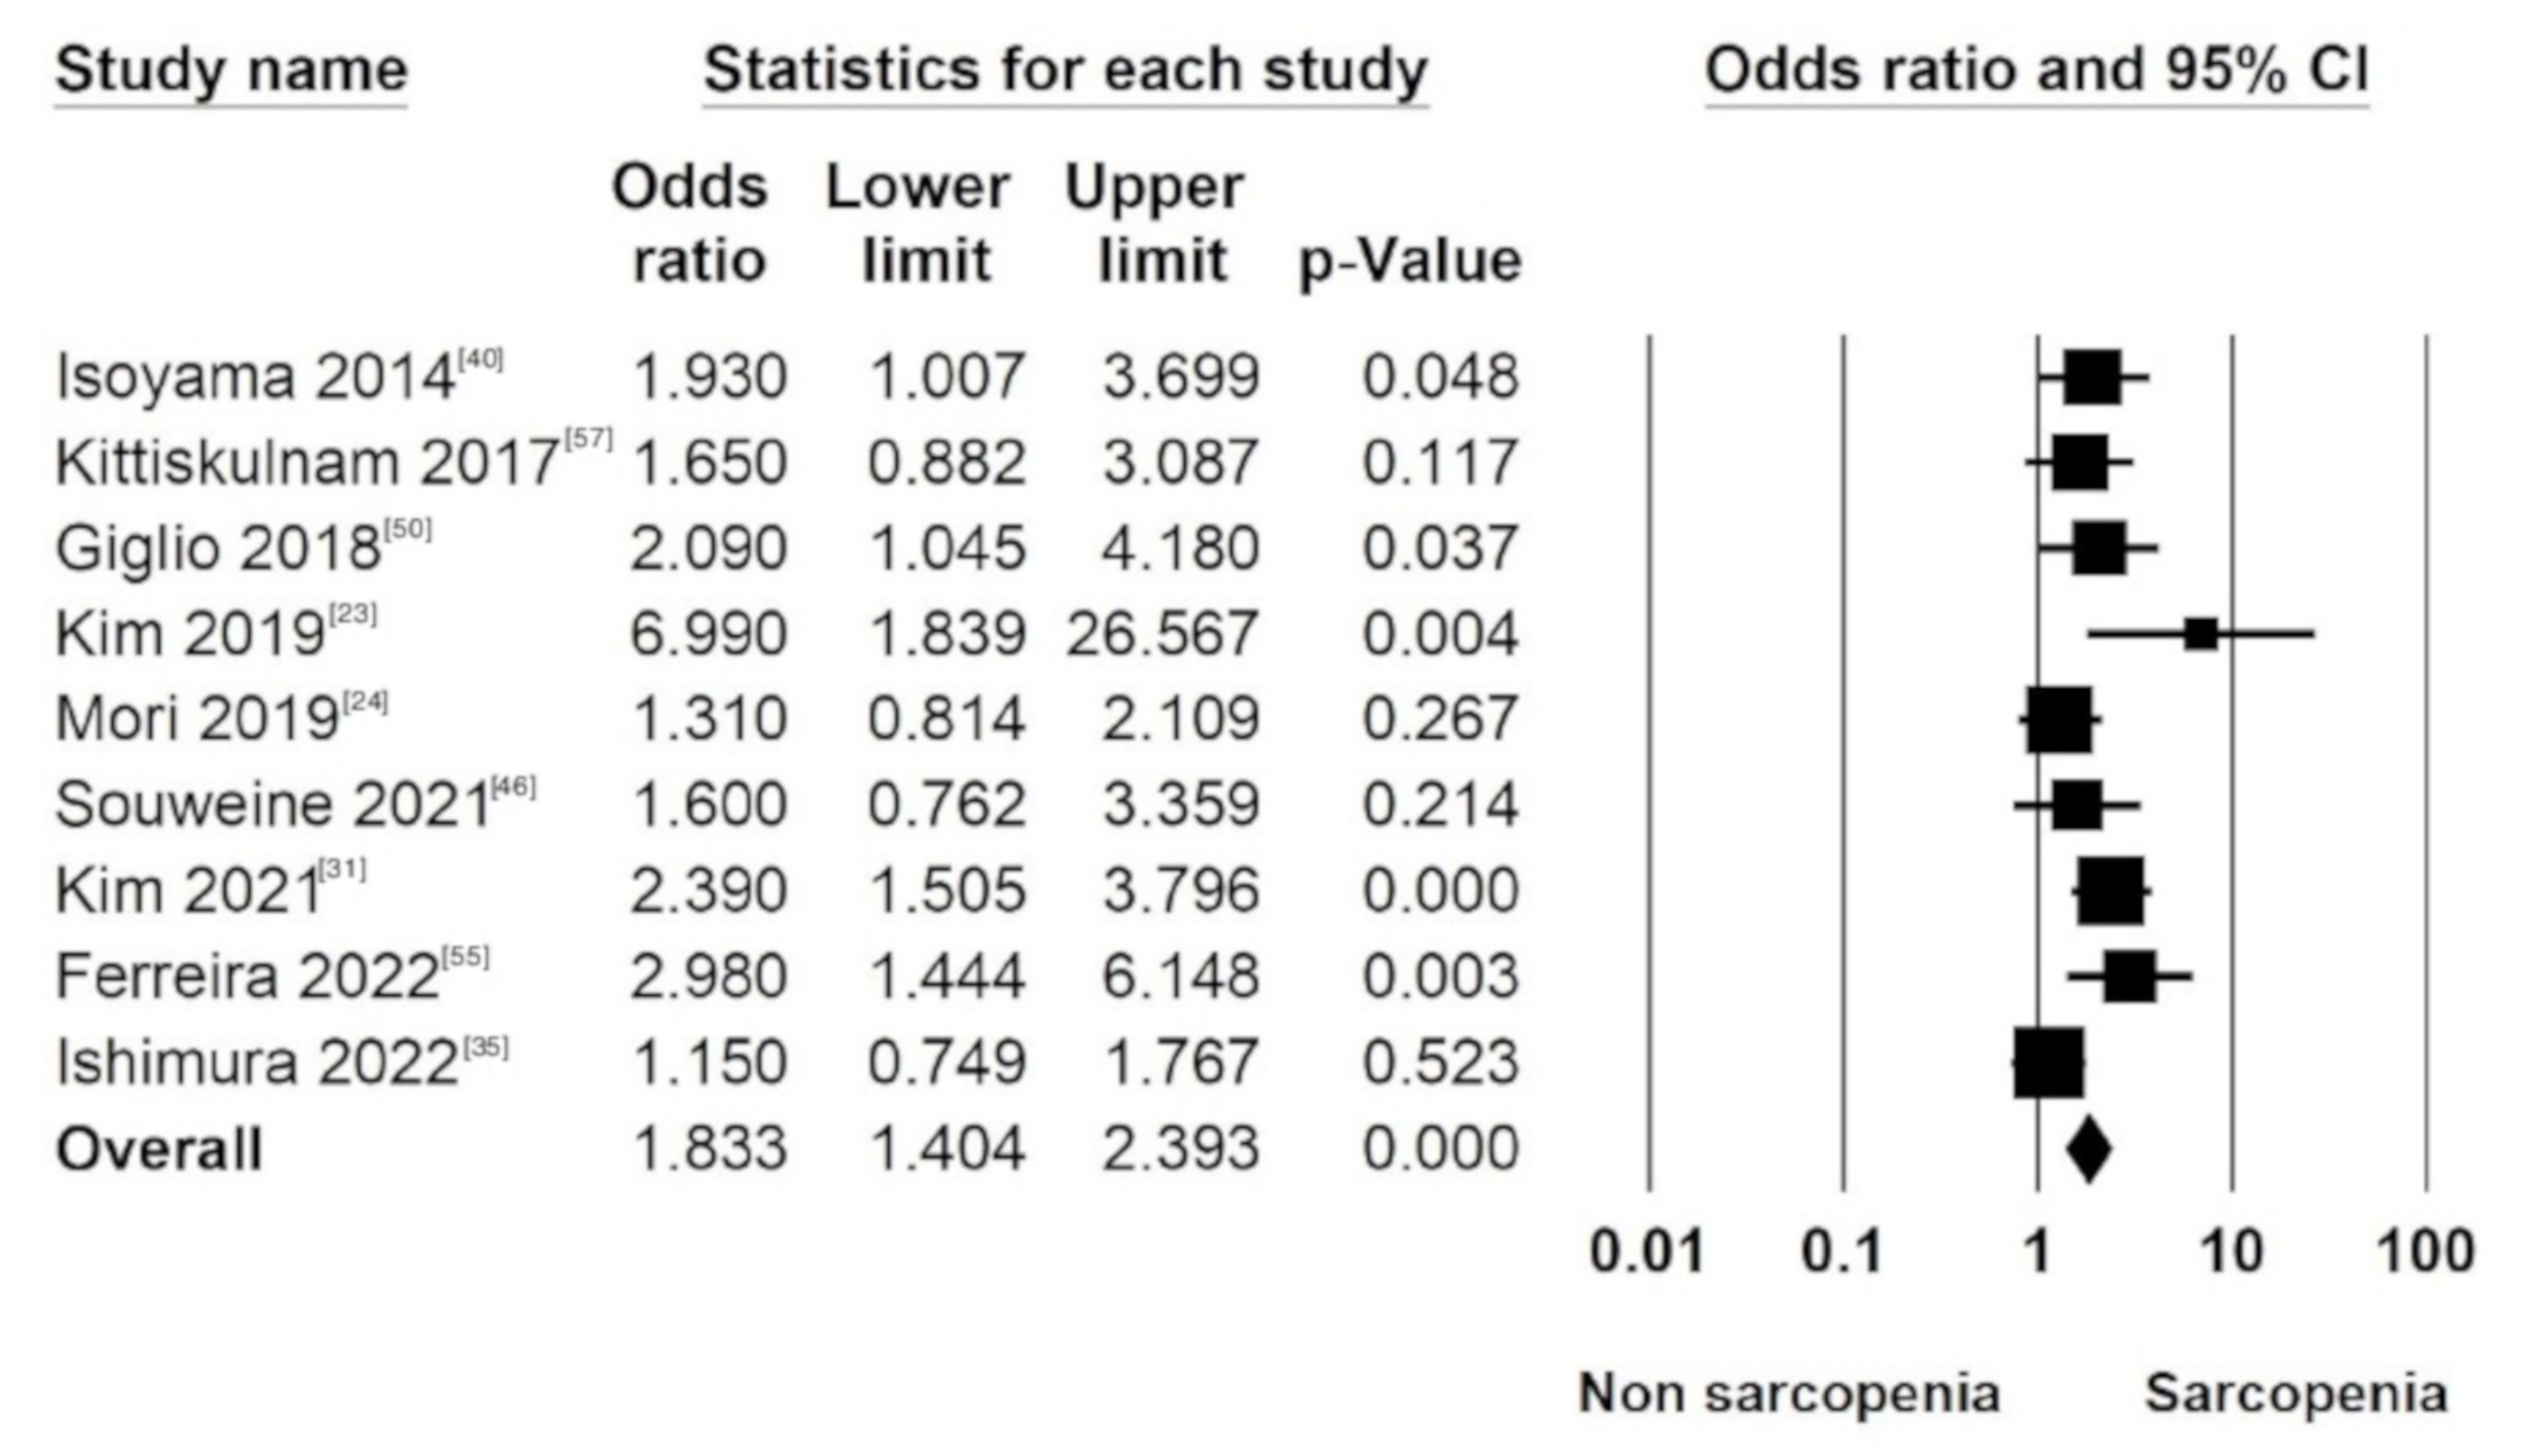
3.6.1. All-Cause Mortality in Sarcopenia (LMM Plus LMS) Patients
3.6.2. All-Cause Mortality in Individual Components of the Diagnostic Criteria of Sarcopenia (LMM and LMS)
3.6.3. Cardiovascular Events
3.6.4. Hospitalization
3.6.5. Dependency
3.6.6. Frailty
3.6.7. Investigations of Heterogeneity
3.6.8. Meta-Regression Model
3.6.9. Assessment of Publication Bias
4. Discussion
5. Conclusions
Supplementary Materials
Author Contributions
Funding
Institutional Review Board Statement
Informed Consent Statement
Data Availability Statement
Acknowledgments
Conflicts of Interest
References
- Rosenberg, I.H. Sarcopenia: Origins and clinical relevance. Clin. Geriatr. Med. 2011, 27, 337–339. [Google Scholar] [CrossRef] [PubMed]
- Cruz-Jentoft, A.J.; Bahat, G.; Bauer, J.; Boirie, Y.; Bruyère, O.; Cederholm, T.; Cooper, C.; Landi, F.; Rolland, Y.; Sayer, A.A.; et al. Sarcopenia: Revised European consensus on definition and diagnosis. Age Ageing 2019, 48, 16–31. [Google Scholar] [CrossRef] [PubMed]
- Doherty, T.J. Invited Review: Aging and sarcopenia. J. Appl. Physiol. 2003, 95, 1717–1727. [Google Scholar] [CrossRef] [PubMed]
- Cruz-Jentoft, A.J.; Baeyens, J.P.; Bauer, J.M.; Boirie, Y.; Cederholm, T.; Landi, F.; Martin, F.C.; Michel, J.-P.; Rolland, Y.; Schneider, S.M.; et al. Sarcopenia: European consensus on definition and diagnosis: Report of the European Working Group on Sarcopenia in Older People. Age Ageing 2010, 39, 412–423. [Google Scholar] [CrossRef]
- Yuan, D.; Jin, H.; Liu, Q.; Zhang, J.; Ma, B.; Xiao, W.; Li, Y. Publication Trends for Sarcopenia in the World: A 20-Year Bibliometric Analysis. Front. Med. 2022, 9, 802651. [Google Scholar] [CrossRef]
- Noce, A.; Bocedi, A.; Campo, M.; Marrone, G.; Di Lauro, M.; Cattani, G.; Di Daniele, N.; Romani, A. A Pilot Study of a Natural Food Supplement as New Possible Therapeutic Approach in Chronic Kidney Disease Patients. Pharmaceuticals 2020, 13, 148. [Google Scholar] [CrossRef]
- Romani, A.; Bernini, R.; Noce, A.; Urciuoli, S.; Di Lauro, M.; Zaitseva, A.P.; Marrone, G.; Di Daniele, N. Potential Beneficial Effects of Extra Virgin Olive Oils Characterized by High Content in Minor Polar Compounds in Nephropathic Patients: A Pilot Study. Molecules 2020, 25, 4757. [Google Scholar] [CrossRef]
- Honda, H.; Qureshi, A.R.; Axelsson, J.; Heimburger, O.; Suliman, M.E.; Barany, P.; Stenvinkel, P.; Lindholm, B. Obese sarcopenia in patients with end-stage renal disease is associated with inflammation and increased mortality. Am. J. Clin. Nutr. 2007, 86, 633–638. [Google Scholar] [CrossRef]
- Raj, D.S.; Sun, Y.; Tzamaloukas, A.H. Hypercatabolism in dialysis patients. Curr. Opin. Nephrol. Hypertens. 2008, 17, 589–594. [Google Scholar] [CrossRef]
- Sabatino, A.; Cuppari, L.; Stenvinkel, P.; Lindholm, B.; Avesani, C.M. Sarcopenia in chronic kidney disease: What have we learned so far? J. Nephrol. 2021, 34, 1347–1372. [Google Scholar] [CrossRef]
- Shu, X.; Lin, T.; Wang, H.; Zhao, Y.; Jiang, T.; Peng, X.; Yue, J. Diagnosis, prevalence, and mortality of sarcopenia in dialysis patients: A systematic review and meta-analysis. J. Cachexia Sarcopenia Muscle 2022, 13, 145–158. [Google Scholar] [CrossRef]
- Chen, L.-K.; Liu, L.-K.; Woo, J.; Assantachai, P.; Auyeung, T.-W.; Bahyah, K.S.; Chou, M.-Y.; Chen, L.-Y.; Hsu, P.-S.; Krairit, O.; et al. Sarcopenia in Asia: Consensus Report of the Asian Working Group for Sarcopenia. J. Am. Med. Dir. Assoc. 2014, 15, 95–101. [Google Scholar] [CrossRef]
- Chen, L.-K.; Woo, J.; Assantachai, P.; Auyeung, T.-W.; Chou, M.-Y.; Iijima, K.; Jang, H.C.; Kang, L.; Kim, M.; Kim, S.; et al. Asian Working Group for Sarcopenia: 2019 Consensus Update on Sarcopenia Diagnosis and Treatment. J. Am. Med. Dir. Assoc. 2020, 21, 300–307.e302. [Google Scholar] [CrossRef]
- Studenski, S.A.; Peters, K.W.; Alley, D.E.; Cawthon, P.M.; McLean, R.R.; Harris, T.B.; Ferrucci, L.; Guralnik, J.M.; Fragala, M.S.; Kenny, A.M.; et al. The FNIH Sarcopenia Project: Rationale, Study Description, Conference Recommendations, and Final Estimates. J. Gerontol. A Biol. Sci. Med. Sci. 2014, 69, 547–558. [Google Scholar] [CrossRef]
- Fielding, R.A.; Vellas, B.; Evans, W.J.; Bhasin, S.; Morley, J.E.; Newman, A.B.; van Kan, G.A.; Andrieu, S.; Bauer, J.; Breuille, D.; et al. Sarcopenia: An Undiagnosed Condition in Older Adults. Current Consensus Definition: Prevalence, Etiology, and Consequences. International Working Group on Sarcopenia. J. Am. Med. Dir. Assoc. 2011, 12, 249–256. [Google Scholar] [CrossRef]
- Page, M.J.; McKenzie, J.E.; Bossuyt, P.M.; Boutron, I.; Hoffmann, T.C.; Mulrow, C.D.; Shamseer, L.; Tetzlaff, J.M.; Akl, E.A.; Brennan, S.E.; et al. The PRISMA 2020 statement: An updated guideline for reporting systematic reviews. BMJ 2021, 372, n71. [Google Scholar] [CrossRef]
- Wells, G.A.; Shea, B.; O’Connell, D.; Peterson, J.; Welch, V.; Losos, M.; Tugwell, P. The Newcastle-Ottawa Scale (NOS) for Assessing the Quality of Nonrandomised Studies in Meta-Analyses. Available online: http://www.ohri.ca/programs/clinical_epidemiology/oxford.asp (accessed on 9 April 2022).
- Herzog, R.; Alvarez-Pasquin, M.J.; Diaz, C.; Del Barrio, J.L.; Estrada, J.M.; Gil, A. Are healthcare workers’ intentions to vaccinate related to their knowledge, beliefs and attitudes? A systematic review. BMC Public Health 2013, 13, 154. [Google Scholar] [CrossRef]
- Ren, H.; Gong, D.; Jia, F.; Xu, B.; Liu, Z. Sarcopenia in patients undergoing maintenance hemodialysis: Incidence rate, risk factors and its effect on survival risk. Ren. Fail. 2016, 38, 364–371. [Google Scholar] [CrossRef]
- As’Habi, A.; Najafi, I.; Tabibi, H.; Hedayati, M. Prevalence of Sarcopenia and Dynapenia and Their Determinants in Iranian Peritoneal Dialysis Patients. Iran. J. Kidney Dis. 2018, 12, 53–60. [Google Scholar]
- Kamijo, Y.; Kanda, E.; Ishibashi, Y.; Yoshida, M. Sarcopenia and Frailty in PD: Impact on Mortality, Malnutrition, and Inflammation. Perit. Dial. Int. 2018, 38, 447–454. [Google Scholar] [CrossRef]
- Lin, Y.-L.; Liou, H.-H.; Lai, Y.-H.; Wang, C.-H.; Kuo, C.-H.; Chen, S.-Y.; Hsu, B.-G. Decreased serum fatty acid binding protein 4 concentrations are associated with sarcopenia in chronic hemodialysis patients. Clin. Chim. Acta 2018, 485, 113–118. [Google Scholar] [CrossRef]
- Kim, J.-K.; Kim, S.G.; Oh, J.-E.; Lee, Y.-K.; Noh, J.-W.; Kim, H.J.; Song, Y.R. Impact of sarcopenia on long-term mortality and cardiovascular events in patients undergoing hemodialysis. Korean J. Intern. Med. 2019, 34, 599–607. [Google Scholar] [CrossRef]
- Mori, K.; Nishide, K.; Okuno, S.; Shoji, T.; Emoto, M.; Tsuda, A.; Nakatani, S.; Imanishi, Y.; Ishimura, E.; Yamakawa, T.; et al. Impact of diabetes on sarcopenia and mortality in patients undergoing hemodialysis. BMC Nephrol. 2019, 20, 105. [Google Scholar] [CrossRef]
- Lin, Y.-L.; Liou, H.-H.; Wang, C.-H.; Lai, Y.-H.; Kuo, C.-H.; Chen, S.-Y.; Hsu, B.-G. Impact of sarcopenia and its diagnostic criteria on hospitalization and mortality in chronic hemodialysis patients: A 3-year longitudinal study. J. Formos. Med. Assoc. 2019, 119, 1219–1229. [Google Scholar] [CrossRef]
- Wang, M.; Liu, L.; Shen, X.; Li, Y.; He, Q. Assessing lean tissue by bioelectrical impedance analysis pre hemodialysis underestimates the prevalence of sarcopenia in maintenance hemodialysis patients. Eur. J. Clin. Nutr. 2021, 75, 1407–1413. [Google Scholar] [CrossRef]
- Lee, H.; Kim, K.; Ahn, J.; Lee, D.R.; Lee, J.H.; Hwang, S.D. Association of nutritional status with osteoporosis, sarcopenia, and cognitive impairment in patients on hemodialysis. Asia Pac. J. Clin. Nutr. 2020, 29, 712–723. [Google Scholar]
- Do, J.Y.; Kim, A.Y.; Kang, S.H. Association Between Phase Angle and Sarcopenia in Patients Undergoing Peritoneal Dialysis. Front. Nutr. 2021, 8, 742081. [Google Scholar] [CrossRef]
- Cheng, D.; Zhang, Q.; Wang, Z.; Li, J.; Jian, G.; Wang, N. Association Between Sarcopenia and Its Components and Dependency in Activities of Daily Living in Patients on Hemodialysis. J. Ren. Nutr. 2021, 31, 397–402. [Google Scholar] [CrossRef]
- Matsuzawa, R.; Yamamoto, S.; Suzuki, Y.; Imamura, K.; Harada, M.; Matsunaga, A.; Tamaki, A.; Fukui, T.; Shimokado, K. The clinical applicability of ultrasound technique for diagnosis of sarcopenia in hemodialysis patients. Clin. Nutr. 2020, 40, 1161–1167. [Google Scholar] [CrossRef]
- Kim, C.; Kim, J.-K.; Lee, H.-S.; Kim, S.G.; Song, Y.R. Longitudinal changes in body composition are associated with all-cause mortality in patients on peritoneal dialysis. Clin. Nutr. 2020, 40, 120–126. [Google Scholar] [CrossRef]
- Lin, Y.-L.; Wang, C.-H.; Tsai, J.-P.; Chen, C.-T.; Chen, Y.-H.; Hung, S.-C.; Hsu, B.-G. A Comparison of SARC-F, Calf Circumference, and Their Combination for Sarcopenia Screening among Patients Undergoing Peritoneal Dialysis. Nutrients 2022, 14, 923. [Google Scholar] [CrossRef]
- Yasar, E.; Tek, N.A.; Tekbudak, M.Y.; Yurtdaş, G.; Gülbahar, Ö.; Uyar, G.; Ural, Z.; Çelik, M.; Erten, Y. The Relationship Between Myostatin, Inflammatory Markers, and Sarcopenia in Patients with Chronic Kidney Disease. J. Ren. Nutr. 2022, S1051-2276(22)00011-5. [Google Scholar] [CrossRef]
- Ding, Y.; Chang, L.; Zhang, H.; Wang, S. Predictive value of phase angle in sarcopenia in patients on maintenance hemodialysis. Nutrition 2021, 94, 111527. [Google Scholar] [CrossRef] [PubMed]
- Ishimura, E.; Okuno, S.; Nakatani, S.; Mori, K.; Miyawaki, J.; Okazaki, H.; Sugie, N.; Norimine, K.; Yamakawa, K.; Tsujimoto, Y.; et al. Significant Association of Diabetes with Mortality of Chronic Hemodialysis Patients, Independent of the Presence of Obesity, Sarcopenia, and Sarcopenic Obesity. J. Ren. Nutr. 2022, 32, 94–101. [Google Scholar] [CrossRef] [PubMed]
- Hayashi, H.; Izumiya, Y.; Hayashi, O.; Ichii, M.; Tsujimoto, Y.; Yoshiyama, M. Dynapenia is an independent predictor of cardio-cerebrovascular events in patients undergoing hemodialysis. Hear Vessel. 2022, 37, 1066–1074. [Google Scholar] [CrossRef]
- Hotta, C.; Hiraki, K.; Wakamiya, A.; Otobe, Y.; Watanabe, S.; Izawa, K.P.; Kaneshiro, N.; Konno, Y.; Sakurada, T.; Shibagaki, Y.; et al. Relation of physical function and physical activity to sarcopenia in hemodialysis patients: A preliminary study. Int. J. Cardiol. 2015, 191, 198–200. [Google Scholar] [CrossRef]
- Kurajoh, M.; Mori, K.; Miyabe, M.; Matsufuji, S.; Kizu, A.; Tsujimoto, Y.; Emoto, M. Xanthine Oxidoreductase Inhibitor Use Associated with Reduced Risk of Sarcopenia and Severe Sarcopenia in Patients Undergoing Hemodialysis. Front. Med. 2022, 9, 817578. [Google Scholar] [CrossRef]
- Yuenyongchaiwat, K.; Jongritthiporn, S.; Somsamarn, K.; Sukkho, O.; Pairojkittrakul, S.; Traitanon, O. Depression and low physical activity are related to sarcopenia in hemodialysis: A single-center study. PeerJ 2021, 9, e11695. [Google Scholar] [CrossRef]
- Isoyama, N.; Qureshi, A.R.; Avesani, C.M.; Lindholm, B.; Bàràny, P.; Heimbürger, O.; Cederholm, T.; Stenvinkel, P.; Carrero, J.J. Comparative Associations of Muscle Mass and Muscle Strength with Mortality in Dialysis Patients. Clin. J. Am. Soc. Nephrol. 2014, 9, 1720–1728. [Google Scholar] [CrossRef]
- Bataille, S.; Serveaux, M.; Carreno, E.; Pedinielli, N.; Darmon, P.; Robert, A. The diagnosis of sarcopenia is mainly driven by muscle mass in hemodialysis patients. Clin. Nutr. 2017, 36, 1654–1660. [Google Scholar] [CrossRef]
- Abro, A.; Delicata, L.-A.; Vongsanim, S.; Davenport, A. Differences in the prevalence of sarcopenia in peritoneal dialysis patients using hand grip strength and appendicular lean mass: Depends upon guideline definitions. Eur. J. Clin. Nutr. 2018, 72, 993–999. [Google Scholar] [CrossRef]
- Yoowannakul, S.; Tangvoraphonkchai, K.; Vongsanim, S.; Mohamed, A.; Davenport, A. Differences in the prevalence of sarcopenia in haemodialysis patients: The effects of gender and ethnicity. J. Hum. Nutr. Diet. 2018, 31, 689–696. [Google Scholar] [CrossRef]
- Slee, A.; McKeaveney, C.; Adamson, G.; Davenport, A.; Farrington, K.; Fouque, D.; Kalantar-Zadeh, K.; Mallett, J.; Maxwell, A.P.; Mullan, R.; et al. Estimating the Prevalence of Muscle Wasting, Weakness, and Sarcopenia in Hemodialysis Patients. J. Ren. Nutr. 2020, 30, 313–321. [Google Scholar] [CrossRef]
- Oliveira, E.M.; Silva, R.P.D.; Lemos, M.; Burgos, M.; Costa, D.M.N.; Maio, R. Frequency of sarcopenia, cachexia, and associated factors in patients with chronic kidney disease in dialysis treatment. Nutr. Hosp. 2020, 37, 1157–1165. [Google Scholar] [CrossRef]
- Souweine, J.S.; Pasquier, G.; Kuster, N.; Rodriguez, A.; Patrier, L.; Morena, M.; Badia, E.; Raynaud, F.; Chalabi, L.; Raynal, N.; et al. Dynapaenia and sarcopaenia in chronic haemodialysis patients: Do muscle weakness and atrophy similarly influence poor outcome? Nephrol. Dial. Transpl. 2021, 36, 1908–1918. [Google Scholar] [CrossRef]
- Davenport, A. Comparison of frailty, sarcopenia and protein energy wasting in a contemporary peritoneal dialysis cohort. Perit. Dial. Int. 2022, 8968608221077462. [Google Scholar] [CrossRef]
- Sánchez-Tocino, M.L.; Miranda-Serrano, B.; Gracia-Iguacel, C.; De-Alba-Peñaranda, A.M.; Mas-Fontao, S.; López-González, A.; Villoria-González, S.; Pereira-García, M.; Ortíz, A.; González-Parra, E. Sarcopenia assessed by 4-step EWGSOP2 in elderly hemodialysis patients: Feasibility and limitations. PLoS ONE 2022, 17, e0261459. [Google Scholar] [CrossRef]
- Lamarca, F.; Carrero, J.J.; Rodrigues, J.C.; Bigogno, F.G.; Fetter, R.L.; Avesani, C.M. Prevalence of sarcopenia in elderly maintenance hemodialysis patients: The impact of different diagnostic criteria. J. Nutr. Health Aging 2014, 18, 710–717. [Google Scholar] [CrossRef]
- Giglio, J.; Kamimura, M.A.; Lamarca, F.; Rodrigues, J.; Santin, F.; Avesani, C.M. Association of Sarcopenia with Nutritional Parameters, Quality of Life, Hospitalization, and Mortality Rates of Elderly Patients on Hemodialysis. J. Ren. Nutr. 2018, 28, 197–207. [Google Scholar] [CrossRef]
- Furtado, E.V.H.; Alves, J.J.D.A.; Santos, E.J.F.; Nunes, L.C.R.; Galvão, J.C.; Nunes, R.F.; Lula, D.D.A.; de Carvalho, S.C.R.; França, A.K.T.D.C.; dos Santos, E.M.; et al. Sarcopenia and inflammation in patients undergoing hemodialysis. Nutr. Hosp. 2020, 37, 855–862. [Google Scholar] [CrossRef]
- Medeiros, M.C.; Rocha, N.; Bandeira, E.; Dantas, I.; Chaves, C.; Oliveira, M.; Bandeira, F. Serum Sclerostin, Body Composition, and Sarcopenia in Hemodialysis Patients with Diabetes. Int. J. Nephrol. 2020, 2020, 4596920. [Google Scholar] [CrossRef]
- Macedo, C.; Amaral, T.F.; Rodrigues, J.; Santin, F.; Avesani, C.M. Malnutrition and Sarcopenia Combined Increases the Risk for Mortality in Older Adults on Hemodialysis. Front. Nutr. 2021, 8, 721941. [Google Scholar] [CrossRef]
- Abdala, R.; del Valle, E.E.; Negri, A.L.; Bridoux, P.; Paganti, L.G.; Bravo, M.; Sintado, L.; Di Rienzo, P.; Schiavelli, O.R.; Zanchetta, M.B.; et al. Sarcopenia in hemodialysis patients from Buenos Aires, Argentina. Osteoporos. Sarcopenia 2021, 7, 75–80. [Google Scholar] [CrossRef]
- Ferreira, M.F.; Böhlke, M.; Pauletto, M.B.; Frühauf, I.R.; Gonzalez, M.C. Sarcopenia diagnosis using different criteria as a predictor of early mortality in patients undergoing hemodialysis. Nutrition 2022, 95, 111542. [Google Scholar] [CrossRef]
- Rosa, C.S.C.; Msc, H.S.R.; Vogt, B.P.; Sakkas, G.K.; Monteiro, H.L. Sarcopenia diagnosis in patients receiving hemodialysis: Agreement among different consensuses. Nutr. Clin. Pr. 2021. Epub ahead of print: 30-12-2021. [Google Scholar] [CrossRef]
- Kittiskulnam, P.; Chertow, G.M.; Carrero, J.J.; Delgado, C.; Kaysen, G.A.; Johansen, K.L. Sarcopenia and its individual criteria are associated, in part, with mortality among patients on hemodialysis. Kidney Int. 2017, 92, 238–247. [Google Scholar] [CrossRef]
- Chiang, J.M.; Kaysen, G.A.; Segal, M.; Chertow, G.M.; Delgado, C.; Johansen, K.L. Low testosterone is associated with frailty, muscle wasting and physical dysfunction among men receiving hemodialysis: A longitudinal analysis. Nephrol. Dial. Transplant. 2018, 34, 802–810. [Google Scholar] [CrossRef]
- Umakanthan, M.; Li, J.W.; Sud, K.; Duque, G.; Guilfoyle, D.; Cho, K.; Brown, C.; Boersma, D.; Komala, M.G. Prevalence and Factors Associated with Sarcopenia in Patients on Maintenance Dialysis in Australia-A Single Centre, Cross-Sectional Study. Nutrients 2021, 13, 3284. [Google Scholar] [CrossRef]
- Liu, X.; Hou, L.; Zhao, W.; Xia, X.; Hu, F.; Zhang, G.; Hao, Q.; Zhou, L.; Liu, Y.; Ge, M.; et al. The Comparison of Sarcopenia Diagnostic Criteria using AWGS 2019 with the Other Five Criteria in West China. Gerontology 2021, 67, 386–396. [Google Scholar] [CrossRef]
- Shafiee, G.; Keshtkar, A.; Soltani, A.; Ahadi, Z.; Larijani, B.; Heshmat, R. Prevalence of sarcopenia in the world: A systematic review and meta- analysis of general population studies. J. Diabetes Metab. Disord. 2017, 16, 21. [Google Scholar] [CrossRef]
- Kim, J.K.; Choi, S.R.; Choi, M.J.; Kim, S.G.; Lee, Y.K.; Noh, J.W.; Kimad, H.J.; Song, Y.R. Prevalence of and factors associated with sarcopenia in elderly patients with end-stage renal disease. Clin. Nutr. 2014, 33, 64–68. [Google Scholar] [CrossRef] [PubMed]
- Kutner, N.G.; Zhang, R.; Barnhart, H.; Collins, A.J. Health status and quality of life reported by incident patients after 1 year on haemodialysis or peritoneal dialysis. Nephrol. Dial. Transplant. 2005, 20, 2159–2167. [Google Scholar] [CrossRef] [PubMed]
- Silva, M.Z.C.; Antonio, K.J.; Reis, J.M.S.; Alves, L.S.; Caramori, J.C.T.; Vogt, B.P. Age, diabetes mellitus, and dialysis modality are associated with risk of poor muscle strength and physical function in hemodialysis and peritoneal dialysis patients. Kidney Res. Clin. Pr. 2021, 40, 294–303. [Google Scholar] [CrossRef] [PubMed]
- Dahlmann, A.; Dörfelt, K.; Eicher, F.; Linz, P.; Kopp, C.; Mössinger, I.; Horn, S.; Büschges-Seraphin, B.; Wabel, P.; Hammon, M.; et al. Magnetic resonance–determined sodium removal from tissue stores in hemodialysis patients. Kidney Int. 2015, 87, 434–441. [Google Scholar] [CrossRef]
- Cunningham, J.J. Body composition as a determinant of energy expenditure: A synthetic review and a proposed general prediction equation. Am. J. Clin. Nutr. 1991, 54, 963–969. [Google Scholar] [CrossRef]
- Yılmaz, Z.; Yıldırım, Y.; Aydın, F.Y.; Aydın, E.; Kadiroğlu, A.K.; Yılmaz, M.E.; Acet, H. Evaluation of fluid status related parameters in hemodialysis and peritoneal dialysis patients: Clinical usefulness of bioimpedance analysis. Medicina 2014, 50, 269–274. [Google Scholar] [CrossRef]
- Pinto, A.P.; Ramos, C.I.; Meireles, M.S.; Kamimura, M.A.; Cuppari, L. Impact of hemodialysis session on handgrip strength. J. Bras. De Nefrol. 2015, 37, 451–457. [Google Scholar] [CrossRef]
- Clark, W.R.; Dehghani, N.L.; Narsimhan, V.; Ronco, C. Uremic Toxins and their Relation to Dialysis Efficacy. Blood Purif. 2019, 48, 299–314. [Google Scholar] [CrossRef]
- Alcalde-Estévez, E.; Sosa, P.; Asenjo-Bueno, A.; Plaza, P.; Olmos, G.; Naves-Díaz, M.; Rodríguez-Puyol, D.; López-Ongil, S.; Ruiz-Torres, M.P. Uraemic toxins impair skeletal muscle regeneration by inhibiting myoblast proliferation, reducing myogenic differentiation, and promoting muscular fibrosis. Sci. Rep. 2021, 11, 512. [Google Scholar] [CrossRef]
- Thurlow, J.S.; Joshi, M.; Yan, G.; Norris, K.C.; Agodoa, L.Y.; Yuan, C.M.; Nee, R. Global Epidemiology of End-Stage Kidney Disease and Disparities in Kidney Replacement Therapy. Am. J. Nephrol. 2021, 52, 98–107. [Google Scholar] [CrossRef]
- Mesinovic, J.; Zengin, A.; De Courten, B.; Ebeling, P.R.; Scott, D. Sarcopenia and type 2 diabetes mellitus: A bidirectional relationship. Diabetes Metab. Syndr. Obesity Targets Ther. 2019, 12, 1057–1072. [Google Scholar] [CrossRef]
- Rhee, C.M.; Kovesdy, C.P.; Kalantar-Zadeh, K. Glucose Homeostasis, Hypoglycemia, and the Burnt-Out Diabetes Phenomenon in Kidney Disease. Semin. Nephrol. 2021, 41, 96–103. [Google Scholar] [CrossRef]
- Cozzolino, M.; Mangano, M.; Stucchi, A.; Ciceri, P.; Conte, F.; Galassi, A. Cardiovascular disease in dialysis patients. Nephrol. Dial. Transplant. 2018, 33, 28–34. [Google Scholar] [CrossRef]
- Goodpaster, B.H.; Park, S.W.; Harris, T.B.; Kritchevsky, S.B.; Nevitt, M.; Schwartz, A.V.; Simonsick, E.M.; Tylavsky, F.A.; Visser, M.; Newman, A.B.; et al. The Loss of Skeletal Muscle Strength, Mass, and Quality in Older Adults: The Health, Aging and Body Composition Study. J. Gerontol. A Biol. Sci. Med. Sci. 2006, 61, 1059–1064. [Google Scholar] [CrossRef]
- Organ, J.M.; Srisuwananukorn, A.; Price, P.; Joll, J.E.; Biro, K.C.; Rupert, J.E.; Chen, N.X.; Avin, K.G.; Moe, S.M.; Allen, M.R. Reduced skeletal muscle function is associated with decreased fiber cross-sectional area in the Cy/+ rat model of progressive kidney disease. Nephrol. Dial. Transplant. 2015, 31, 223–230. [Google Scholar] [CrossRef]
- Ribeiro, H.S.; Neri, S.G.; Oliveira, J.S.; Bennett, P.N.; Viana, J.L.; Lima, R.M. Association between sarcopenia and clinical outcomes in chronic kidney disease patients: A systematic review and meta-analysis. Clin. Nutr. 2022, 41, 1131–1140. [Google Scholar] [CrossRef]


| Author | Year of Publication | Country | Design | No. of Patients | Mean Age (Year) | Men (%) | DM (%) | Dialysis Vintage (Month) | Mode of KRT | Operational Sarcopenia Criteria | Muscle Mass Instrument | Time of Muscle Mass Measurement | Muscle Strength Instrument | Physical Performance | F/U Time (Year) | Study Quality |
|---|---|---|---|---|---|---|---|---|---|---|---|---|---|---|---|---|
| Isoyama N. | 2014 | Sweden | Prospective cohort | 330 | 53 | 62 | 31 | NA | HD | EWGSOP 2010 | DXA | Post-HD | HGS | NA | 2.42 | Good (7) |
| Lamarca F. | 2014 | Brazil | Cross-sectional | 102 | 70.7 | 73.5 | 34 | 27 | HD | EWGSOP 2010 | BIA | NA | HGS | NA | NA | Good (7) |
| Hotta C. | 2015 | Japan | Cross-sectional | 33 | 67.6 | 60.6 | 24.2 | 51.5 | HD | EWGSOP 2010 | BIA | NA | HGS, KEMS, OLST | GS | NA | Satisfactory (6) |
| Bataille S. | 2016 | France | Cross-sectional | 111 | 77.5 | 58.6 | 52.3 | 35.4 | HD | EWGSOP 2010 | BIA | Intra-HD | HGS | NA | NA | Good (7) |
| Ren H. | 2016 | China | Cross-sectional | 131 | 49.4 | 61.1 | 7.6 | 71.3 | HD | EWGSOP 2010 | BIA | Pre-HD | HGS | NA | NA | Good (7) |
| Kittiskulnam P. | 2017 | US | Prospective cohort | 645 | 56.7 | 58.6 | 43.9 | 33.6 | HD | EWGSOP 2010 + FNIH | BIS | Post-HD | HGS | GS | 1.9 | Good (7) |
| As’habi A. | 2018 | Iran | Cross-sectional | 79 | NA | 44 | 38 | NA | PD | EWGSOP 2010 + AWGS 2014 | BIA | Dry abdomen | HGS | GS | NA | Good (7) |
| Abro A. | 2018 | UK | Cross-sectional | 155 | 63 | 61.3 | 37.4 | 9 | PD | FNIH, AWGS 2014, EWGSOP 2010 | BIA | Dry abdomen | HGS | NA | NA | Good (7) |
| Kamijo Y. | 2018 | Japan | Prospective cohort | 119 | 66.8 | 70.6 | 21 | 128.4 | PD | AWGS 2014 | BIA | NA | HGS | GS | 1.61 | Good (8) |
| Yoowannakul S. | 2018 | UK | Cross-sectional | 600 | 66.3 | 62.2 | 46 | 30.9 | HD | AWGS 2014, EWGSOP 2010, FNIH | BIA | Post-HD | HGS | NA | NA | Good (7) |
| Giglio J. | 2018 | Brazil | Prospective observational | 170 | 70.6 | 65.3 | 62.4 | 34.8 | HD | EWGSOP 2010 | DXA | Intra-HD | HGS | NA | 3 | Good (7) |
| Lin Y. | 2018 | Taiwan | Cross-sectional | 120 | 63.3 | 52.5 | 36.7 | 56.5 | HD | EWGSOP 2010 | BIA | NA | HGS | GS | NA | Good (7) |
| Kim J. | 2019 | Korea | Prospective observational | 142 | 59.8 | 57 | 47.2 | 50.2 | HD | EWGSOP 2010 | BIA | Post-HD | HGS | NA | 4.3 | Good (7) |
| Mori K. | 2019 | Japan | Retrospective observational | 308 | 58.06 | 60.1 | 32.8 | 77.3 | HD | AWGS 2014 | DXA | Post-HD | HGS | NA | 6.33 | Good (8) |
| Chiang J. | 2019 | US | Prospective cohort | 440 | 56.1 | 100 | 41.1 | 32.4 | HD | EWGSOP 2010 + FNIH | BIS | Pre-HD | HGS | NA | 1 | Good (7) |
| Lin Y. | 2020 | Taiwan | Prospective cohort | 126 | 63.2 | 51.6 | 38.9 | 55.4 | HD | EWGSOP 2010 | BIA | Post-HD | HGS | GS | 3 | Good (8) |
| Slee A. | 2020 | UK | Cross-sectional | 87 | 65.9 | 72.4 | NA | 61.7 | HD | EWGSOP 2010, FNIH | BIA | Post-HD | HGS | NA | NA | Good (7) |
| Hortegal EVF. | 2020 | Brazil | Cross-sectional | 209 | 51.9 | 59.3 | 35.8 | NA | HD | EWGSOP 2019 | DXA | Post-HD | HGS | GS | NA | Good (7) |
| Oliveira E. | 2020 | Spain | Cross-sectional | 66 | 53.15 | 43.9 | NA | NA | Mixed | EWGSOP 2010 | BIA | NA | HGS | TUG | NA | Good (7) |
| Lee H. | 2020 | Korea | Cross-sectional | 131 | 66.2 | 54.2 | 67.9 | 61.3 | HD | AWGS 2014 | BIA | Post-HD | HGS | NA | NA | Good (7) |
| Medeiros M. | 2020 | Brazil | Cross-sectional | 92 | 63.3 | 63 | 44.5 | NA | HD | EWGSOP 2010 | BIA | Post-HD | HGS | NA | NA | Good (7) |
| Wang M. | 2021 | China | Cross-sectional | 87 | 66.6 | 70.1 | 40.2 | 42.5 | HD | AWSG 2014 | BIA | Pre-HD, Post-HD | HGS | GS | NA | Good (7) |
| Macedo C. | 2021 | Brazil | Prospective observational | 170 | 70.6 | 65.3 | 37.7 | NA | HD | EWGSOP 2019 | BIA | Post-HD | HGS | NA | 3 | Good (7) |
| Umakanthan J. | 2021 | Australia | Cross-sectional | 39 | 69 | 72 | 31 | 37.4 | Mixed | EWGSOP 2010 | BIS | Pre-HD, random (PD) | HGS | NA | NA | Good (7) |
| Do J. | 2021 | Korea | Cross-sectional | 200 | 55.5 | 57 | 49.5 | 57.8 | PD | AWGS 2014 | DXA | Dry abdomen | HGS | NA | NA | Good (7) |
| Abdala R. | 2021 | Argentina | Cross-sectional | 100 | 55.7 | 60 | NA | 50.8 | HD | EWGSOP 2019 | DXA | Post-HD | HGS | GS, SST | NA | Good (7) |
| Yuenyongchaiwat K. | 2021 | Thai | Cross-sectional | 104 | 59.7 | 51.9 | 37.5 | 70.3 | HD | AWGS2019 | BIA | NA | HGS | GS | NA | Good (7) |
| Cheng D. | 2021 | China | Cross-sectional | 238 | 60.9 | 67.6 | 40.8 | 30.6 | HD | AWGS 2019 | BIA | Post-HD | HGS | GS | NA | Good (7) |
| Matsuzawa | 2021 | Japan | Cross-sectional | 58 | 77.5 | 62.1 | 44.8 | 38.5 | HD | AWGS 2019 | BIA | Post-HD | HGS | GS | NA | Good (7) |
| Souweine J. | 2021 | France | Prospective cohort | 187 | 65.3 | 65 | 15.5 | 67.2 | HD | Other | BIA | Post-HD | HGS | VS | 1.98 | Good (8) |
| Kim C. | 2021 | Korea | Prospective observational | 160 | 55.1 | 68.1 | 53.1 | 21.8 | PD | Other | BIS | NA | HGS | NA | 2 | Good (8) |
| Hayashi H. | 2021 | Japan | Retrospective observational | 244 | 66.6 | 70.5 | 41.4 | 134.7 | HD | AWGS 2019 | DXA | NA | HGS | GS | NA | Good (7) |
| Rosa CSC. | 2021 | Brazil | Cross-sectional | 67 | 54.6 | 64.2 | 46.3 | 15.8 | HD | AWGS 2019, EWGSOP 2010, EWGSOP 2019, FNIH | DXA, BIA | Non-HD day | HGS | NA | NA | Good (7) |
| Davenport A. | 2022 | UK | Retrospective observational | 368 | 60.9 | 61 | 39.7 | 14.2 | PD | AWGS 2019 + EWGSOP 2019 | BIA | Dry abdomen | HGS | NA | NA | Good (7) |
| Lin Y. | 2022 | Taiwan | Cross-sectional | 186 | 57.5 | 46.2 | 40.3 | 45 | PD | AWGS 2019, EWGSOP 2019, FNIH, IWGS | BIA | NA | HGS | GS | NA | Good (7) |
| Yasar E. | 2022 | Turkey | Cross-sectional | 65 | 44.9 | 56.9 | 20 | 132 | Mixed | EWGSOP 2019 | BIA | Pre-HD Dry abdomen (PD) | HGS | NA | NA | Good (7) |
| Sanchez-Tocino M. | 2022 | Spain | Prospective observational | 60 | 81.9 | 68 | NA | 49.9 | HD | EWGSOP 2019 | BIA | Intra-HD | HGS | GS, TUG, SPPB | NA | Good (7) |
| Ding Y. | 2022 | China | Cross-sectional | 346 | 58.2 | 61.1 | 28 | 52.7 | HD | AWGS 2019 | BIA | Post-HD | HGS | GS | NA | Good (7) |
| Ferreira M. | 2022 | Brazil | Prospective cohort | 127 | NA | 56.6 | 30.7 | 30.7 | HD | EWGSOP 2010, EWGSOP 2019 | CC | Post-HD | HGS | GS | 1.96 | Good (8) |
| Kurajoh M. | 2022 | Japan | Cross-sectional | 296 | 68 | 68.6 | 57.8 | 78 | HD | AWGS 2019 | DXA | NA | HGS | CST | NA | Good (7) |
| Ishimura E. | 2022 | Japan | Retrospective cohort | 308 | 58 | 60.1 | 32.8 | 49.2 | HD | AWGS 2019 | DXA | Post-HD | HGS | NA | 6.3 | Good (8) |
| Subgroup Analysis | No. Studies | No. Patients | Heterogeneity | Model | Pooled Prevalence % (IQR) | |
|---|---|---|---|---|---|---|
| p-Value | I2 | |||||
| Diagnostic criteria | ||||||
| AWGS 2014 | 8 | 1667 | <0.001 | 91.49% | Random | 22% (15.6–30.0%) |
| AWGS 2019 | 9 | 1839 | <0.001 | 88.67% | Random | 36.9% (30.2–44.2%) |
| EWGSOP 2010 | 17 | 2498 | <0.001 | 89.40% | Random | 24.4% (19.3–30.4%) |
| EWGSOP 2019 | 8 | 948 | <0.001 | 82.04% | Random | 24.1% (18.0–31.4%) |
| FNIH | 5 | 1095 | <0.001 | 82.04% | Random | 20% (13.8–28.0%) |
| IWGS | 1 | 186 | 1.00 | 0% | Random | 34.9% (28.4–42.1%) |
| Mixed † | 4 | 1530 | 0.243 | 28.10% | Random | 15.7% (13.6–18.1%) |
| Other ‡ | 2 | 347 | <0.001 | 94.30% | Random | 22.4% (8.5–47.3%) |
| Tools of muscle mass measurement | ||||||
| BIA | 26 | 3935 | <0.001 | 91.46% | Random | 26.2% (21.5–31.5%) |
| BIS | 4 | 1282 | 0.499 | 0% | Random | 15.2% (13.3–17.3%) |
| CC | 1 | 127 | 1.00 | 0% | Random | 26.8% (19.8–35.1%) |
| DXA | 10 | 2232 | <0.001 | 88.54% | Random | 29.2% (23.7–35.3%) |
| Dialysis modalities | ||||||
| HD | 31 | 6139 | <0.001 | 92.11% | Random | 26.8% (22.8–31.2%) |
| PD | 7 | 1267 | <0.001 | 88.69% | Random | 17.5% (11.9–24.8%) |
| Mixed | 3 | 170 | <0.001 | 88.62% | Random | 36.2% (17.2–60.8%) |
| Time of muscle mass measurement | ||||||
| Intra-HD | 6 | 635 | <0.001 | 82.52% | Random | 25.8% (18.1–35.3%) |
| Post-HD | 16 | 3967 | <0.001 | 93.97% | Random | 27.8% (22.2–34.3%) |
| Pre-HD | 5 | 2232 | 0.002 | 76.53% | Random | 21.5% (15.0–29.8%) |
| Continents | ||||||
| Asia | 21 | 3453 | <0.001 | 90.86% | Random | 27.9% (23.0–33.4%) |
| Australia | 1 | 39 | 1.00 | 0% | Random | 17.9% (8.8–33.1%) |
| Europe | 9 | 1962 | <0.001 | 92.66% | Random | 29.1% (21.5–38.0%) |
| North America | 2 | 1085 | 0.171 | 46.60% | Random | 15.4% (12.6–18.6%) |
| South America | 8 | 1037 | <0.001 | 84.51% | Random | 20.4% (14.7–27.5%) |
| Variables | No. Studies | No. Patients | Heterogeneity | Model | Meta-Analysis | ||
|---|---|---|---|---|---|---|---|
| p-Value | I2 | WMD (95%CI) | p-Value | ||||
| Age | 19 | 3504 | <0.001 | 73.80 | Random | 8.81 (7.10, 10.53) | <0.001 |
| BMI | 15 | 2523 | <0.001 | 82.66 | Random | −2.87 (−3.62, −2.12) | <0.001 |
| Dialysis vintage | 18 | 2845 | 0.329 | 10.50 | Random | 5.56 (0.88, 10.24) | 0.020 |
| Serum albumin | 19 | 3429 | 0.003 | 54.15 | Random | −0.13 (−0.18, −0.09) | <0.001 |
| Serum phosphate | 11 | 1976 | 0.063 | 43.06 | Random | −0.62 (−0.81, −0.44) | <0.001 |
| Serum PTH | 8 | 1154 | 0.038 | 52.89 | Random | −48.39 (−94.60, −2.18) | 0.040 |
| Serum creatinine | 12 | 2240 | 0.050 | 44.12 | Random | −1.63 (−1.95, −1.30) | <0.001 |
| Serum CRP | 16 | 2665 | <0.001 | 92.01 | Random | 1.307 (0.07, 2.54) | 0.038 |
| Serum 25-OH vitamin D | 6 | 642 | 0.001 | 77.24 | Random | −3.514 (−6.02, −1.01) | 0.006 |
| Hemoglobin | 13 | 2371 | <0.001 | 87.61 | Random | −0.25 (−0.50, 0.01) | 0.055 |
| Kt/V | 9 | 1508 | 0.001 | 71.09 | Random | 0.11 (0.06, 0.17) | <0.001 |
| FTI | 3 | 396 | <0.001 | 92.01 | Random | −3.51 (−6.02, −1.01) | 0.006 |
| First Author (Year of Publication) | Sarcopenia | Low Muscle Mass (LMM) | Low Muscle Strength (LMS) | Adjustment Variables | |||
|---|---|---|---|---|---|---|---|
| Unadjusted Odd Ratio (95% CI) | Adjusted Odd Ratio (95% CI) | Unadjusted Odd Ratio (95% CI) | Adjusted Odd Ratio (95% CI) | Unadjusted Odd Ratio (95% CI) | Adjusted Odd Ratio (95% CI) | ||
| All-cause mortality | |||||||
| Isoyama N. (2014) | 1.93 (1.01–3.71) | 1.23 (0.56–2.67) | 1.98 (1.01–3.87) | Age, sex, diabetes, CVD, cholesterol, Hb, GFR and hs CRP | |||
| Kittiskulnam P. (2017) | 2.46 (1.48–4.09) | 1.65 (0.88–3.08) | 2.2 (1.39–3.46) | 1.7 (0.94–3.05) | 2.42 (1.55–3.77) | 1.68 (1.01–2.79) | Age, sex, race, DM, CHF, CAD and albumin |
| Giglio J. (2018) | 2.02 (1.14–3.57) | 2.09 (1.05–4.2) | 1.49 (0.79–2.82) | 1.6 (0.73–3.53) | 2.03 (1.09–3.79) | 1.84 (0.92–3.68) | Age, gender, dialysis vintage and DM |
| Kim J. (2019) | 6.99 (1.84–26.58) | 2.77 (1.10–6.97) | 5.65 (1.99–16.04) | Age, gender, BMI, KT/V, albumin, DM, dialysis vintage, hs CRP, previous history of CAD and CVD | |||
| Mori K. (2019) | 1.31 (0.81–2.1) | Age, HD vintage, gender, BMI, DM, Hb, albumin, CRP | |||||
| Souweine J. (2021) | 3.0 (1.5–6.0) | 1.6 (0.76–3.35) | Age, sex, LTI, albumin, hs CRP, serum bicarbonates, dialysis vintage and Charlson score | ||||
| Kim C. (2021) | 2.39 (1.51–3.81) | 2.1 (1.12–8.29) | 3.61 (1.14–11.41) | Age, gender, BMI, dialysis duration, DM and albumin | |||
| Ferreira M. (2022) | 2.98 (1.44–6.13) | Age, DM, COPD, CHF, HIV infection and HCV infection | |||||
| Ishimura E. (2022) | 1.15 (0.75–1.77) | NA | |||||
| Pooled 2.79 (2.07–3.77) | Pooled 1.83 (1.40–2.39) | Pooled 1.71 (1.20–2.44) | Pooled 2.15 (1.51–3.07) | ||||
| Cardiovascular events | |||||||
| Kim J. (2019) | 4.33 (1.51–12.43) | 3.01 (1.09–8.29) | 4.09 (1.26–13.29) | Age, gender, BMI, KT/V, albumin, DM, dialysis vintage, hs CRP, previous history of CAD and CVD | |||
| Hayashi H. (2021) | 3.31 (1.12–9.76) | NA | |||||
| Pooled 3.80 (1.79–8.09) | |||||||
| Subgroup Analyses | No. of Studies | No. of Patients | Pooled Adjusted Odds Ratio (95% CI) | p-Values | Assessment of Heterogeneity | |
|---|---|---|---|---|---|---|
| I2 Index | p-Value | |||||
| Dialysis modalities | ||||||
| PD | 1 | 160 | 2.39 (1.51–3.80) | <0.001 | 0% | 1.00 |
| HD | 8 | 2152 | 1.75 (1.31–2.33) | <0.001 | 38.24% | 0.125 |
| Race | ||||||
| Asian | 4 | 918 | 1.81 (1.07–3.06) | 0.027 | 71.49% | 0.015 |
| Non-Asian | 5 | 1394 | 1.98 (1.46–2.68) | <0.001 | 0% | 0.755 |
| Time of muscle mass measurement | ||||||
| Intra-HD | 1 | 170 | 2.09 (1.05–4.18) | 0.037 | 0% | 1.00 |
| Post-HD | 7 | 2142 | 1.72 (1.25–2.38) | <0.001 | 0% | 0.755 |
| Tools of muscle mass measurement | ||||||
| DXA | 4 | 1053 | 1.43 (1.09–1.87) | 0.010 | 2.78% | 0.379 |
| BIS | 2 | 803 | 2.10 (1.45–3.04) | <0.001 | 0% | 0.351 |
| BIA | 2 | 329 | 3.00 (0.72–12.52) | 0.132 | 72.07% | 0.058 |
| CC | 1 | 127 | 2.98 (1.44–6.15) | 0.003 | 0% | 1.00 |
| Study follow-up time | ||||||
| ≤2 years | 4 | 1401 | 2.16 (1.41–3.30) | <0.001 | 33.19% | 0.213 |
| >2 years | 5 | 911 | 1.64 (1.18–2.28) | 0.003 | 39.54% | 0.158 |
| Adjusted demographic characteristics | ||||||
| Yes | 7 | NA | 1.90 (1.41, 2.56) | <0.001 | 24.04% | 0.246 |
| No | 1 | NA | 2.39 (1.51, 3.80) | <0.001 | 0% | 1.00 |
| Adjusted co-morbidities | ||||||
| Yes | 5 | NA | 2.36 (1.74, 3.21) | <0.001 | 7.26% | 0.365 |
| No | 3 | NA | 1.52 (1.08, 2.14) | 0.016 | 0% | 0.634 |
| Adjusted nutrition | ||||||
| Yes | 5 | NA | 1.74 (1.21, 2.49) | 0.003 | 28.81% | 0.23 |
| No | 3 | NA | 2.43 (1.73, 3.41) | <0.001 | 0% | 0.782 |
| Adjusted inflammatory markers | ||||||
| Yes | 4 | NA | 1.84 (1.13, 3.01) | 0.015 | 46.6% | 0.132 |
| No | 4 | NA | 2.23 (1.65, 3.00) | <0.001 | 0% | 0.654 |
| Adjusted anemia | ||||||
| Yes | 2 | NA | 1.50 (1.02, 2.20) | 0.039 | 0% | 0.346 |
| No | 6 | NA | 2.23 (1.69, 2.95) | <0.001 | 4.0% | 0.391 |
Publisher’s Note: MDPI stays neutral with regard to jurisdictional claims in published maps and institutional affiliations. |
© 2022 by the authors. Licensee MDPI, Basel, Switzerland. This article is an open access article distributed under the terms and conditions of the Creative Commons Attribution (CC BY) license (https://creativecommons.org/licenses/by/4.0/).
Share and Cite
Wathanavasin, W.; Banjongjit, A.; Avihingsanon, Y.; Praditpornsilpa, K.; Tungsanga, K.; Eiam-Ong, S.; Susantitaphong, P. Prevalence of Sarcopenia and Its Impact on Cardiovascular Events and Mortality among Dialysis Patients: A Systematic Review and Meta-Analysis. Nutrients 2022, 14, 4077. https://doi.org/10.3390/nu14194077
Wathanavasin W, Banjongjit A, Avihingsanon Y, Praditpornsilpa K, Tungsanga K, Eiam-Ong S, Susantitaphong P. Prevalence of Sarcopenia and Its Impact on Cardiovascular Events and Mortality among Dialysis Patients: A Systematic Review and Meta-Analysis. Nutrients. 2022; 14(19):4077. https://doi.org/10.3390/nu14194077
Chicago/Turabian StyleWathanavasin, Wannasit, Athiphat Banjongjit, Yingyos Avihingsanon, Kearkiat Praditpornsilpa, Kriang Tungsanga, Somchai Eiam-Ong, and Paweena Susantitaphong. 2022. "Prevalence of Sarcopenia and Its Impact on Cardiovascular Events and Mortality among Dialysis Patients: A Systematic Review and Meta-Analysis" Nutrients 14, no. 19: 4077. https://doi.org/10.3390/nu14194077
APA StyleWathanavasin, W., Banjongjit, A., Avihingsanon, Y., Praditpornsilpa, K., Tungsanga, K., Eiam-Ong, S., & Susantitaphong, P. (2022). Prevalence of Sarcopenia and Its Impact on Cardiovascular Events and Mortality among Dialysis Patients: A Systematic Review and Meta-Analysis. Nutrients, 14(19), 4077. https://doi.org/10.3390/nu14194077