Working from Home during the COVID-19 Pandemic and Its Effects on Diet, Sedentary Lifestyle, and Stress


Highlights
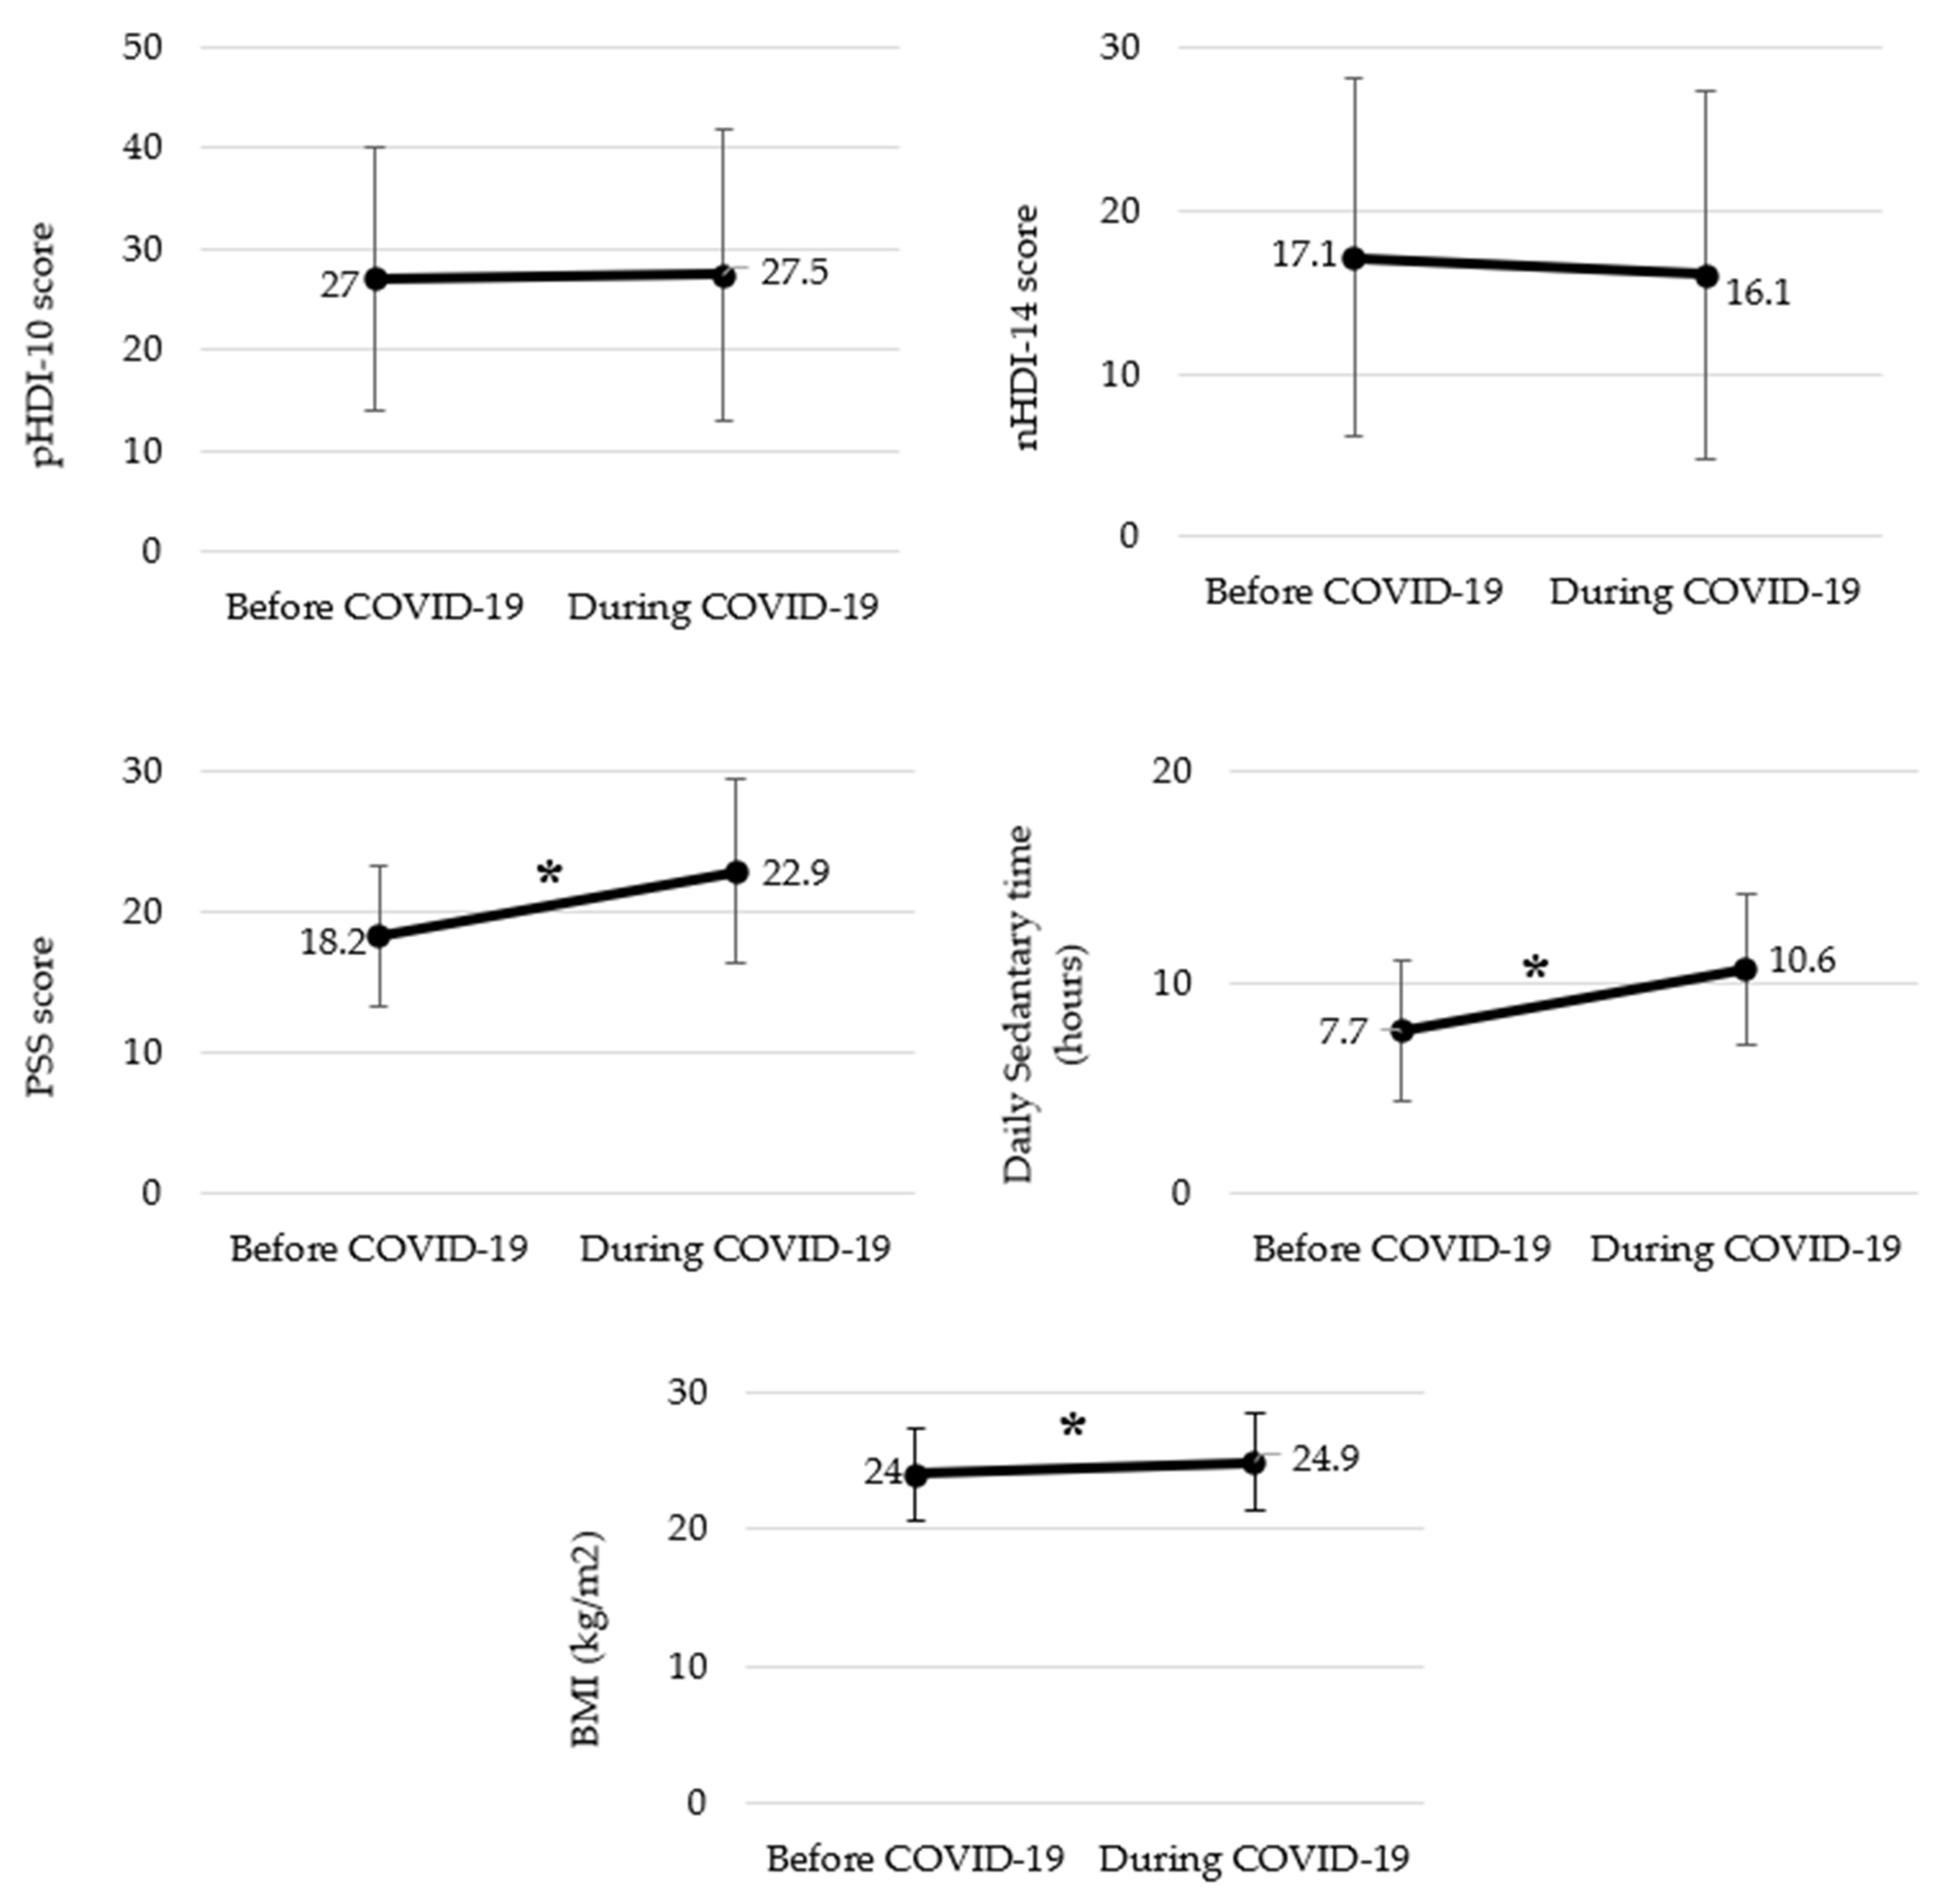
- Working from home (WFH) during COVID-19 increased sedentary behavior, stress, and snacking, with 59.1% of participants reporting weight gain.
- Weight gain was associated with unhealthy dietary patterns and prolonged sedentary time.
- The findings highlight the need for strategies to manage diet, activity levels, and stress in remote work settings.
- They provide baseline data for future research and interventions promoting healthier WFH lifestyles.
Abstract
:
1. Introduction
2. Materials and Methods
2.1. Population and Study Design
2.2. Ethical Standards Disclosure
2.3. Measures
- (1)
- Socio-demographic (sex, age, education level, occupation, married status);
- (2)
- Anthropometric characteristics (4 questions);
- (3)
- Working from home arrangements (8 questions);
- (4)
- Changes in nutritional habits and instruments (53 questions);
- (5)
- Physical activity and sedentary lifestyle changes (6 questions);
- (6)
- Stress status before and after working from home (21 questions).
2.3.1. Anthropometric Measurements
2.3.2. Working from Home Arrangements
2.3.3. Nutritional Habits and Instruments
2.3.4. Physical Activity and Sedentary Lifestyle Changes
2.3.5. Perceived Stress Scale (PSS)
2.4. Statistical Analyses
3. Results
4. Discussion
5. Conclusions
Supplementary Materials
Author Contributions
Funding
Institutional Review Board Statement
Informed Consent Statement
Data Availability Statement
Conflicts of Interest
References
- Lipsitch, M.; Swerdlow, D.L.; Finelli, L. Defining the Epidemiology of COVID-19—Studies Needed. N. Engl. J. Med. 2020, 382, 1194–1196. [Google Scholar] [CrossRef] [PubMed]
- Eurofound Living. Working and COVID-19—First Findings—April 2020; Eurofound: Dublin, Ireland, 2020. [Google Scholar]
- Hensher, D.A.; Balbontin, C.; Beck, M.J.; Wei, E. The impact of working from home on modal commuting choice response during COVID-19: Implications for two metropolitan areas in Australia. Transp. Res. Part A Policy Pract. 2021, 155, 179–201. [Google Scholar] [CrossRef]
- Ipsen, C.; Van Veldhoven, M.; Kirchner, K.; Hansen, J.P. Six Key Advantages and Disadvantages of Working from Home in Europe during COVID-19. Int. J. Environ. Res. Public Health 2021, 18, 1826. [Google Scholar] [CrossRef] [PubMed]
- Xiao, Y.; Becerik-Gerber, B.; Lucas, G.; Roll, S.C. Impacts of Working from Home during COVID-19 Pandemic on Physical and Mental Well-Being of Office Workstation Users. J. Occup. Environ. Med. 2021, 63, 181–190. [Google Scholar] [CrossRef] [PubMed]
- Di Renzo, L.; Gualtieri, P.; Cinelli, G.; Bigioni, G.; Soldati, L.; Attinà, A.; Bianco, F.F.; Caparello, G.; Camodeca, V.; Carrano, E.; et al. Psychological Aspects and Eating Habits during COVID-19 Home Confinement: Results of EHLC-COVID-19 Italian Online Survey. Nutrients 2020, 12, 2152. [Google Scholar] [CrossRef] [PubMed]
- Schnitzer, M.; Schöttl, S.; Kopp, M.; Barth, M. COVID-19 stay-at-home order in Tyrol, Austria: Sports and exercise behaviour in change? Public Health 2020, 185, 218–220. [Google Scholar] [CrossRef] [PubMed]
- Ekpanyaskul, C.; Padungtod, C. Occupational Health Problems and Lifestyle Changes among Novice Working-From-Home Workers amid the COVID-19 Pandemic. Saf. Health Work 2021, 12, 384–389. [Google Scholar] [CrossRef]
- Zachary, Z.; Brianna, F.; Brianna, L.; Garrett, P.; Jade, W.; Alyssa, D.; Mikayla, K. Self-quarantine and weight gain related risk factors during the COVID-19 pandemic. Obes. Res. Clin. Pract. 2020, 14, 210–216. [Google Scholar] [CrossRef]
- Pellegrini, M.; Ponzo, V.; Rosato, R.; Scumaci, E.; Goitre, I.; Benso, A.; Belcastro, S.; Crespi, C.; De Michieli, F.; Ghigo, E.; et al. Changes in Weight and Nutritional Habits in Adults with Obesity during the “Lockdown” Period Caused by the COVID-19 Virus Emergency. Nutrients 2020, 12, 2016. [Google Scholar] [CrossRef]
- Reyes-Olavarría, D.; Latorre-Román, P.Á.; Guzmán-Guzmán, I.P.; Jerez-Mayorga, D.; Caamaño-Navarrete, F.; Delgado-Floody, P. Positive and Negative Changes in Food Habits, Physical Activity Patterns, and Weight Status during COVID-19 Confinement: Associated Factors in the Chilean Population. Int. J. Environ. Res. Public Health 2020, 17, 5431. [Google Scholar] [CrossRef]
- Rodríguez-Pérez, C.; Molina-Montes, E.; Verardo, V.; Artacho, R.; García-Villanova, B.; Guerra-Hernández, E.J.; Ruíz-López, M.D. Changes in Dietary Behaviours during the COVID-19 Outbreak Confinement in the Spanish COVIDiet Study. Nutrients 2020, 12, 1730. [Google Scholar] [CrossRef]
- Dijksterhuis, G.B.; Van Bergen, G.; De Wijk, R.A.; Zandstra, E.H.; Kaneko, D.; Vingerhoeds, M. Exploring impact on eating behaviour, exercise and well-being during COVID-19 restrictions in the Netherlands. Appetite 2021, 168, 105720. [Google Scholar] [CrossRef]
- Vidal, L.; Brunet, G.; Curutchet, M.R.; Girona, A.; Pardiñas, V.; Guerra, D.; Platero, E.; Machado, L.; González, F.; Gugliucci, V.; et al. Is COVID-19 a threat or an opportunity for healthy eating? An exploration of the factors that moderate the impact of the pandemic on eating habits in Uruguay. Appetite 2021, 167, 105651. [Google Scholar] [CrossRef]
- Hall, G.; Laddu, D.R.; Phillips, S.A.; Lavie, C.J.; Arena, R. A Tale of Two Pandemics: How Will COVID-19 and Global Trends in Physical Inactivity and Sedentary Behavior Affect One Another? Prog. Cardiovasc. Dis. 2021, 64, 108. [Google Scholar] [CrossRef]
- Brooks, S.K.; Webster, R.K.; Smith, L.E.; Woodland, L.; Wessely, S.; Greenberg, N.; Rubin, G.J. The psychological impact of quarantine and how to reduce it: Rapid review of the evidence. Lancet 2020, 395, 912–920. [Google Scholar] [CrossRef]
- Solomou, I.; Constantinidou, F. Prevalence and Predictors of Anxiety and Depression Symptoms during the COVID-19 Pandemic and Compliance with Precautionary Measures: Age and Sex Matter. Int. J. Environ. Res. Public Health 2020, 17, 4924. [Google Scholar] [CrossRef]
- Martínez-De-Quel, Ó.; Suárez-Iglesias, D.; López-Flores, M.; Pérez, C.A. Physical activity, dietary habits and sleep quality before and during COVID-19 lockdown: A longitudinal study. Appetite 2020, 158, 105019. [Google Scholar] [CrossRef]
- Fana, M.; Torrejón Pérez, S.; Fernández-Macías, E. Employment impact of COVID-19 crisis: From short term effects to long terms prospects. J. Ind. Bus. Econ. 2020, 47, 391–410. [Google Scholar] [CrossRef]
- Ford, D.; Storey, M.-A.; Zimmermann, T.; Bird, C.; Jaffe, S.; Maddila, C.; Butler, J.L.; Houck, B.; Nagappan, N. A Tale of Two Cities: Software Developers Working from Home during the COVID-19 Pandemic. ACM Trans. Softw. Eng. Methodol. 2022, 31, 1–37. [Google Scholar] [CrossRef]
- World Health Organization. Obesity and Overweight. Available online: http://www.who.int/en/news-room/fact-sheets/detail/obesity-and-overweight (accessed on 4 May 2022).
- Gawecki, J. Dietary Habits and Nutrition Beliefs Questionnaire and the Manual for Developing Nutritional Data; Committee of Human Nutrition Science, Polish Academy of Sciences: Olsztyn, Poland, 2018. [Google Scholar]
- Ministry of Health, Republic of Turkey. Türkiye Beslenme Rehberi 2015 (TÜBER). Available online: https://hsgm.saglik.gov.tr/depo/birimler/saglikli-beslenme-hareketli-hayat-db/Yayinlar/rehberler/2015-beslenme-rehberi.pdf (accessed on 4 May 2022).
- World Health Organization. WHO Guidelines on Physical Activity and Sedentary Behaviour: At a Glance; WHO: Geneva, Switzerland, 2020. [Google Scholar]
- Cohen, S.; Kamarck, T.; Mermelstein, R. A global measure of perceived stress. J. Health Soc. Behav. 1983, 24, 385–396. [Google Scholar] [CrossRef]
- Bartik, A.; Cullen, Z.; Glaeser, E.; Luca, M.; Stanton, C. What Jobs Are Being Done at Home During the COVID-19 Crisis? Evidence from Firm-Level Surveys; National Bureau of Economic Research: Cambridge, MA, USA, 2020. [CrossRef]
- DeFilippis, E.; Impink, S.M.; Singell, M.; Polzer, J.; Sadun, R. Collaborating during Coronavirus: The Impact of COVID-19 on the Nature of Work; National Bureau of Economic Research: Cambridge, MA, USA, 2020. [Google Scholar]
- Poelman, M.P.; Gillebaart, M.; Schlinkert, C.; Dijkstra, S.C.; Derksen, E.; Mensink, F.; Hermans, R.C.; Aardening, P.; De Ridder, D.; De Vet, E. Eating behavior and food purchases during the COVID-19 lockdown: A cross-sectional study among adults in the Netherlands. Appetite 2020, 157, 105002. [Google Scholar] [CrossRef] [PubMed]
- Molina-Montes, E.; Uzhova, I.; Verardo, V.; Artacho, R.; García-Villanova, B.; Guerra-Hernández, E.J.; Kapsokefalou, M.; Malisova, O.; Vlassopoulos, A.; Katidi, A.; et al. Impact of COVID-19 confinement on eating behaviours across 16 European countries: The COVIDiet cross-national study. Food Qual. Prefer. 2021, 93, 104231. [Google Scholar] [CrossRef]
- Błaszczyk-Bębenek, E.; Jagielski, P.; Bolesławska, I.; Jagielska, A.; Nitsch-Osuch, A.; Kawalec, P. Nutrition Behaviors in Polish Adults before and during COVID-19 Lockdown. Nutrients 2020, 12, 3084. [Google Scholar] [CrossRef] [PubMed]
- Elmacıoğlu, F.; Emiroğlu, E.; Ülker, M.T.; Kırcali, B.; Oruç, S. Evaluation of nutritional behaviour related to COVID-19. Public Health Nutr. 2020, 24, 512–518. [Google Scholar] [CrossRef]
- Urhan, M.; Aysin, E.O. Nutritional and health behaviour predictors of the weight gain during the COVID-19 pandemic. Eur. J. Nutr. 2022, 61, 2993–3002. [Google Scholar] [CrossRef]
- Sidor, A.; Rzymski, P. Dietary Choices and Habits during COVID-19 Lockdown: Experience from Poland. Nutrients 2020, 12, 1657. [Google Scholar] [CrossRef]
- Kriaucioniene, V.; Bagdonaviciene, L.; Rodríguez-Pérez, C.; Petkeviciene, J. Associations between Changes in Health Behaviours and Body Weight during the COVID-19 Quarantine in Lithuania: The Lithuanian COVIDiet Study. Nutrients 2020, 12, 3119. [Google Scholar] [CrossRef]
- Robinson, E.; Boyland, E.; Chisholm, A.; Harrold, J.; Maloney, N.G.; Marty, L.; Mead, B.R.; Noonan, R.; Hardman, C.A. Obesity, eating behavior and physical activity during COVID-19 lockdown: A study of UK adults. Appetite 2020, 156, 104853. [Google Scholar] [CrossRef]
- Sánchez, E.; Lecube, A.; Bellido, D.; Monereo, S.; Malagón, M.M.; Tinahones, J.F. Leading Factors for Weight Gain during COVID-19 Lockdown in a Spanish Population: A Cross-Sectional Study. Nutrients 2021, 13, 894. [Google Scholar] [CrossRef]
- Drieskens, S.; Berger, N.; Vandevijvere, S.; Gisle, L.; Braekman, E.; Charafeddine, R.; De Ridder, K.; Demarest, S. Short-term impact of the COVID-19 confinement measures on health behaviours and weight gain among adults in Belgium. Arch. Public Health 2021, 79, 22. [Google Scholar] [CrossRef]
- Turkey Nutrition and Health Survey (TNHS) 2017, General Directorate of Public Health, Ministry of Health, Republic of Turkey, Ankara. Available online: https://hsgm.saglik.gov.tr/depo/birimler/saglikli-beslenme-hareketli-hayat-db/TBSA_RAPOR_KITAP_2017_ENG_.pdf (accessed on 3 May 2022).
- Tokgozoglu, L.; Kayikcioglu, M.; Ekinci, B. The landscape of preventive cardiology in Turkey: Challenges and successes. Am. J. Prev. Cardiol. 2021, 6, 100184. [Google Scholar] [CrossRef]
- Di Renzo, L.; Gualtieri, P.; Pivari, F.; Soldati, L.; Attinà, A.; Cinelli, G.; Leggeri, C.; Caparello, G.; Barrea, L.; Scerbo, F.; et al. Eating habits and lifestyle changes during COVID-19 lockdown: An Italian survey. J. Transl. Med. 2020, 18, 229. [Google Scholar] [CrossRef]
- Riet, J.V.; Sijtsema, S.J.; Dagevos, H.; De Bruijn, G.-J. The importance of habits in eating behaviour. An overview and recommendations for future research. Appetite 2011, 57, 585–596. [Google Scholar] [CrossRef]
- Verhoeven, A.A.C.; Adriaanse, M.A.; Evers, C.; De Ridder, D.T.D. The power of habits: Unhealthy snacking behaviour is primarily predicted by habit strength. Br. J. Health Psychol. 2012, 17, 758–770. [Google Scholar] [CrossRef]
- Tribst, A.A.L.; Tramontt, C.R.; Baraldi, L.G. Factors associated with diet changes during the COVID-19 pandemic period in Brazilian adults: Time, skills, habits, feelings and beliefs. Appetite 2021, 163, 105220. [Google Scholar] [CrossRef]
- Deschasaux-Tanguy, M.; Druesne-Pecollo, N.; Esseddik, Y.; De Edelenyi, F.S.; Allès, B.; Andreeva, V.A.; Baudry, J.; Charreire, H.; Deschamps, V.; Egnell, M.; et al. Diet and physical activity during the coronavirus disease 2019 (COVID-19) lockdown (March–May 2020): Results from the French NutriNet-Santé cohort study. Am. J. Clin. Nutr. 2021, 113, 924–938. [Google Scholar] [CrossRef]
- Stockwell, S.; Trott, M.; Tully, M.; Shin, J.; Barnett, Y.; Butler, L.; McDermott, D.; Schuch, F.; Smith, L. Changes in physical activity and sedentary behaviours from before to during the COVID-19 pandemic lockdown: A systematic review. BMJ Open Sport Exerc. Med. 2021, 7, e000960. [Google Scholar] [CrossRef]
- Mattioli, A.V.; Sciomer, S.; Cocchi, C.; Maffei, S.; Gallina, S. Quarantine during COVID-19 outbreak: Changes in diet and physical activity increase the risk of cardiovascular disease. Nutr. Metab. Cardiovasc. Dis. 2020, 30, 1409–1417. [Google Scholar] [CrossRef]
- Robertson, M.; Duffy, F.; Newman, E.; Bravo, C.P.; Ates, H.H.; Sharpe, H. Exploring changes in body image, eating and exercise during the COVID-19 lockdown: A UK survey. Appetite 2020, 159, 105062. [Google Scholar] [CrossRef]
- Werneck, A.O.; Silva, D.R.; Malta, D.C.; Gomes, C.S.; Souza-Júnior, P.R.; Azevedo, L.O.; Barros, M.B.; Szwarcwald, C.L. Associations of sedentary behaviours and incidence of unhealthy diet during the COVID-19 quarantine in Brazil. Public Health Nutr. 2020, 24, 422–426. [Google Scholar] [CrossRef]
- El Ansari, W.; Adetunji, H.; Oskrochi, R. Food and Mental Health: Relationship between Food and Perceived Stress and Depressive Symptoms among University Students in the United Kingdom. Central Eur. J. Public Health 2014, 22, 90–97. [Google Scholar] [CrossRef]
- Ingram, J.; Maciejewski, G.; Hand, C.J. Changes in Diet, Sleep, and Physical Activity Are Associated With Differences in Negative Mood during COVID-19 Lockdown. Front. Psychol. 2020, 11, 588604. [Google Scholar] [CrossRef]

| Characteristics | Frequency (n) | Percentage (%) |
|---|---|---|
| Gender | ||
| Female | 260 | 79.3 |
| Male | 68 | 20.7 |
| Age (mean ± SD) (year) | 31.3 ± 8.3 | |
| Marital status | ||
| Married | 141 | 43.0 |
| Single | 187 | 57.0 |
| Child under care | ||
| Yes | 97 | 29.6 |
| No | 231 | 70.4 |
| Occupational group | ||
| Teaching | 107 | 32.6 |
| Architecture and engineering | 58 | 17.7 |
| Business and financial operations | 55 | 16.8 |
| Arts, design, and media | 23 | 7.0 |
| Management | 11 | 3.4 |
| Psychologist | 10 | 3.0 |
| Others | 64 | 19.5 |
| Work shift | ||
| Stable | 106 | 32.3 |
| Increased | 151 | 46.0 |
| Decreased | 71 | 21.6 |
| Weight (kg) | 69.7 ± 15.1 | |
| Height (m) | 167.1 ± 7.8 | |
| BMI (mean ± SD) (kg/m2) | 24.9 ± 4.6 | |
| Underweight | 18 | 5.5 |
| Normal | 157 | 47.9 |
| Overweight | 109 | 33.2 |
| Obese | 44 | 13,4 |
| Weight status | ||
| Stable | 61 | 18.6 |
| Lost weight | 64 | 19.5 |
| Gained weight | 194 | 59.1 |
| Do not know | 9 | 2.7 |
| Weight Gain (n = 194) | Weight Loss (n = 64) | p-Value | |
|---|---|---|---|
| During the COVID-19 Pandemic | |||
| Average weight change (kg) | 5 (2–30) | 5 (1–45) | 0.927 |
| BMI (kg/m2) | 25.70 (17.6–40.5) | 22.80 (16.6–31.6) | p < 0.001 * |
| pHDI-10 score | 24.75 (1.80–100) | 22.30 (0–66.70) | 0.452 |
| nHDI-14 score | 17.07 (0.43–85.71) | 7.89 (0–35.14) | p < 0.001 * |
| PSS score | 23 (7–40) | 23 (1–38) | 0.416 |
| Daily sedentary time (hours) | 10 (2–24) | 9 (2–20) | 0.028 * |
| During the COVID-19 Pandemic | Weight Loss (n = 64) | Weight Gain (n = 194) | Weight Stable (n = 61) | p-Value |
|---|---|---|---|---|
| n (%) | n (%) | n (%) | ||
| Gender | ||||
| Female | 52 (81.3) | 148 (76.3) | 51 (83.6) | 0.407 |
| Male | 12 (18.8) | 46 (23.7) | 10 (19.1) | |
| Age group | ||||
| 19–39 | 53 (82.8) | 164 (84.5) | 50 (82) | 0.873 |
| 40–63 | 11 (17.2) | 30 (15.5) | 11 (18) | |
| Marital status | ||||
| Single | 41 (64.1) | 115 (59.3) | 29 (47.5) | 0.147 |
| Married | 23 (35.9) | 79 (40.7) | 32 (52.5) | |
| Child | ||||
| No | 46 (71.9) | 135 (69.6) | 46 (75.4) | 0.675 |
| Yes | 18 (28.1) | 59 (30.4) | 15 (24.6) | |
| Work shift | ||||
| Stable | 15 (23.5) | 73 (37.6) | 18 (29.5) | 0.259 |
| Decreased | 17 (26.6) | 36(18.6) | 14 (23) | |
| Increased | 32 (50) | 85 (43.8) | 29 (47.5) | |
| BMI | ||||
| Underweight | 6 (9.4) | 3 (1.5) | 9 (14.8) | p < 0.001 * |
| Normal | 38 (59.4) | 79 (40.7) | 35 (57.4) | |
| Overweight | 17 (26.6) | 78 (40.2) | 12 (19.7) | |
| Obese | 3 (4.7) | 34 (17.5) | 5 (8.2) | |
| Changes in pHDI-10 score | ||||
| Decreased | 22 (34.4) | 83 (42.8) | 32 (52.5) | 0.338 |
| Increased | 37 (57.8) | 100 (51.5) | 25 (41) | |
| Stable | 5 (7.8) | 11 (5.7) | 4 (6.6) | |
| Changes in nHDI-14 score | ||||
| Decreased | 53 (82.8) | 79 (40.7) | 33 (54.1) | p < 0.001 * |
| Increased | 10 (15.6) | 113 (58.2) | 27 (44.3) | |
| Stable | 1 (1.6) | 2 (1) | 1 (1.6) | |
| Changes in PSS score | ||||
| Decreased | 14 (21.9) | 29 (14.9) | 7 (11.5) | 0.461 |
| Increased | 44 (68.8) | 142 (73.2) | 49 (80.3) | |
| Stable | 6 (9.4) | 23 (11.9) | 5 (8.2) | |
| Changes in daily sedentary time | ||||
| Decreased | 16 (25) | 14 (7.2) | 4 (11.8) | p < 0.001 * |
| Increased | 42 (65.6) | 162 (83.5) | 42 (68.9) | |
| Stable | 6 (9.4) | 18 (9.3) | 15 (24.6) | |
| Physical activity | ||||
| No-physical activity | 25 (39.1) | 126 (64.9) | 31 (50.8) | p < 0.001 * |
| Physically active | 39 (60.9) | 68 (35.1) | 30 (49.2) |
| Weight Gain during WFH | |||||
|---|---|---|---|---|---|
| β | OR | p-Value | Lower 95% CI | Upper 95% CI | |
| Sex (ref.: male) | |||||
| Female | −0.124 | 0.883 | 0.803 | 0.332 | 2.349 |
| Age (ref.: 40–63) | |||||
| 19–39 | 0.494 | 1.639 | 0.792 | 0.042 | 64.047 |
| Marital status (ref.: married) | |||||
| Single | −0.465 | 0.628 | 0.376 | 0.224 | 1.758 |
| Child (ref.: yes) | |||||
| No | 0.408 | 1.504 | 0.542 | 0.406 | 5.569 |
| Work shift (ref.: increased) | |||||
| Stable | 0.875 | 2.398 | 0.046 * | 1.017 | 5.657 |
| Decreased | 0.026 | 1.026 | 0.955 | 0.420 | 2.508 |
| BMI (ref.: BMI obese) | |||||
| Underweight | −4.676 | 0.009 | <0.001 * | 0.001 | 0.084 |
| Normal | −2.162 | 0.115 | 0.005 * | 0.026 | 0.517 |
| Overweight | −1.431 | 0.239 | 0.062 | 0.053 | 1.073 |
| Changes in pHDI-10 score (ref.: stable) | |||||
| Decreased | 0.870 | 2.387 | 0.226 | 0.584 | 9.758 |
| Increased | 0.305 | 1.357 | 0.661 | 0.346 | 5.311 |
| Changes in nHDI-14 score (ref.: stable) | |||||
| Decreased | 0.511 | 1.667 | 0.722 | 0.100 | 27.673 |
| Increased | 2.658 | 14.274 | 0.070 | 0.804 | 253.436 |
| Changes in PSS score (ref.: stable) | |||||
| Decreased | −0.140 | 0.869 | 0.841 | 0.222 | 3.405 |
| Increased | −0.230 | 0.795 | 0.694 | 0.253 | 2.493 |
| Changes in daily sedentary time (ref.: stable) | |||||
| Decreased | −0.846 | 0.429 | 0.246 | 0.103 | 1.791 |
| Increased | 0.655 | 1.925 | 0.274 | 0.595 | 6.231 |
| Physical activity (ref.: physical activity) | |||||
| Not physically active | 0.822 | 2.276 | 0.022 * | 1.124 | 4.609 |
| Weight Stable during WFH | |||||
| β | OR | p-Value | Lower 95% CI | Upper 95% CI | |
| Sex (ref.: male) | |||||
| Female | 0.266 | 1.305 | 0.669 | 0.385 | 4.425 |
| Age (ref.: 40–63) | |||||
| 19–39 | 0.258 | 1.295 | 0.900 | 0.023 | 71.750 |
| Marital status (ref.: married) | |||||
| Single | −1.440 | 0.237 | 0.010 * | 0.079 | 0.709 |
| Child (ref.: yes) | |||||
| No | 1.243 | 3.466 | 0.100 | 0.787 | 15.271 |
| Work shift (ref.: increased) | |||||
| Stable | 0.415 | 1.515 | 0.414 | 0.559 | 4.104 |
| Decreased | 0.253 | 1.287 | 0.620 | 0.474 | 3.499 |
| BMI (ref.: BMI obese) | |||||
| Underweight | −0.957 | 0.384 | 0.372 | 0.047 | 3.141 |
| Normal | −0.915 | 0.401 | 0.303 | 0.070 | 2.285 |
| Overweight | −1.517 | 0.219 | 0.097 | 0.037 | 1.317 |
| Changes in pHDI-10 score (ref.: stable) | |||||
| Decreased | 0.647 | 1.910 | 0.430 | 0.383 | 9.538 |
| Increased | −0.059 | 0.943 | 0.942 | 0.196 | 4.529 |
| Changes in nHDI-14 score (ref.: stable) | |||||
| Decreased | −0.265 | 0.767 | 0.866 | 0.035 | 16.707 |
| Increased | 1.175 | 3.239 | 0.463 | 0.140 | 74.810 |
| Changes in PSS score (ref.: stable) | |||||
| Decreased | 0.154 | 1.166 | 0.858 | 0.216 | 6.312 |
| Increased | 0.843 | 2.324 | 0.256 | 0.542 | 9.969 |
| Changes in daily sedentary time (ref.: stable) | |||||
| Decreased | −2.143 | 0.117 | 0.009 * | 0.024 | 0.583 |
| Increased | −1.102 | 0.332 | 0.072 | 0.100 | 1.103 |
| Physical activity (ref.: physical activity) | |||||
| Not physically active | 0.292 | 1.339 | 0.479 | 0.597 | 3.006 |
| No Physical Activity (n = 188) | Physically Active (n = 140) | p-Value | |
|---|---|---|---|
| During COVID-19 Pandemic | |||
| BMI (kg/m2) | 25.35 (16.6–40.5) | 23.30 (16.4–46.9) | 0.009 * |
| pHDI-10 score | 23.10 (1.80–75) | 28.85 (0–100) | p < 0.001 * |
| nHDI-14 score | 15.21 (1.93–75) | 12.17 (0–85.71) | 0.006 * |
| PSS score | 23 (1–40) | 22.5 (7–40) | 0.469 |
| Daily sedentary time (hours) | 10 (2–24) | 10 (2–22) | 0.435 |
Publisher’s Note: MDPI stays neutral with regard to jurisdictional claims in published maps and institutional affiliations. |
© 2022 by the authors. Licensee MDPI, Basel, Switzerland. This article is an open access article distributed under the terms and conditions of the Creative Commons Attribution (CC BY) license (https://creativecommons.org/licenses/by/4.0/).
Share and Cite
Coşkun, M.G.; Öztürk, R.İ.; Tak, A.Y.; Sanlier, N. Working from Home during the COVID-19 Pandemic and Its Effects on Diet, Sedentary Lifestyle, and Stress. Nutrients 2022, 14, 4006. https://doi.org/10.3390/nu14194006
Coşkun MG, Öztürk Rİ, Tak AY, Sanlier N. Working from Home during the COVID-19 Pandemic and Its Effects on Diet, Sedentary Lifestyle, and Stress. Nutrients. 2022; 14(19):4006. https://doi.org/10.3390/nu14194006
Chicago/Turabian StyleCoşkun, Merve Güney, Rabia İclal Öztürk, Ayşegül Yabacı Tak, and Nevin Sanlier. 2022. "Working from Home during the COVID-19 Pandemic and Its Effects on Diet, Sedentary Lifestyle, and Stress" Nutrients 14, no. 19: 4006. https://doi.org/10.3390/nu14194006
APA StyleCoşkun, M. G., Öztürk, R. İ., Tak, A. Y., & Sanlier, N. (2022). Working from Home during the COVID-19 Pandemic and Its Effects on Diet, Sedentary Lifestyle, and Stress. Nutrients, 14(19), 4006. https://doi.org/10.3390/nu14194006