
Do Individuals Use Nutrition Labels on Food Packages to Make Healthy Choices? Testing the Dual-Process Model in Two Laboratory-Based Experiments


Abstract
:1. Introduction
2. Experiment 1
2.1. Method
2.1.1. Participants
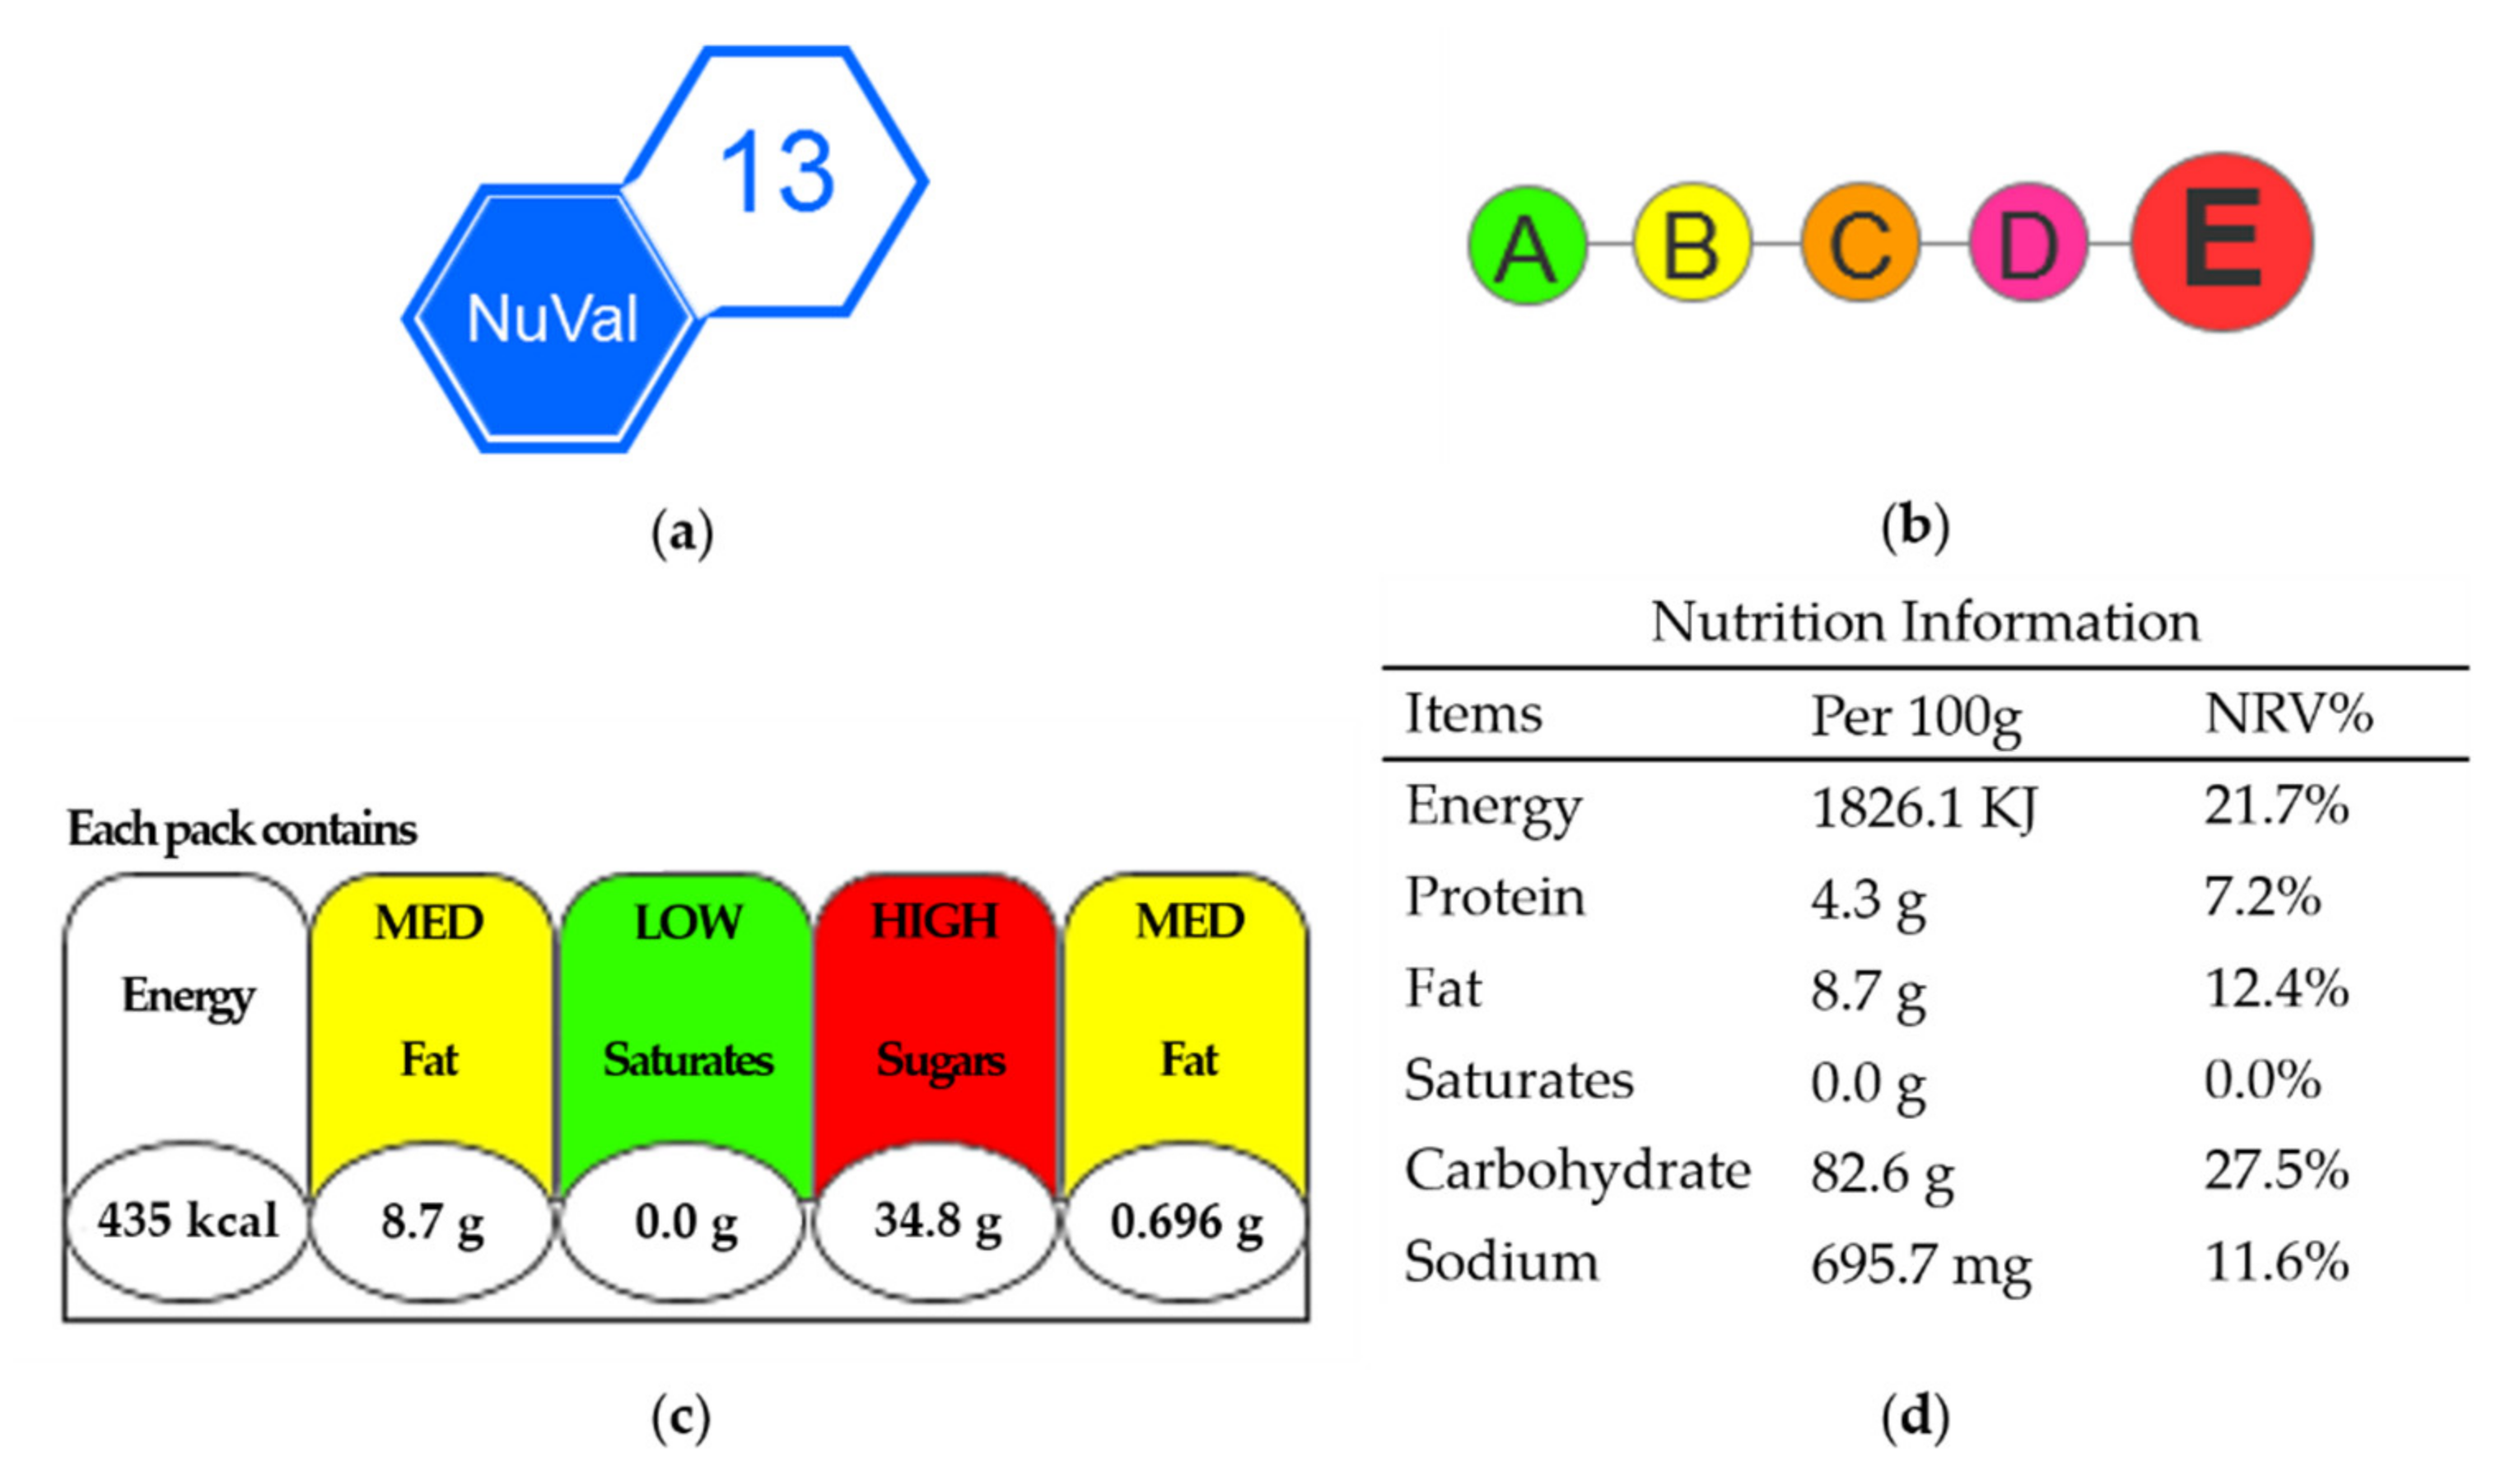
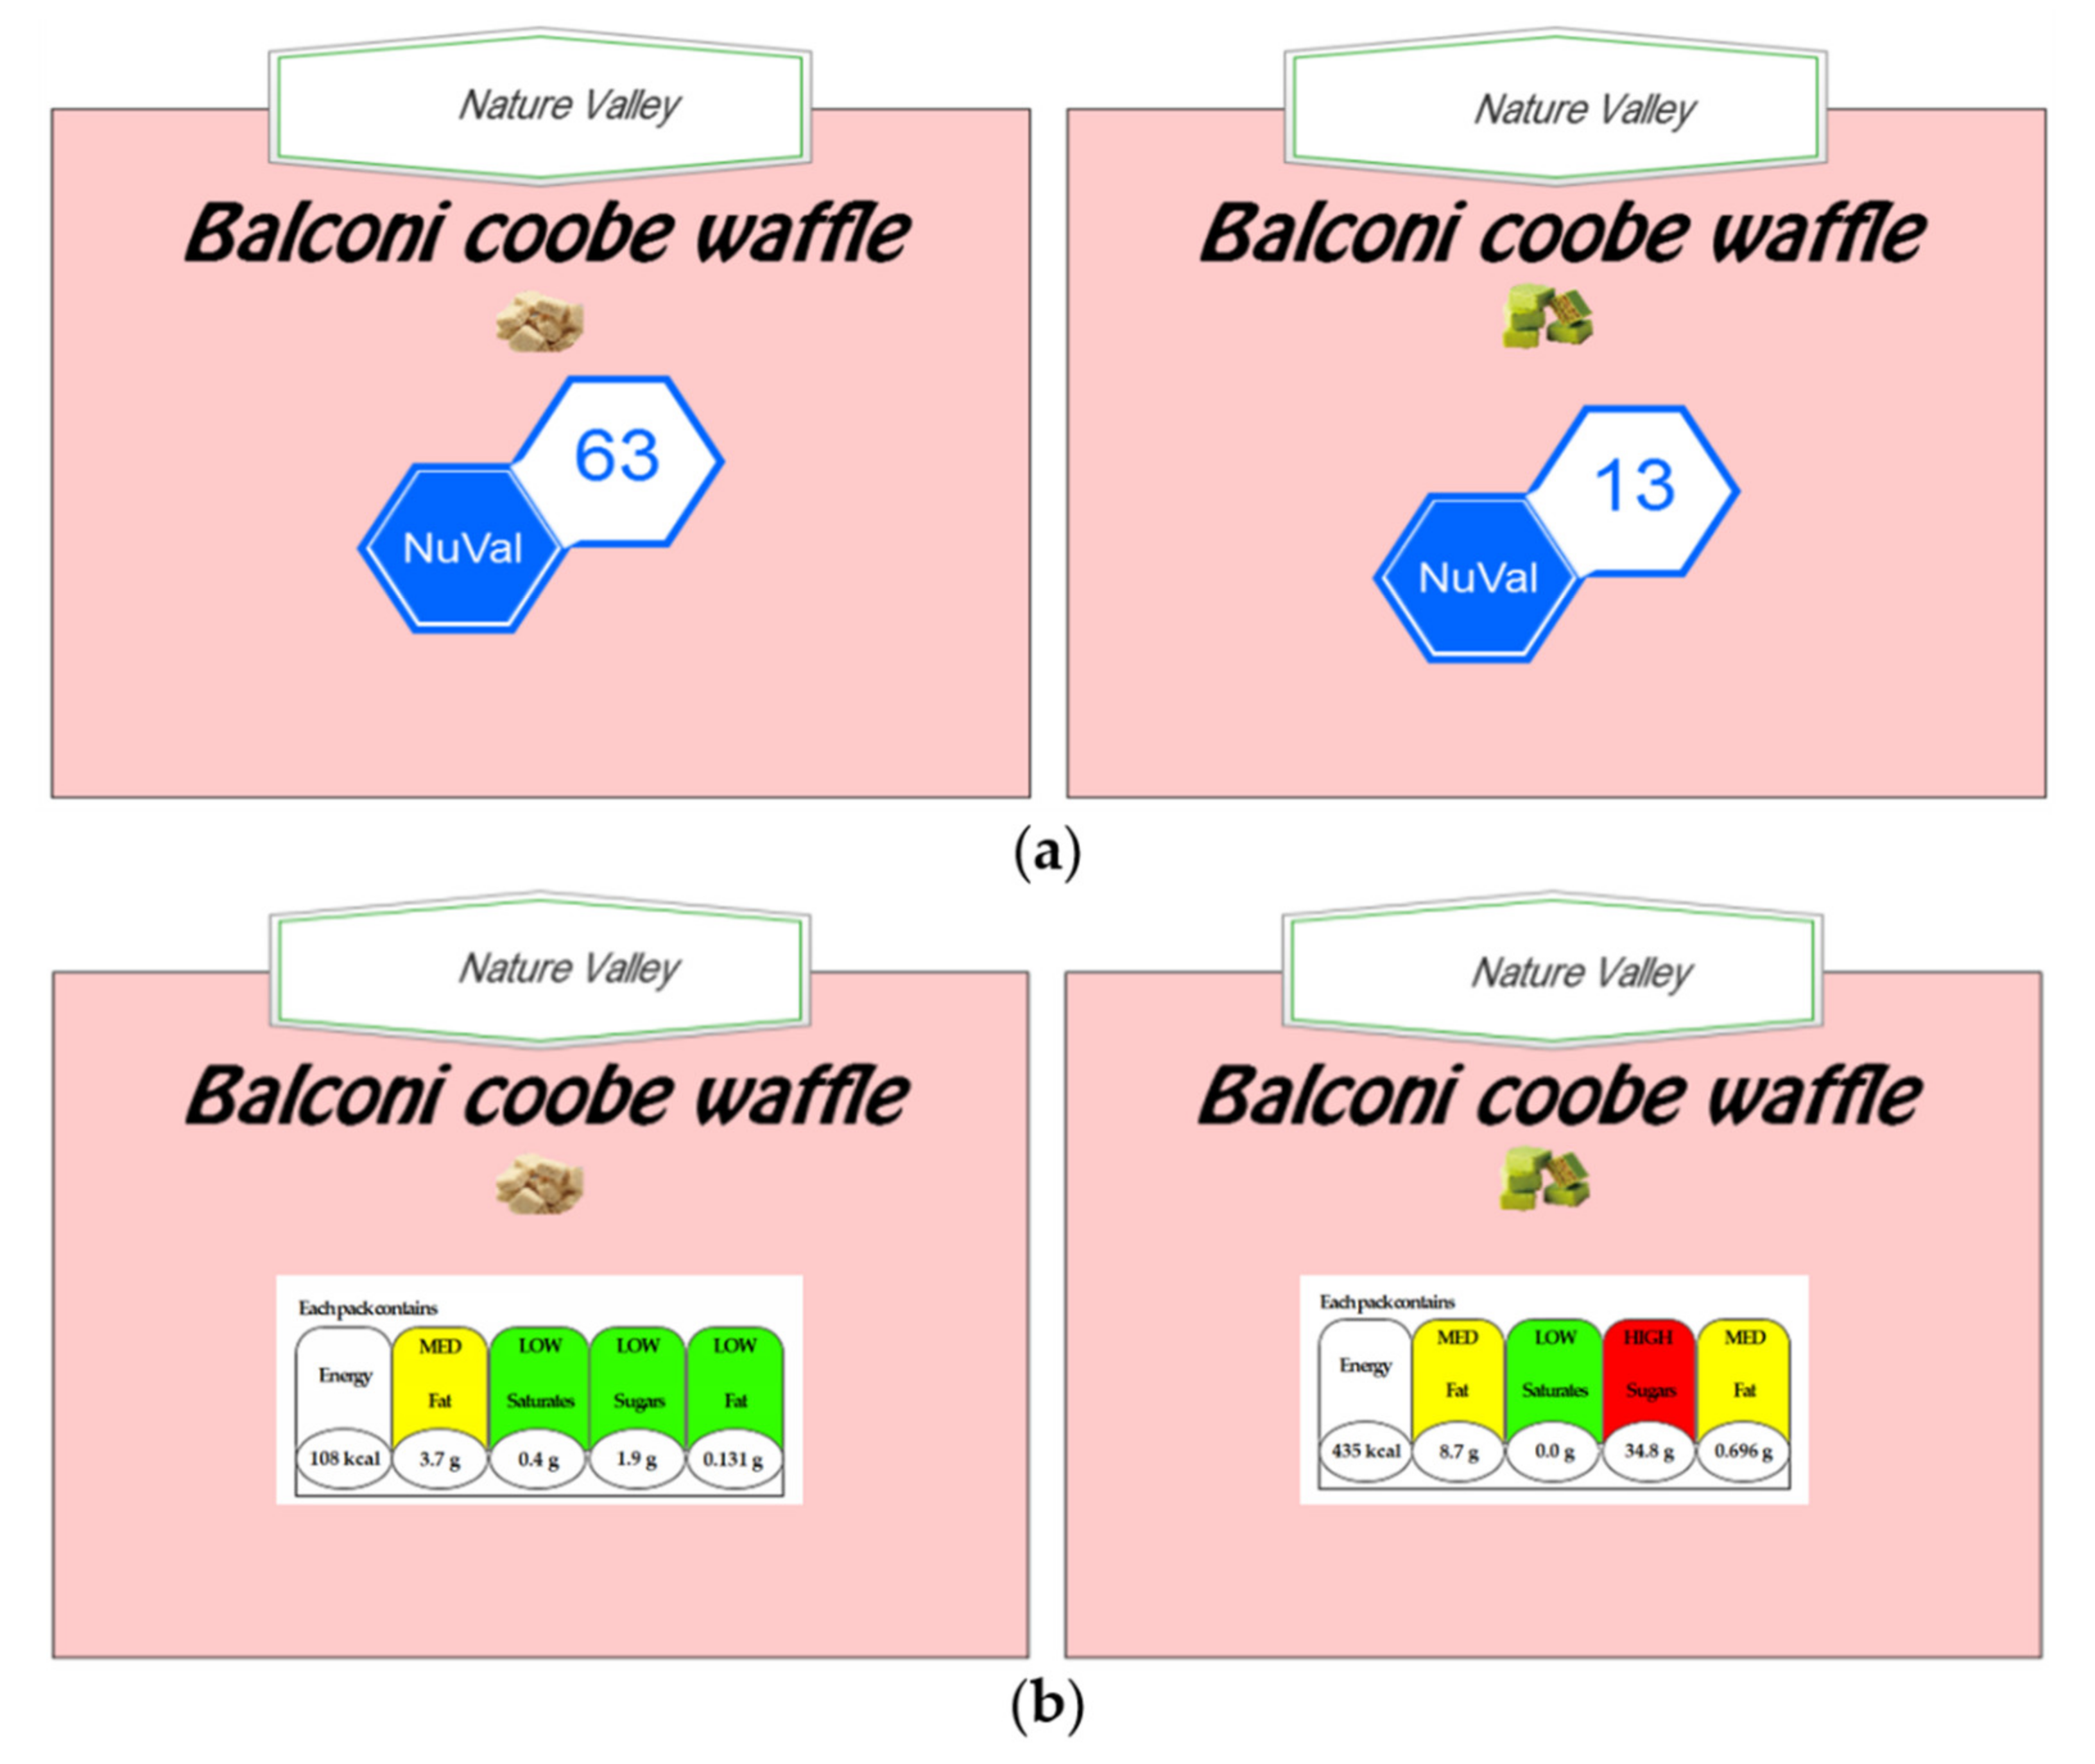
2.1.2. Materials
2.1.3. Design
2.1.4. Procedure
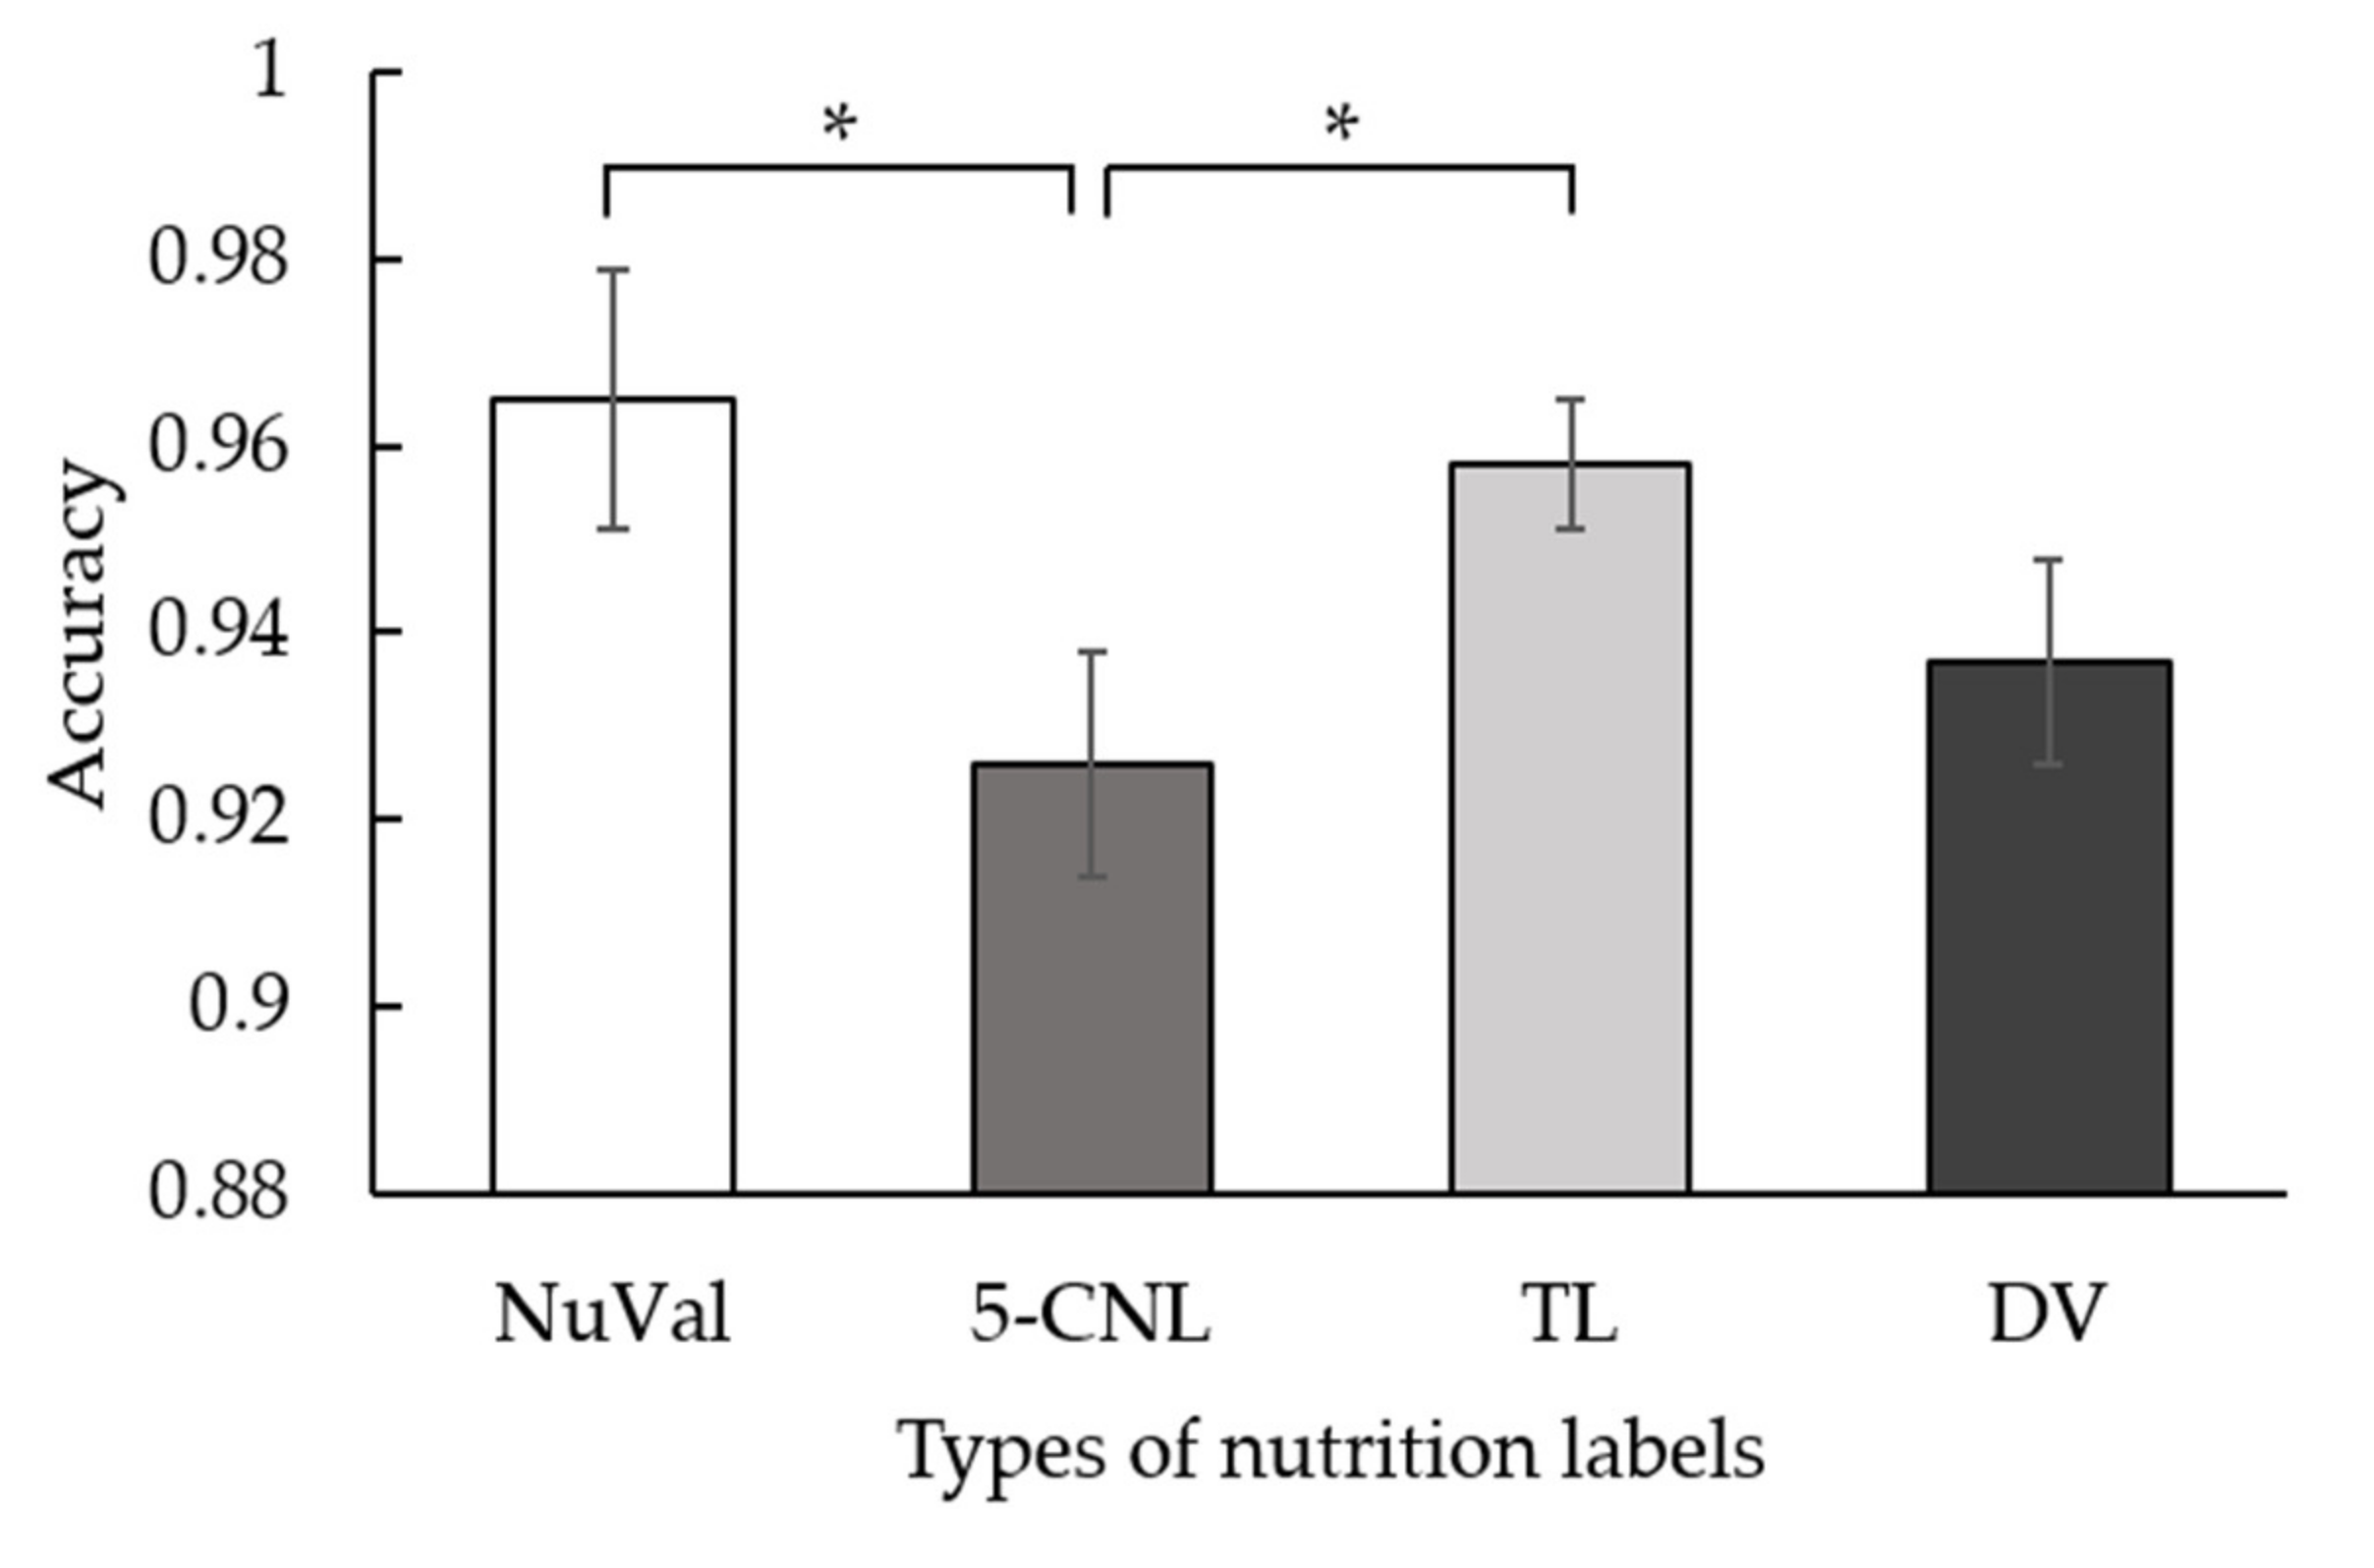
2.2. Results
2.3. Discussion
3. Experiment 2
3.1. Method
3.1.1. Participants
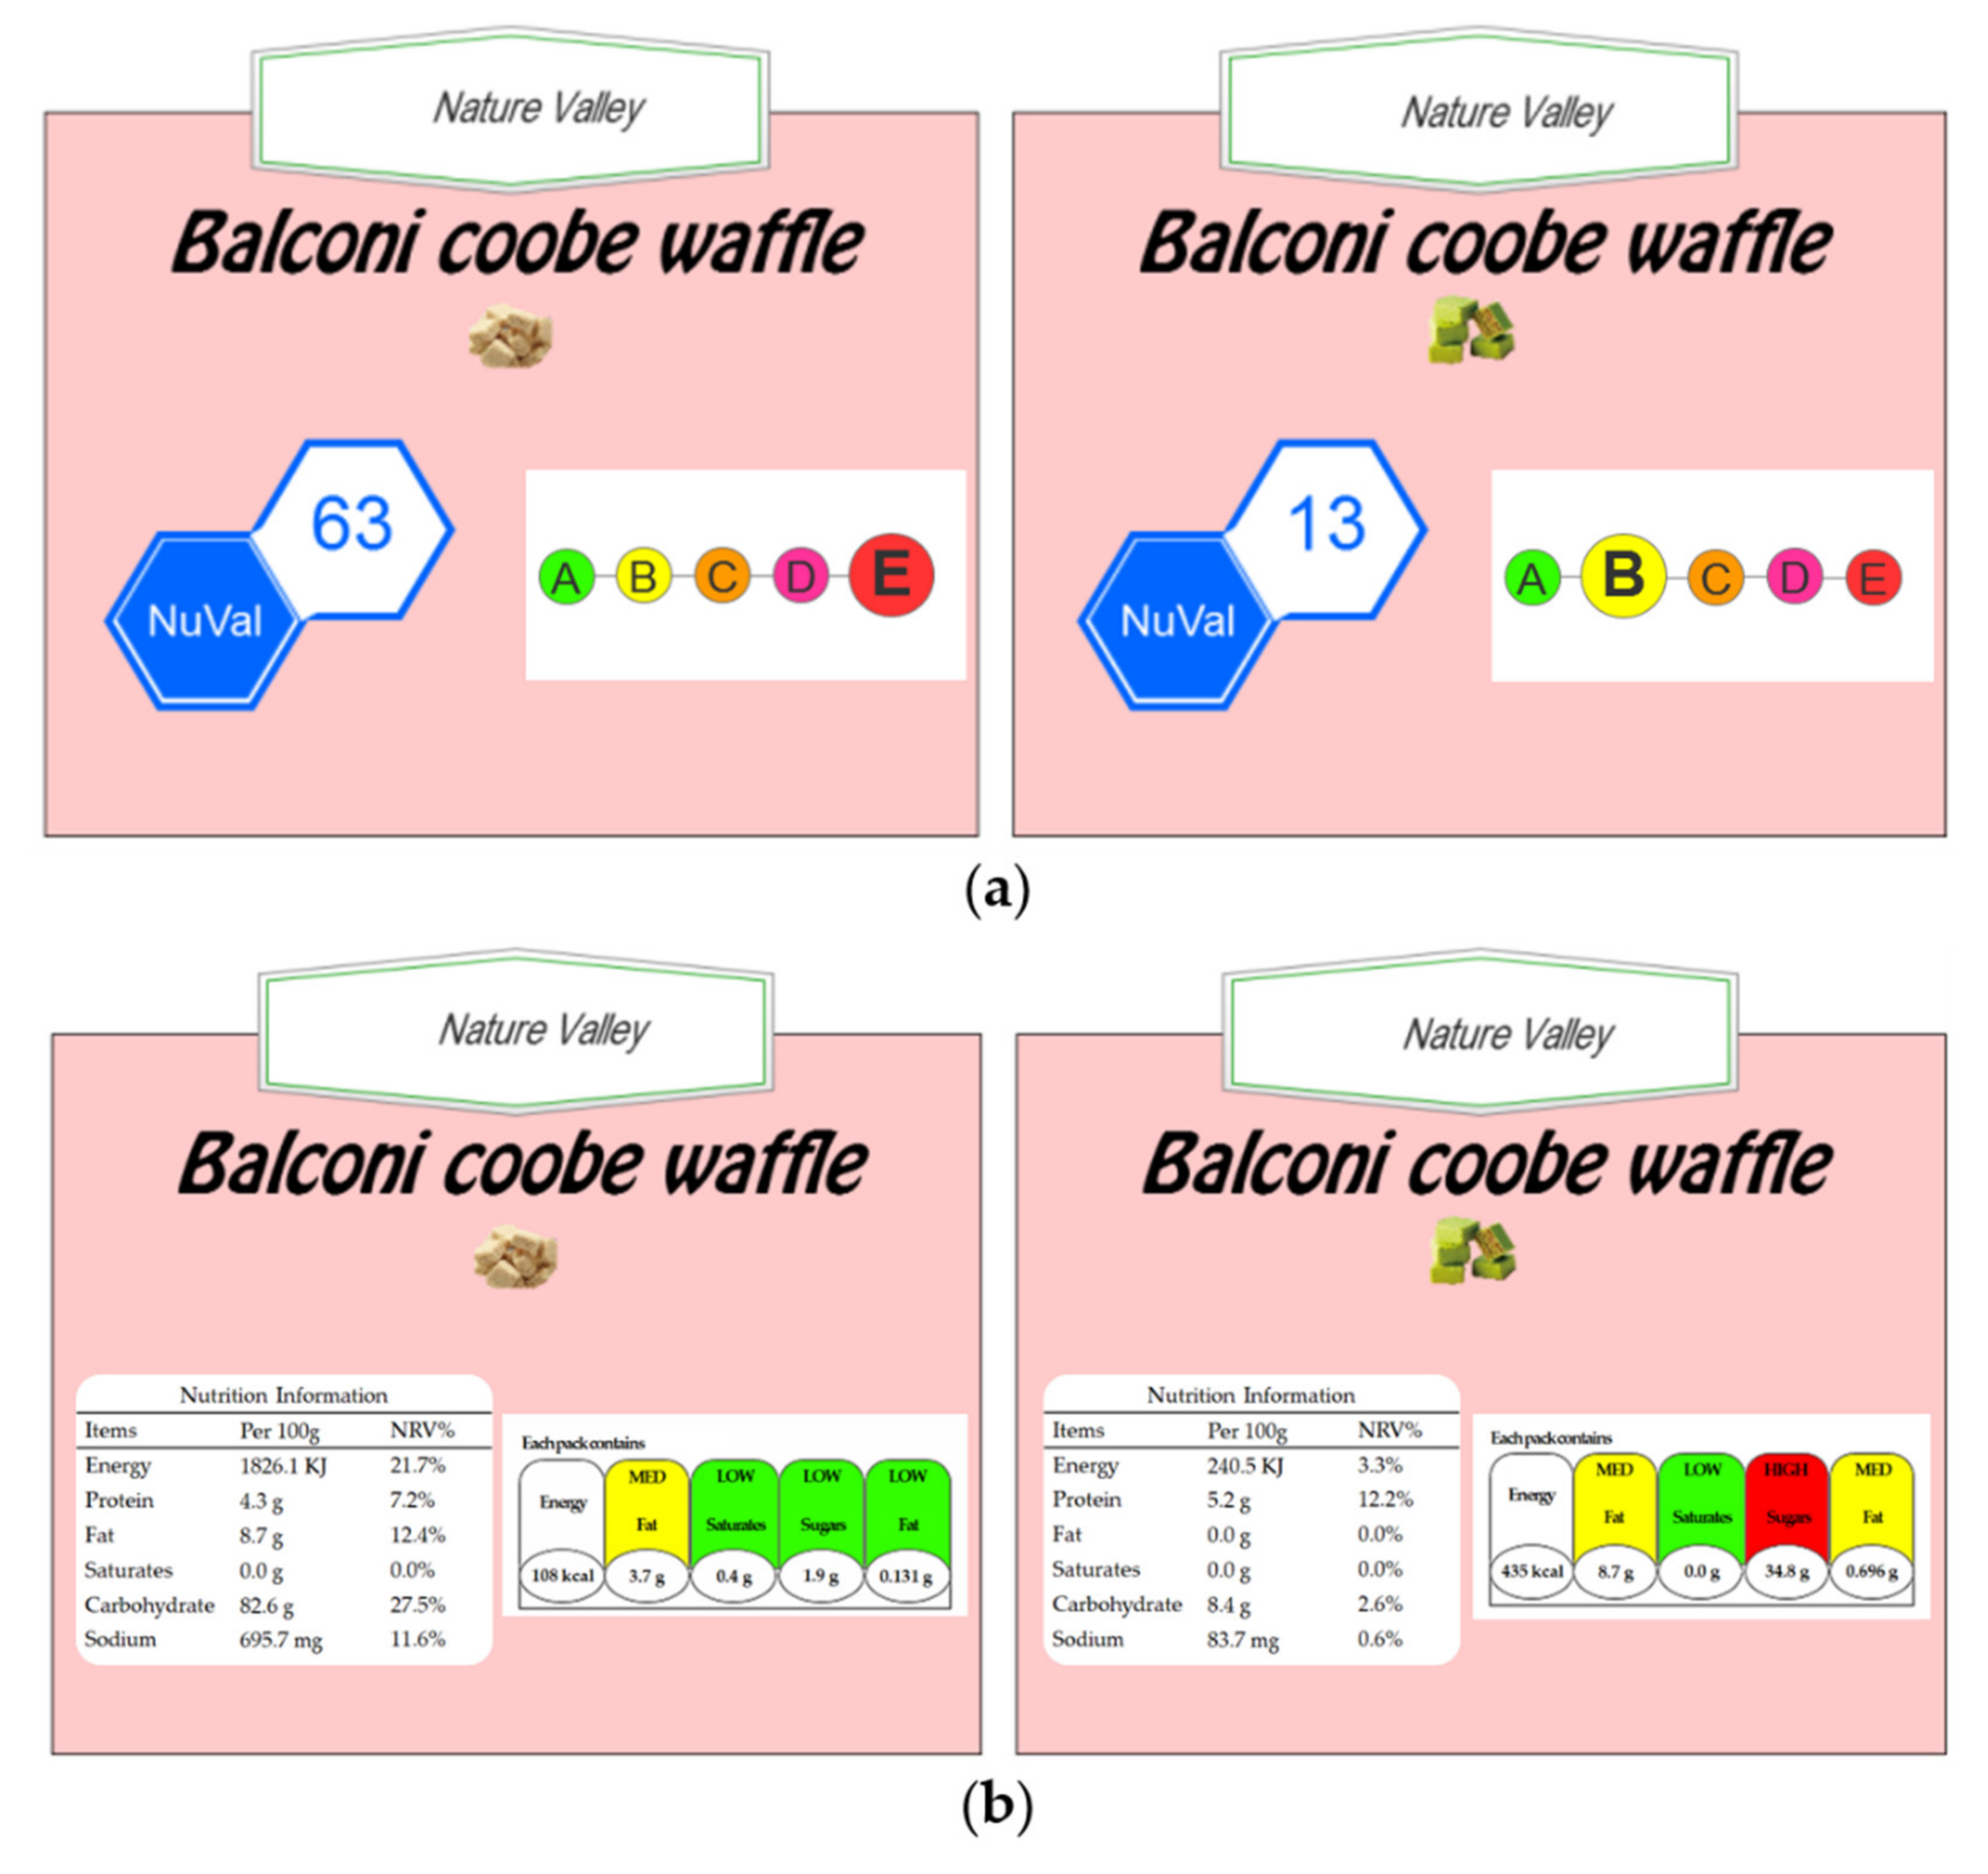
3.1.2. Materials and Design
3.1.3. Design and Procedure
3.2. Results
3.3. Discussion
4. General Discussion
5. Conclusions and Limitations
Author Contributions
Funding
Institutional Review Board Statement
Informed Consent Statement
Data Availability Statement
Conflicts of Interest
References
- Fenko, A. Influencing healthy food choice through multisensory packaging design. In Multisensory Packaging; Springer: Berlin/Heidelberg, Germany, 2019; pp. 225–255. [Google Scholar]
- Gong, Y.; Li, J.; Xie, J.; Tan, Y. Relationship between types of food choice motives and well-being among young and middle-aged Chinese adults. Int. J. Consum. Stud. 2020, 44, 369–378. [Google Scholar] [CrossRef]
- Plichta, M.; Jezewska-Zychowicz, M.; Małachowska, A. Relationship between psychosocial impairment, food choice motives, and Orthorexic behaviors among polish adults. Nutrients 2020, 12, 1218. [Google Scholar] [CrossRef] [PubMed]
- Ballco, P.; Caputo, V.; de-Magistris, T. Consumer valuation of European nutritional and health claims: Do taste and attention matter? Food Qual. Prefer. 2020, 79, 103793. [Google Scholar] [CrossRef]
- Song, Y.; Qin, Z.; Yuan, Q. The Impact of Eco-Label on the Young Chinese Generation: The Mediation Role of Environmental Awareness and Product Attributes in Green Purchase. Sustainability 2019, 11, 973. [Google Scholar] [CrossRef]
- Song, Y.; Qin, Z.; Qin, Z. Green Marketing to Gen Z Consumers in China: Examining the Mediating Factors of an Eco-Label–Informed Purchase. SAGE Open 2020, 10, 215824402096357. [Google Scholar] [CrossRef]
- Hersey, J.C.; Wohlgenant, K.C.; Arsenault, J.E.; Kosa, K.M.; Muth, M.K. Effects of front-of-package and shelf nutrition labeling systems on consumers. Nutr. Rev. 2013, 71, 1–14. [Google Scholar] [CrossRef]
- Ducrot, P.; Julia, C.; Méjean, C.; Kesse-Guyot, E.; Touvier, M.; Fezeu, L.K.; Hercberg, S.; Péneau, S. Impact of different front-of-pack nutrition labels on consumer purchasing intentions: A randomized controlled trial. Am. J. Prev. Med. 2016, 50, 627–636. [Google Scholar] [CrossRef]
- Hodgkins, C.; Barnett, J.; Wasowicz-Kirylo, G.; Stysko-Kunkowska, M.; Gulcan, Y.; Kustepeli, Y.; Akgungor, S.; Chryssochoidis, G.; Fernández-Celemin, L.; Storcksdieck Genannt Bonsmann, S.; et al. Understanding how consumers categorise nutritional labels: A consumer derived typology for front-of-pack nutrition labelling. Appetite 2012, 59, 806–817. [Google Scholar] [CrossRef]
- Feunekes, G.I.; Gortemaker, I.A.; Willems, A.A.; Lion, R.; Van Den Kommer, M. Front-of-pack nutrition labelling: Testing effectiveness of different nutrition labelling formats front-of-pack in four European countries. Appetite 2008, 50, 57–70. [Google Scholar] [CrossRef]
- Ma, G.; Zhuang, X. Nutrition label processing in the past 10 years: Contributions from eye tracking approach. Appetite 2021, 156, 104859. [Google Scholar] [CrossRef]
- Andrews, J.C.; Burton, S.; Kees, J. Is simpler always better? Consumer evaluations of front-of-package nutrition symbols. J. Public Policy Mark. 2011, 30, 175–190. [Google Scholar] [CrossRef]
- Basil, M.; Basil, D.; Deshpande, S.; Lavack, A.M. Applying the extended parallel process model to workplace safety messages. Health Commun. 2013, 28, 29–39. [Google Scholar] [CrossRef]
- Drichoutis, A.C.; Lazaridis, P.; Nayga, R.M. Nutrition knowledge and consumer use of nutritional food labels. Eur. Rev. Agric. Econ. 2005, 32, 93–118. [Google Scholar] [CrossRef]
- Helfer, P.; Shultz, T.R. The effects of nutrition labeling on consumer food choice: A psychological experiment and computational model. Ann. N. Y. Acad. Sci. 2014, 1331, 174–185. [Google Scholar] [CrossRef]
- Kurtzman, E.T.; Greene, J. Effective presentation of health care performance information for consumer decision making: A systematic review. Patient Educ. Couns. 2016, 99, 36–43. [Google Scholar] [CrossRef]
- Talati, Z.; Egnell, M.; Hercberg, S.; Julia, C.; Pettigrew, S. Consumers’ perceptions of five front-of-package nutrition labels: An experimental study across 12 countries. Nutrients 2019, 11, 1934. [Google Scholar] [CrossRef]
- Food Standards Agency. Guide to Creating a Front of Pack (Fop) Nutrition Label for Pre-Packed Products Sold Through Retail Outlets. 2016, Nov. Available online: https://www.food.gov.uk/business-guidance/nutrition-labelling (accessed on 24 June 2022).
- Aguenaou, H.; El Ammari, L.; Bigdeli, M.; El Hajjab, A.; Lahmam, H.; Labzizi, S.; Gamih, H.; Talouizte, A.; Serbouti, C.; El Kari, K. Comparison of appropriateness of Nutri-Score and other front-of-pack nutrition labels across a group of Moroccan consumers: Awareness, understanding and food choices. Arch. Public Health 2021, 79, 1–13. [Google Scholar] [CrossRef]
- Bossuyt, S.; Custers, K.; Tummers, J.; Verbeyst, L.; Oben, B. Nutri-Score and Nutrition Facts Panel through the Eyes of the Consumer: Correct Healthfulness Estimations Depend on Transparent Labels, Fixation Duration, and Product Equivocality. Nutrients 2021, 13, 2915. [Google Scholar] [CrossRef]
- Fialon, M.; Egnell, M.; Talati, Z.; Galan, P.; Dréano-Trécant, L.; Touvier, M.; Pettigrew, S.; Hercberg, S.; Julia, C. Effectiveness of different front-of-pack nutrition labels among Italian consumers: Results from an online randomized controlled trial. Nutrients 2020, 12, 2307. [Google Scholar] [CrossRef]
- Talati, Z.; Norman, R.; Pettigrew, S.; Neal, B.; Kelly, B.; Dixon, H.; Ball, K.; Miller, C.; Shilton, T. The impact of interpretive and reductive front-of-pack labels on food choice and willingness to pay. Int. J. Behav. Nutr. Phys. Act. 2017, 14, 171. [Google Scholar] [CrossRef] [Green Version]
- Kelly, B.; Hughes, C.; Chapman, K.; Louie, J.C.-Y.; Dixon, H.; Crawford, J.; King, L.; Daube, M.; Slevin, T. Consumer testing of the acceptability and effectiveness of front-of-pack food labelling systems for the Australian grocery market. Health Promot. Int. 2009, 24, 120–129. [Google Scholar] [CrossRef] [PubMed]
- Koenigstorfer, J.; Wąsowicz-Kiryło, G.; Styśko-Kunkowska, M.; Groeppel-Klein, A. Behavioural effects of directive cues on front-of-package nutrition information: The combination matters! Public Health Nutr. 2014, 17, 2115–2121. [Google Scholar] [CrossRef] [PubMed]
- Siegrist, M.; Leins-Hess, R.; Keller, C. Which front-of-pack nutrition label is the most efficient one? The results of an eye-tracker study. Food Qual. Prefer. 2015, 39, 183–190. [Google Scholar] [CrossRef]
- Frankish, K. Dual-process and dual-system theories of reasoning. Philos. Compass 2010, 5, 914–926. [Google Scholar] [CrossRef]
- Sanjari, S.; Jahn, S.; Boztug, Y. One Label Does Not Fit All: Toward an Integrative Framework of Consumer Response to Front-of-Package Nutrition Label Formats. In Nutrition Reviews; Forthcoming; Elsevier: Amsterdam, The Netherlands, 2017; pp. 1–34. [Google Scholar]
- Gillard, E.; Van Dooren, W.; Schaeken, W.; Verschaffel, L. Proportional reasoning as a heuristic-based process: Time constraint and dual task considerations. Exp. Psychol. 2009, 56, 92. [Google Scholar] [CrossRef]
- Kahneman, D. A psychological point of view: Violations of rational rules as a diagnostic of mental processes. Behav. Brain Sci. 2000, 23, 681–683. [Google Scholar] [CrossRef]
- Dijksterhuis, A. Think different: The merits of unconscious thought in preference development and decision making. J. Pers. Soc. Psychol. 2004, 87, 586. [Google Scholar] [CrossRef]
- Dijksterhuis, A.; Nordgren, L.F. A theory of unconscious thought. Perspect. Psychol. Sci. 2006, 1, 95–109. [Google Scholar] [CrossRef]
- Dijksterhuis, A.; Van Olden, Z. On the benefits of thinking unconsciously: Unconscious thought can increase post-choice satisfaction. J. Exp. Soc. Psychol. 2006, 42, 627–631. [Google Scholar] [CrossRef]
- Liu, R.; Hoefkens, C.; Verbeke, W. Chinese consumers’ understanding and use of a food nutrition label and their determinants. Food Qual. Prefer. 2015, 41, 103–111. [Google Scholar] [CrossRef]
- Huang, Z.; Li, H.; Huang, J. Determinants of Nutrition Facts Table Use by Chinese Consumers for Nutritional Value Comparisons. Int. J. Environ. Res. Public. Health 2022, 19, 673. [Google Scholar] [CrossRef]
- Song, J.; Huang, J.; Chen, Y.; Zhu, Y.; Li, H.; Wen, Y.; Yuan, H.; Liang, Y. The understanding, attitude and use of nutrition label among consumers (China). Nutr. Hosp. 2015, 31, 2703–2710. [Google Scholar]
- Faul, F.; Erdfelder, E.; Lang, A.-G.; Buchner, A.G. Power 3: A flexible statistical power analysis program for the social, behavioral, and biomedical sciences. Behav. Res. Methods 2007, 39, 175–191. [Google Scholar] [CrossRef]
- Julia, C.; Etilé, F.; Hercberg, S. Front-of-pack Nutri-Score labelling in France: An evidence-based policy. Lancet Public Health 2018, 3, e164. [Google Scholar] [CrossRef]
- Check the Label. Available online: https://www.food.gov.uk/safety-hygiene/check-the-label (accessed on 22 June 2022).
- Wartella, E.A.; Lichtenstein, A.H.; Yaktine, A.; Nathan, R. Committee on Examination of Front.-of-Package Nutrition Rating Systems and Symbols (Phase II) Front.-of-Package Nutrition Rating Systems and Symbols: Promoting Healthier Choices; The National Academies Press: Washington, DC, USA, 2011. [Google Scholar]
- Kliemann, N.; Wardle, J.; Johnson, F.; Croker, H. Reliability and validity of a revised version of the General Nutrition Knowledge Questionnaire. Eur. J. Clin. Nutr. 2016, 70, 1174–1180. [Google Scholar] [CrossRef]
- Mayer, R.E.; Johnson, C.I. Revising the redundancy principle in multimedia learning. J. Educ. Psychol. 2008, 100, 380. [Google Scholar] [CrossRef]
- Lu, S.A.; Wickens, C.D.; Sarter, N.B.; Sebok, A. Informing the design of multimodal displays: A meta-analysis of empirical studies comparing auditory and tactile interruptions. In Proceedings of the Human Factors and Ergonomics Society Annual Meeting; SAGE Publications Sage CA: Los Angeles, CA, USA, 2011; Volume 55, pp. 1170–1174. [Google Scholar]
- Laughery, K.R.; Wogalter, M.S. A three-stage model summarizes product warning and environmental sign research. Risk Commun. Warn. 2014, 61, 3–10. [Google Scholar] [CrossRef]
- Haas, E.C.; Van Erp, J.B. Multimodal warnings to enhance risk communication and safety. Saf. Sci. 2014, 61, 29–35. [Google Scholar] [CrossRef]
- Van Herpen, E.; Van Trijp, H.C. Front-of-pack nutrition labels. Their effect on attention and choices when consumers have varying goals and time constraints. Appetite 2011, 57, 148–160. [Google Scholar] [CrossRef]
- Antúnez, L.; Giménez, A.; Maiche, A.; Ares, G. Influence of interpretation aids on attentional capture, visual processing, and understanding of front-of-package nutrition labels. J. Nutr. Educ. Behav. 2015, 47, 292–299. [Google Scholar] [CrossRef]
- Antúnez, L.; Vidal, L.; Sapolinski, A.; Giménez, A.; Maiche, A.; Ares, G. How do design features influence consumer attention when looking for nutritional information on food labels? Results from an eye-tracking study on pan bread labels. Int. J. Food Sci. Nutr. 2013, 64, 515–527. [Google Scholar] [CrossRef] [PubMed]
- Zhang, X.; Liu, Y.; Gu, Y.; Wang, S.; Chen, H. Red for “stop”:“Traffic-light” nutrition labels decrease unhealthy food choices by increasing activity and connectivity in the frontal lobe. Nutrients 2020, 12, 128. [Google Scholar] [CrossRef]
- Aschemann-Witzel, J.; Grunert, K.G.; van Trijp, H.C.; Bialkova, S.; Raats, M.M.; Hodgkins, C.; Wasowicz-Kirylo, G.; Koenigstorfer, J. Effects of nutrition label format and product assortment on the healthfulness of food choice. Appetite 2013, 71, 63–74. [Google Scholar] [CrossRef]
- Chalamon, I.; Nabec, L. Why do we read on-pack nutrition information so differently? A typology of reading heuristics based on food consumption goals. J. Consum. Aff. 2016, 50, 403–429. [Google Scholar] [CrossRef]
- Bialkova, S.; Grunert, K.G.; Juhl, H.J.; Wasowicz-Kirylo, G.; Stysko-Kunkowska, M.; van Trijp, H.C. Attention mediates the effect of nutrition label information on consumers’ choice. Evidence from a choice experiment involving eye-tracking. Appetite 2014, 76, 66–75. [Google Scholar] [CrossRef]
- Jones, G.; Richardson, M. An objective examination of consumer perception of nutrition information based on healthiness ratings and eye movements. Public Health Nutr. 2007, 10, 238–244. [Google Scholar] [CrossRef]
- Clement, J. Visual influence on in-store buying decisions: An eye-track experiment on the visual influence of packaging design. J. Mark. Manag. 2007, 23, 917–928. [Google Scholar] [CrossRef]
- Wedel, M.; Pieters, R. A review of eye-tracking research in marketing. In Review of Marketing Research; Malhotra, N.K., Ed.; Emerald Group Publishing Limited: Bingley, UK, 2008; Volume 4, pp. 123–147. [Google Scholar]
- Alonso-Dos-Santos, M.; Quilodrán Ulloa, R.; Salgado Quintana, A.; Vigueras Quijada, D.; Farias Nazel, P. Nutrition labeling schemes and the time and effort of consumer processing. Sustainability 2019, 11, 1079. [Google Scholar] [CrossRef]
- Grebitus, C.; Davis, G.C. Does the new nutrition facts panel help compensate for low numeracy skills? An eye-tracking analysis. Agric. Econ. 2019, 50, 249–258. [Google Scholar] [CrossRef]
- Grebitus, C.; Davis, G.C. Change is good! Analyzing the relationship between attention and nutrition facts panel modifications. Food Policy 2017, 73, 119–130. [Google Scholar] [CrossRef]
- Ares, G.; Varela, F.; Machin, L.; Antúnez, L.; Giménez, A.; Curutchet, M.R.; Aschemann-Witzel, J. Comparative performance of three interpretative front-of-pack nutrition labelling schemes: Insights for policy making. Food Qual. Prefer. 2018, 68, 215–225. [Google Scholar] [CrossRef]
- Gabor, A.M.; Stojnić, B.; Ostić, D.B. Effects of different nutrition labels on visual attention and accuracy of nutritional quality perception–Results of an experimental eye-tracking study. Food Qual. Prefer. 2020, 84, 103948. [Google Scholar] [CrossRef]
- Fenko, A.; Nicolaas, I.; Galetzka, M. Does attention to health labels predict a healthy food choice? An eye-tracking study. Food Qual. Prefer. 2018, 69, 57–65. [Google Scholar] [CrossRef]


| Measurements | Label | Without Time Constraints | With Time Constraints | ||||
|---|---|---|---|---|---|---|---|
| Mean | SD | 95% CI | Mean | SD | 95% CI | ||
| Accuracy | NuVal | 0.98 | 0.01 | [0.96, 1.00] | 0.95 | 0.02 | [0.92, 0.99] |
| 5-CNL | 0.96 | 0.01 | [0.94, 0.98] | 0.89 | 0.02 | [0.85, 0.93] | |
| TL | 0.98 | 0.01 | [0.97, 0.99] | 0.94 | 0.01 | [0.92, 0.96] | |
| DV | 0.98 | 0.01 | [0.96, 0.99] | 0.90 | 0.02 | [0.86, 0.94] | |
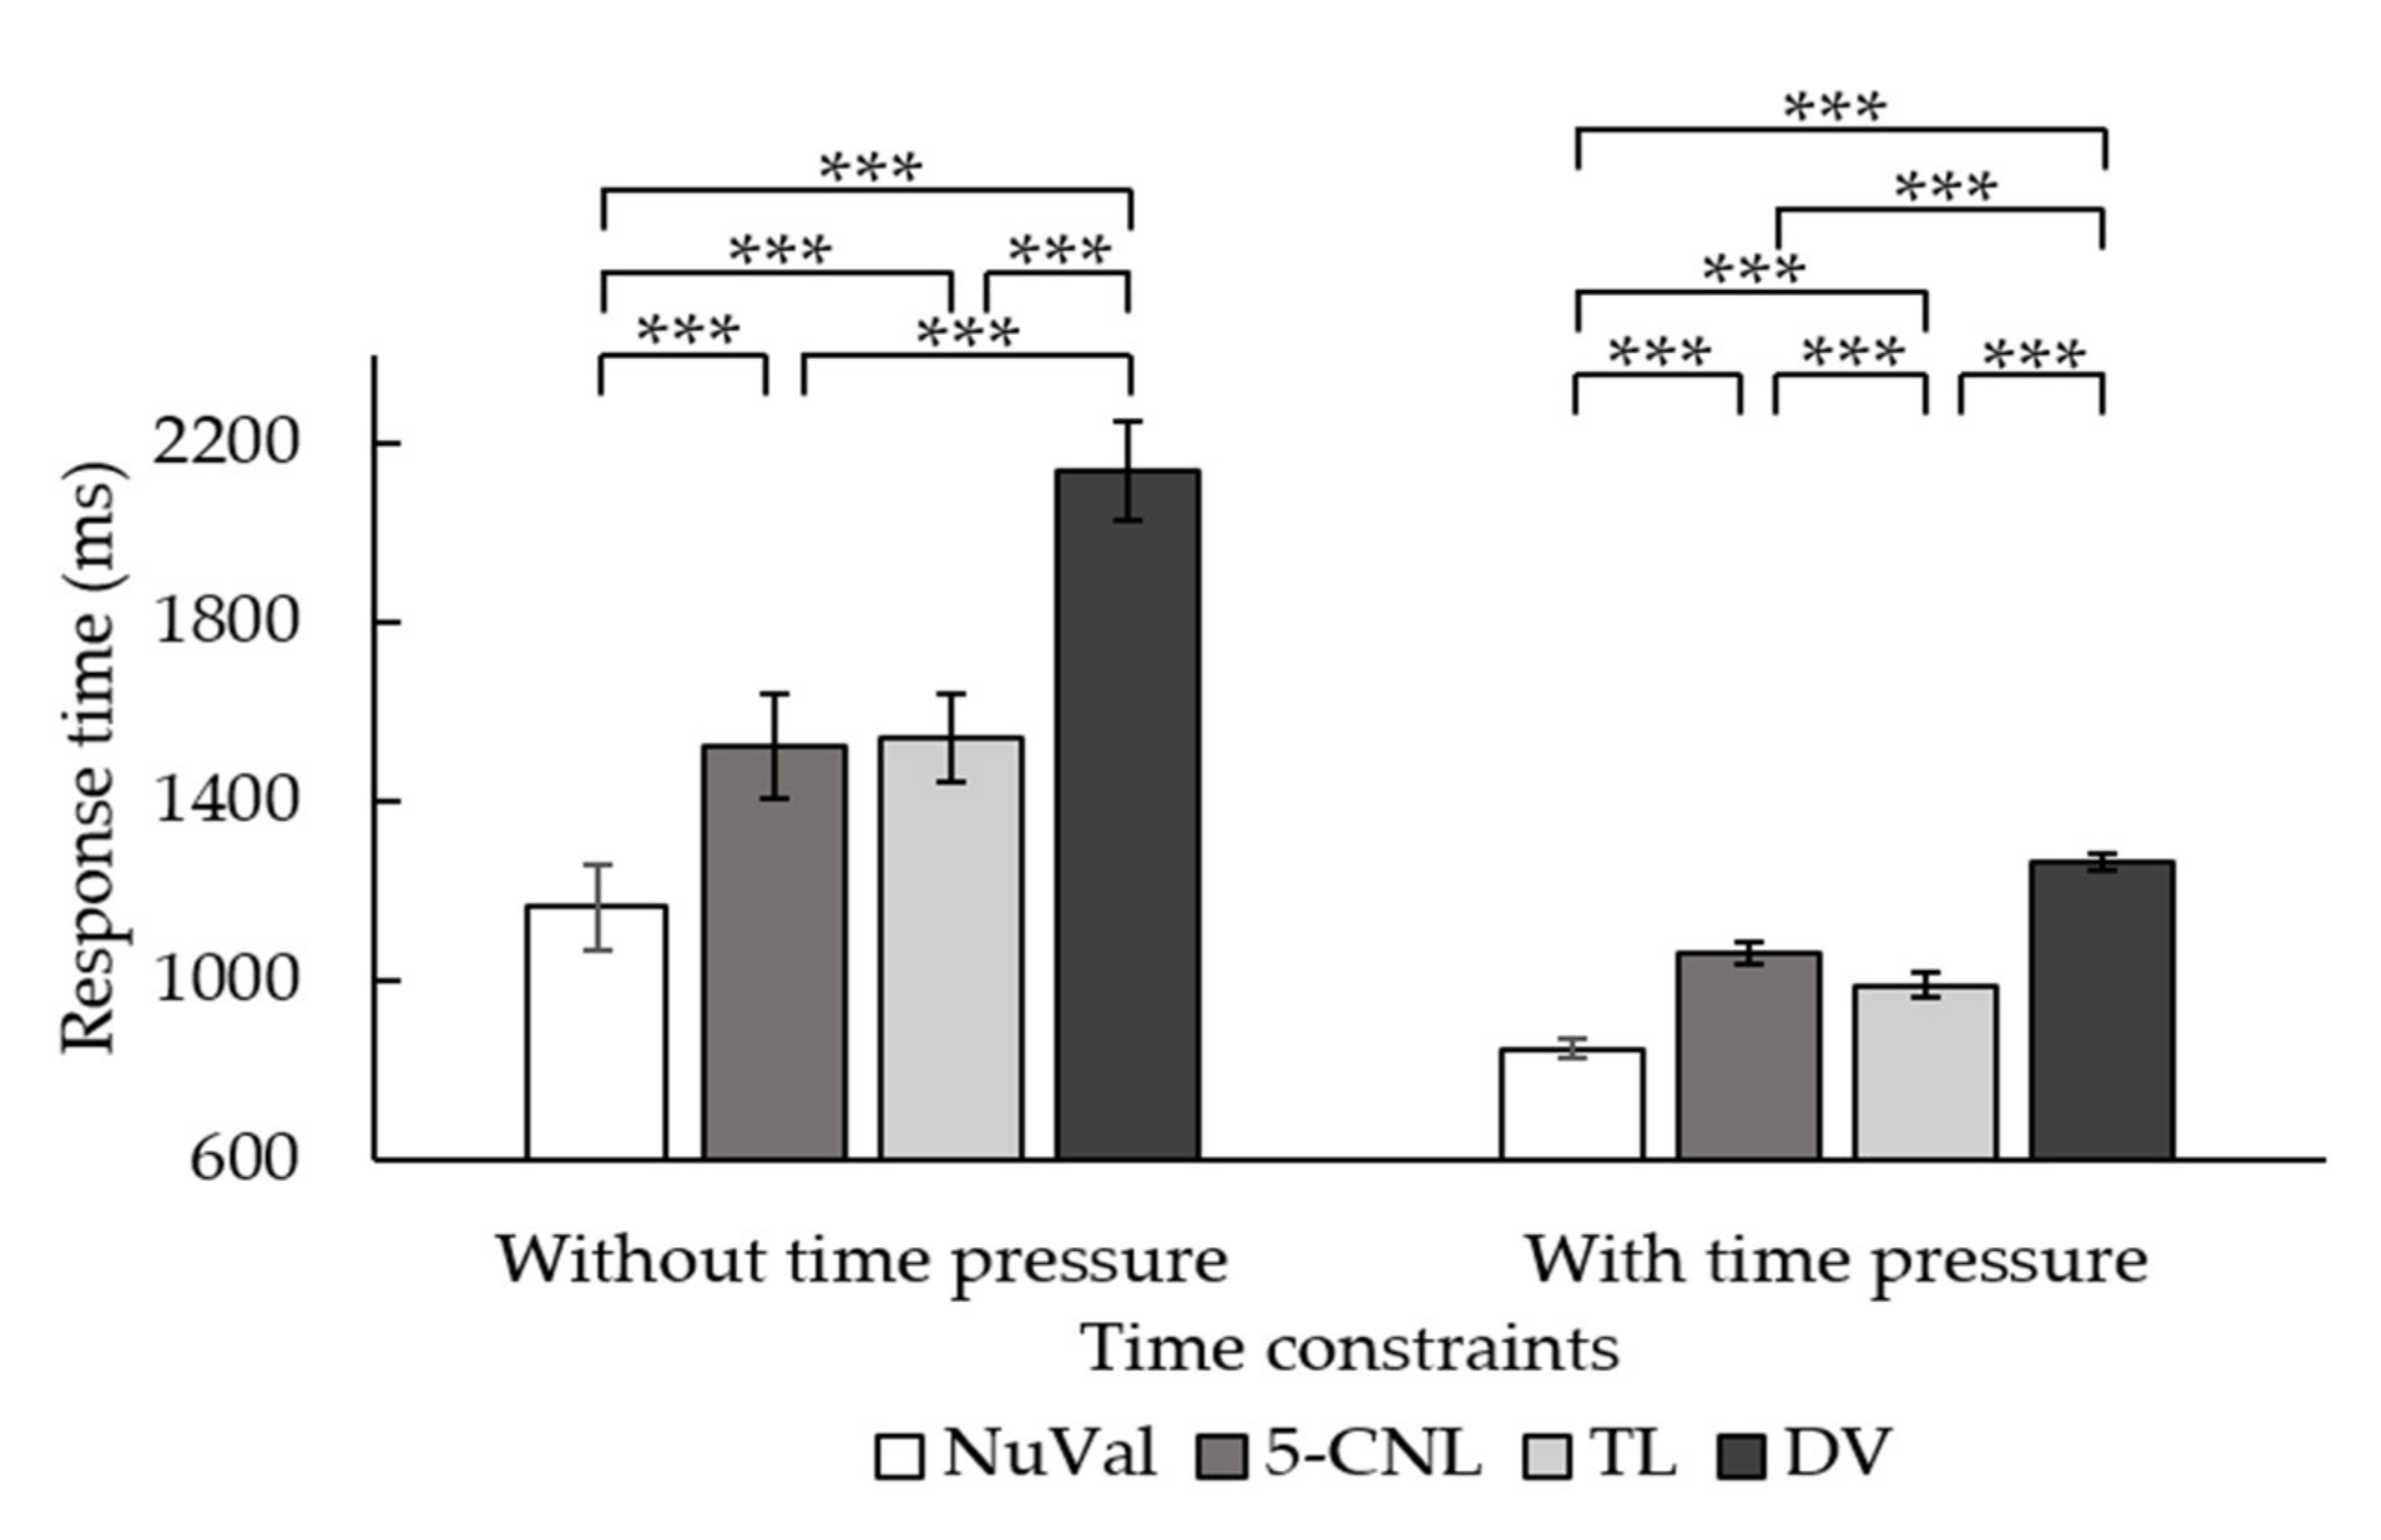
| Response time | NuVal | 1166.06 | 94.70 | [974.81, 1357.30] | 851.81 | 19.52 | [812.39, 891.23] |
| 5-CNL | 1525.20 | 116.99 | [1288.94, 1761.46] | 1064.17 | 24.33 | [1015.03, 1113.31] | |
| TL | 1544.55 | 100.41 | [1341.76, 1747.34] | 992.66 | 27.10 | [937.93, 1047.39] | |
| DV | 2141.54 | 110.02 | [1919.34, 2363.73] | 1266.04 | 19.68 | [1226.31, 1305.78] | |
| Measurements | Label | Without Time Constraints | With Time Constraints | ||||
|---|---|---|---|---|---|---|---|
| Mean | SD | 95% CI | Mean | SD | 95% CI | ||
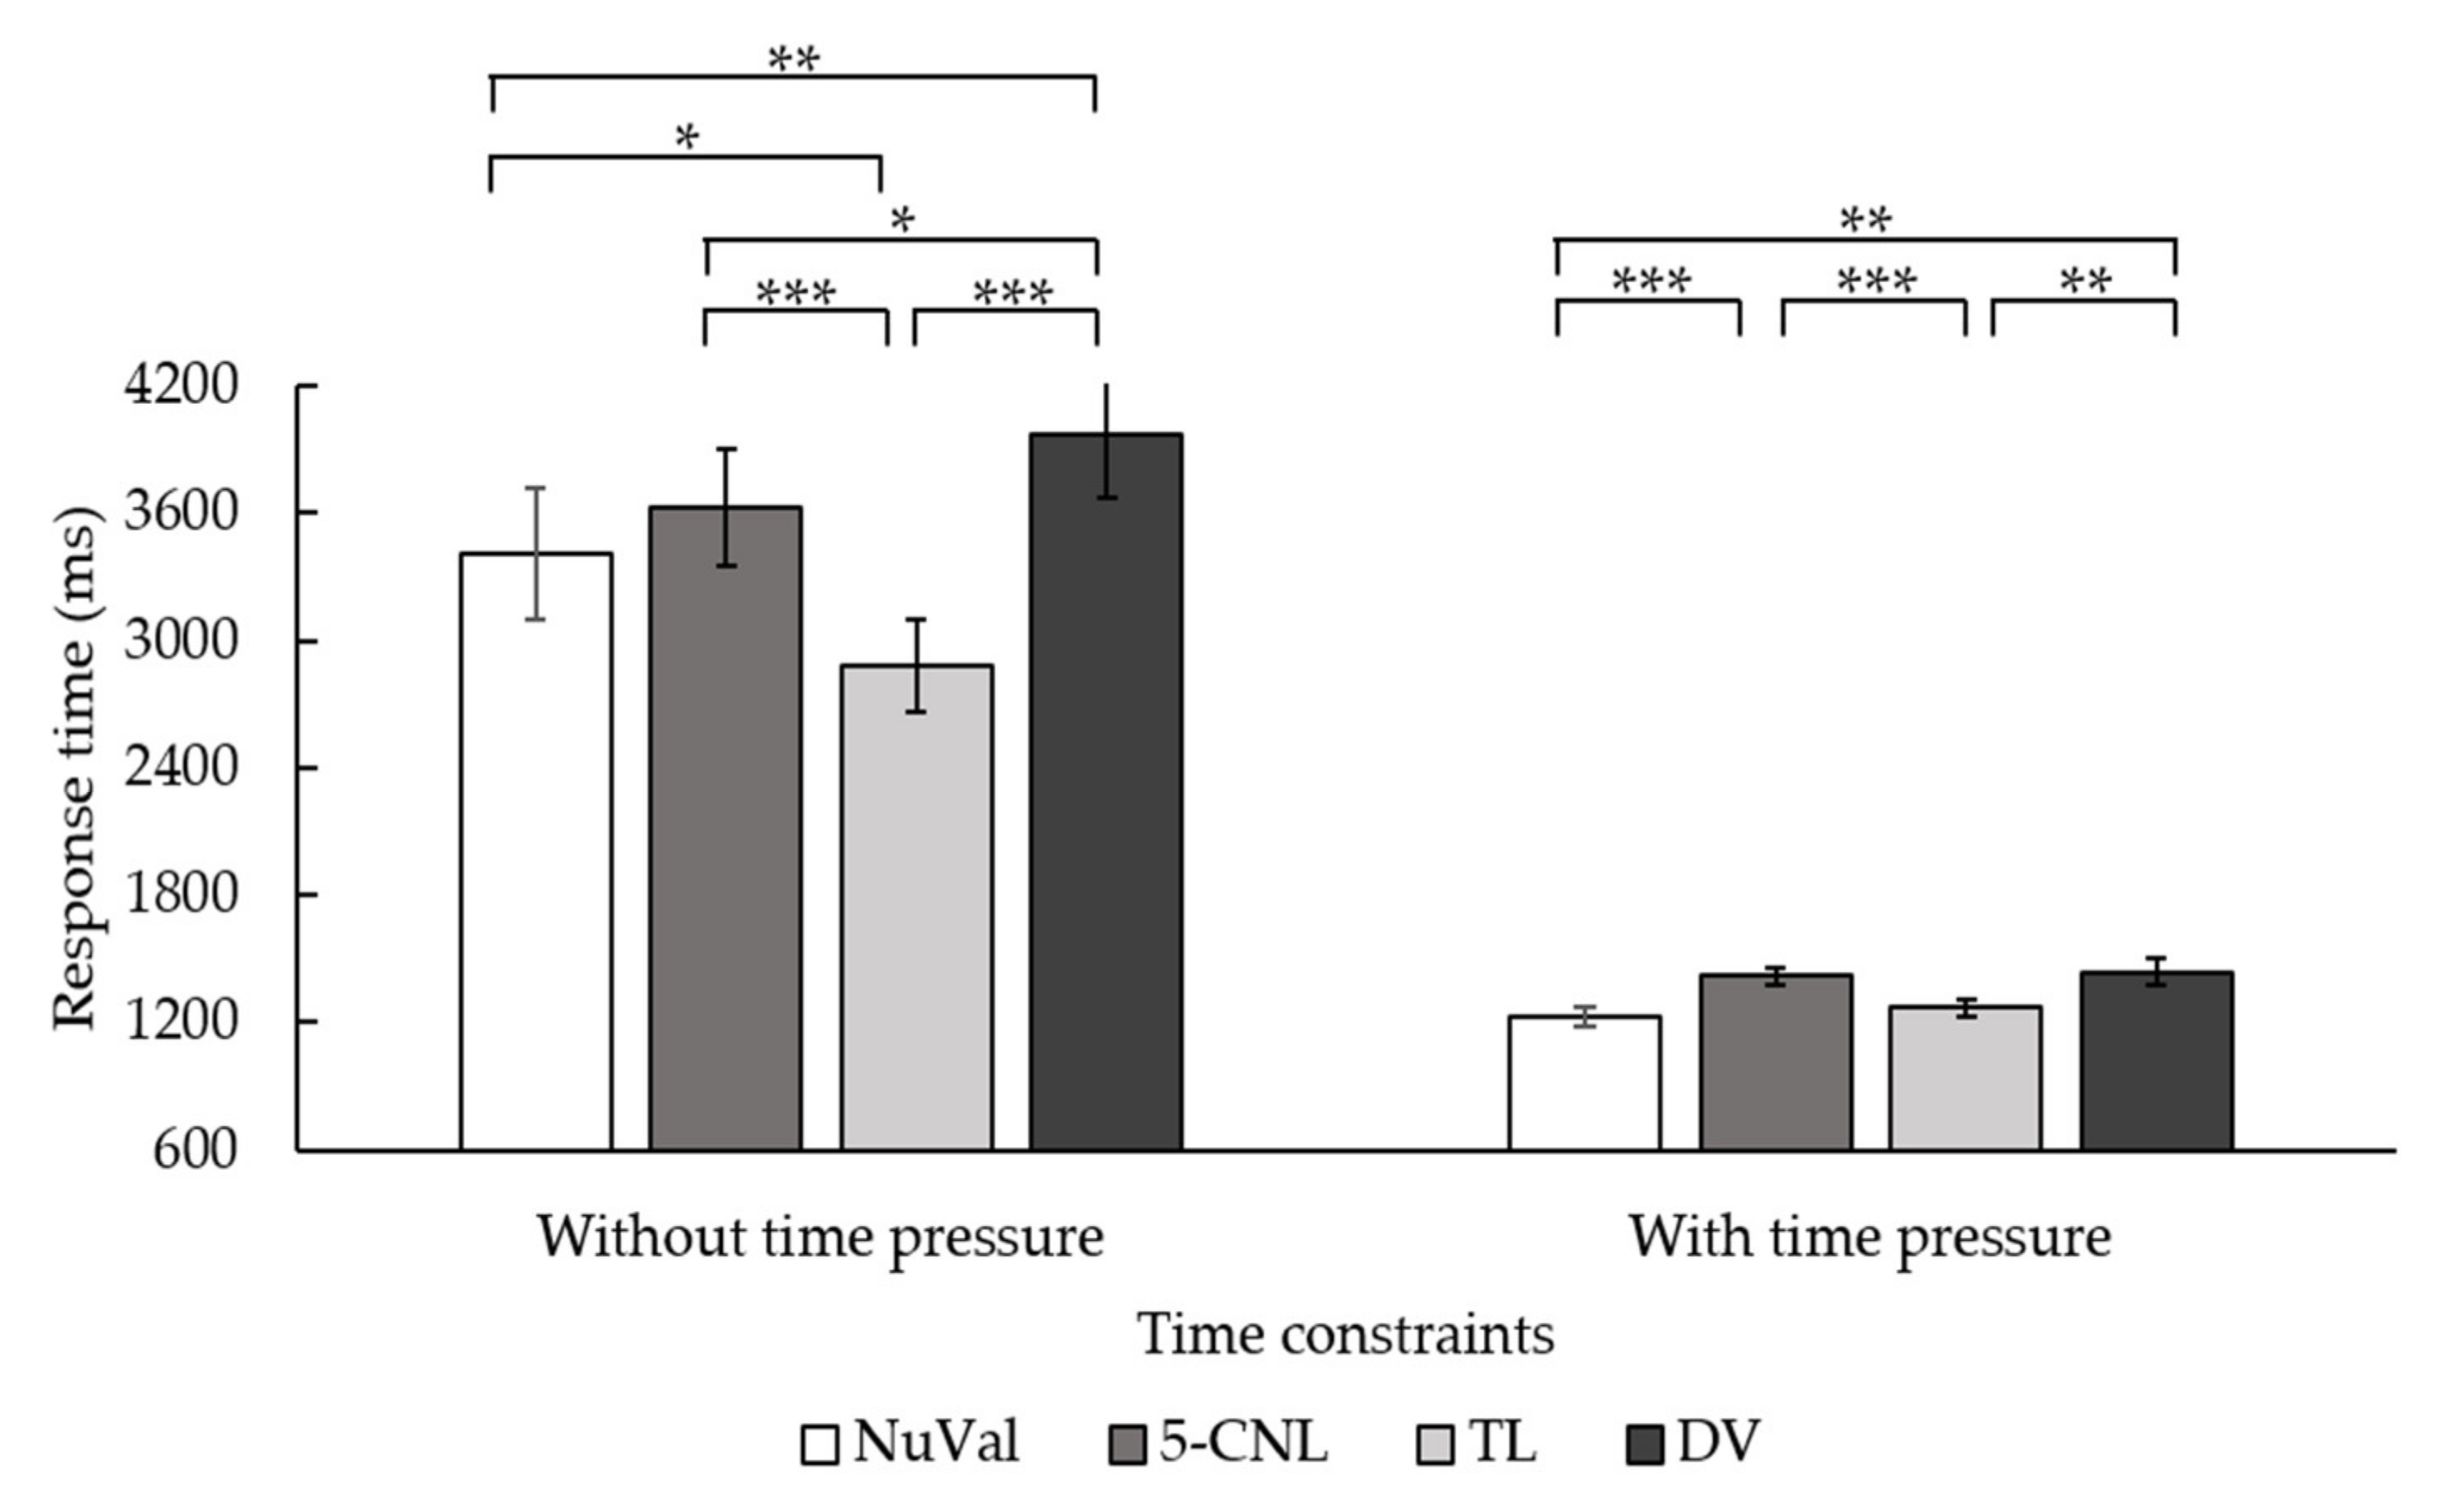
| Response time | NuVal | 3410.47 | 290.70 | [2823.81, 3997.13] | 1207.48 | 40.67 | [1125.27, 1289.68] |
| 5-CNL | 3647.99 | 255.36 | [3132.65, 4163.32] | 1413.85 | 38.82 | [1335.39, 1492.31] | |
| TL | 2914.42 | 214.43 | [2481.67, 3347.16] | 1265.16 | 34.18 | [1196.09, 1334.24] | |
| DV | 4059.87 | 286.91 | [3480.87, 4638.87] | 1414.81 | 62.64 | [1288.21, 1541.42] | |
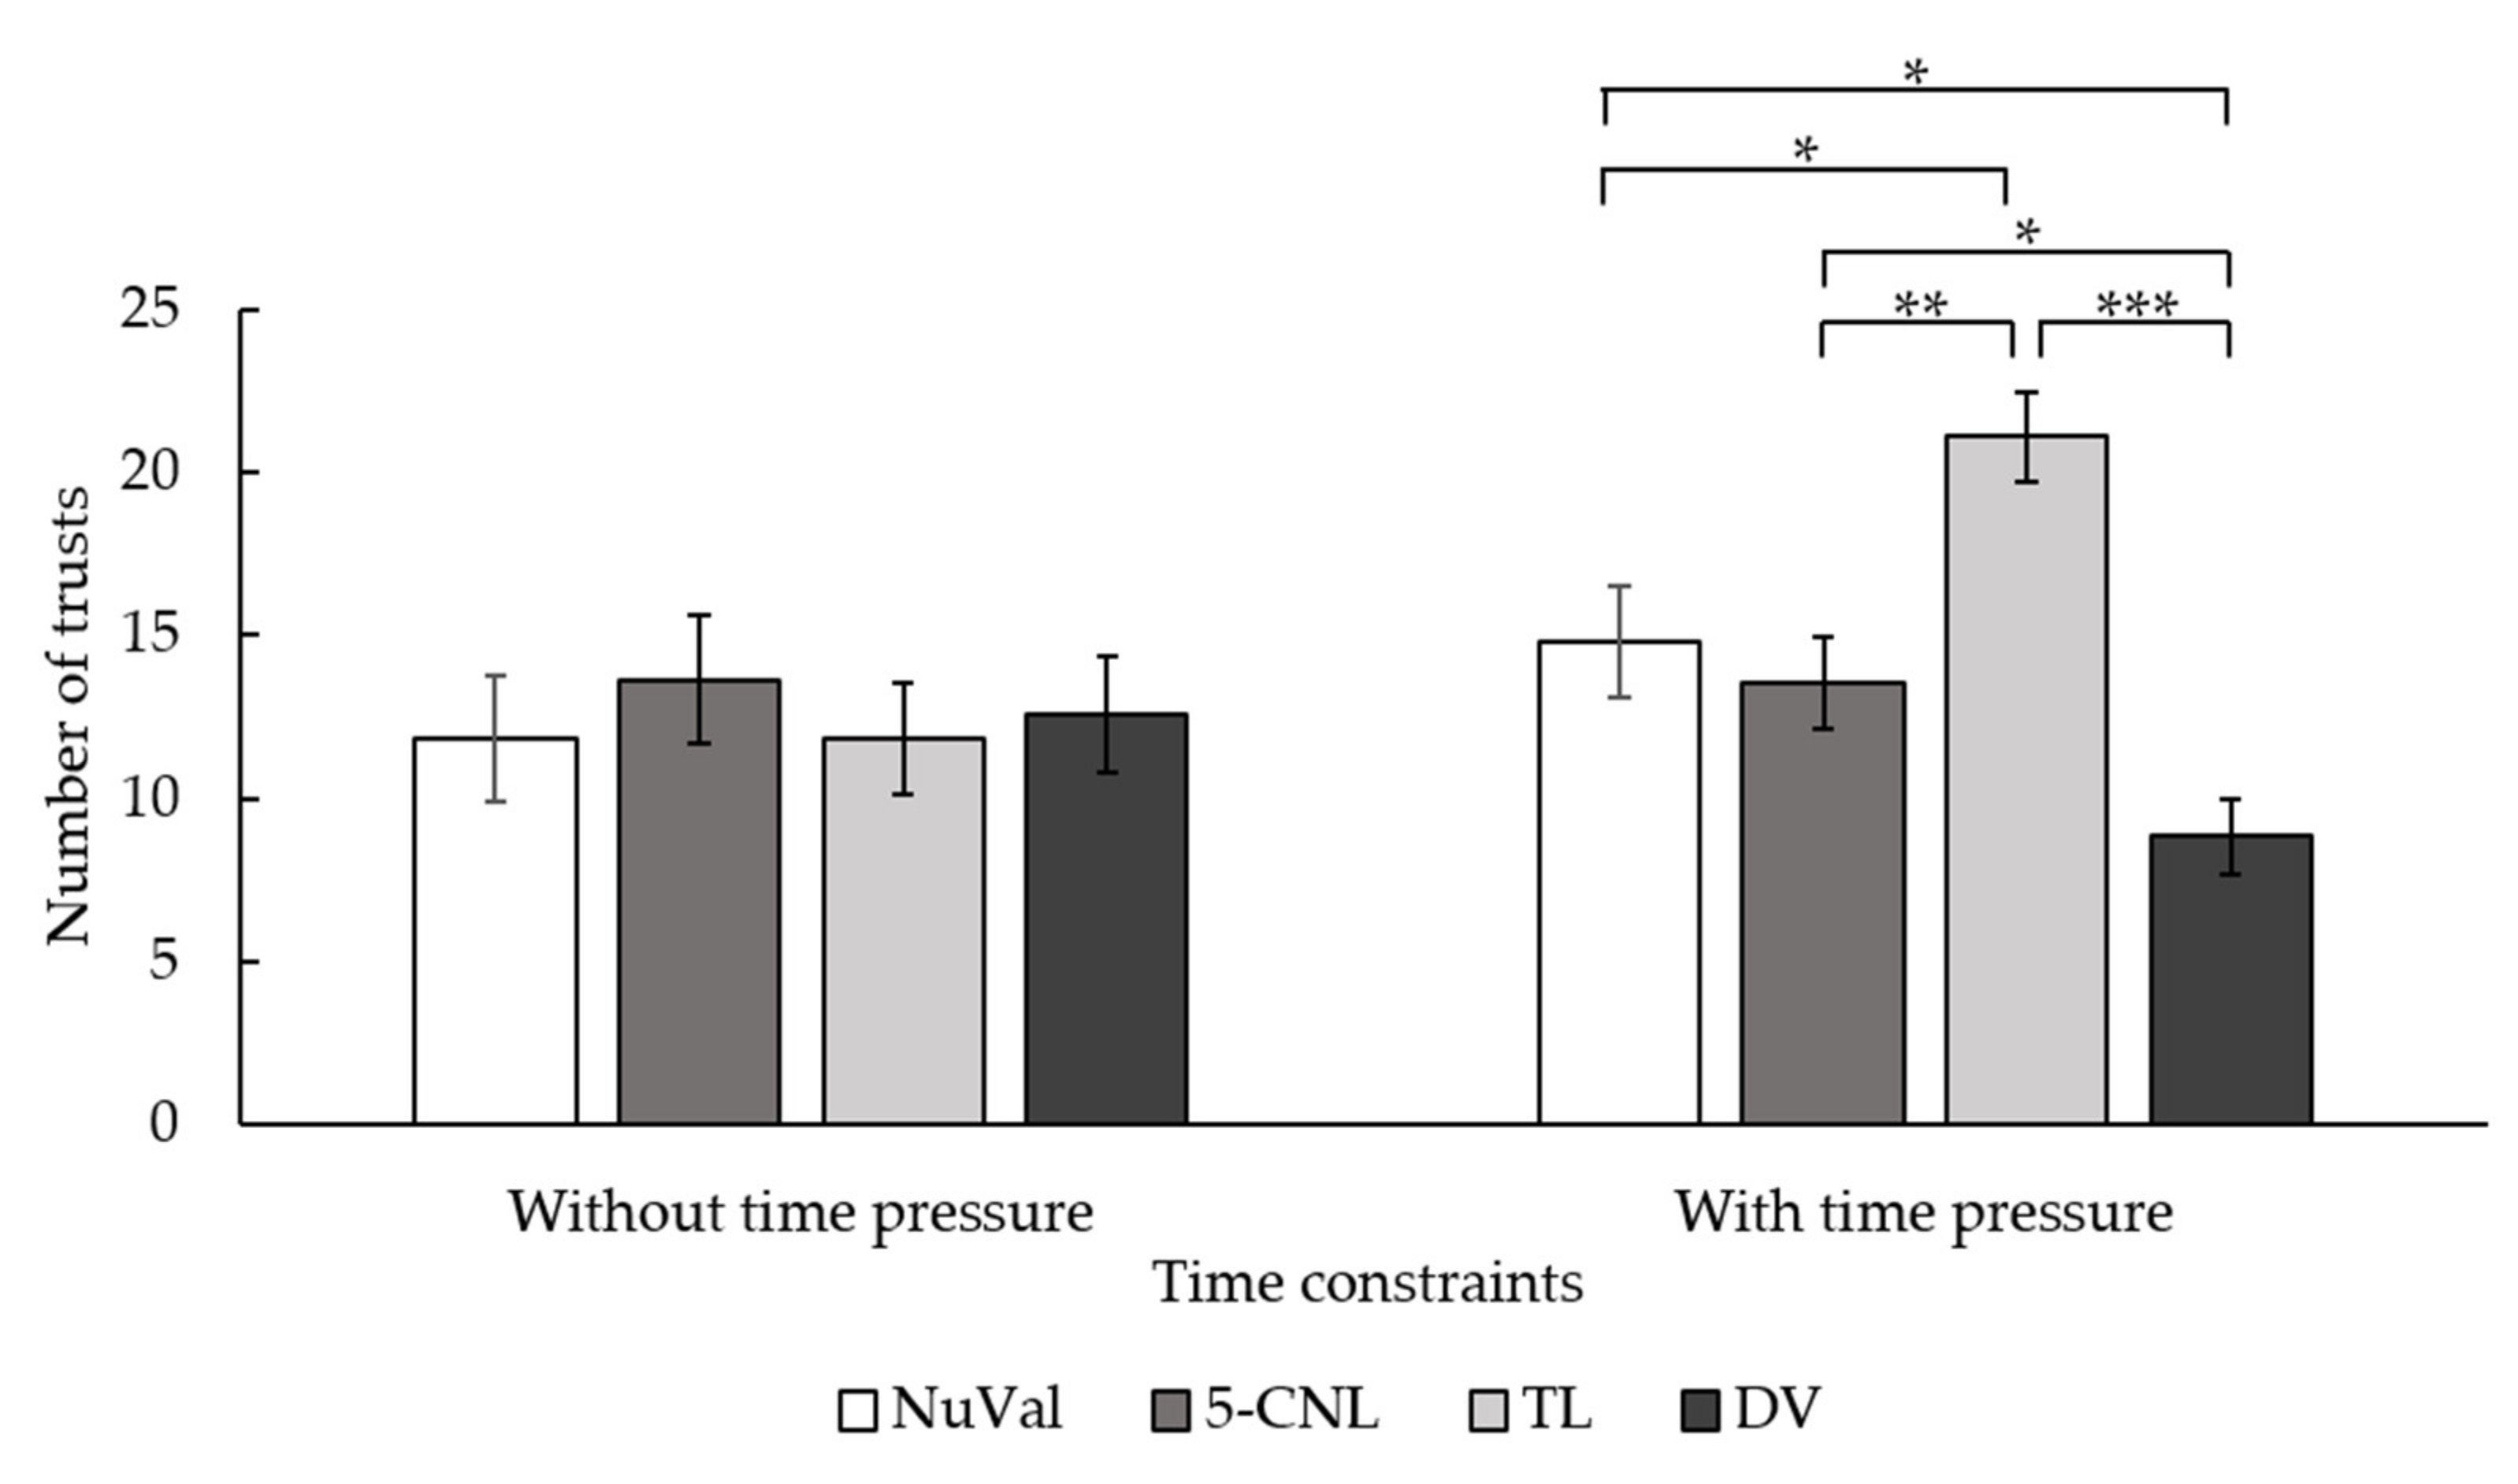
| Number of times choosing labels | NuVal | 11.84 | 1.96 | [7.81, 15.88] | 14.80 | 1.72 | [11.24, 18.36] |
| 5-CNL | 13.64 | 1.98 | [9.56, 17.72] | 13.56 | 1.40 | [10.67, 16.45] | |
| TL | 11.84 | 1.73 | [8.27, 15.41] | 21.08 | 1.39 | [18.22, 23.95] | |
| DV | 12.56 | 1.76 | [8.92, 16.20] | 8.84 | 1.13 | [6.50, 11.18] | |
Publisher’s Note: MDPI stays neutral with regard to jurisdictional claims in published maps and institutional affiliations. |
© 2022 by the authors. Licensee MDPI, Basel, Switzerland. This article is an open access article distributed under the terms and conditions of the Creative Commons Attribution (CC BY) license (https://creativecommons.org/licenses/by/4.0/).
Share and Cite
Li, X.; Wang, Q.; Zhang, C.-Q. Do Individuals Use Nutrition Labels on Food Packages to Make Healthy Choices? Testing the Dual-Process Model in Two Laboratory-Based Experiments. Nutrients 2022, 14, 3732. https://doi.org/10.3390/nu14183732
Li X, Wang Q, Zhang C-Q. Do Individuals Use Nutrition Labels on Food Packages to Make Healthy Choices? Testing the Dual-Process Model in Two Laboratory-Based Experiments. Nutrients. 2022; 14(18):3732. https://doi.org/10.3390/nu14183732
Chicago/Turabian StyleLi, Xiaoyan, Qi Wang, and Chun-Qing Zhang. 2022. "Do Individuals Use Nutrition Labels on Food Packages to Make Healthy Choices? Testing the Dual-Process Model in Two Laboratory-Based Experiments" Nutrients 14, no. 18: 3732. https://doi.org/10.3390/nu14183732
APA StyleLi, X., Wang, Q., & Zhang, C.-Q. (2022). Do Individuals Use Nutrition Labels on Food Packages to Make Healthy Choices? Testing the Dual-Process Model in Two Laboratory-Based Experiments. Nutrients, 14(18), 3732. https://doi.org/10.3390/nu14183732