Sensory Appeal and Routines Beat Health Messages and Visibility Enhancements: Mixed-Methods Analysis of a Choice-Architecture Intervention in a Workplace Cafeteria

 ,
,  , , , and
Abstract
:1. Introduction
2. Materials and Methods
2.1. Study Design
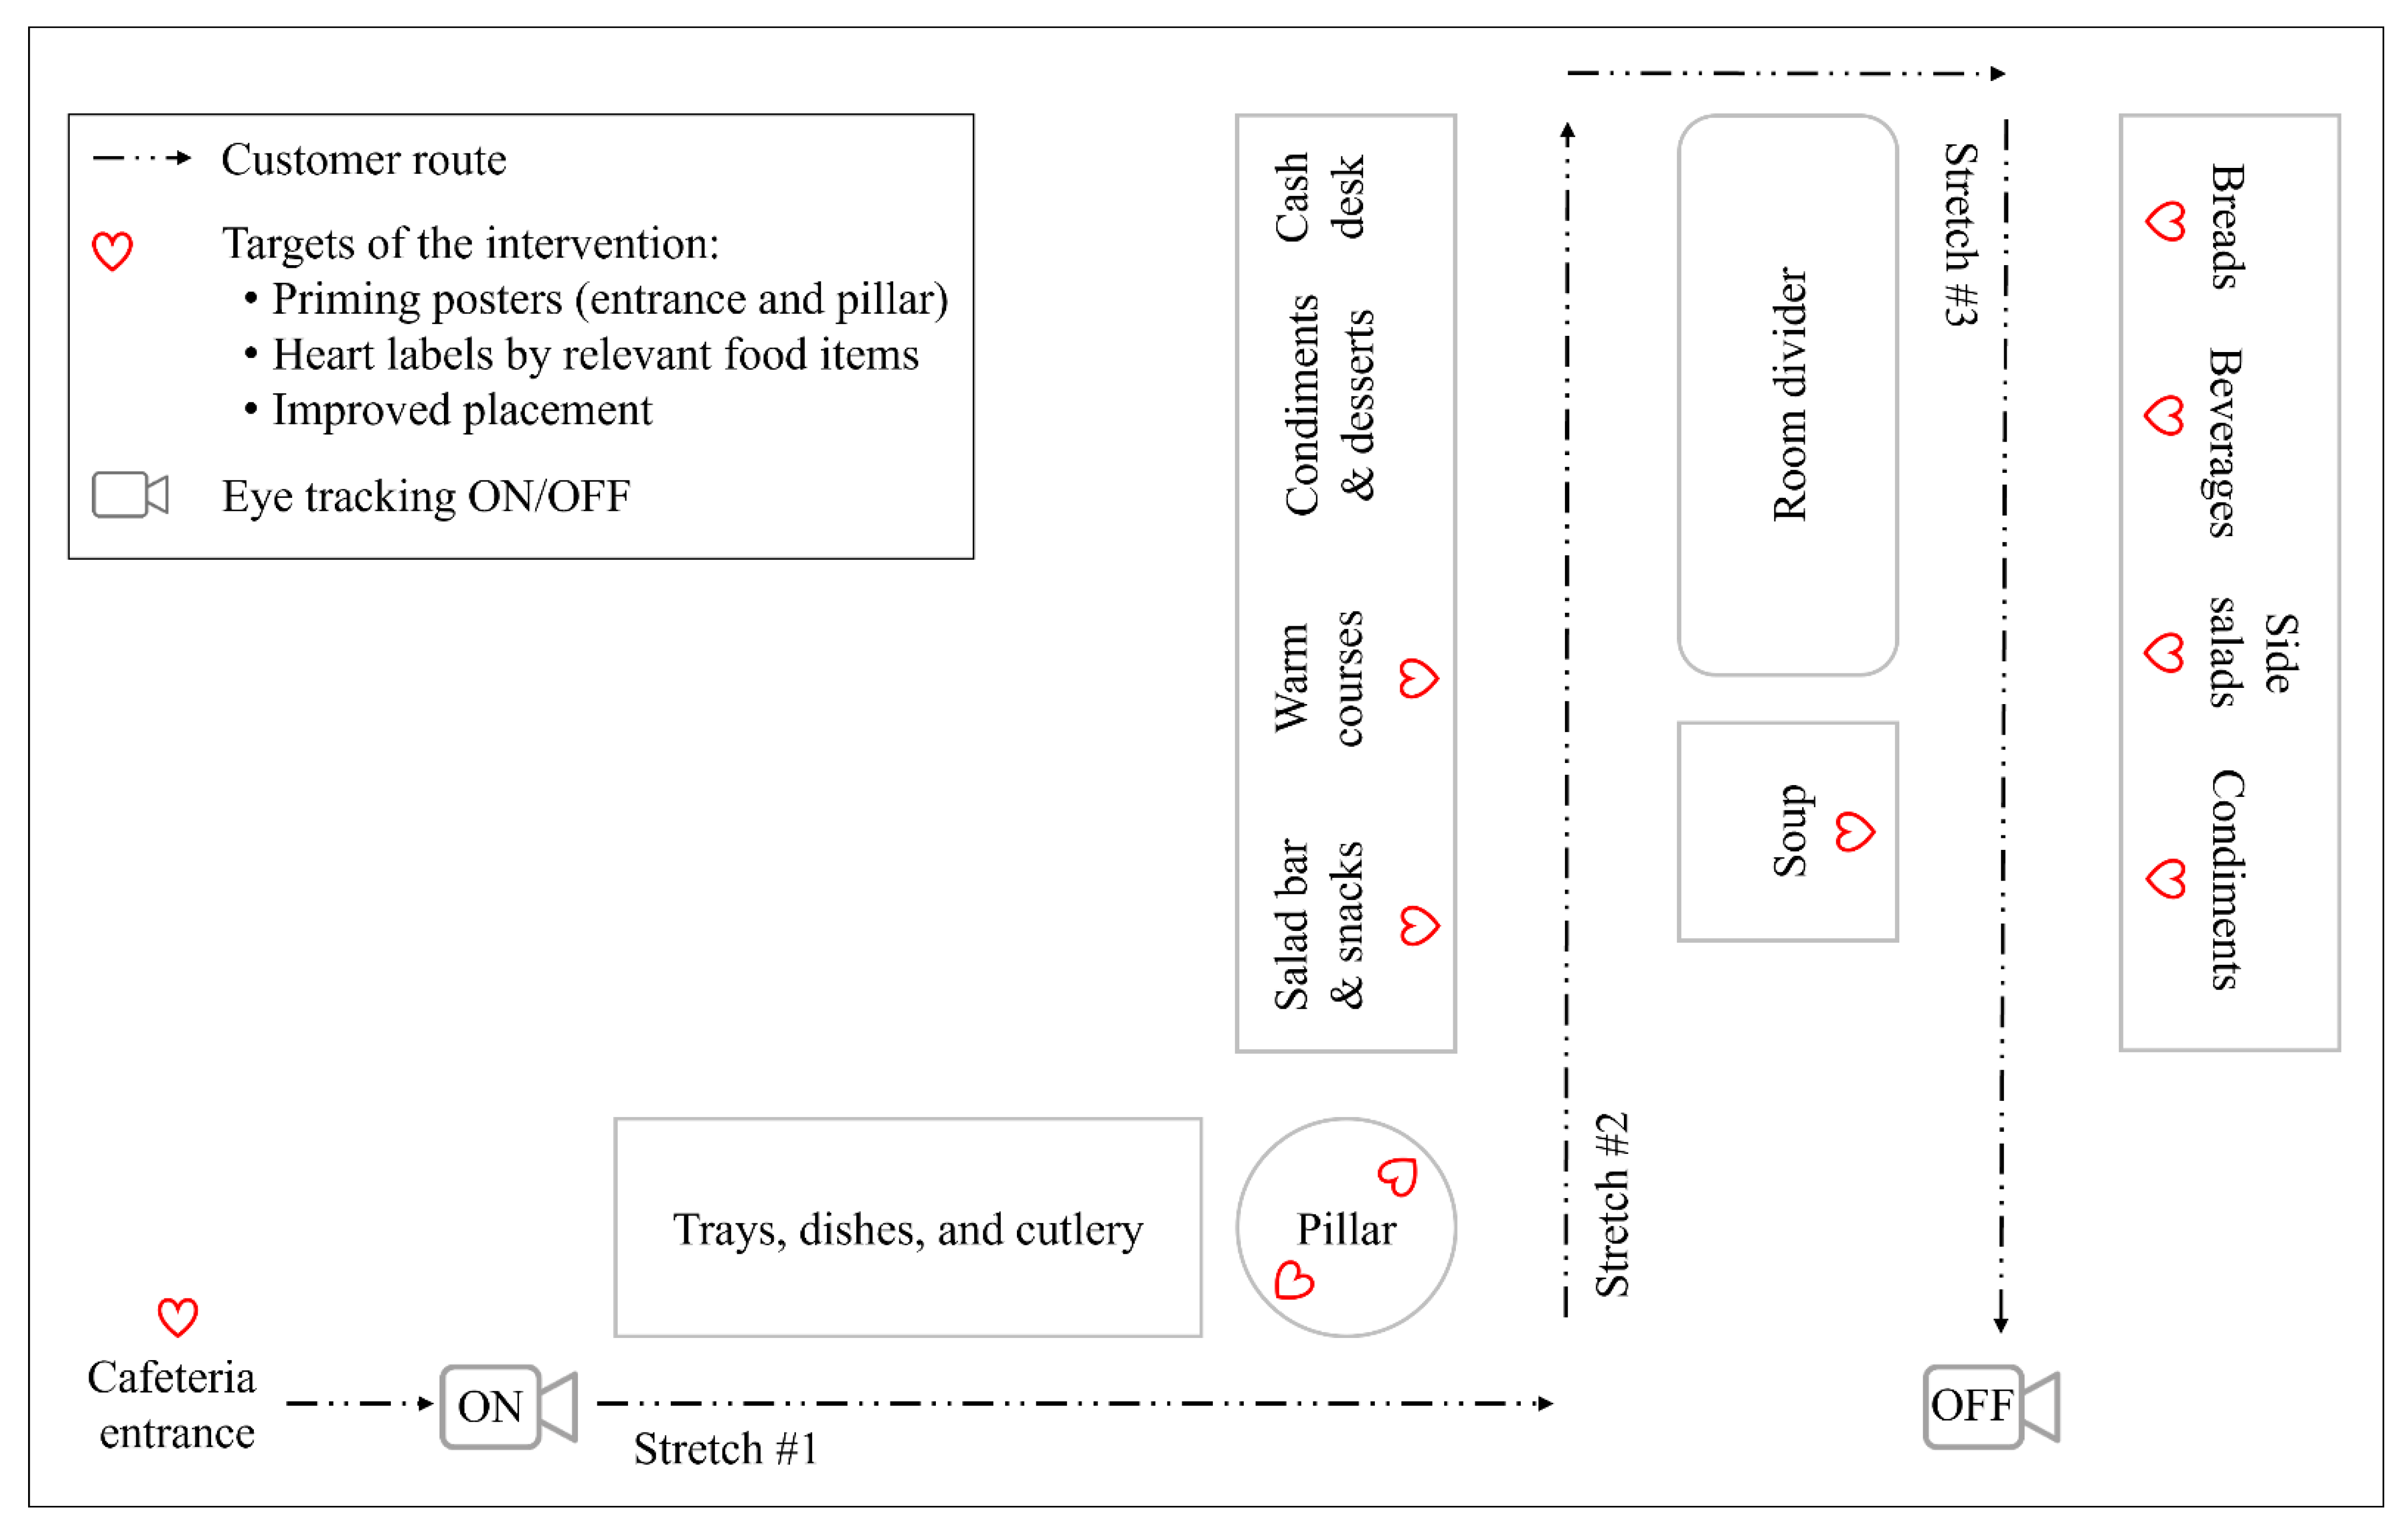
2.2. Setting
2.3. Participants and Their Recruitment
2.4. Control and Intervention Condition
2.5. Data Collection
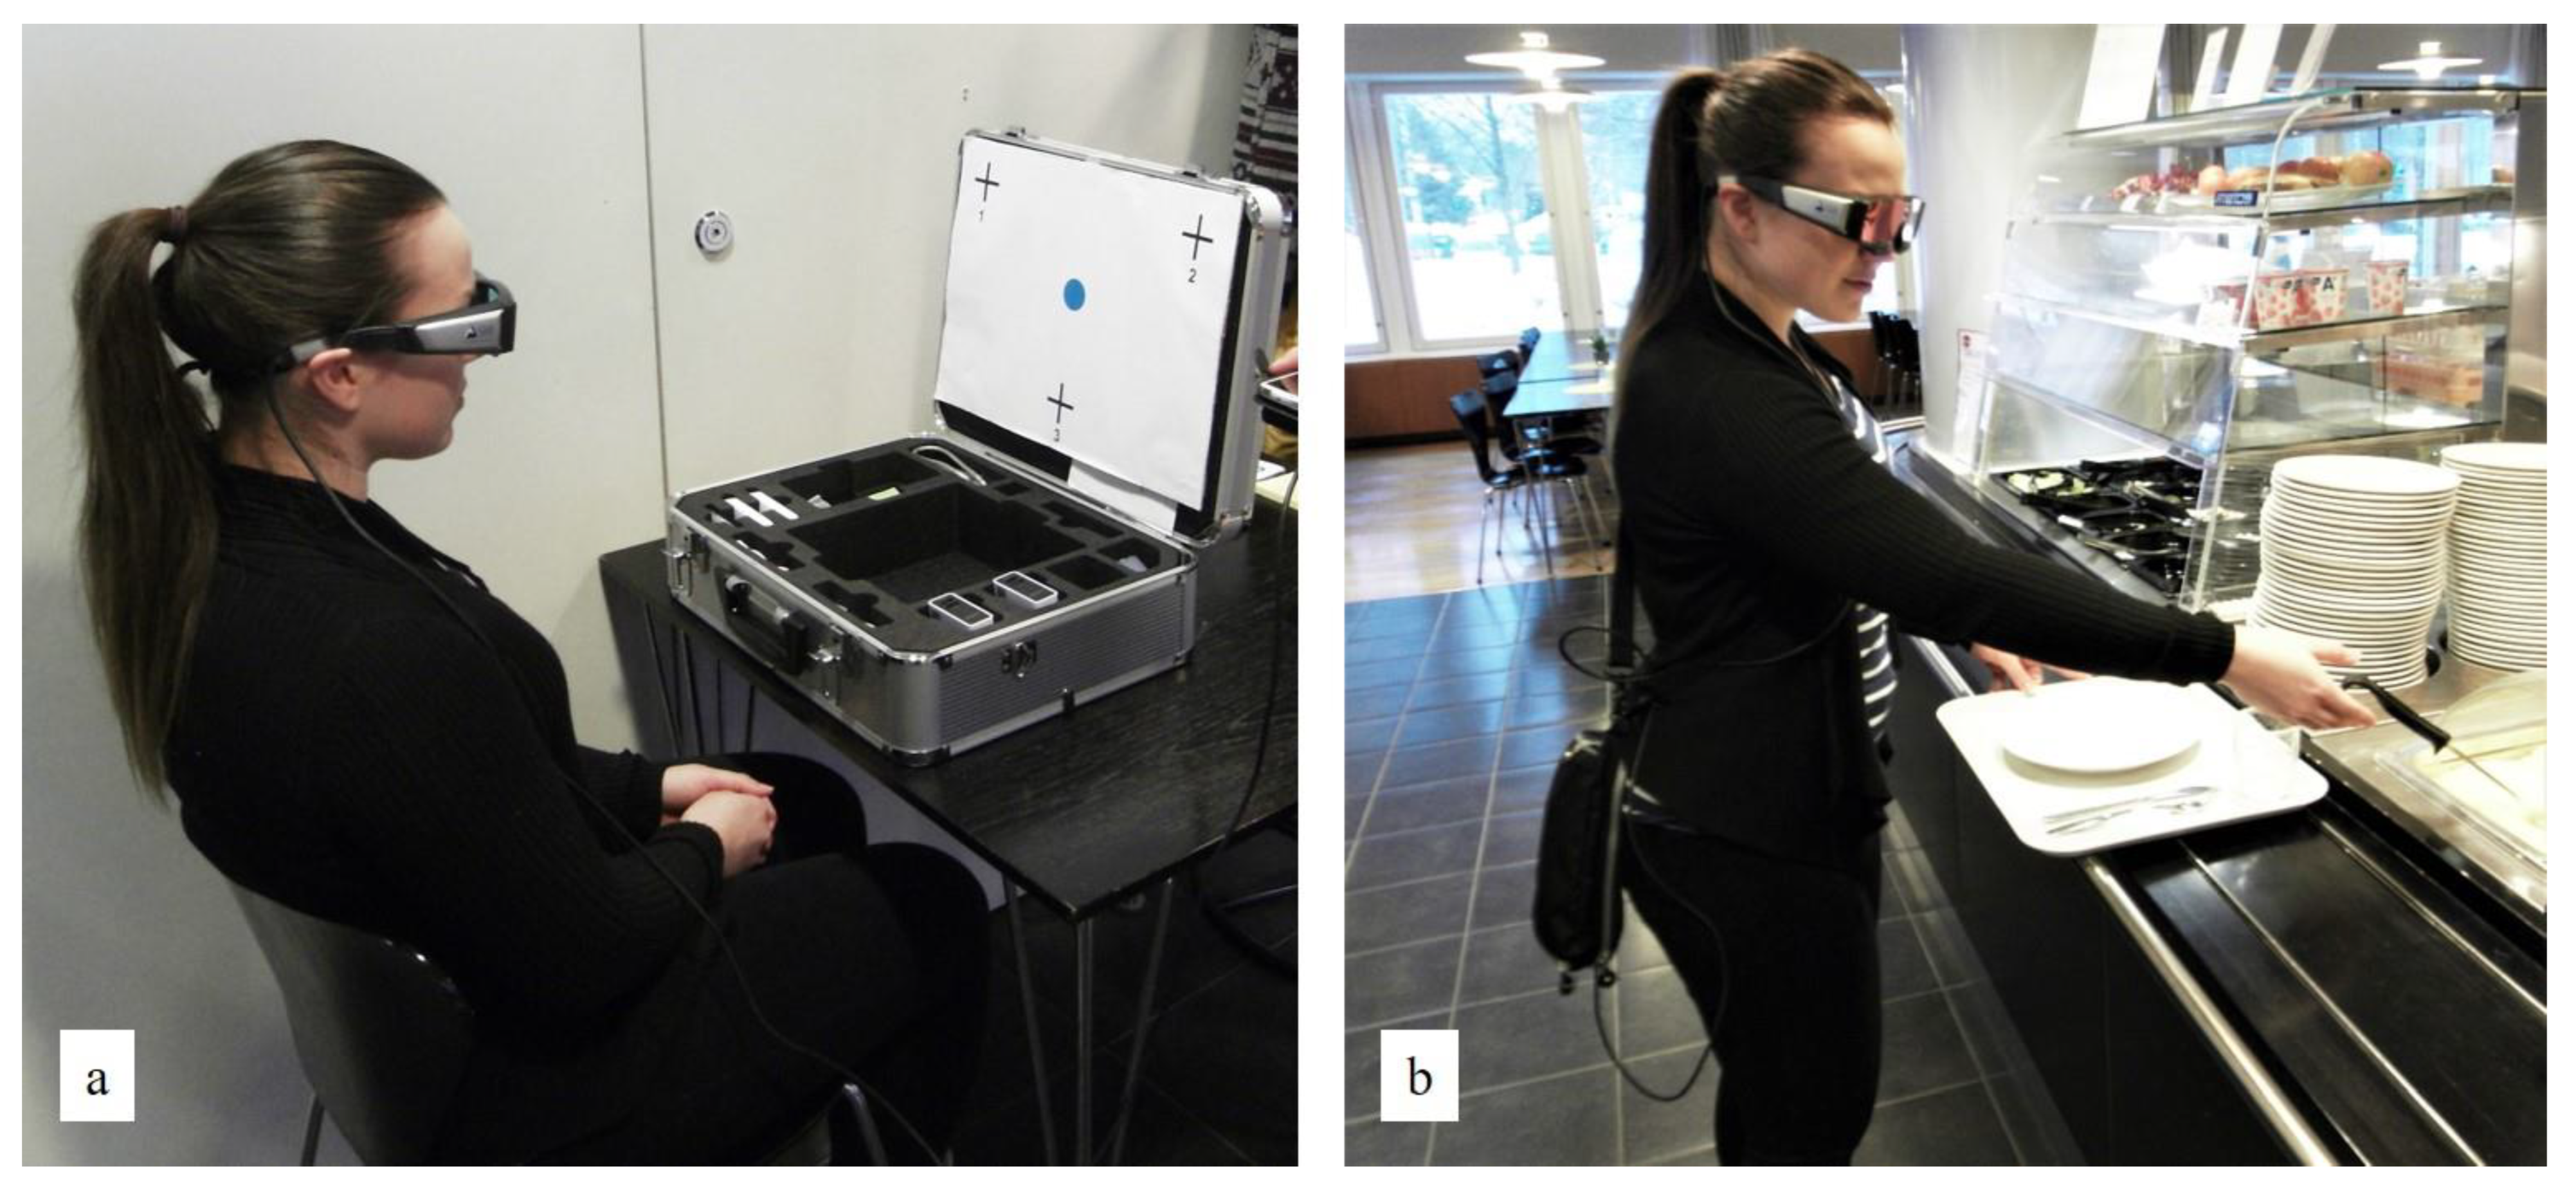
2.5.1. Eye Tracking
2.5.2. Cafeteria-Level Food Consumption
2.5.3. Interviews
2.6. Analyses
2.6.1. Fixations on Heart-Symbol Materials and Foods
2.6.2. Food Choices
2.6.3. Cafeteria-Level Food Consumption
2.6.4. Perceived Influences on Food Choices
2.6.5. Self-Reported Observations and Understanding of the Heart Symbol
3. Results
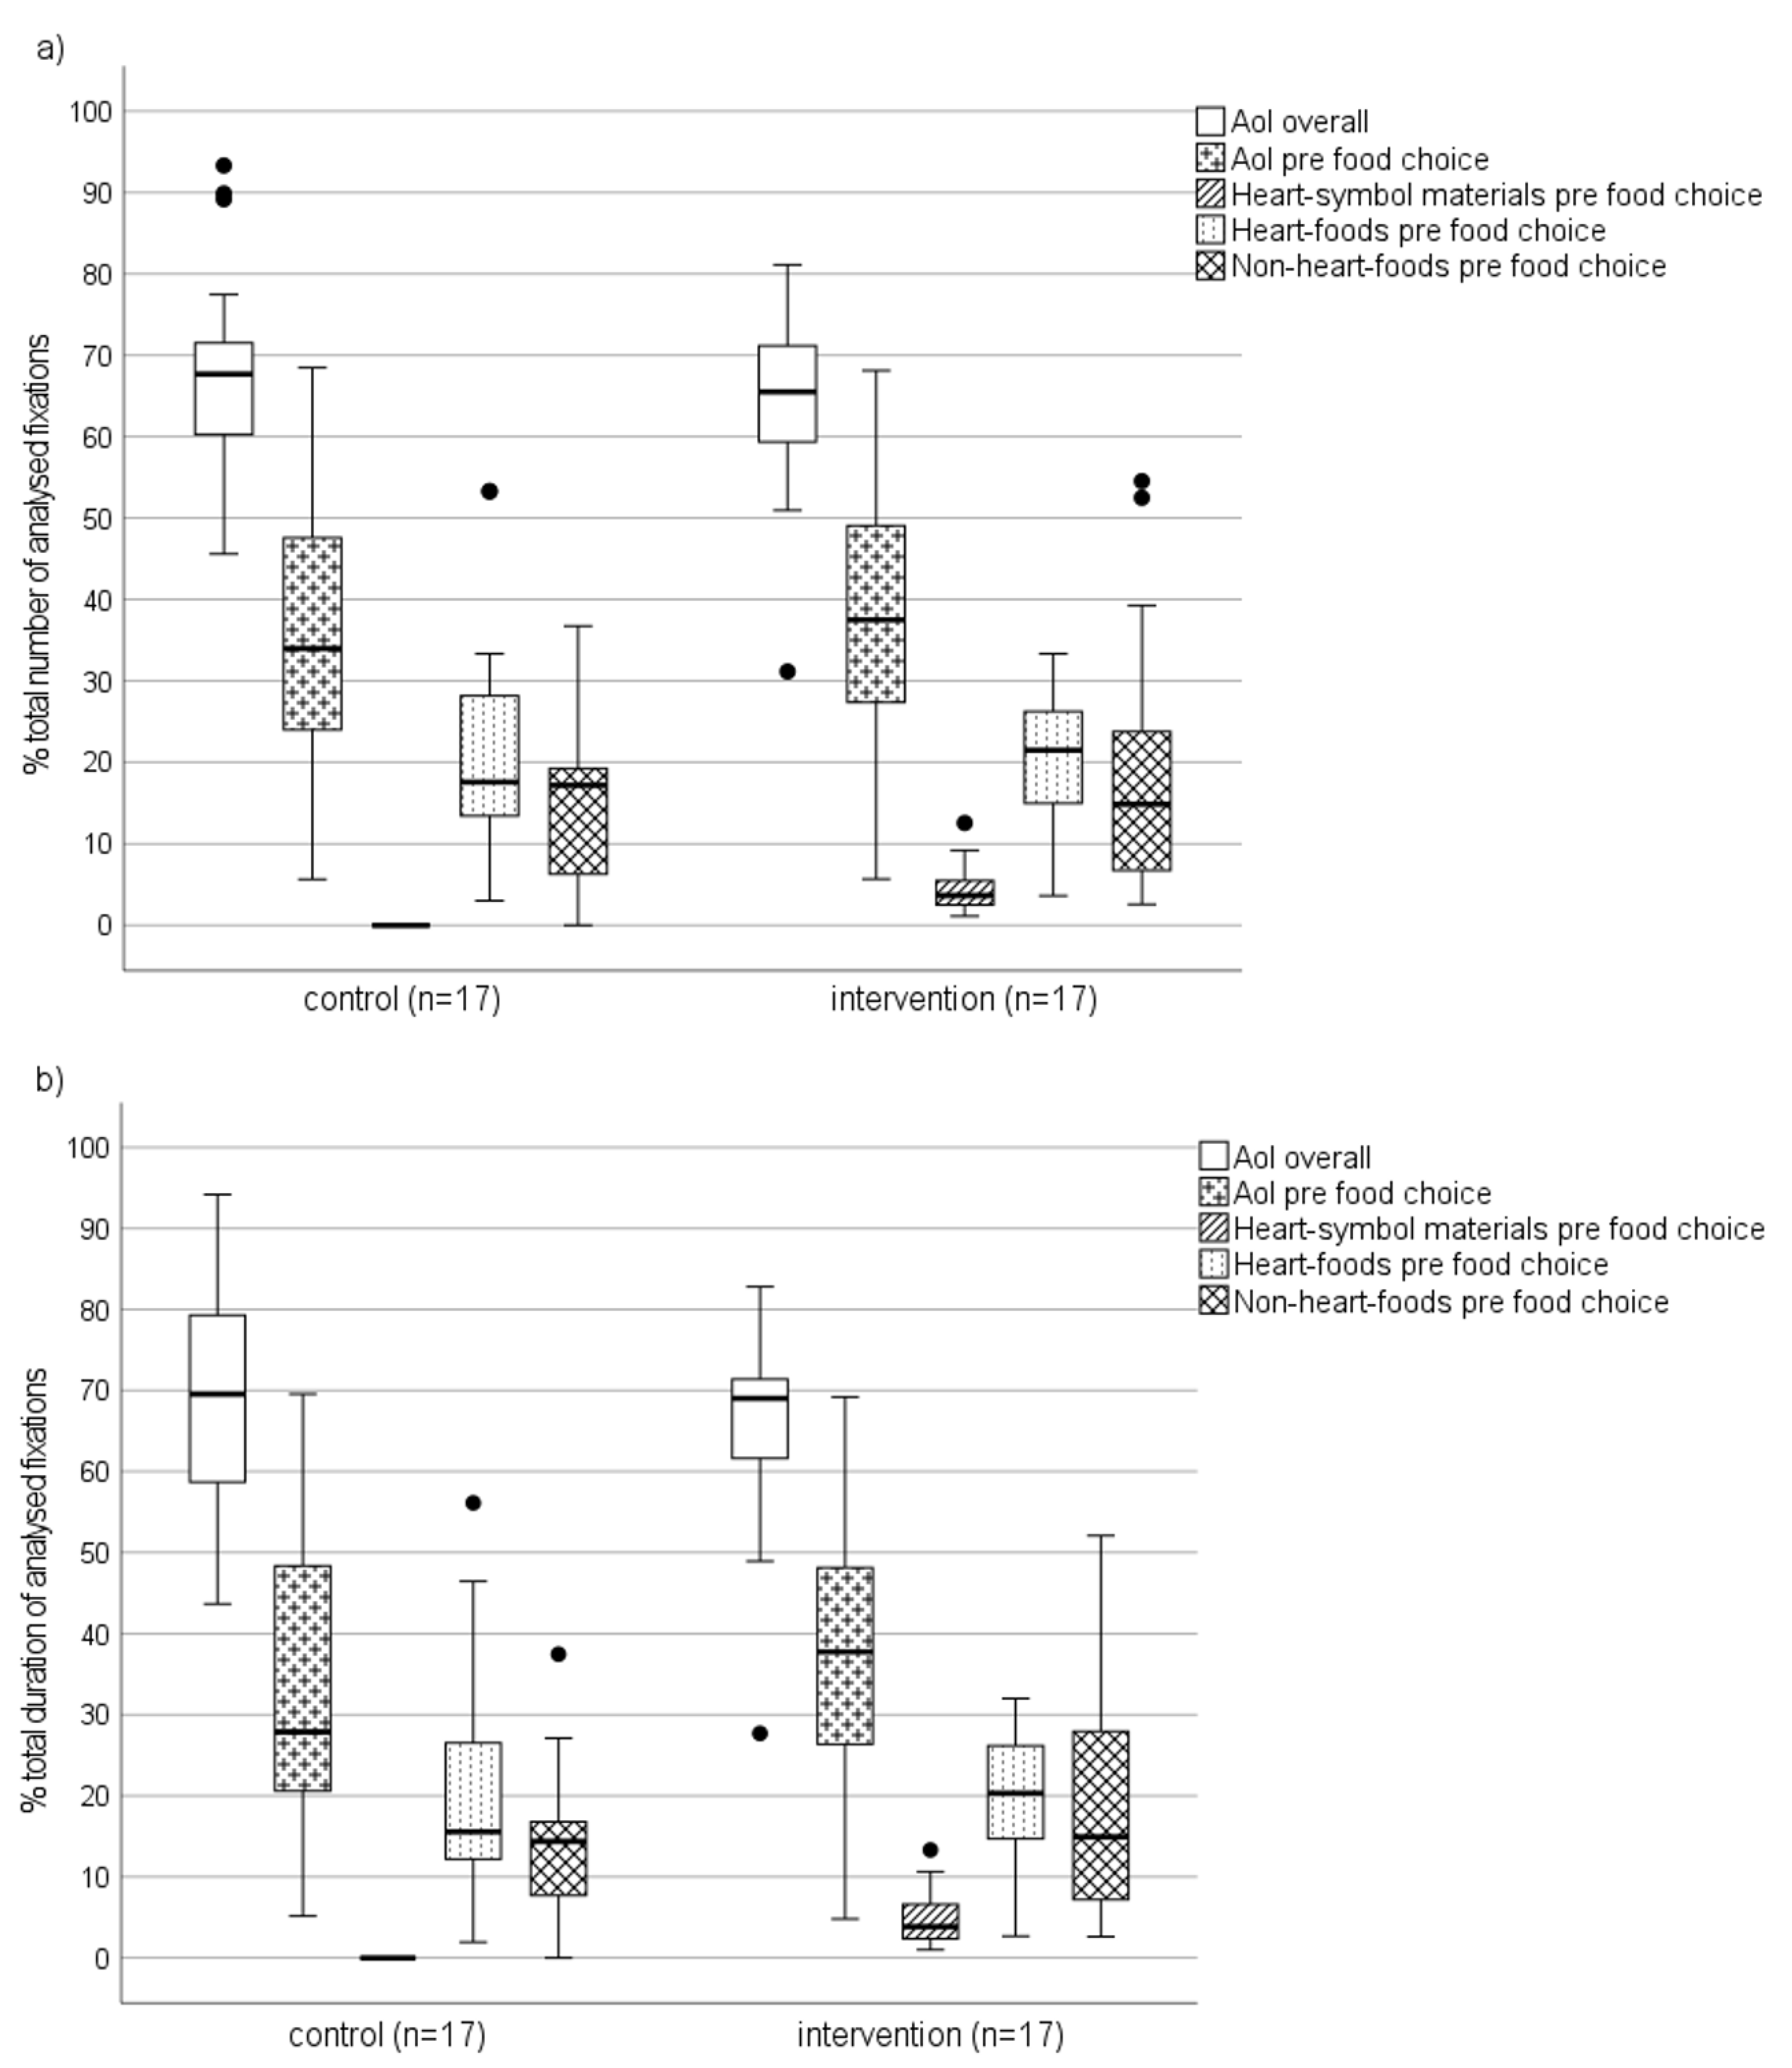
3.1. Fixations on Heart-Symbol Materials and Foods
3.2. Food Choices
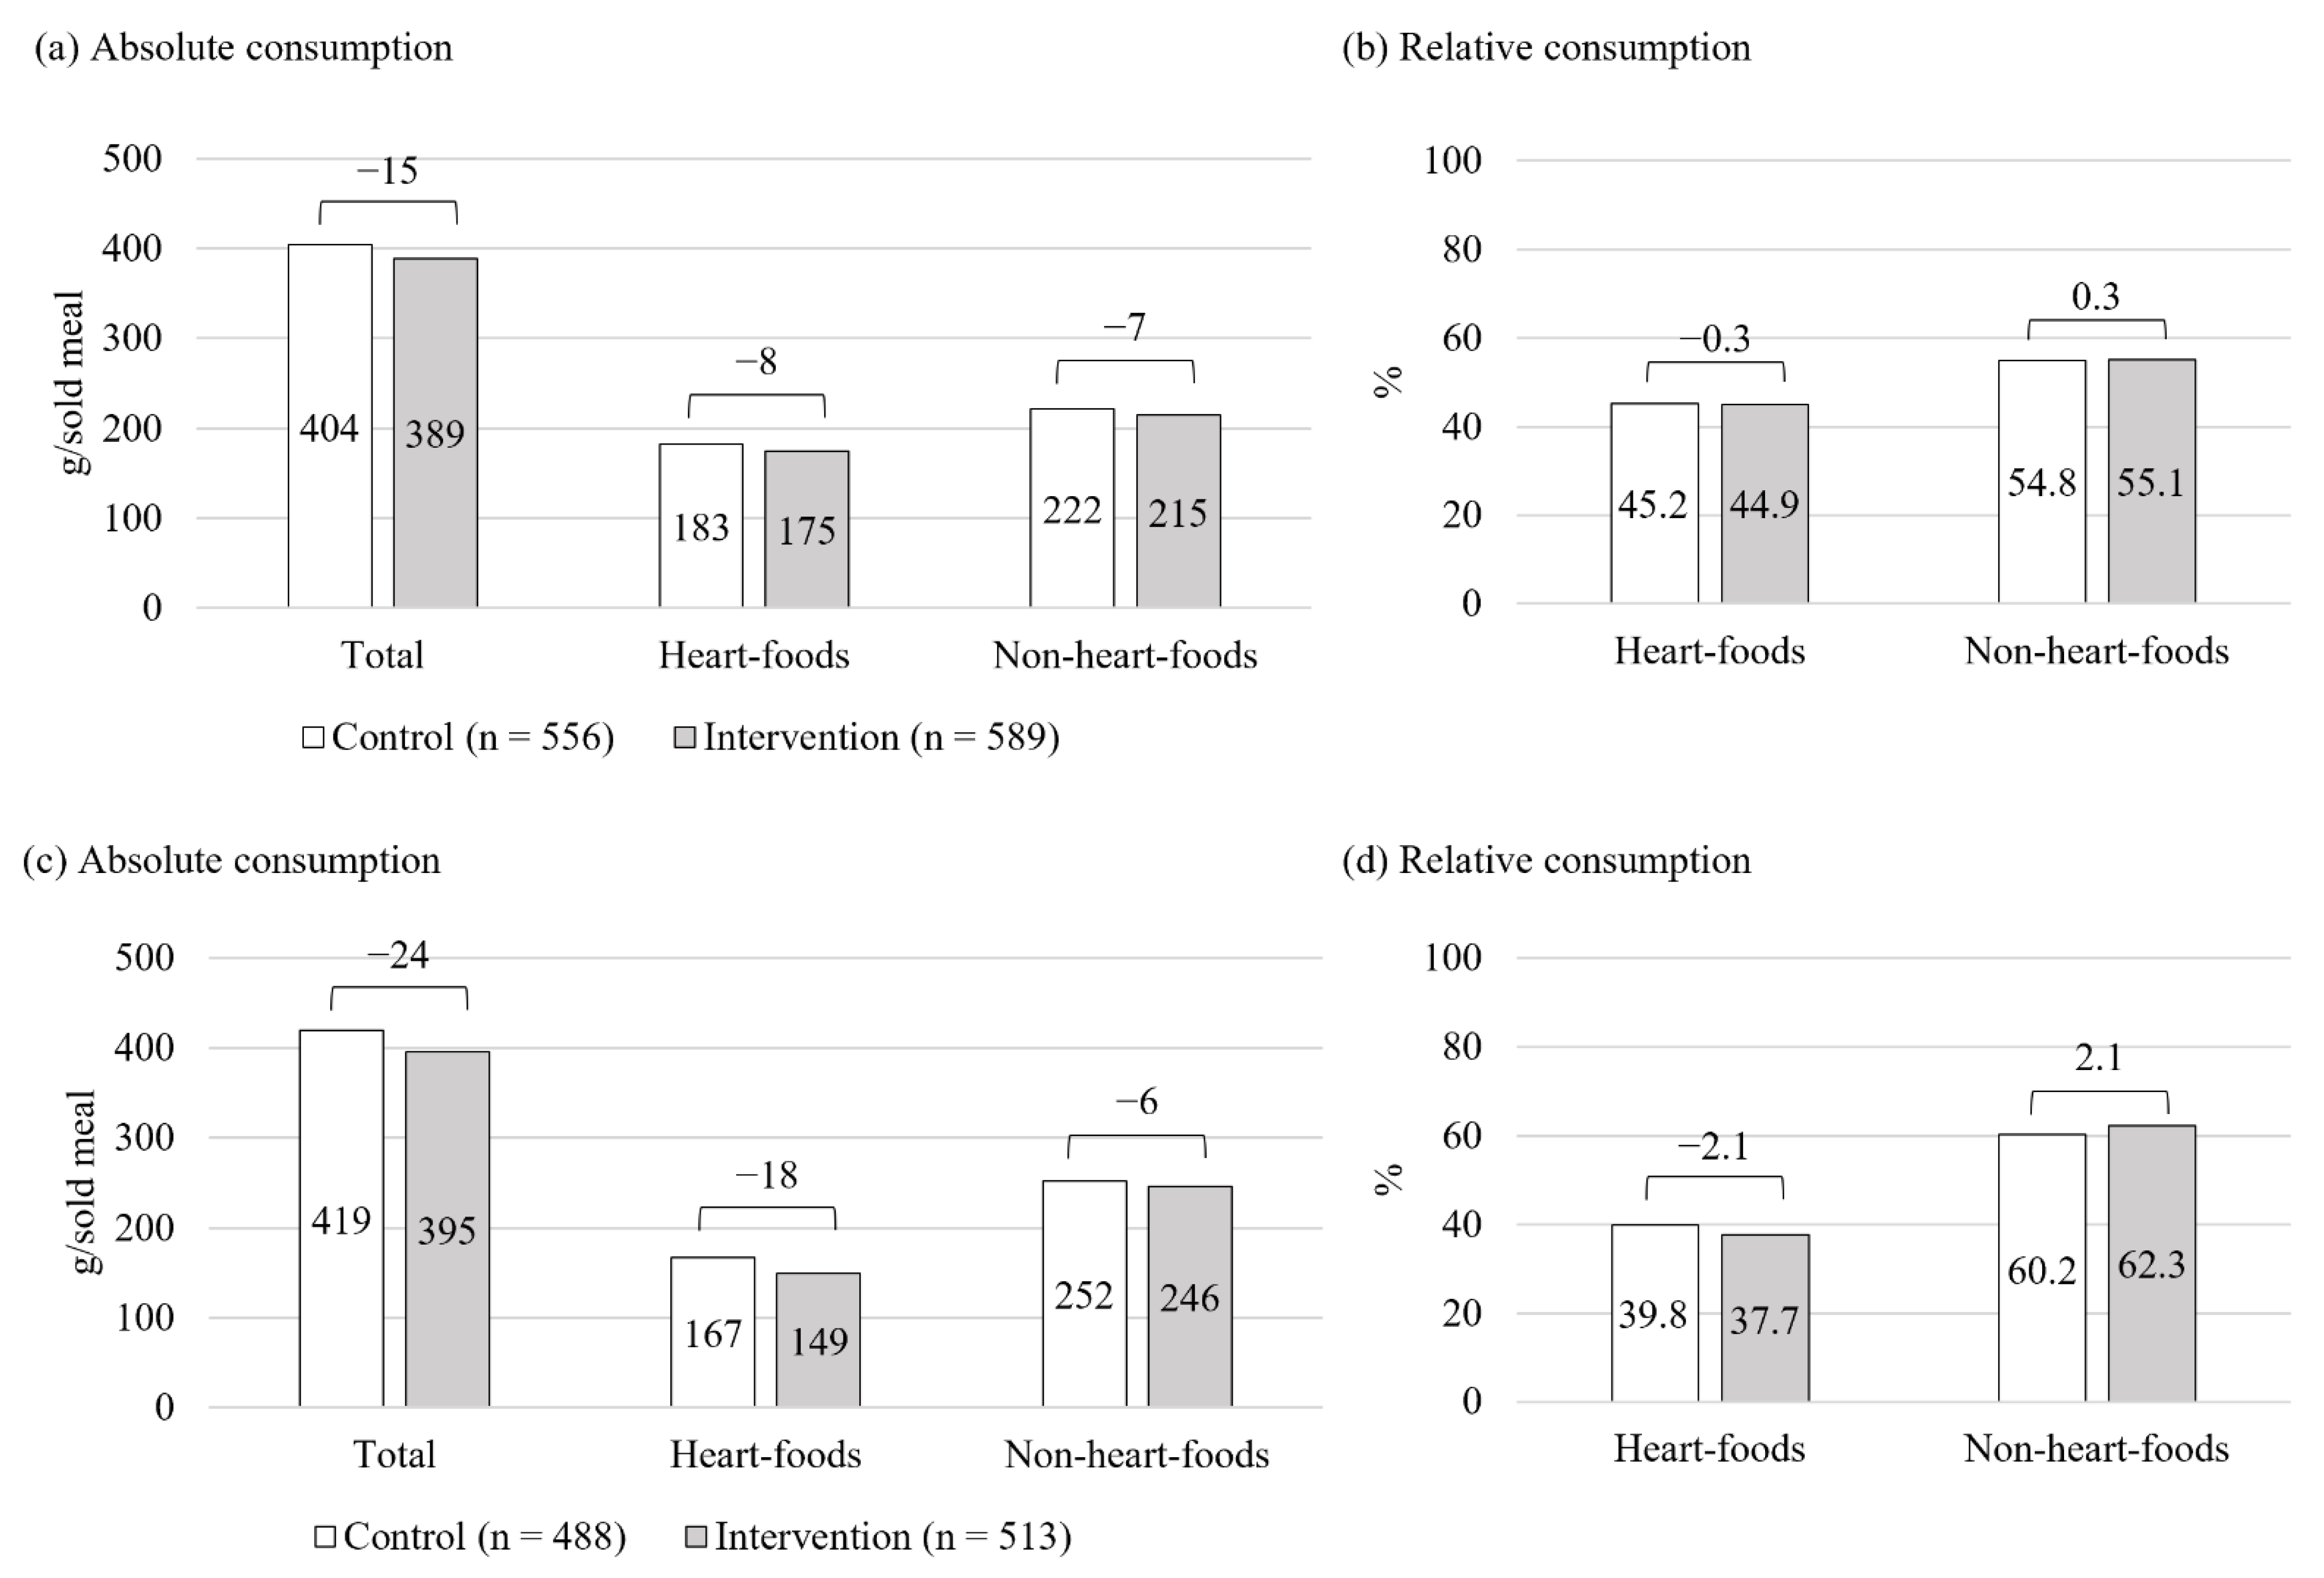
3.3. Cafeteria-Level Food Consumption
3.4. Perceived Influences on Food Choices
3.4.1. Sensory Appeal, Healthiness, Familiarity, and Particular Foods
3.4.2. Variation, Weight Control, and Menu
3.4.3. Further Factors
3.5. Self-Reported Observations and Understanding of the Heart Symbol
4. Discussion
4.1. Fixations on Heart-Symbol Materials and Foods
4.2. Food Choices and Consumption
4.3. Perceived Influences on Food Choices
4.4. Strengths and Limitations
4.5. Recommendations
5. Conclusions
Supplementary Materials
Author Contributions
Funding
Institutional Review Board Statement
Informed Consent Statement
Data Availability Statement
Acknowledgments
Conflicts of Interest
References
- Thaler, R.H.; Sunstein, C.R. Nudge: Improving Decisions about Health, Wealth, and Happiness; Penguin Books: London, UK, 2009; pp. 1–4. ISBN 9780300122237. [Google Scholar]
- Hansen, P.G. The Definition of Nudge and Libertarian Paternalism: Does the Hand Fit the Glove? Eur. J. Risk Regul. 2016, 7, 155–174. [Google Scholar] [CrossRef]
- Ensaff, H. A Nudge in the Right Direction: The Role of Food Choice Architecture in Changing Populations’ Diets. Proc. Nutr. Soc. 2021, 80, 195–206. [Google Scholar] [CrossRef] [PubMed]
- Valsta, L.; Kaartinen, N.; Tapanainen, H.; Männistö, S.; Sääksjärvi, K. Ravitsemus Suomessa—FinRavinto 2017—Tutkimus. Nutrition in Finland—The National FinDiet 2017 Survey; Report 12/2018; National Institute for Health and Welfare: Helsinki, Finland, 2018; ISBN 978-952-343-238-3. [Google Scholar]
- Thorndike, A.N.; Gelsomin, E.D.; McCurley, J.L.; Levy, D.E. Calories Purchased by Hospital Employees after Implementation of a Cafeteria Traffic Light-Labeling and Choice Architecture Program. JAMA Netw Open 2019, 2, e196789. [Google Scholar] [CrossRef] [PubMed]
- Naicker, A.; Shrestha, A.; Joshi, C.; Willett, W.; Spiegelman, D. Workplace Cafeteria and Other Multicomponent Interventions to Promote Healthy Eating among Adults: A Systematic Review. Prev. Med. Rep. 2021, 22, 101333. [Google Scholar] [CrossRef]
- OECD/EU. Health at a Glance: Europe 2016—State of Health in the EU Cycle; OECD Publishings: Paris, France, 2016; ISBN 9789264265585. [Google Scholar]
- Krekel, C.; Ward, G.; de Neve, J.-E. Employee Wellbeing, Productivity, and Firm Performance; Saïd Business School WP; Oxford University: Oxford, UK, 2019. [Google Scholar] [CrossRef]
- Cadario, R.; Chandon, P. Which Healthy Eating Nudges Work Best? A Meta-Analysis of Field Experiments. Mark. Sci. 2020, 39, 465–486. [Google Scholar] [CrossRef]
- Papies, E.K. Health Goal Priming as a Situated Intervention Tool: How to Benefit from Nonconscious Motivational Routes to Health Behaviour. Health Psychol. Rev. 2016, 10, 408–424. [Google Scholar] [CrossRef]
- Lobstein, T.; Neveux, M.; Landon, J. Costs, Equity and Acceptability of Three Policies to Prevent Obesity: A Narrative Review to Support Policy Development. Obes. Sci. Pr. 2020, 6, 562–583. [Google Scholar] [CrossRef]
- Shangguan, S.; Afshin, A.; Shulkin, M.; Ma, W.; Marsden, D.; Smith, J.; Saheb-Kashaf, M.; Shi, P.; Micha, R.; Imamura, F.; et al. A Meta-Analysis of Food Labeling Effects on Consumer Diet Behaviors and Industry Practices. Am. J. Prev. Med. 2019, 56, 300–314. [Google Scholar] [CrossRef]
- Bucher, T.; Collins, C.; Rollo, M.E.; McCaffrey, T.A.; de Vlieger, N.; van der Bend, D.; Truby, H.; Perez-Cueto, F.J.A. Nudging Consumers towards Healthier Choices: A Systematic Review of Positional Influences on Food Choice. Br. J. Nutr. 2016, 115, 2252–2263. [Google Scholar] [CrossRef]
- Hollands, G.J.; Carter, P.; Shemilt, I.; Marteau, T.M.; Jebb, S.A.; Higgins, J.; Ogilvie, D. Altering the Availability or Proximity of Food, Alcohol and Tobacco Products to Change Their Selection and Consumption. Cochrane Database Syst. Rev. 2019, 9, CD012573. [Google Scholar] [CrossRef]
- van der Laan, L.N.; Papies, E.K.; Hooge, I.T.C.; Smeets, P.A.M. Goal-Directed Visual Attention Drives Health Goal Priming: An Eye-Tracking Experiment. Health Psychol. 2017, 36, 82–90. [Google Scholar] [CrossRef] [PubMed]
- Bauer, J.M.; Reisch, L.A. Behavioural Insights and (Un)Healthy Dietary Choices: A Review of Current Evidence. J. Poet. Ther. 2019, 42, 3–45. [Google Scholar] [CrossRef]
- Hawkes, C.; Smith, T.G.; Jewell, J.; Wardle, J.; Hammond, R.A.; Friel, S.; Thow, A.M.; Kain, J. Smart Food Policies for Obesity Prevention. Lancet 2015, 385, 2410–2421. [Google Scholar] [CrossRef]
- Thorndike, A.N.; Sonnenberg, L.; Riis, J.; Barraclough, S.; Levy, D.E. A 2-Phase Labeling and Choice Architecture Intervention to Improve Healthy Food and Beverage Choices. Am. J. Public Health 2012, 102, 527–533. [Google Scholar] [CrossRef]
- Kongsbak, I.; Skov, L.R.; Nielsen, B.K.; Ahlmann, F.K.; Schaldemose, H.; Atkinson, L.; Wichmann, M.; Pérez-Cueto, F.J.A. Increasing Fruit and Vegetable Intake among Male University Students in an Ad Libitum Buffet Setting: A Choice Architectural Nudge Intervention. Food Qual. Prefer. 2016, 49, 183–188. [Google Scholar] [CrossRef]
- Rozin, P.; Scott, S.; Dingley, M.; Urbanek, J.K.; Jiang, H.; Kaltenbach, M. Nudge to Nobesity I: Minor Changes in Accessibility Decrease Food Intake. Judgm. Decis. Mak. 2011, 6, 323–332. [Google Scholar]
- van Trijp, H.C.M. Consumer Understanding and Nutritional Communication: Key Issues in the Context of the New EU Legislation. Eur. J. Nutr. 2009, 48, 41–48. [Google Scholar] [CrossRef] [PubMed]
- Bartels, M.; Tillack, K.; Jordan Lin, C.-T. Communicating Nutrition Information at the Point of Purchase: An Eye-Tracking Study of Shoppers at Two Grocery Stores in the United States. Int. J. Consum. Stud. 2018, 42, 557–565. [Google Scholar] [CrossRef]
- Strack, F.; Deutsch, R. Reflective and Impulsive Determinants of Social Behavior. Personal. Soc. Psychol. Rev. 2004, 8, 220–247. [Google Scholar] [CrossRef]
- Hofmann, W.; Friese, M.; Wiers, R.W. Impulsive versus Reflective Influences on Health Behavior: A Theoretical Framework and Empirical Review. Health Psychol. Rev. 2008, 2, 111–137. [Google Scholar] [CrossRef]
- Carins, J.E.; Rundle-Thiele, S.R.; Parkinson, J.E. Delivering Healthy Food Choice: A Dual-Process Model Enquiry. Soc. Mar. Q 2017, 23, 266–283. [Google Scholar] [CrossRef]
- Hoefkens, C.; Lachat, C.; Kolsteren, P.; van Camp, J.; Verbeke, W. Posting Point-Of-Purchase Nutrition Information in University Canteens Does Not Influence Meal Choice and Nutrient Intake. Am. J. Clin. Nutr. 2011, 94, 562–570. [Google Scholar] [CrossRef] [PubMed]
- Sproul, A.D.; Canter, D.D.; Schmidt, J.B. Does Point-Of-Purchase Nutrition Labeling Influence Meal Selections? A Test in an Army Cafeteria. Mil. Med. 2003, 168, 556–560. [Google Scholar] [CrossRef]
- van Kleef, E.; Otten, K.; van Trijp, H.C.M. Healthy Snacks at the Checkout Counter: A Lab and Field Study on the Impact of Shelf Arrangement and Assortment Structure on Consumer Choices. BMC Public Health 2012, 12, 1072–1082. [Google Scholar] [CrossRef] [PubMed]
- Vyth, E.L.; Steenhuis, I.H.M.; Heymans, M.W.; Roodenburg, A.J.C.; Brug, J.; Seidell, J.C. Influence of Placement of a Nutrition Logo on Cafeteria Menu Items on Lunchtime Food Choices at Dutch Work Sites. J. Am. Diet. Assoc. 2011, 111, 131–136. [Google Scholar] [CrossRef]
- Grunert, K.G.; Wills, J.M. A Review of European Research on Consumer Response to Nutrition Information on Food Labels. J. Public Health 2007, 15, 385–399. [Google Scholar] [CrossRef]
- de Ridder, D.; Kroese, F.; van Gestel, L. Nudgeability: Mapping Conditions of Susceptibility to Nudge Influence. Perspect. Psychol. Sci. 2022, 17, 346–359. [Google Scholar] [CrossRef]
- Sanjari, S.S.; Jahn, S.; Boztug, Y. Dual-Process Theory and Consumer Response to Front-Of-Package Nutrition Label Formats. Nutr. Rev. 2017, 75, 871–882. [Google Scholar] [CrossRef]
- Pérez-Edgar, K.; MacNeill, L.A.; Fu, X. Navigating Through the Experienced Environment: Insights From Mobile Eye Tracking. Curr. Dir. Psychol. Sci. 2020, 29, 286–292. [Google Scholar] [CrossRef]
- Grondin, S. Psychology of Perception; Springer International Publishing: Cham, Switzerland, 2016; p. 124. ISBN 978-3-319-31789-2. [Google Scholar]
- Bialkova, S.; van Trijp, H.C.M. An Efficient Methodology for Assessing Attention to and Effect of Nutrition Information Displayed Front-Of-Pack. Food Qual. Prefer. 2011, 22, 592–601. [Google Scholar] [CrossRef]
- Gidlöf, K.; Anikin, A.; Lingonblad, M.; Wallin, A. Looking Is Buying. How Visual Attention and Choice Are Affected by Consumer Preferences and Properties of the Supermarket Shelf. Appetite 2017, 116, 29–38. [Google Scholar] [CrossRef] [PubMed]
- Storcksdieck Genannt Bonsmann, S.; Marandola, G.; Ciriolo, E.; van Bavel, R.; Wollgast, J. Front-Of-Pack Nutrition Labelling Schemes: A Comprehensive Review; EUR 29811 EN; Publications Office of the European Union: Luxembourg, 2020. [Google Scholar] [CrossRef]
- Duchowski, A.T. Eye Tracking Methodology, 3rd ed.; Springer International Publishing: Cham, Switzerland, 2017; pp. 11–13, 141, 175. ISBN 978-3-319-57881-1. [Google Scholar]
- Rayner, K. Eye Movements in Reading and Information Processing: 20 Years of Research. Psychol. Bull. 1998, 124, 372–422. [Google Scholar] [CrossRef] [PubMed]
- Leigh, R.J.; Zee, D.S. A Survey of Eye Movements: Characteristics and Teleology. In The Neurology of Eye Movements; Leigh, R.J., Zee, D.S., Eds.; Oxford University Press: New York, NY, USA, 1999; pp. 3–18. [Google Scholar]
- McCamy, M.B.; Macknik, S.L.; Martinez-Conde, S. Natural Eye Movements and Vision. In The New Visual Neurosciences; Werner, J.S., Chalupa, L.M., Eds.; The MIT Press: Cambridge, MA, USA, 2014; pp. 849–863. [Google Scholar]
- Ma, G.; Zhuang, X. Nutrition Label Processing in the Past 10 Years: Contributions from Eye Tracking Approach. Appetite 2021, 156, 104859. [Google Scholar] [CrossRef] [PubMed]
- Bialkova, S.; Grunert, K.G.; Juhl, H.J.; Wasowicz-Kirylo, G.; Stysko-Kunkowska, M.; van Trijp, H.C.M. Attention Mediates the Effect of Nutrition Label Information on Consumers’ Choice: Evidence from a Choice Experiment Involving Eye-Tracking. Appetite 2014, 76, 66–75. [Google Scholar] [CrossRef]
- Bialkova, S.; Grunert, K.G.; van Trijp, H. From Desktop to Supermarket Shelf: Eye-Tracking Exploration on Consumer Attention and Choice. Food Qual. Prefer. 2020, 81, 103839. [Google Scholar] [CrossRef]
- Peschel, A.O.; Orquin, J.L.; Mueller Loose, S. Increasing Consumers’ Attention Capture and Food Choice through Bottom-Up Effects. Appetite 2019, 132, 1–7. [Google Scholar] [CrossRef] [PubMed]
- Puurtinen, M.; Hoppu, U.; Puputti, S.; Mattila, S.; Sandell, M. Investigating Visual Attention toward Foods in a Salad Buffet with Mobile Eye Tracking. Food Qual. Prefer. 2021, 93, 104290. [Google Scholar] [CrossRef]
- Fenko, A.; Nicolaas, I.; Galetzka, M. Does Attention to Health Labels Predict a Healthy Food Choice? An Eye-Tracking Study. Food Qual. Prefer. 2018, 69, 57–65. [Google Scholar] [CrossRef]
- Halcomb, E.J. Mixed Methods Research: The Issues beyond Combining Methods. J. Adv. Nurs. 2019, 75, 499–501. [Google Scholar] [CrossRef] [Green Version]
- Pihlajamäki, J.; Männikkö, R.; Tilles-Tirkkonen, T.; Karhunen, L.; Kolehmainen, M.; Schwab, U.; Lintu, N.; Paananen, J.; Järvenpää, R.; Harjumaa, M.; et al. Digitally Supported Program for Type 2 Diabetes Risk Identification and Risk Reduction in Real-World Setting: Protocol for the StopDia Model and Randomized Controlled Trial. BMC Public Health 2019, 19, 255. [Google Scholar] [CrossRef]
- The National Nutrition Council of Finland. The Finnish Nutrition Recommendations 2014, 4th ed.; The National Nutrition Council of Finland: Helsinki, Finland, 2014; ISBN 978-952-453-801-5. [Google Scholar]
- Lahti-Koski, M.; Helakorpi, S.; Olli, M.; Vartiainen, E.; Puska, P. Awareness and Use of the Heart Symbol by Finnish Consumers. Public Health Nutr. 2012, 15, 476–482. [Google Scholar] [CrossRef] [PubMed]
- Derrick, B.; Dobson-Mckittrick, A.; Toher, D.; White, P. Test Statistics for Comparing Two Proportions with Partially Overlapping Samples. J. Appl. Quant. Methods 2015, 10, 1–14. [Google Scholar]
- Derrick, B.; Toher, D.; White, P. How to Compare the Means of Two Samples That Include Paired Observations and Independent Observations: A Companion to Derrick, Russ, Toher and White (2017). Quant. Method Psychol. 2017, 13, 120–126. [Google Scholar] [CrossRef]
- Derrick, B.; White, P.; Toher, D. Parametric and Non-Parametric Tests for the Comparison of Two Samples Which Both Include Paired and Unpaired Observations. J. Mod. Appl. Stat. Methods 2020, 18, 2–23. [Google Scholar] [CrossRef]
- Derrick, B.; Russ, B.; Toher, D.; White, P. Test Statistics for the Comparison of Means for Two Samples That Include Both Paired and Independent Observations. J. Mod. Appl. Stat. Methods 2017, 16, 137–157. [Google Scholar] [CrossRef]
- Durlak, J.A.; DuPre, E.P. Implementation Matters: A Review of Research on the Influence of Implementation on Program Outcomes and the Factors Affecting Implementation. Am. J. Community Psychol. 2008, 41, 327–350. [Google Scholar] [CrossRef]
- SensoMotoric Instruments GmbH. IViewETG User Guide: Version 2.7.1; SensoMotoric Instruments GmbH: Teltow/Berlin, Germany, 2016. [Google Scholar]
- SensoMotoric Instruments GmbH. BeGaze Manual: Version 3.4; SensoMotoric Instruments GmbH: Teltow, Germany, 2014. [Google Scholar]
- Salvucci, D.D.; Goldberg, J.H. Identifying Fixations and Saccades in Eye-Tracking Protocols. In Proceedings of the 2000 Symposium on Eye Tracking Research & Applications (ETRA ’00), New York, NY, USA, 6–8 November 2000; pp. 71–78. [Google Scholar] [CrossRef]
- Ng, A.; Reddy, M.; Zalta, A.K.; Schueller, S.M. Veterans’ Perspectives on Fitbit Use in Treatment for Post-Traumatic Stress Disorder: An Interview Study. JMIR Ment. Health 2018, 5, e10415. [Google Scholar] [CrossRef]
- Borghouts, J.; Eikey, E.; Mark, G.; de Leon, C.; Schueller, S.M.; Schneider, M.; Stadnick, N.; Zheng, K.; Mukamel, D.; Sorkin, D.H. Barriers to and Facilitators of User Engagement with Digital Mental Health Interventions: Systematic Review. J. Med. Internet Res. 2021, 23, e24387. [Google Scholar] [CrossRef]
- Derrick, B.; Ruck, A.; Toher, D.; White, P. Tests for Equality of Variances between Two Samples Which Contain Both Paired Observations and Independent Observations. J. Appl. Quant. Methods 2018, 13, 36–47. [Google Scholar]
- R Core Team. R: A Language and Environment for Statistical Computing, version 4.2.1; R Foundation for Statistical Computing: Vienna, Austria, 2022; Available online: https://www.R-project.org/ (accessed on 5 August 2022).
- Derrick, B. Partiallyoverlapping: Partially Overlapping Samples Tests, R Package, version 2.0. 2018. Available online: https://CRAN.R-project.org/package=Partiallyoverlapping (accessed on 5 August 2022).
- Elo, S.; Kyngäs, H. The Qualitative Content Analysis Process. J. Adv. Nurs. 2008, 62, 107–115. [Google Scholar] [CrossRef]
- Steptoe, A.; Pollard, T.M.; Wardle, J. Development of a Measure of the Motives Underlying the Selection of Food: The Food Choice Questionnaire. Appetite 1995, 25, 267–284. [Google Scholar] [CrossRef] [PubMed]
- Cunha, L.M.; Cabral, D.; Moura, A.P.; de Almeida, M.D.V. Application of the Food Choice Questionnaire across Cultures: Systematic Review of Cross-Cultural and Single Country Studies. Food Qual. Prefer. 2018, 64, 21–36. [Google Scholar] [CrossRef]
- McCrae, R.R.; Costa, P.T. The NEO Personality Inventory: Using the Five-Factor ModeI in Counseling. J. Couns. Dev. 1991, 69, 367–372. [Google Scholar] [CrossRef]
- Greene, R.L.; Weiner, I.B. NEO Personality Inventory-3. In Handbook of Personality Assessment; John Wiley & Sons, Incorporated: Hoboken, NJ, USA, 2017; Volume 2, pp. 287–307. ISBN 9781119258896. [Google Scholar]
- Littlewood, J.A.; Lourenço, S.; Iversen, C.L.; Hansen, G.L. Menu Labelling Is Effective in Reducing Energy Ordered and Consumed: A Systematic Review and Meta-Analysis of Recent Studies. Public Health Nutr. 2016, 19, 2106–2121. [Google Scholar] [CrossRef]
- Campos, S.; Doxey, J.; Hammond, D. Nutrition Labels on Pre-Packaged Foods: A Systematic Review. Public Health Nutr. 2011, 14, 1496–1506. [Google Scholar] [CrossRef] [PubMed]
- van Herpen, E.; van Trijp, H.C.M. Front-Of-Pack Nutrition Labels. Their Effect on Attention and Choices When Consumers Have Varying Goals and Time Constraints. Appetite 2011, 57, 148–160. [Google Scholar] [CrossRef] [PubMed]
- Muller, L.; Prevost, M. What Cognitive Sciences Have to Say about the Impacts of Nutritional Labelling Formats. J. Econ. Psychol. 2016, 55, 17–29. [Google Scholar] [CrossRef]
- Melendrez-Ruiz, J.; Dujourdy, L.; Goisbault, I.; Charrier, J.C.; Pagnat, K.; Nicklaus, S.; Arvisenet, G.; Chambaron, S. “You Look at It, but Will You Choose It”: Is There a Link between the Foods Consumers Look at and What They Ultimately Choose in a Virtual Supermarket? Food Qual. Prefer. 2022, 98, 104510. [Google Scholar] [CrossRef]
- Wilson, A.L.; Buckley, E.; Buckley, J.D.; Bogomolova, S. Nudging Healthier Food and Beverage Choices through Salience and Priming. Evidence from a Systematic Review. Food Qual. Prefer. 2016, 51, 47–64. [Google Scholar] [CrossRef]
- Grunert, K.G.; Fernández-Celemín, L.; Wills, J.M.; Bonsmann, S.S.G.; Nureeva, L. Use and Understanding of Nutrition Information on Food Labels in Six European Countries. J. Public Health 2010, 18, 261–277. [Google Scholar] [CrossRef] [Green Version]
- Mai, R.; Hoffmann, S. How to Combat the Unhealthy = Tasty Intuition: The Influencing Role of Health Consciousness. J. Public Policy Mark. 2015, 34, 63–83. [Google Scholar] [CrossRef]
- Harbers, M.C.; Middel, C.N.H.; Stuber, J.M.; Beulens, J.W.J.; Rutters, F.; van der Schouw, Y.T. Determinants of Food Choice and Perceptions of Supermarket-Based Nudging Interventions among Adults with Low Socioeconomic Position: The SUPREME NUDGE Project. Int. J. Environ. Res. Public Health 2021, 18, 6175. [Google Scholar] [CrossRef] [PubMed]
- Bauer, J.M.; Bietz, S.; Rauber, J.; Reisch, L.A. Nudging Healthier Food Choices in a Cafeteria Setting: A Sequential Multi-Intervention Field Study. Appetite 2021, 160, 105106. [Google Scholar] [CrossRef] [PubMed]
- Konttinen, H.; Halmesvaara, O.; Fogelholm, M.; Saarijärvi, H.; Nevalainen, J.; Erkkola, M. Sociodemographic Differences in Motives for Food Selection: Results from the LoCard Cross-Sectional Survey. Int. J. Behav. Nutr. Phys. Act. 2021, 18, 71. [Google Scholar] [CrossRef] [PubMed]
- Lally, P.; Gardner, B. Promoting Habit Formation. Health Psychol. Rev. 2013, 7, S137–S158. [Google Scholar] [CrossRef]
- Gollwitzer, P.M.; Sheeran, P. Implementation Intentions and Goal Achievement: A Meta-Analysis of Effects and Processes. Adv. Exp. Soc. Psychol. 2006, 38, 69–119. [Google Scholar] [CrossRef]
- Roberts, S.B.; Das, S.K.; Suen, V.M.M.; Pihlajamäki, J.; Kuriyan, R.; Steiner-Asiedu, M.; Taetzsch, A.; Anderson, A.K.; E Silver, R.; Barger, K.; et al. Measured Energy Content of Frequently Purchased Restaurant Meals: Multi-Country Cross Sectional Study. BMJ 2018, 363, k4864. [Google Scholar] [CrossRef]
- Raulio, S.; Roos, E.; Ovaskainen, M.-L.; Prättälä, R. Food Use and Nutrient Intake at Worksite Canteen or in Packed Lunches at Work among Finnish Employees. J. Foodserv. 2009, 20, 330–341. [Google Scholar] [CrossRef]
- Raulio, S.; Roos, E.; Prättälä, R. School and Workplace Meals Promote Healthy Food Habits. Public Health Nutr. 2010, 13, 987–992. [Google Scholar] [CrossRef]
- Roos, E.; Sarlio-Lähteenkorva, S.; Lallukka, T. Having Lunch at a Staff Canteen Is Associated with Recommended Food Habits. Public Health Nutr. 2004, 7, 53–61. [Google Scholar] [CrossRef] [Green Version]
- Rantala, E.; Balatsas-Lekkas, A.; Sozer, N.; Pennanen, K. Overview of Objective Measurement Technologies for Nutrition Research, Food-Related Consumer and Marketing Research. Trends Food Sci. Technol. 2022, 125, 100–113. [Google Scholar] [CrossRef]
- Rantala, E.; Vanhatalo, S.; Tilles-Tirkkonen, T.; Kanerva, M.; Hansen, P.G.; Kolehmainen, M.; Männikkö, R.; Lindström, J.; Pihlajamäki, J.; Poutanen, K.; et al. Choice Architecture Cueing to Healthier Dietary Choices and Physical Activity at the Workplace: Implementation and Feasibility Evaluation. Nutrients 2021, 13, 3592. [Google Scholar] [CrossRef] [PubMed]


| Analysis | Data | n Control + Intervention |
|---|---|---|
| Fixations on Heart-symbol materials and foods | Eye tracking | 17 + 17 1 |
| Food choices | Eye tracking | 22 + 19 2 |
| Perceived influences on food choices | Interview | 22 + 19 2 |
| Self-reported observations and understanding of the Heart symbol | Interview | 22 + 19 2 |
| Cafeteria-level food consumption | Food consumption | 556 + 589 meals sold |
| Element | Description | Control | Intervention |
|---|---|---|---|
| Standard nutrition information | Heart-food main course options indicated with tiny black-and-white Heart symbols (font size ~8 pt.) next to allergen information on menu boards (size A4) at the cafeteria entrance and on the serving line. | x | x 1 |
| Pre-packaged heart-food items such as salad dressings featured small front-of-pack or back-of-pack Heart symbols. Seeing the symbols required lifting the products up from the serving line and reviewing product information. | x | x 1 | |
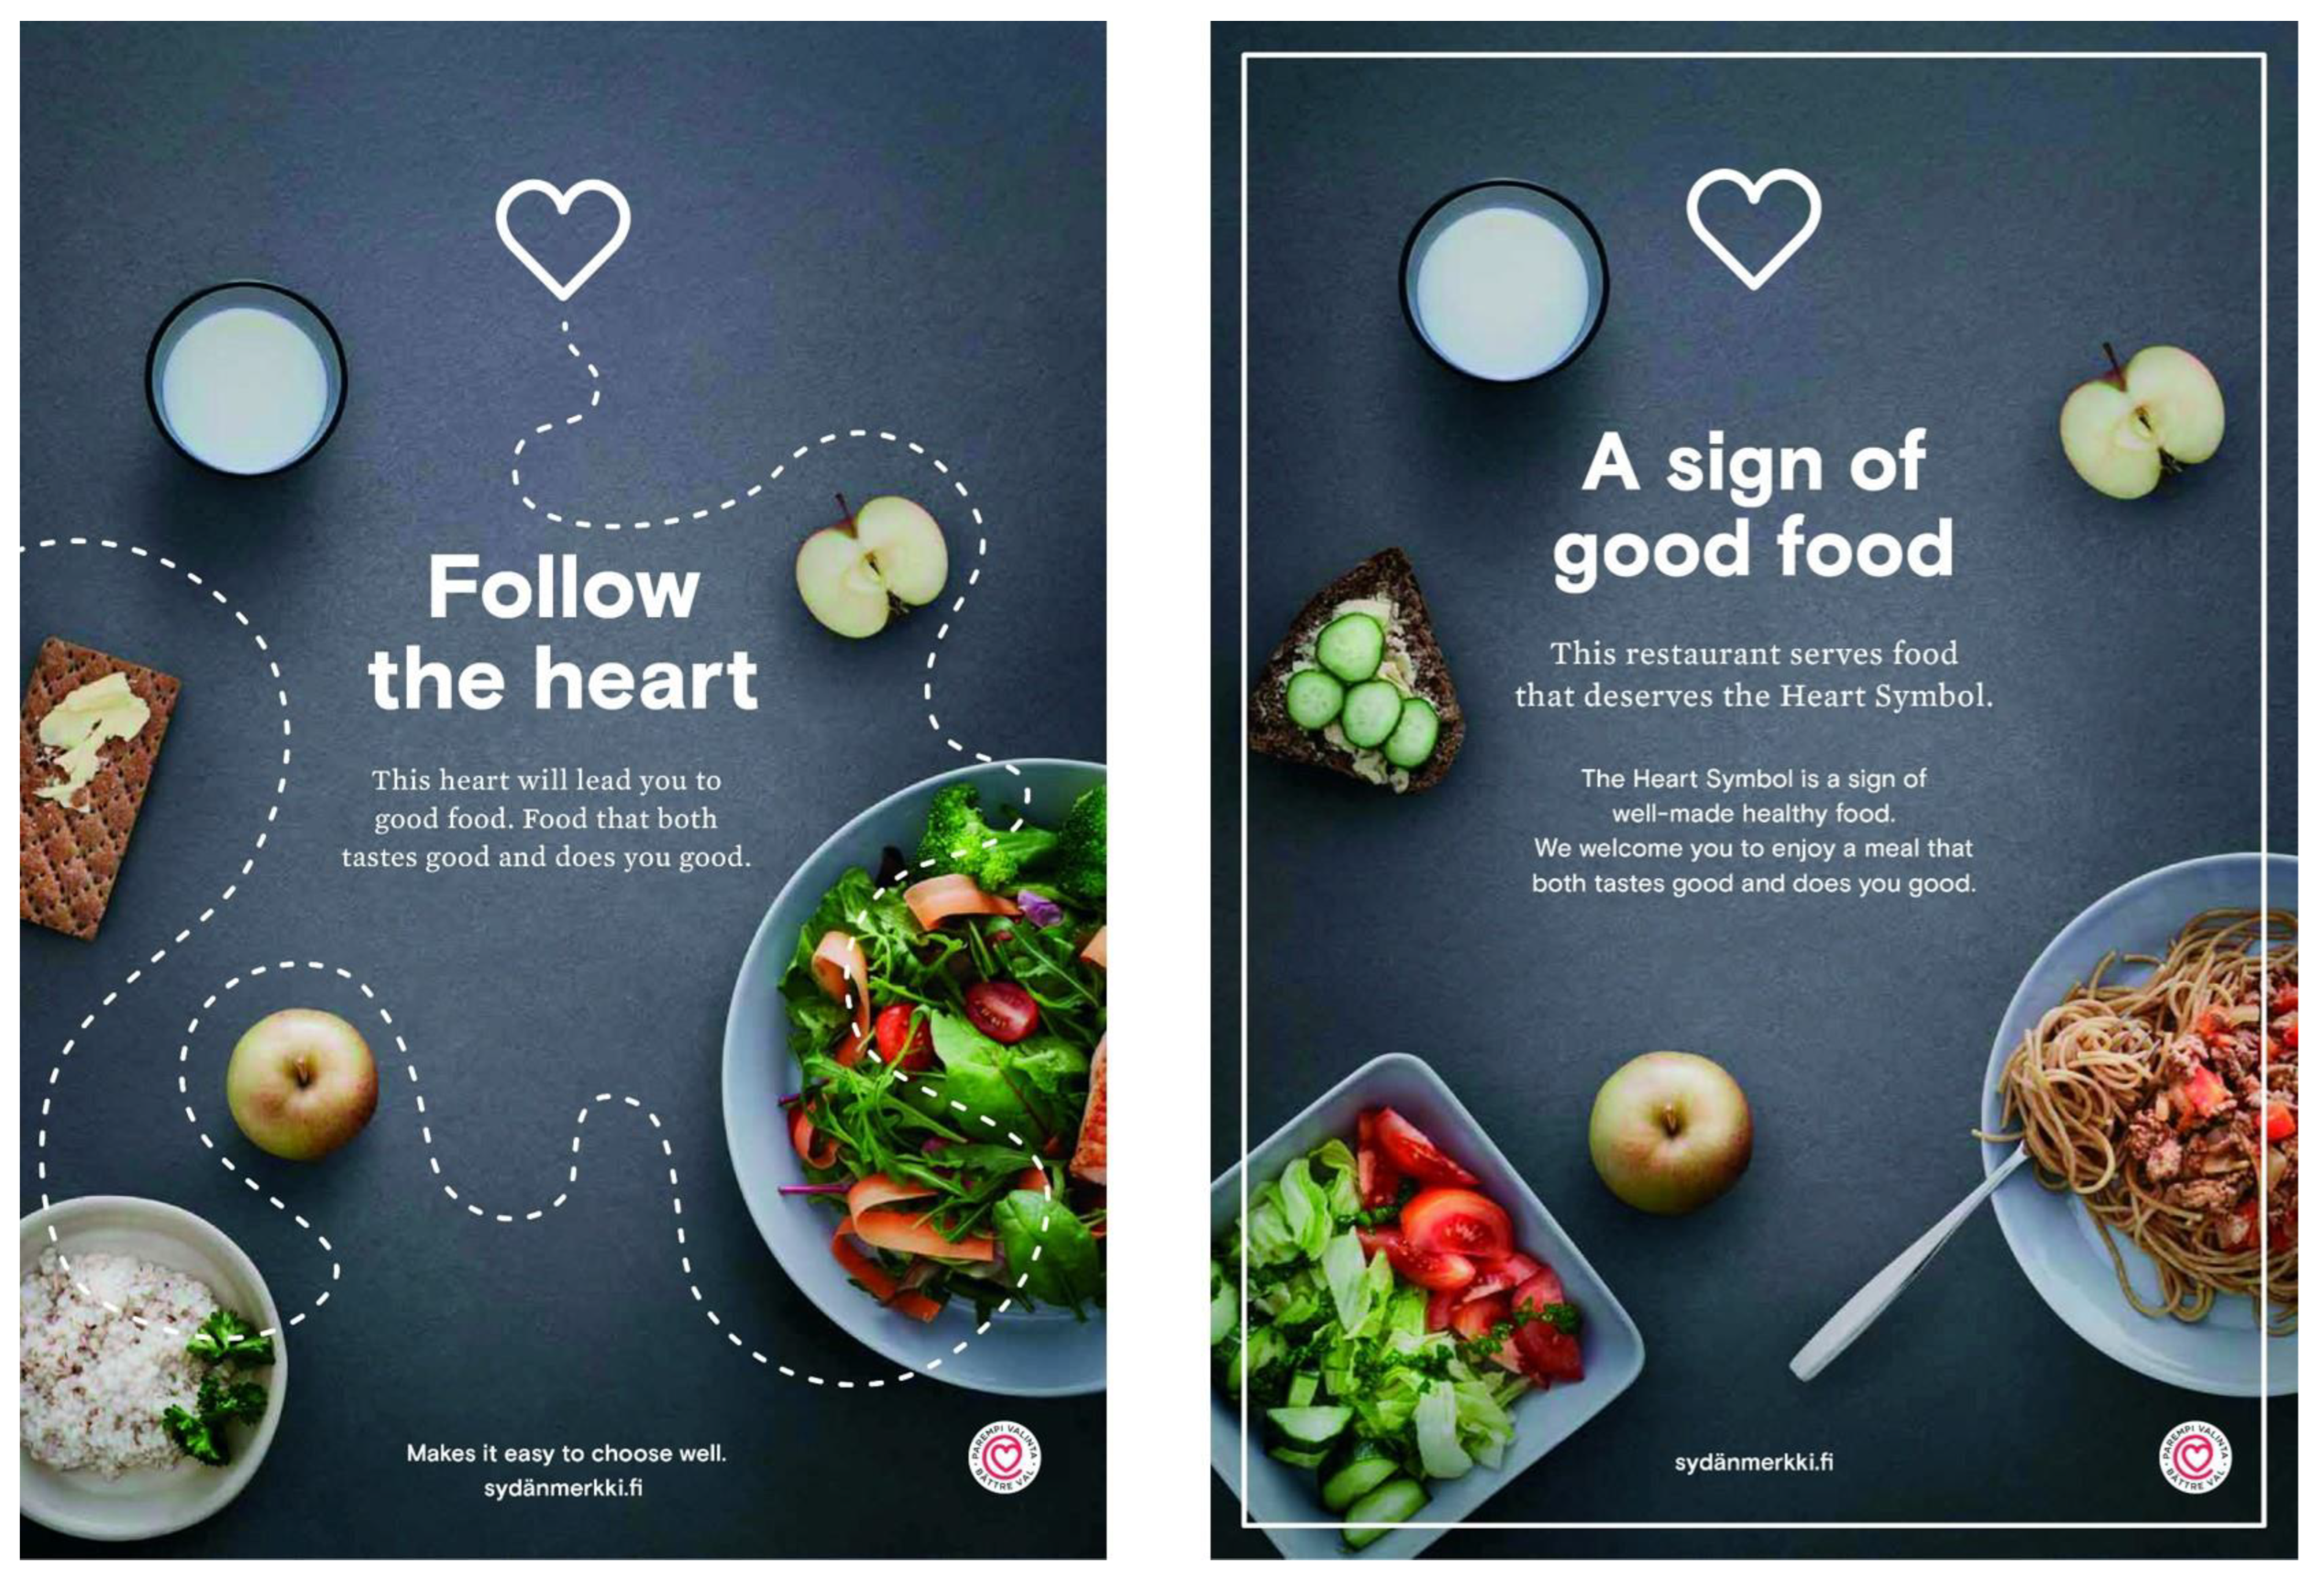
| Priming | Heart-foods promoted with posters (size A4–A3) at the cafeteria entrance and on two sides of a pillar at the end of serving line stretch #1. Each poster featured one of two slogans: “Follow the heart” or “A sign of good food”. | x | |
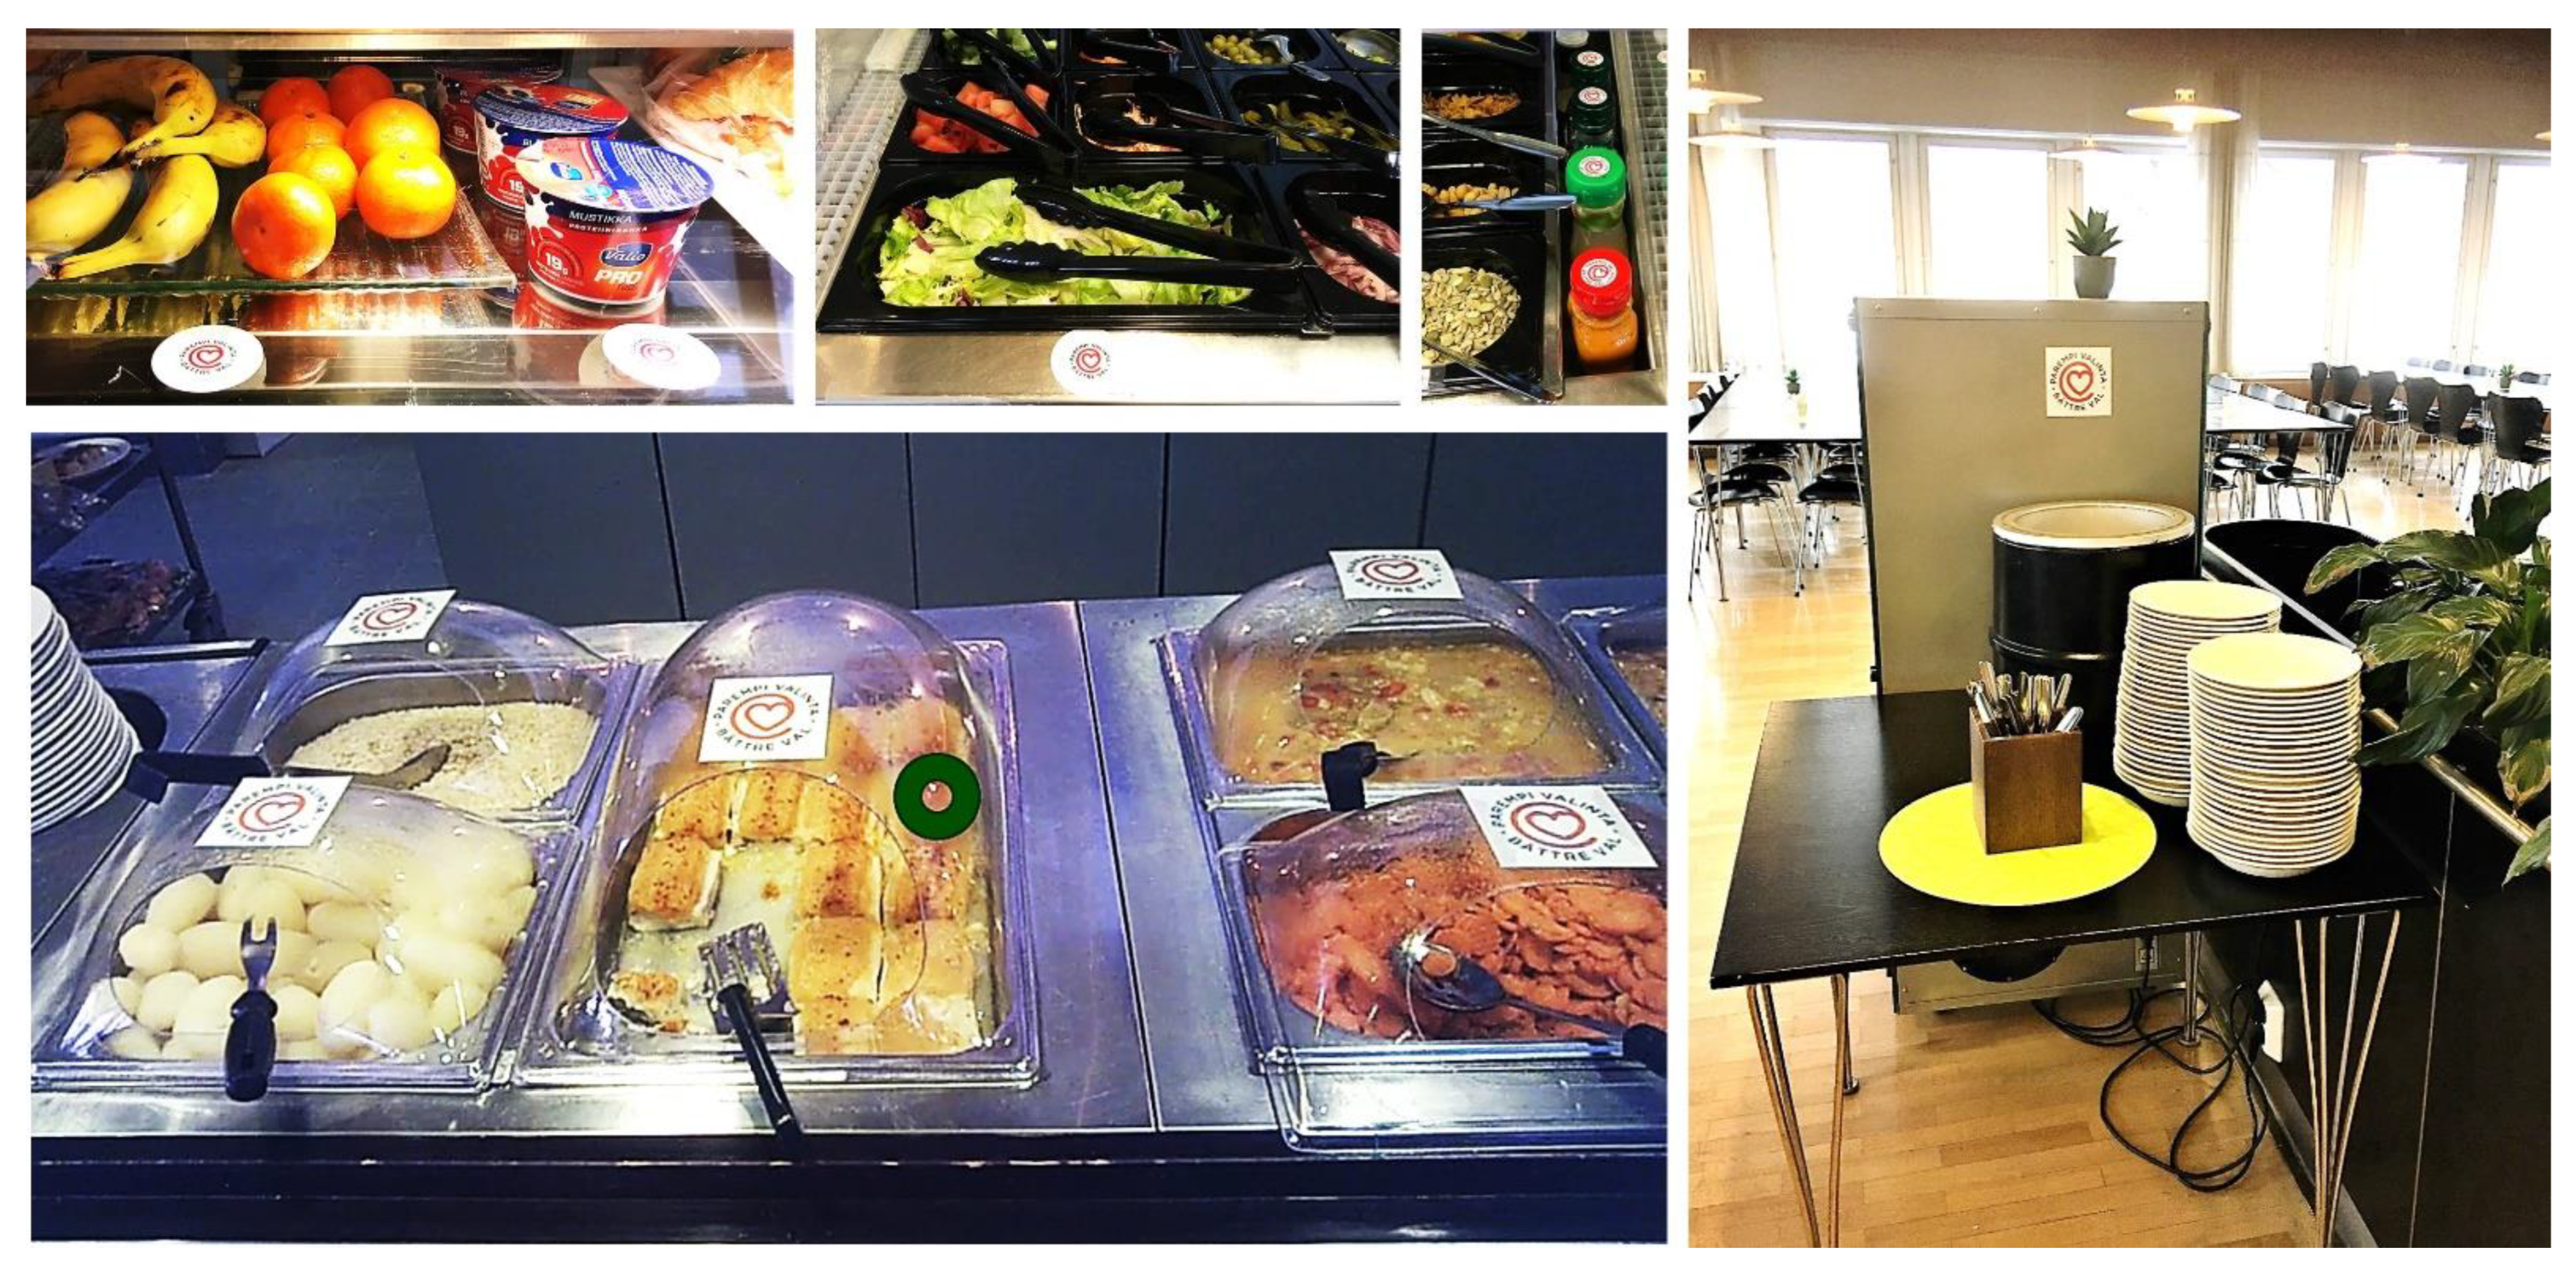
| Prominent point-of-choice nutrition labels | Heart-foods and salad-bar notices (size A4) labelled with up to 10 × 10 cm Heart symbols on the serving line. | x | |
| Placement | Heart-foods placed first in line and towards the front row, non-heart-foods last in line and towards the back row within product categories (i.e., snacks, salad components, salad dressings, warm courses, breads, and beverages). Heart-food snack options lifted at the eye level. | x |
| Fixation Target | Control | Intervention | Difference | ||||||
|---|---|---|---|---|---|---|---|---|---|
| Mean 1 | SD | Range | Mean 1 | SD | Range | Mean | 95% CI | p2 | |
| Heart-symbol materials | |||||||||
| % n | na | na | na | 12.89 | 7.46 | 3.77–27.27 | na | na | na |
| % duration | na | na | na | 13.48 | 7.39 | 4.18–27.86 | na | na | na |
| Heart-foods | |||||||||
| % n | 60.79 | 23.14 | 11.76–100 | 57.81 | 20.02 | 16.67–85.00 | 2.98 | −12.88, 18.85 | 0.702 |
| % duration | 60.68 | 23.53 | 9.52–100 | 57.47 | 20.00 | 21.74–87.75 | 3.21 | −13.06, 19.49 | 0.688 |
| Non-heart-foods | |||||||||
| % n | 41.96 | 23.38 | 0.00–88.24 | 47.60 | 23.16 | 12.50–100 | −5.63 | −22.06, 10.79 | 0.486 |
| % duration | 42.31 | 23.92 | 0.00–90.48 | 48.27 | 23.47 | 10.67–100 | −5.95 | −22.82, 10.92 | 0.474 |
| Food Items Chosen | Control | Intervention | Difference | ||||
|---|---|---|---|---|---|---|---|
| Median | IQR | Range | Median | IQR | Range | p1 | |
| All participants | |||||||
| Total n | 3 | 2 | 1–10 | 3 | 3 | 1–13 | 0.941 |
| Heart-foods n | 1 | 3 | 0–9 | 1 | 2 | 0–13 | 0.582 |
| Heart-foods % total | 33.3 | 78.8 | 0–100 | 66.7 | 75.0 | 0–100 | 0.261 |
| Non-heart-foods n | 1 | 1 | 0–4 | 1 | 2 | 0–3 | 0.163 |
| Non-heart-foods % total | 66.7 | 78.8 | 0–100 | 33.3 | 75.0 | 0–100 | 0.261 |
| Without salad-bar choosers | |||||||
| Total n | 3 | 3 | 1–5 | 3 | 3 | 1–4 | 0.540 |
| Heart-foods n | 1 | 3 | 0–3 | 1 | 2 | 0–3 | 0.846 |
| Heart-foods % total | 33.3 | 72.9 | 0–100 | 50.0 | 68.8 | 0–100 | 0.366 |
| Non-heart-foods n | 1.5 | 1 | 0–4 | 1 | 1 | 0–3 | 0.314 |
| Non-heart-foods % total | 66.7 | 72.9 | 0–100 | 50.0 | 68.8 | 0–100 | 0.366 |
| Influence | Control | Intervention | Total |
|---|---|---|---|
| Sensory appeal | 17 (77) | 11 (58) | 25 (74) |
| Healthiness | 13 (59) | 9 (47) | 17 (50) |
| Familiarity | 12 (55) | 8 (42) | 17 (50) |
| Particular foods | 10 (45) | 9 (47) | 17 (50) |
| Variation | 6 (27) | 5 (26) | 11 (32) |
| Weight control | 6 (27) | 3 (16) | 9 (26) |
| Menu | 8 (36) | 1 (5) | 9 (26) |
| Satiety | 6 (27) | 3 (16) | 7 (21) |
| Mood | 4 (18) | 4 (21) | 7 (21) |
| Special diet | 2 (9) | 4 (21) | 6 (18) |
| Food quality | 3 (14) | 1 (5) | 4 (12) |
| Convenience | 2 (2) | 2 (11) | 4 (12) |
| Price | 1 (5) | 2 (11) | 3 (9) |
| Season | 2 (9) | 1 (5) | 3 (9) |
| Social influence | 1 (5) | 1 (5) | 2 (6) |
| Natural content | 1 (5) | 1 (5) | 2 (6) |
| Ethical concern | 1 (5) | 0 (0) | 1 (3) |
Publisher’s Note: MDPI stays neutral with regard to jurisdictional claims in published maps and institutional affiliations. |
© 2022 by the authors. Licensee MDPI, Basel, Switzerland. This article is an open access article distributed under the terms and conditions of the Creative Commons Attribution (CC BY) license (https://creativecommons.org/licenses/by/4.0/).
Share and Cite
Rantala, E.; Järvelä-Reijonen, E.; Pettersson, K.; Laine, J.; Vartiainen, P.; Närväinen, J.; Pihlajamäki, J.; Poutanen, K.; Absetz, P.; Karhunen, L. Sensory Appeal and Routines Beat Health Messages and Visibility Enhancements: Mixed-Methods Analysis of a Choice-Architecture Intervention in a Workplace Cafeteria. Nutrients 2022, 14, 3731. https://doi.org/10.3390/nu14183731
Rantala E, Järvelä-Reijonen E, Pettersson K, Laine J, Vartiainen P, Närväinen J, Pihlajamäki J, Poutanen K, Absetz P, Karhunen L. Sensory Appeal and Routines Beat Health Messages and Visibility Enhancements: Mixed-Methods Analysis of a Choice-Architecture Intervention in a Workplace Cafeteria. Nutrients. 2022; 14(18):3731. https://doi.org/10.3390/nu14183731
Chicago/Turabian StyleRantala, Eeva, Elina Järvelä-Reijonen, Kati Pettersson, Janne Laine, Paula Vartiainen, Johanna Närväinen, Jussi Pihlajamäki, Kaisa Poutanen, Pilvikki Absetz, and Leila Karhunen. 2022. "Sensory Appeal and Routines Beat Health Messages and Visibility Enhancements: Mixed-Methods Analysis of a Choice-Architecture Intervention in a Workplace Cafeteria" Nutrients 14, no. 18: 3731. https://doi.org/10.3390/nu14183731
APA StyleRantala, E., Järvelä-Reijonen, E., Pettersson, K., Laine, J., Vartiainen, P., Närväinen, J., Pihlajamäki, J., Poutanen, K., Absetz, P., & Karhunen, L. (2022). Sensory Appeal and Routines Beat Health Messages and Visibility Enhancements: Mixed-Methods Analysis of a Choice-Architecture Intervention in a Workplace Cafeteria. Nutrients, 14(18), 3731. https://doi.org/10.3390/nu14183731