
Mediterranean Diet and White Matter Hyperintensity Change over Time in Cognitively Intact Adults

 , ,
, ,
Abstract
1. Introduction
2. Materials and Methods
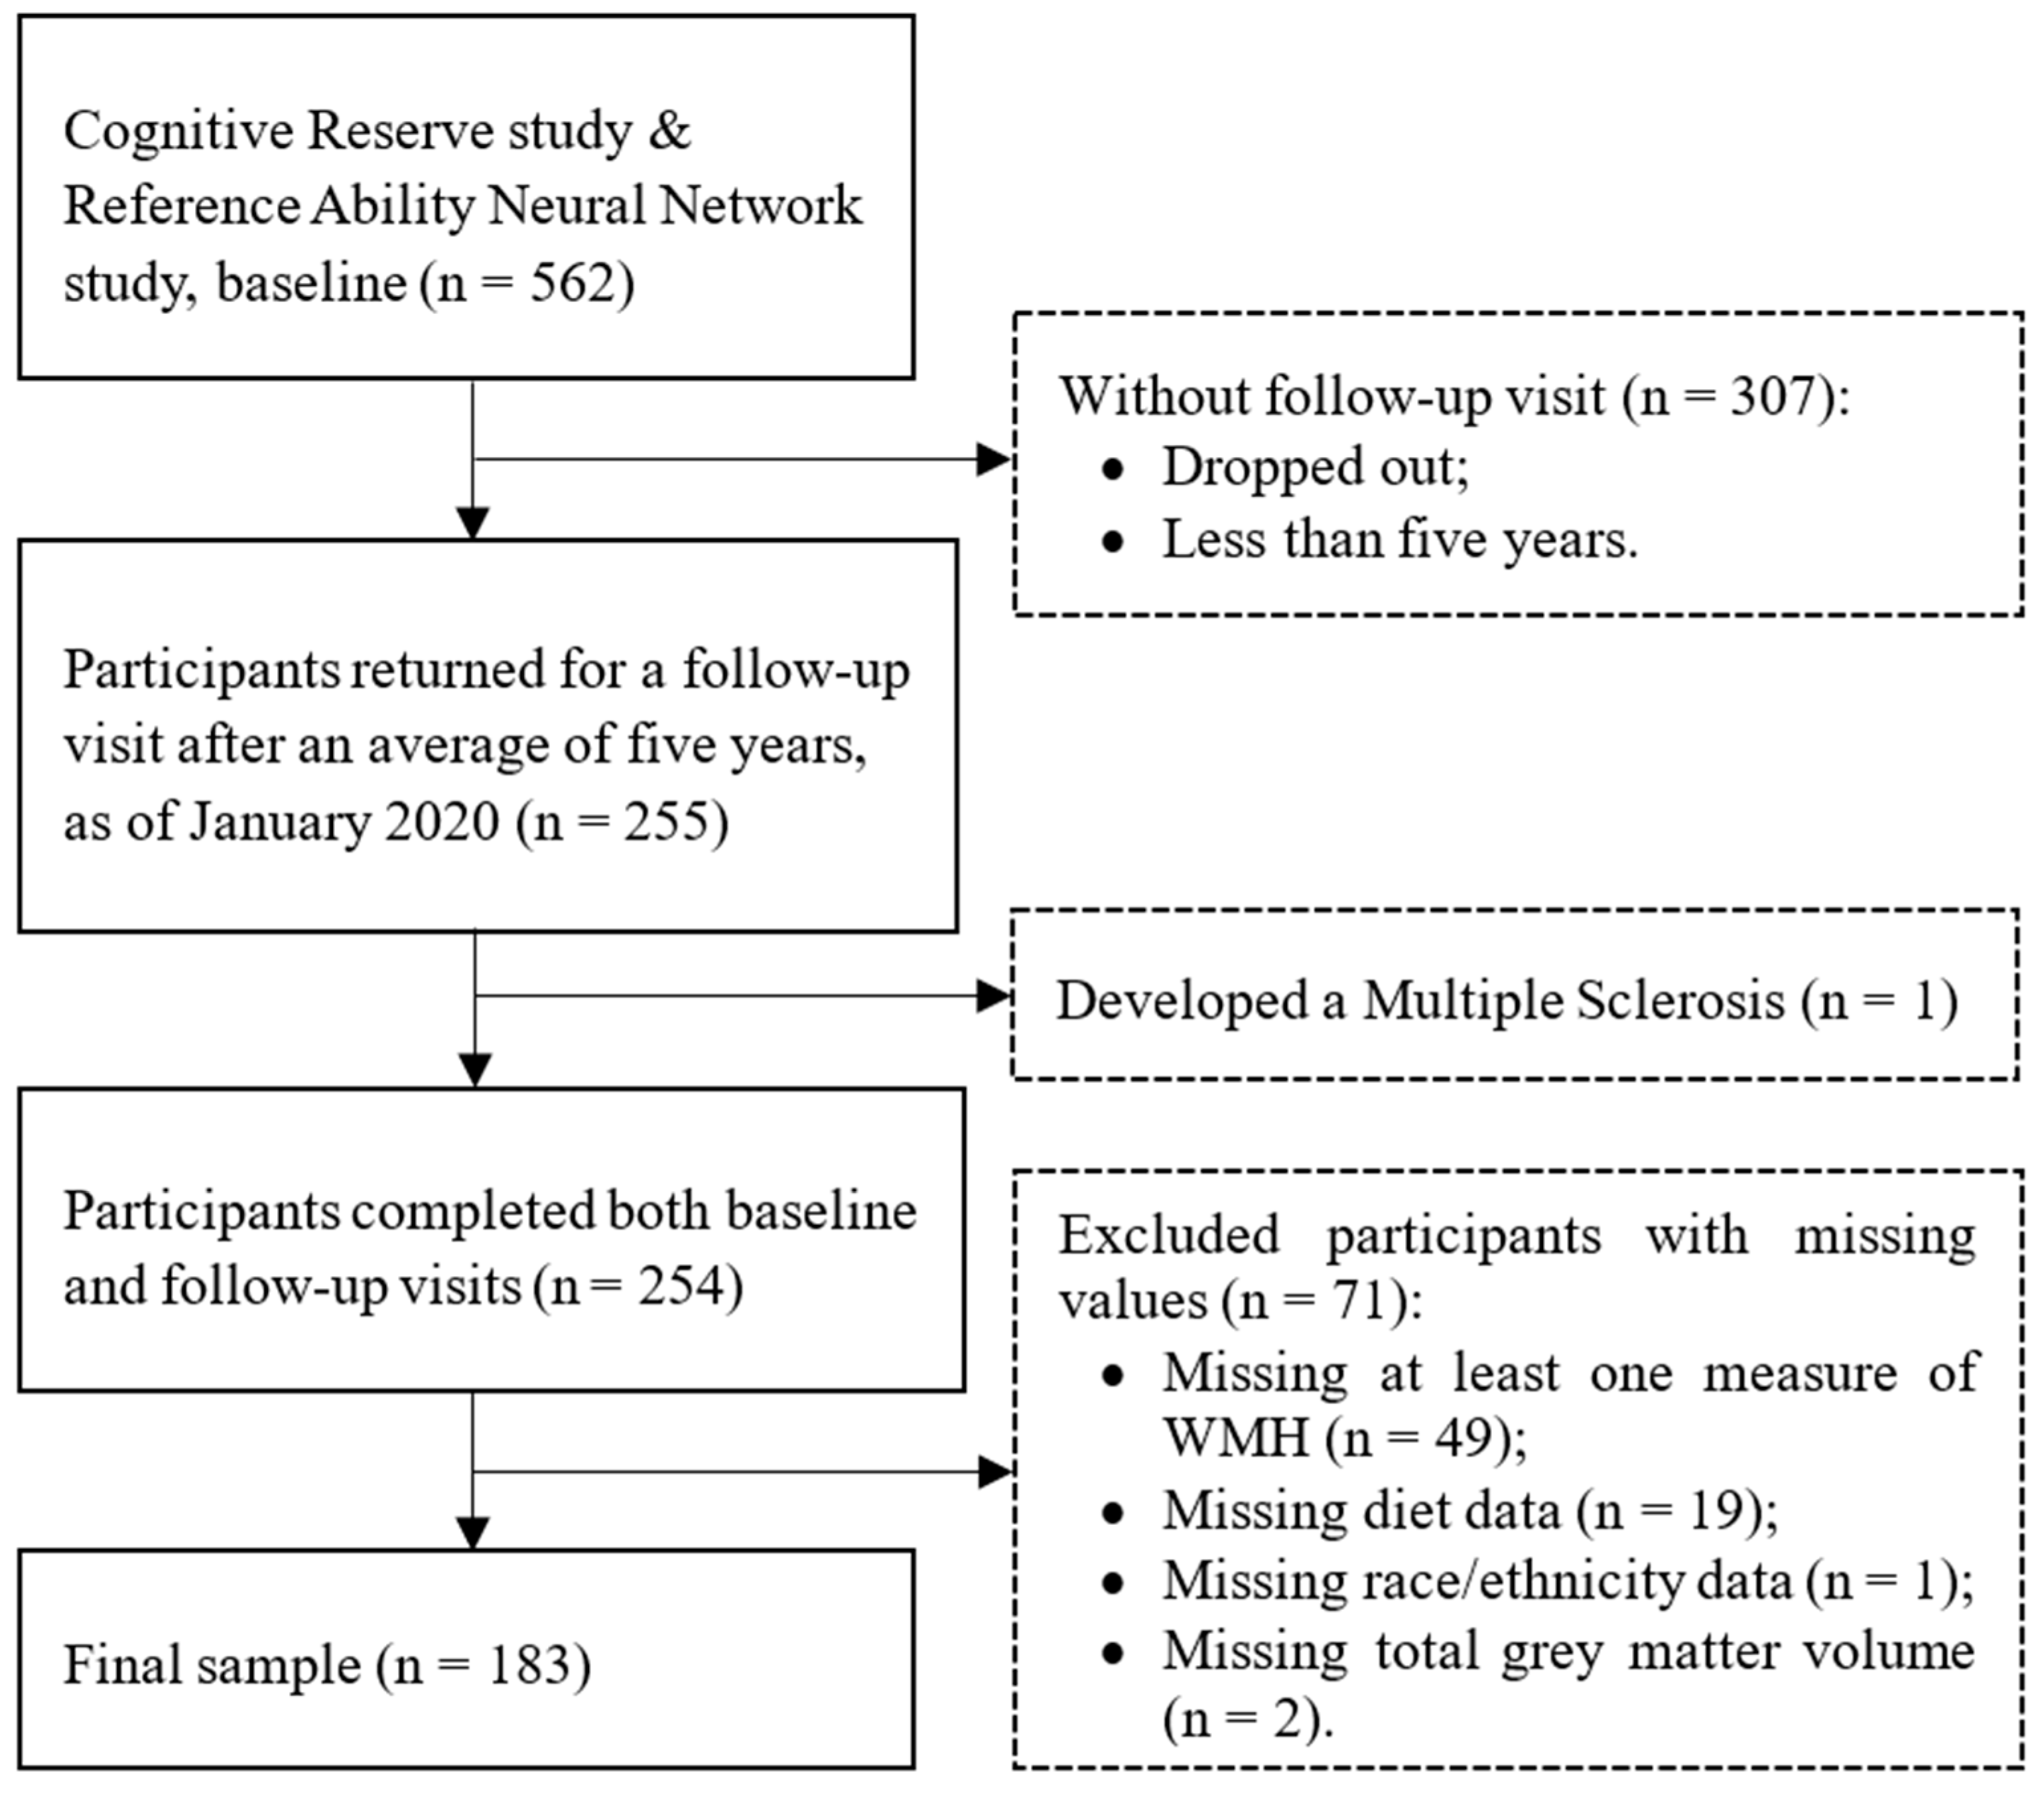
2.1. Participants
2.2. Measures
2.3. Statistical Analysis
3. Results
3.1. Characteristics of Study Population
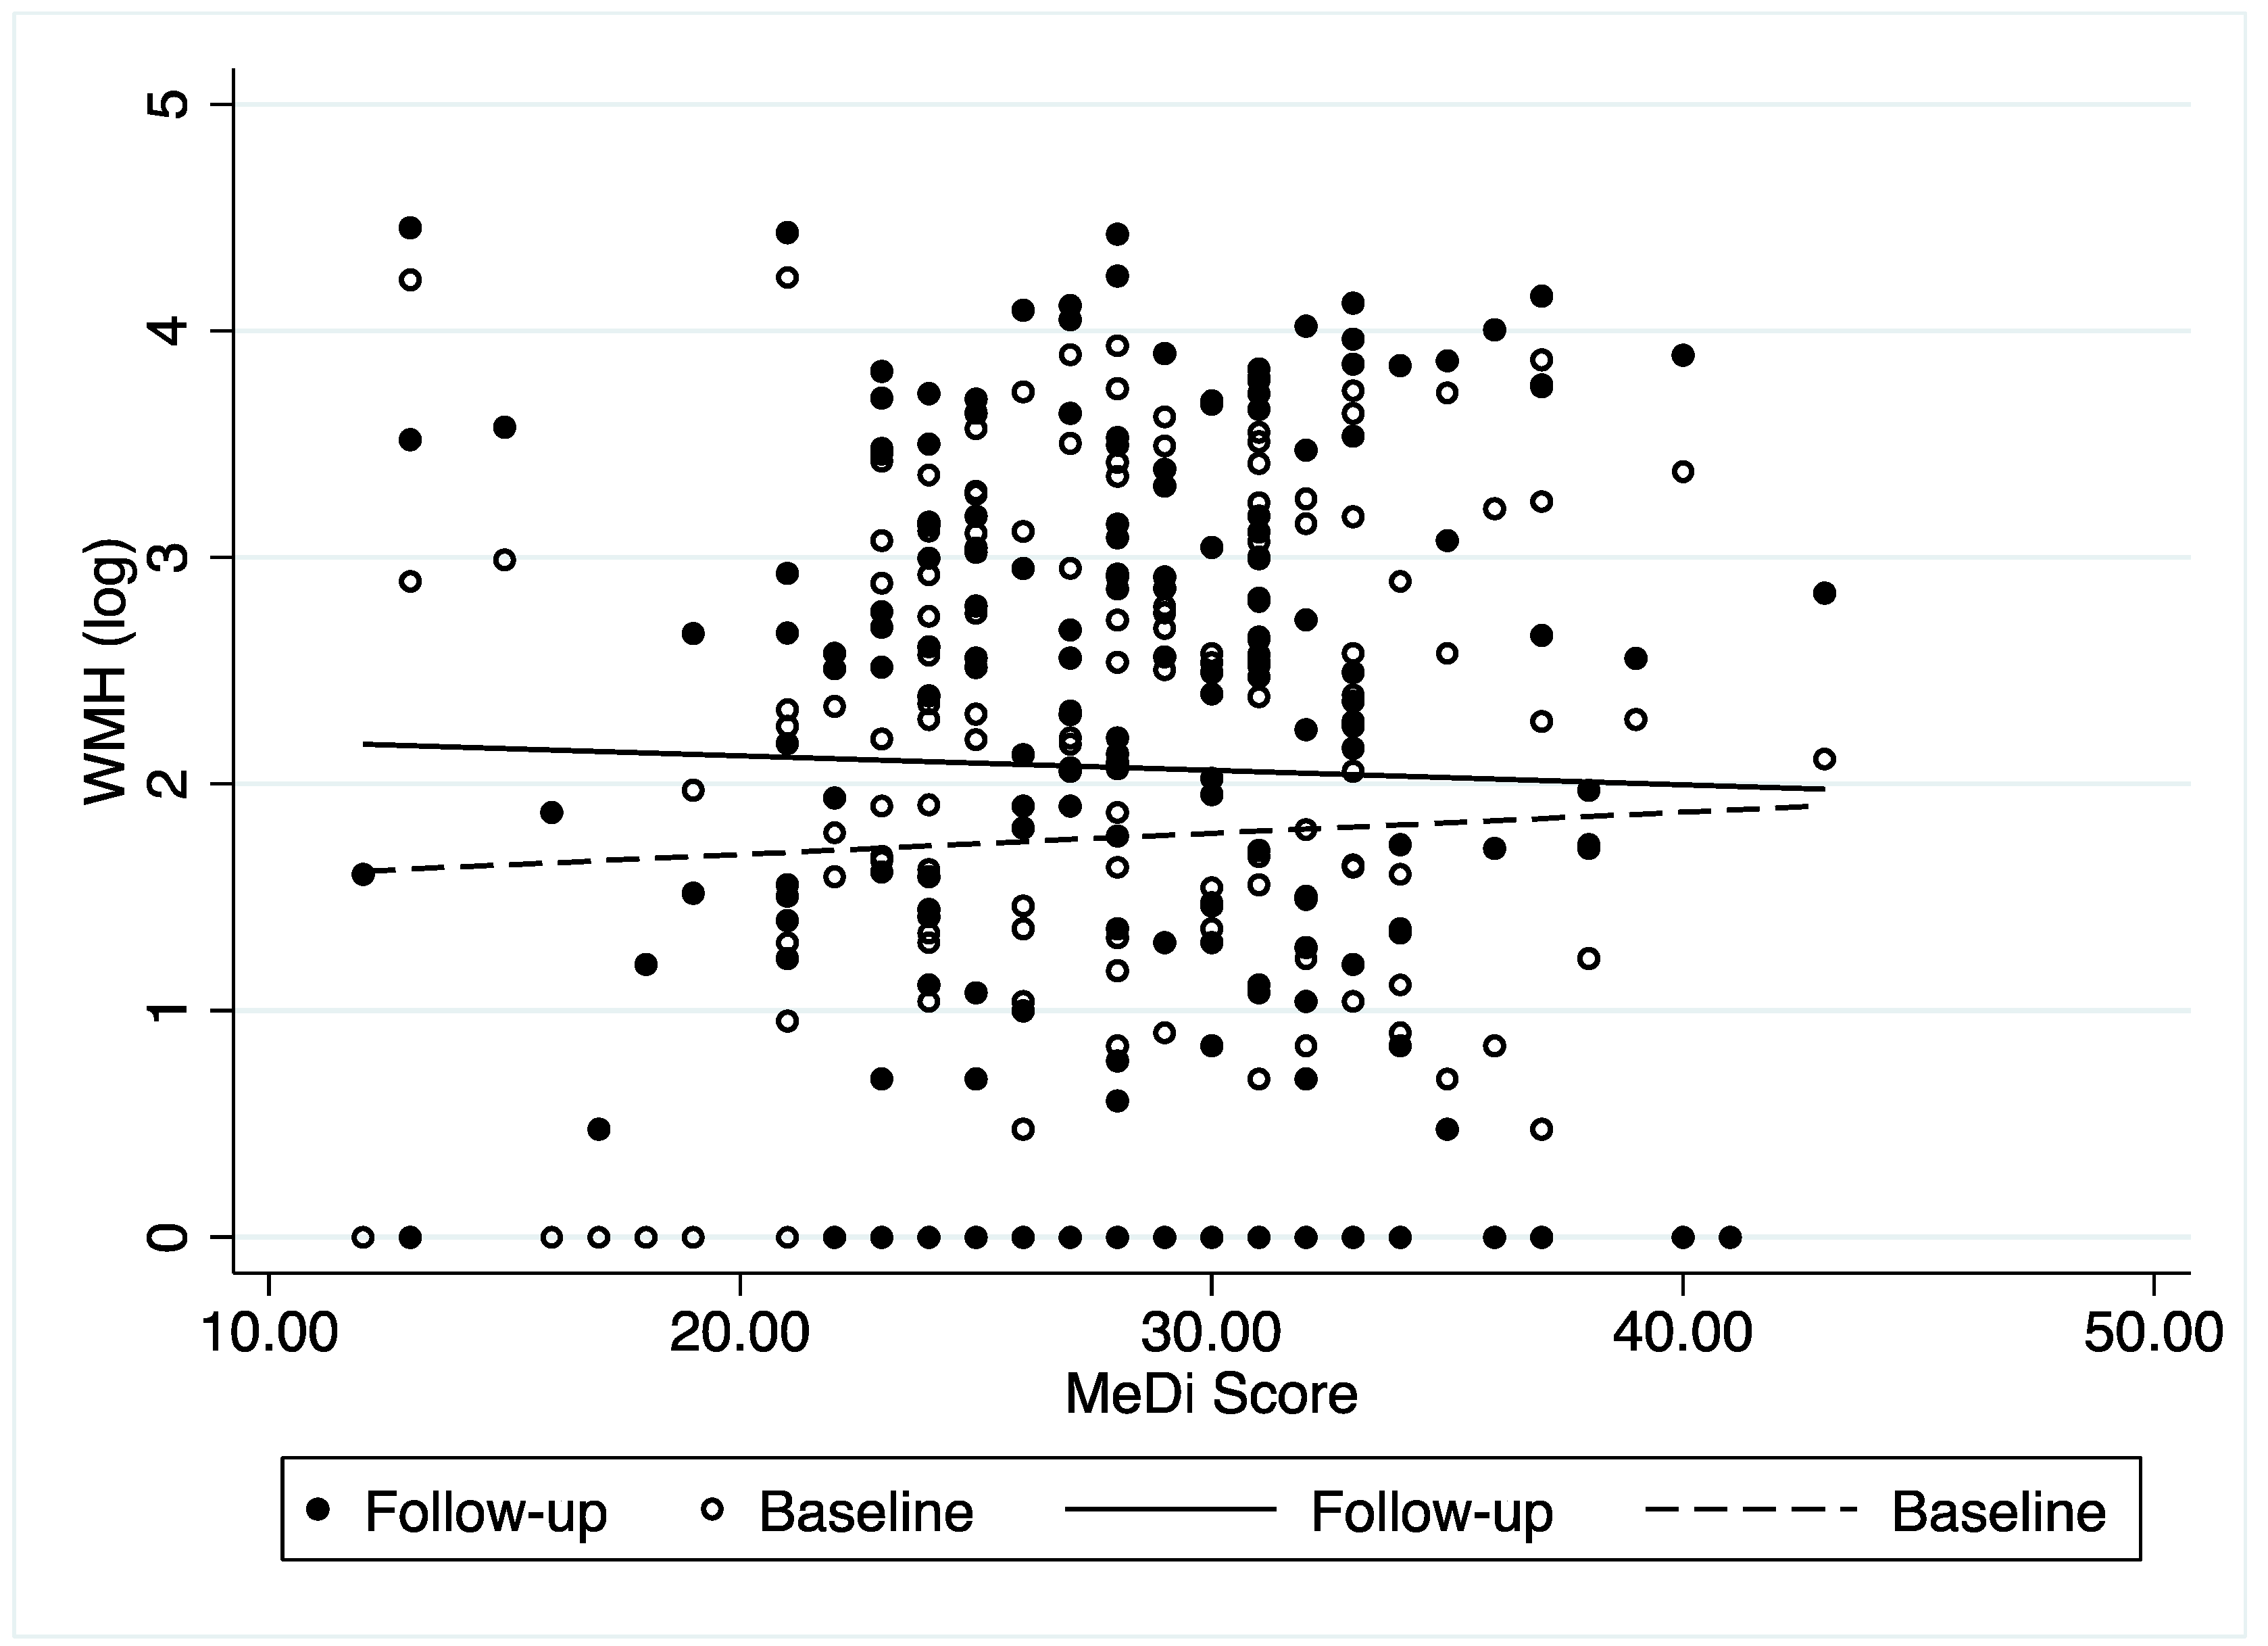
3.2. Association between MeDi and WMH Change
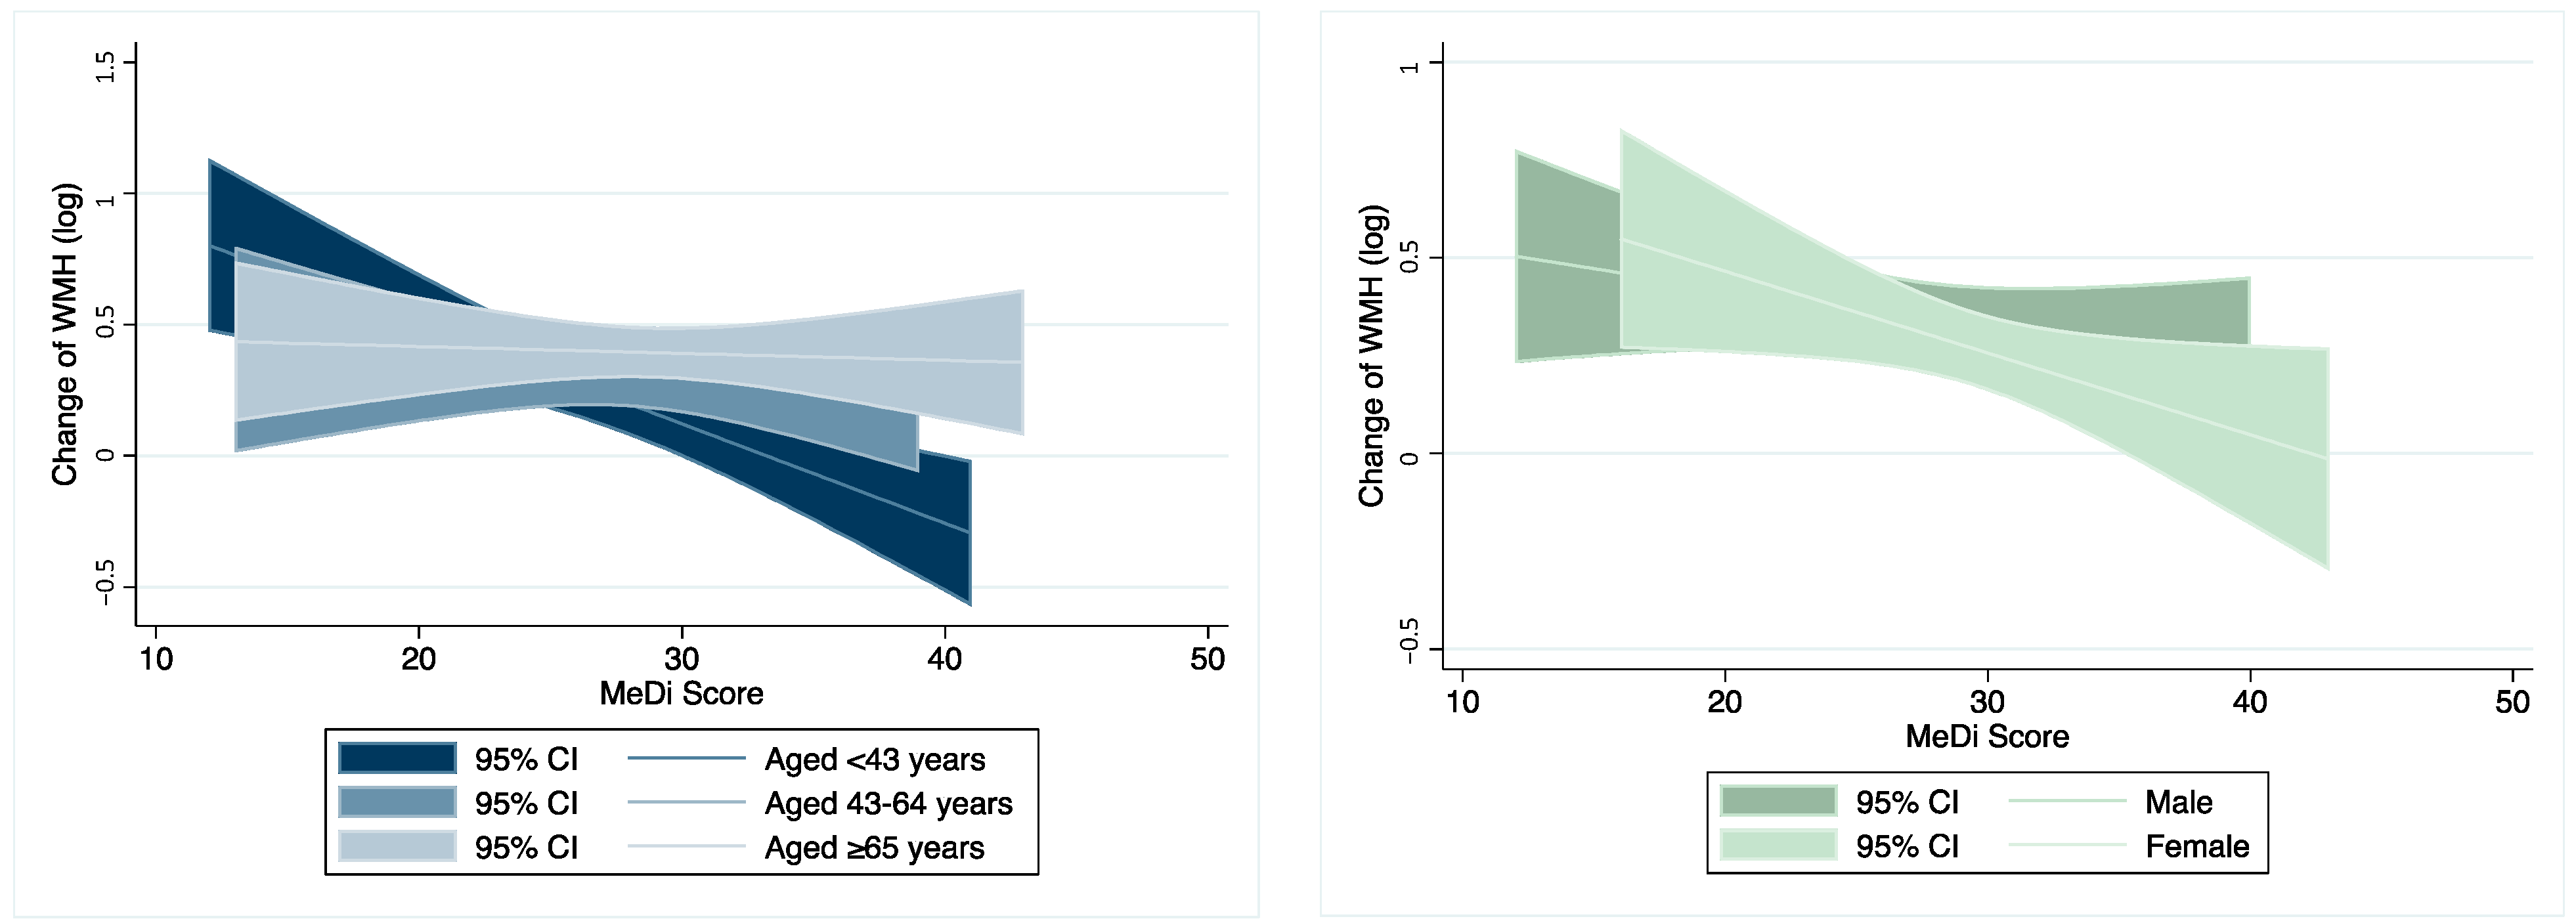
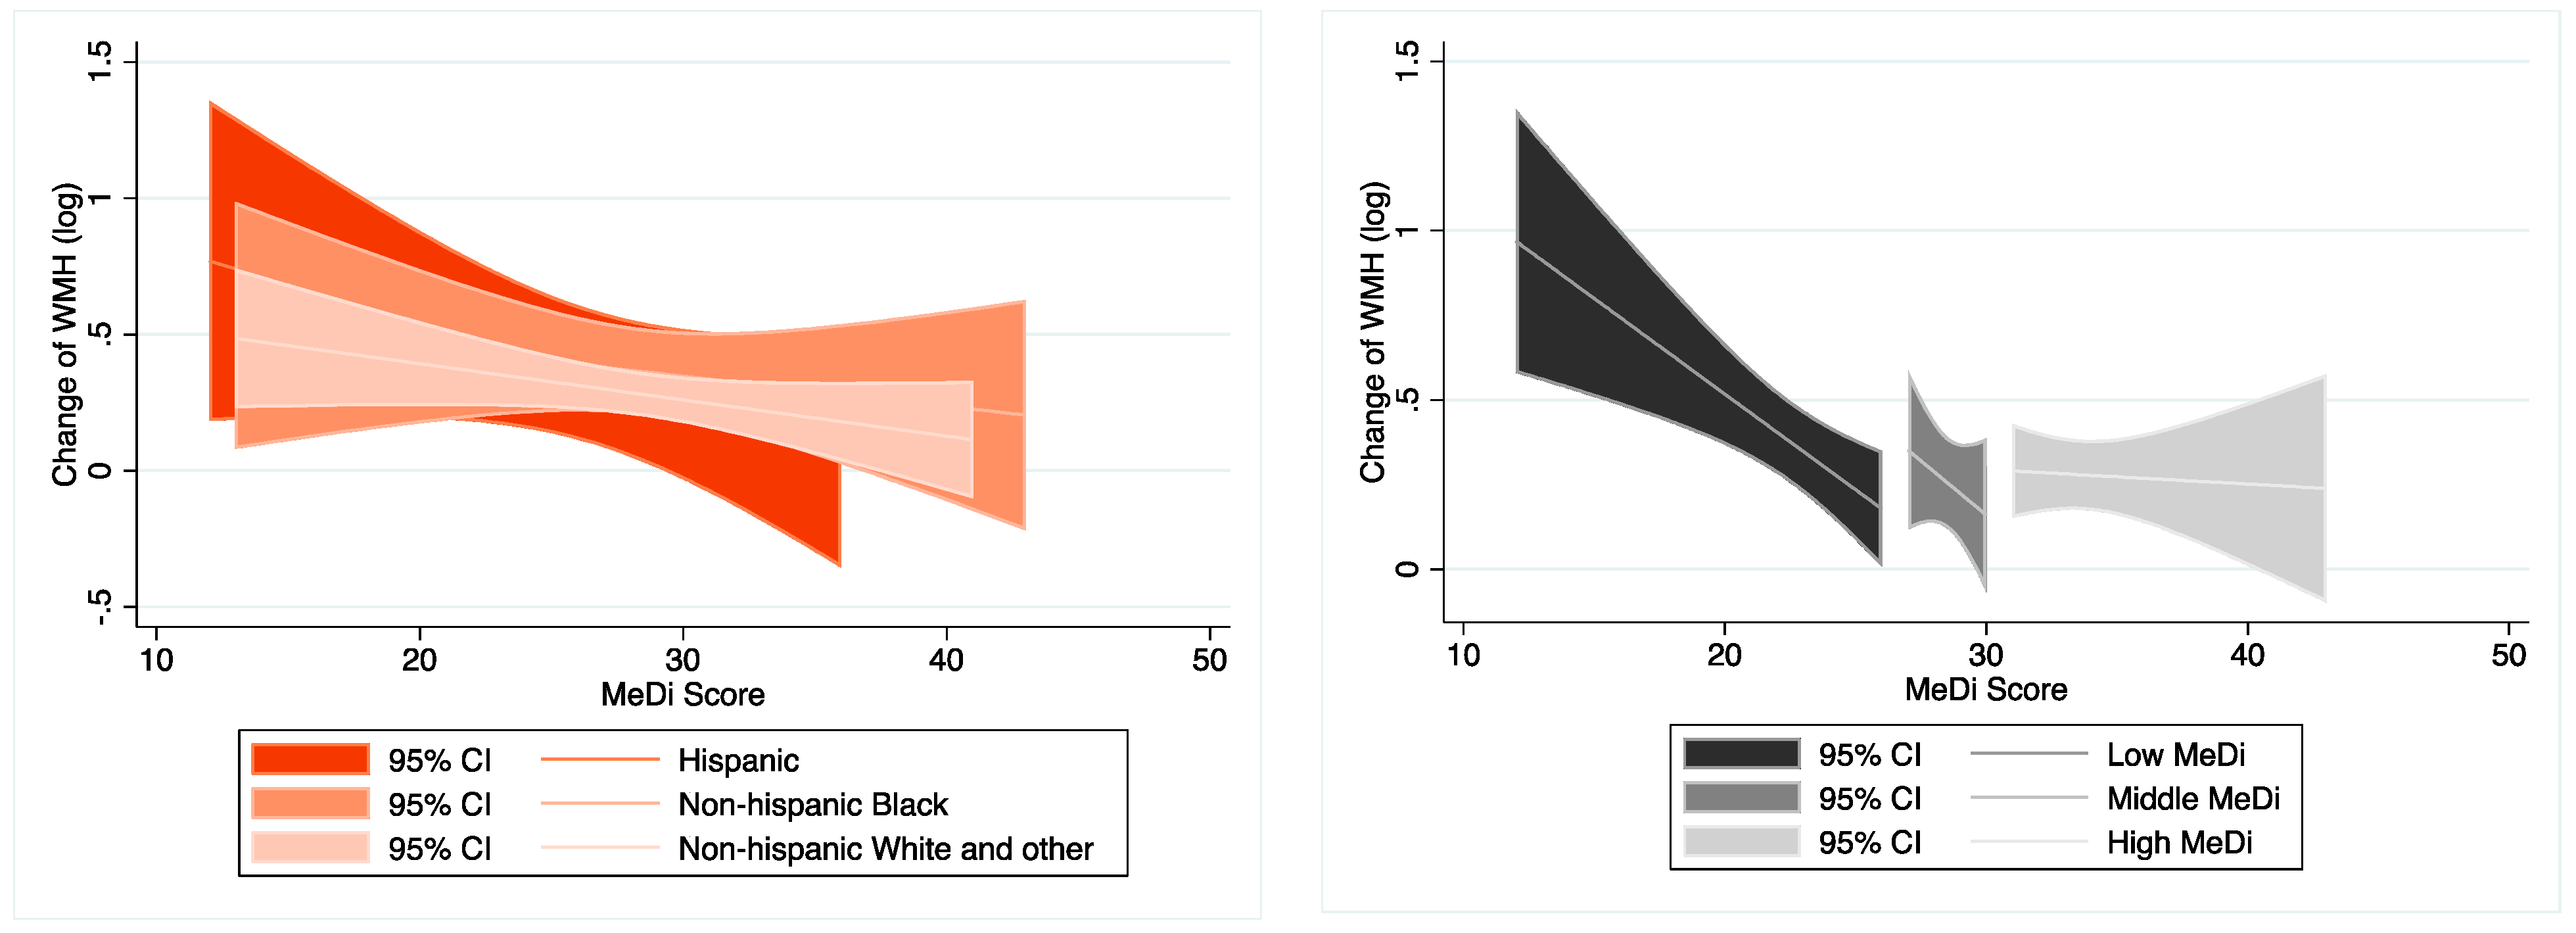
3.3. Moderation Analysis on the Association between MeDi and WMH Change
3.4. Association between Individual Food Categories and WMH Change
4. Discussion
5. Conclusions
Supplementary Materials
Author Contributions
Funding
Institutional Review Board Statement
Informed Consent Statement
Data Availability Statement
Conflicts of Interest
References
- Scarmeas, N.; Stern, Y.; Mayeux, R.; Luchsinger, J.A. Mediterranean diet, Alzheimer disease, and vascular mediation. Arch. Neurol. 2006, 63, 1709–1717. [Google Scholar] [CrossRef] [PubMed]
- Gu, Y.; Brickman, A.M.; Stern, Y.; Habeck, C.G.; Razlighi, Q.R.; Luchsinger, J.A.; Manly, J.J.; Schupf, N.; Mayeux, R.; Scarmeas, N. Mediterranean diet and brain structure in a multiethnic elderly cohort. Neurology 2015, 85, 1744–1751. [Google Scholar] [CrossRef] [PubMed]
- Gardener, H.; Scarmeas, N.; Gu, Y.; Boden-Albala, B.; Elkind, M.S.; Sacco, R.L.; DeCarli, C.; Wright, C.B. Mediterranean diet and white matter hyperintensity volume in the Northern Manhattan Study. Arch. Neurol. 2012, 69, 251–256. [Google Scholar] [CrossRef]
- Abenavoli, L.; Boccuto, L.; Federico, A.; Dallio, M.; Loguercio, C.; Di Renzo, L.; De Lorenzo, A. Diet and Non-Alcoholic Fatty Liver Disease: The Mediterranean Way. Int. J. Environ. Res. Public Health 2019, 16, 3011. [Google Scholar] [CrossRef] [PubMed]
- van Lent, D.M.; O’Donnell, A.; Beiser, A.S.; Vasan, R.S.; DeCarli, C.S.; Scarmeas, N.; Wagner, M.; Jacques, P.F.; Seshadri, S.; Himali, J.J.; et al. Mind Diet Adherence and Cognitive Performance in the Framingham Heart Study. J. Alzheimer’s Dis. 2021, 82, 827–839. [Google Scholar] [CrossRef] [PubMed]
- Titova, O.E.; Ax, E.; Brooks, S.J.; Sjögren, P.; Cederholm, T.; Kilander, L.; Kullberg, J.; Larsson, E.-M.; Johansson, L.; Åhlström, H.; et al. Mediterranean diet habits in older individuals: Associations with cognitive functioning and brain volumes. Exp. Gerontol. 2013, 48, 1443–1448. [Google Scholar] [CrossRef]
- Scarmeas, N.; Stern, Y.; Mayeux, R.; Manly, J.J.; Schupf, N.; Luchsinger, J.A. Mediterranean diet and mild cognitive impairment. Arch. Neurol. 2009, 66, 216–225. [Google Scholar] [CrossRef]
- Fratiglioni, L.; Marseglia, A.; Dekhtyar, S. Ageing without dementia: Can stimulating psychosocial and lifestyle experiences make a difference? Lancet Neurol. 2020, 19, 533–543. [Google Scholar] [CrossRef]
- Karstens, A.J.; Tussing-Humphreys, L.; Zhan, L.; Rajendran, N.; Cohen, J.; Dion, C.; Zhou, X.J.; Lamar, M. Associations of the Mediterranean diet with cognitive and neuroimaging phenotypes of dementia in healthy older adults. Am. J. Clin. Nutr. 2019, 109, 361–368. [Google Scholar] [CrossRef]
- Scarmeas, N.; Luchsinger, J.A.; Schupf, N.; Brickman, A.M.; Cosentino, S.; Tang, M.X.; Stern, Y. Physical activity, diet, and risk of Alzheimer disease. JAMA 2009, 302, 627–637. [Google Scholar] [CrossRef]
- Scarmeas, N.; Stern, Y.; Tang, M.X.; Mayeux, R.; Luchsinger, J.A. Mediterranean diet and risk for Alzheimer’s disease. Ann. Neurol. 2006, 59, 912–921. [Google Scholar] [CrossRef] [PubMed]
- Gu, Y.; Vorburger, R.S.; Gazes, Y.; Habeck, C.G.; Stern, Y.; Luchsinger, J.A.; Manly, J.J.; Schupf, N.; Mayeux, R.; Brickman, A.M. White matter integrity as a mediator in the relationship between dietary nutrients and cognition in the elderly. Ann. Neurol. 2016, 79, 1014–1025. [Google Scholar] [CrossRef]
- Nelson, A.R.; Sweeney, M.D.; Sagare, A.P.; Zlokovic, B.V. Neurovascular dysfunction and neurodegeneration in dementia and Alzheimer’s disease. Biochim. Biophys. Acta Mol. Basis Dis. 2016, 1862, 887–900. [Google Scholar] [CrossRef] [PubMed]
- Scarmeas, N.; Luchsinger, J.; Stern, Y.; Gu, Y.; He, J.; DeCarli, C.; Brown, T.; Brickman, A.M. Mediterranean diet and magnetic resonance imaging-assessed cerebrovascular disease. Ann. Neurol. 2011, 69, 257–268. [Google Scholar] [CrossRef]
- Gu, Y.; Scarmeas, N. Diet and Neuroimaging Markers of Cerebrovascular Disease. Curr. Nutr. Rep. 2013, 2, 81–89. [Google Scholar] [CrossRef][Green Version]
- Prins, N.D.; Scheltens, P. White matter hyperintensities, cognitive impairment and dementia: An update. Nat. Rev. Neurol. 2015, 11, 157–165. [Google Scholar] [CrossRef] [PubMed]
- Smith, E.E.; Egorova, S.; Blacker, D.; Killiany, R.J.; Muzikansky, A.; Dickerson, B.C.; Tanzi, R.E.; Albert, M.S.; Greenberg, S.M.; Guttmann, C.R. Magnetic Resonance Imaging White Matter Hyperintensities and Brain Volume in the Prediction of Mild Cognitive Impairment and Dementia. Arch. Neurol. 2008, 65, 94–100. [Google Scholar] [CrossRef]
- Mortamais, M.; Artero, S.; Ritchie, K. Cerebral white matter hyperintensities in the prediction of cognitive decline and incident dementia. Int. Rev. Psychiatry 2013, 25, 686–698. [Google Scholar] [CrossRef] [PubMed]
- Bangen, K.J.; Thomas, K.R.; Weigand, A.J.; Sanchez, D.L.; Delano-Wood, L.; Edmonds, E.C.; Carmichael, O.T.; Schwarz, C.G.; Brickman, A.M.; Bondi, M.W. Pattern of regional white matter hyperintensity volume in mild cognitive impairment subtypes and associations with decline in daily functioning. Neurobiol. Aging 2020, 86, 134–142. [Google Scholar] [CrossRef]
- Rizvi, B.; Lao, P.J.; Chesebro, A.G.; Dworkin, J.D.; Amarante, E.; Beato, J.M.; Gutierrez, J.; Zahodne, L.B.; Schupf, N.; Manly, J.J.; et al. Association of Regional White Matter Hyperintensities with Longitudinal Alzheimer-Like Pattern of Neurodegeneration in Older Adults. JAMA Netw. Open 2021, 4, e2125166. [Google Scholar] [CrossRef]
- Tosto, G.; Zimmerman, M.E.; Hamilton, J.L.; Carmichael, O.T.; Brickman, A.M. The effect of white matter hyperintensities on neurodegeneration in mild cognitive impairment. Alzheimer’s Dement. 2015, 11, 1510–1519. [Google Scholar] [CrossRef] [PubMed]
- Godin, O.; Tzourio, C.; Rouaud, O.; Zhu, Y.; Maillard, P.; Pasquier, F.; Crivello, F.; Alpérovitch, A.; Mazoyer, B.; Dufouil, C. Joint Effect of White Matter Lesions and Hippocampal Volumes on Severity of Cognitive Decline: The 3C-Dijon MRI Study. J. Alzheimer’s Dis. 2010, 20, 453–463. [Google Scholar] [CrossRef] [PubMed]
- Inaba, M.; White, L.; Bell, C.; Chen, R.; Petrovitch, H.; Launer, L.; Abbott, R.D.; Ross, G.W.; Masaki, K. White Matter Lesions on Brain Magnetic Resonance Imaging Scan and 5-Year Cognitive Decline: The Honolulu-Asia Aging Study. J. Am. Geriatr. Soc. 2011, 59, 1484–1489. [Google Scholar] [CrossRef] [PubMed]
- Prins, N.D.; van Dijk, E.J.; den Heijer, T.; Vermeer, S.E.; Jolles, J.; Koudstaal, P.J.; Hofman, A.; Breteler, M.M.B. Cerebral small-vessel disease and decline in information processing speed, executive function and memory. Brain 2005, 128 Pt 9, 2034–2041. [Google Scholar] [CrossRef] [PubMed]
- Silbert, L.C.; Howieson, D.B.; Dodge, H.; Kaye, J.A. Cognitive impairment risk: White matter hyperintensity progression matters. Neurology 2009, 73, 120–125. [Google Scholar] [CrossRef]
- Boyle, P.A.; Yu, L.; Fleischman, D.A.; Leurgans, S.; Yang, J.; Wilson, R.S.; Schneider, J.A.; Arvanitakis, Z.; Arfanakis, K.; Bennett, D.A. White matter hyperintensities, incident mild cognitive impairment, and cognitive decline in old age. Ann. Clin. Transl. Neurol. 2016, 3, 791–800. [Google Scholar] [CrossRef]
- Kantarci, K.; Weigand, S.D.; Przybelski, S.A.; Preboske, G.M.; Pankratz, V.S.; Vemuri, P.; Senjem, M.L.; Murphy, M.C.; Gunter, J.L.; Machulda, M.M.; et al. MRI and MRS predictors of mild cognitive impairment in a population-based sample. Neurology 2013, 81, 126–133. [Google Scholar] [CrossRef]
- Windham, B.G.; Griswold, M.E.; Wilkening, S.R.; Su, D.; Tingle, J.; Coker, L.H.; Knopman, D.; Gottesman, R.F.; Shibata, D.; Mosley, T.H. Midlife Smaller and Larger Infarctions, White Matter Hyperintensities, and 20-Year Cognitive Decline: A Cohort Study. Ann. Intern. Med. 2019, 171, 389–396. [Google Scholar] [CrossRef]
- Song, S.; Stern, Y.; Gu, Y. Modifiable lifestyle factors and cognitive reserve: A systematic review of current evidence. Ageing Res. Rev. 2021, 74, 101551. [Google Scholar] [CrossRef]
- Prinelli, F.F.L.; Kalpouzos, G.; Musicco, M.; Adorni, F.; Johansson, I.; Marseglia, A.; Xu, W. Specific nutrient patterns are associated with higher structural brain integrity in dementia-free older adults. NeuroImage 2019, 199, 281–288. [Google Scholar] [CrossRef]
- Garnier-Crussard, A.; Bougacha, S.; Wirth, M.; André, C.; Delarue, M.; Landeau, B.; Mézenge, F.; Kuhn, E.; Gonneaud, J.; Chocat, A.; et al. White matter hyperintensities across the adult lifespan: Relation to age, Aβ load, and cognition. Alzheimer’s Res. Ther. 2020, 12, 127. [Google Scholar] [CrossRef] [PubMed]
- Habes, M.; Sotiras, A.; Erus, G.; Toledo, J.B.; Janowitz, D.; Wolk, D.A.; Shou, H.; Bryan, N.R.; Doshi, J.; Völzke, H.; et al. White matter lesions: Spatial heterogeneity, links to risk factors, cognition, genetics, and atrophy. Neurology 2018, 91, e964–e975. [Google Scholar] [CrossRef] [PubMed]
- Hopkins, R.O.; Beck, C.J.; Burnett, D.L.; Weaver, L.K.; Victoroff, J.; Bigler, E.D. Prevalence of White Matter Hyperintensities in a Young Healthy Population. J. Neuroimaging 2006, 16, 243–251. [Google Scholar] [CrossRef]
- King, K.S.; Peshock, R.; Rossetti, H.C.; McColl, R.W.; Ayers, C.R.; Hulsey, K.M.; Das, S.R. Effect of Normal Aging Versus Hypertension, Abnormal Body Mass Index, and Diabetes Mellitus on White Matter Hyperintensity Volume. Stroke 2014, 45, 255–257. [Google Scholar] [CrossRef]
- Wen, W.; Sachdev, P.; Li, J.J.; Chen, X.; Anstey, K. White matter hyperintensities in the forties: Their prevalence and topography in an epidemiological sample aged 44-48. Hum. Brain Mapp. 2009, 30, 1155–1167. [Google Scholar] [CrossRef] [PubMed]
- Moura, A.R.; Lee, S.; Habeck, C.; Razlighi, Q.; Stern, Y. The relationship between white matter hyperintensities and cognitive reference abilities across the life span. Neurobiol. Aging 2019, 83, 31–41. [Google Scholar] [CrossRef] [PubMed]
- de Leeuw, F.-E.; de Groot, J.C.; Achten, E.; Oudkerk, M.; Ramos, L.M.P.; Heijboer, R.; Hofman, A.; Jolles, J.; van Gijn, J.; Breteler, M.M.B. Prevalence of cerebral white matter lesions in elderly people: A population based magnetic resonance imaging study. The Rotterdam Scan Study. J. Neurol. Neurosurg. Psychiatry 2001, 70, 9–14. [Google Scholar] [CrossRef]
- Stern, Y.; Gazes, Y.; Razlighi, Q.; Steffener, J.; Habeck, C. A task-invariant cognitive reserve network. NeuroImage 2018, 178, 36–45. [Google Scholar] [CrossRef]
- Stern, Y.; Habeck, C.; Steffener, J.; Barulli, D.; Gazes, Y.; Razlighi, Q.; Shaked, D.; Salthouse, T. The Reference Ability Neural Network Study: Motivation, design, and initial feasibility analyses. NeuroImage 2014, 103, 139–151. [Google Scholar] [CrossRef]
- Habeck, C.; Gazes, Y.; Razlighi, Q.; Steffener, J.; Brickman, A.; Barulli, D.; Salthouse, T.; Stern, Y. The Reference Ability Neural Network Study: Life-time stability of reference-ability neural networks derived from task maps of young adults. NeuroImage 2016, 125, 693–704. [Google Scholar] [CrossRef]
- Panagiotakos, D.B.; Milias, G.A.; Pitsavos, C.; Stefanadis, C. MedDietScore: A computer program that evaluates the adherence to the Mediterranean dietary pattern and its relation to cardiovascular disease risk. Comput. Methods Programs Biomed. 2006, 83, 73–77. [Google Scholar] [CrossRef] [PubMed]
- Willett, W.C.; Reynolds, R.D.; Cottrell-Hoehner, S.; Sampson, L.; Browne, M.L. Validation of a semi-quantitative food frequency questionnaire: Comparison with a 1-year diet record. J. Am. Diet. Assoc. 1987, 87, 43–47. [Google Scholar] [CrossRef]
- Ithapu, V.; Singh, V.; Lindner, C.; Austin, B.P.; Hinrichs, C.; Carlsson, C.M.; Bendlin, B.B.; Johnson, S.C. Extracting and summarizing white matter hyperintensities using supervised segmentation methods in Alzheimer’s disease risk and aging studies. Hum. Brain Mapp. 2014, 35, 4219–4235. [Google Scholar] [CrossRef] [PubMed]
- Sen, A.; Capelli, V.; Husain, M. Cognition and dementia in older patients with epilepsy. Brain J. Neurol. 2018, 141, 1592–1608. [Google Scholar] [CrossRef] [PubMed]
- Jin, Y.; Song, S.; Zhang, L.; Trisolini, M.G.; Labresh, K.A.; Smith, S.C., Jr.; Zheng, Z.J. Disparities in Premature Cardiac Death Among US Counties From 1999–2017: Temporal Trends and Key Drivers. J. Am. Heart Assoc. 2020, 9, e016340. [Google Scholar] [CrossRef]
- Song, S.; Ma, G.; Trisolini, M.G.; Labresh, K.A.; Smith, S.C.; Jin, Y.; Zheng, Z.-J. Evaluation of Between-County Disparities in Premature Mortality Due to Stroke in the US. JAMA Netw. Open 2021, 4, e214488. [Google Scholar] [CrossRef]
- Song, S.; Trisolini, M.G.; LaBresh, K.A.; Smith, S.C., Jr.; Jin, Y.; Zheng, Z.-J. Factors Associated with County-Level Variation in Premature Mortality Due to Noncommunicable Chronic Disease in the United States, 1999-2017. JAMA Netw. Open 2020, 3, e200241. [Google Scholar] [CrossRef]
- Song, S.; Duan, Y.; Huang, J.; Wong, M.C.S.; Chen, H.; Trisolini, M.G.; Labresh, K.A.; Smith, S.C.; Jin, Y.; Zheng, Z.-J. Socioeconomic Inequalities in Premature Cancer Mortality among U.S. Counties During 1999 to 2018. Cancer Epidemiol. Biomark. Prev. 2021, 30, 1375–1386. [Google Scholar] [CrossRef]
- Tamura, Y.; Kimbara, Y.; Yamaoka, T.; Sato, K.; Tsuboi, Y.; Kodera, R.; Chiba, Y.; Mori, S.; Fujiwara, Y.; Tokumaru, A.M.; et al. White Matter Hyperintensity in Elderly Patients with Diabetes Mellitus Is Associated with Cognitive Impairment, Functional Disability, and a High Glycoalbumin/Glycohemoglobin Ratio. Front. Aging Neurosci. 2017, 9, 220. [Google Scholar] [CrossRef]
- Erten-Lyons, D.; Woltjer, R.; Kaye, J.; Mattek, N.; Dodge, H.H.; Green, S.; Tran, H.; Howieson, D.B.; Wild, K.; Silbert, L.C. Neuropathologic basis of white matter hyperintensity accumulation with advanced age. Neurology 2013, 81, 977–983. [Google Scholar] [CrossRef] [PubMed]
- Maillard, P.; Carmichael, O.; Fletcher, E.; Reed, B.; Mungas, D.; DeCarli, C. Coevolution of white matter hyperintensities and cognition in the elderly. Neurology 2012, 79, 442–448. [Google Scholar] [CrossRef] [PubMed]
- Vannorsdall, T.D.; Waldstein, S.R.; Kraut, M.; Pearlson, G.D.; Schretlen, D.J. White Matter Abnormalities and Cognition in a Community Sample. Arch. Clin. Neuropsychol. 2009, 24, 209–217. [Google Scholar] [CrossRef] [PubMed]
- Pantoni, L. Cerebral small vessel disease: From pathogenesis and clinical characteristics to therapeutic challenges. Lancet Neurol. 2010, 9, 689–701. [Google Scholar] [CrossRef]
- Virtanen, J.K.; Siscovick, D.S.; Lemaitre, R.N.; Longstreth, W.T.; Spiegelman, D.; Rimm, E.B.; King, I.B.; Mozaffarian, D. Circulating Omega-3 Polyunsaturated Fatty Acids and Subclinical Brain Abnormalities on MRI in Older Adults: The Cardiovascular Health Study. J. Am. Heart Assoc. 2013, 2, e000305. [Google Scholar] [CrossRef] [PubMed]
- Berti, V.; Walters, M.; Sterling, J.; Quinn, C.G.; Logue, M.; Andrews, R.; Matthews, D.C.; Osorio, R.S.; Pupi, A.; Vallabhajosula, S.; et al. Mediterranean diet and 3-year Alzheimer brain biomarker changes in middle-aged adults. Neurology 2018, 90, e1789–e1798. [Google Scholar] [CrossRef]
- Rallidis, L.S.; Lekakis, J.; Kolomvotsou, A.; Zampelas, A.; Vamvakou, G.; Efstathiou, S.; Dimitriadis, G.; Raptis, S.A.; Kremastinos, D.T. Close adherence to a Mediterranean diet improves endothelial function in subjects with abdominal obesity. Am. J. Clin. Nutr. 2009, 90, 263–268. [Google Scholar] [CrossRef]
- Esposito, K.; Marfella, R.; Ciotola, M.; Di Palo, C.; Giugliano, F.; Giugliano, G.; D’Armiento, M.; D’Andrea, F.; Giugliano, D. Effect of a mediterranean-style diet on endothelial dysfunction and markers of vascular inflammation in the metabolic syndrome: A randomized trial. JAMA 2004, 292, 1440–1446. [Google Scholar] [CrossRef]
- Babio, N.; Bulló, M.; Salas-Salvadó, J. Mediterranean diet and metabolic syndrome: The evidence. Public Health Nutr. 2009, 12, 1607–1617. [Google Scholar] [CrossRef]
- Schro der, H.; Marrugat, J.; Vila, J.; Covas, M.I.; Elosua, R. Adherence to the Traditional Mediterranean Diet Is Inversely Associated with Body Mass Index and Obesity in a Spanish Population. J. Nutr. 2004, 134, 3355–3361. [Google Scholar] [CrossRef]
- Fung, T.T.; Rexrode, K.M.; Mantzoros, C.S.; Manson, J.E.; Willett, W.C.; Hu, F.B. Mediterranean Diet and Incidence of and Mortality from Coronary Heart Disease and Stroke in Women. Circulation 2009, 119, 1093–1100. [Google Scholar] [CrossRef]
- Psaltopoulou, T.; Naska, A.; Orfanos, P.; Trichopoulos, D.; Mountokalakis, T.; Trichopoulou, A. Olive oil, the Mediterranean diet, and arterial blood pressure: The Greek European Prospective Investigation into Cancer and Nutrition (EPIC) study. Am. J. Clin. Nutr. 2004, 80, 1012–1018. [Google Scholar] [CrossRef] [PubMed]
- Trichopoulou, A.; Costacou, T.; Bamia, C.; Trichopoulos, D. Adherence to a Mediterranean Diet and Survival in a Greek Population. N. Engl. J. Med. 2003, 348, 2599–2608. [Google Scholar] [CrossRef] [PubMed]
- Knoops, K.T.; de Groot, L.C.; Kromhout, D.; Perrin, A.E.; Moreiras-Varela, O.; Menotti, A.; van Staveren, W.A. Mediterranean diet, lifestyle factors, and 10-year mortality in elderly European men and women: The HALE project. JAMA 2004, 292, 1433–1439. [Google Scholar] [CrossRef] [PubMed]
- de Lorgeril, M.; Salen, P.; Martin, J.L.; Monjaud, I.; Delaye, J.; Mamelle, N. Mediterranean diet, traditional risk factors, and the rate of cardiovascular complications after myocardial infarction: Final report of the Lyon Diet Heart Study. Circulation 1999, 99, 779–785. [Google Scholar] [CrossRef]
- Esposito, K.; Maiorino, M.I.; Bellastella, G.; Chiodini, P.; Panagiotakos, D.B.; Giugliano, D. A journey into a Mediterranean diet and type 2 diabetes: A systematic review with meta-analyses. BMJ Open 2015, 5, e008222. [Google Scholar] [CrossRef]
- Gu, Y.; Luchsinger, J.A.; Stern, Y.; Scarmeas, N. Mediterranean diet, inflammatory and metabolic biomarkers, and risk of Alzheimer’s disease. J. Alzheimer’s Dis. 2010, 22, 483–492. [Google Scholar] [CrossRef]
- Chrysohoou, C.; Panagiotakos, D.B.; Pitsavos, C.; Das, U.N.; Stefanadis, C. Adherence to the Mediterranean diet attenuates inflammation and coagulation process in healthy adults: The ATTICA study. J. Am. Coll. Cardiol. 2004, 44, 152–158. [Google Scholar] [CrossRef]
- Gu, Y.; Gutierrez, J.; Meier, I.B.; Guzman, V.A.; Manly, J.J.; Schupf, N.; Brickman, A.M.; Mayeux, R. Circulating inflammatory biomarkers are related to cerebrovascular disease in older adults. Neurol. Neuroimmunol. Neuroinflamm. 2019, 6, e521. [Google Scholar] [CrossRef]
- Gu, Y.; Manly, J.J.; Mayeux, R.P.; Brickman, A.M. An Inflammation-related Nutrient Pattern is Associated with Both Brain and Cognitive Measures in a Multiethnic Elderly Population. Curr. Alzheimer Res. 2018, 15, 493–501. [Google Scholar] [CrossRef]
- Moni, F.; Petersen, M.E.; Zhang, F.; Lao, P.J.; Zimmerman, M.E.; Gu, Y.; Gutierrez, J.; Rizvi, B.; Laing, K.K.; Igwe, K.C.; et al. Probing the proteome to explore potential correlates of increased Alzheimer’s-related cerebrovascular disease in adults with Down syndrome. Alzheimer’s Dement. J. Alzheimer’s Assoc. 2022. [Google Scholar] [CrossRef]
- Bosco, D.; Fava, A.; Plastino, M.; Montalcini, T.; Pujia, A. Possible implications of insulin resistance and glucose metabolism in Alzheimer’s disease pathogenesis. J. Cell. Mol. Med. 2011, 15, 1807–1821. [Google Scholar] [CrossRef]
- Bowman, G.L.; Silbert, L.C.; Howieson, D.; Dodge, H.H.; Traber, M.G.; Frei, B.; Kaye, J.A.; Shannon, J.; Quinn, J.F. Nutrient biomarker patterns, cognitive function, and MRI measures of brain aging. Neurology 2012, 78, 241–249. [Google Scholar] [CrossRef] [PubMed]
- Frei, B. Efficacy of Dietary Antioxidants to Prevent Oxidative Damage and Inhibit Chronic Disease. J. Nutr. 2004, 134, 3196s–3198s. [Google Scholar] [CrossRef] [PubMed]
- Morris, M.C.; Schneider, J.A.; Tangney, C.C. Thoughts on B-vitamins and dementia. J. Alzheimer’s Dis. 2006, 9, 429–433. [Google Scholar] [CrossRef] [PubMed]
- Soni, M.; Kos, K.; Lang, I.A.; Jones, K.; Melzer, D.; Llewellyn, D.J. Vitamin D and cognitive function. Scand. J. Clin. Lab. Investig. Suppl. 2012, 243, 79–82. [Google Scholar]
- Berti, V.; Murray, J.; Davies, M.; Spector, N.; Tsui, W.H.; Li, Y.; Williams, S.; Pirraglia, E.; Vallabhajosula, S.; McHugh, P.; et al. Nutrient patterns and brain biomarkers of Alzheimer’s disease in cognitively normal individuals. J. Nutr. Health Aging 2015, 19, 413–423. [Google Scholar] [CrossRef]
- Mosconi, L.; Murray, J.; Davies, M.; Williams, S.; Pirraglia, E.; Spector, N.; Tsui, W.H.; Li, Y.; Butler, T.; Osorio, R.S.; et al. Nutrient intake and brain biomarkers of Alzheimer’s disease in at-risk cognitively normal individuals: A cross-sectional neuroimaging pilot study. BMJ Open 2014, 4, e004850. [Google Scholar] [CrossRef]
- Wang, M.; Norman, J.E.; Srinivasan, V.J.; Rutledge, J.C. Metabolic, inflammatory, and microvascular determinants of white matter disease and cognitive decline. Am. J. Neurodegener. Dis. 2016, 5, 171–177. [Google Scholar]
- Burggraf, C.; Teuber, R.; Brosig, S.; Meier, T. Review of a priori dietary quality indices in relation to their construction criteria. Nutr. Rev. 2018, 76, 747–764. [Google Scholar] [CrossRef]
- Bach, A.; Terré, M.; Vidal, M. Symposium review: Decomposing efficiency of milk production and maximizing profit. J. Dairy Sci. 2020, 103, 5709–5725. [Google Scholar] [CrossRef]
- Kaukinen, K. Updates on systemic consequences of coeliac disease. Nat. Rev. Gastroenterol. Hepatol. 2021, 18, 87–88. [Google Scholar] [CrossRef] [PubMed]


| All (n = 183) | Low MeDi (n = 67) | Middle MeDi (n = 50) | High MeDi (n = 66) | p-Value | ||
|---|---|---|---|---|---|---|
| MeDi score | Mean (SD) | 28.20 (5.54) | 22.54 (3.46) | 28.54 (1.09) | 33.68 (3.03) | <0.001 *** |
| Range | 12–43 | 12–26 | 27–30 | 31–43 | ||
| Follow up interval, years | Mean (SD) | 4.86 (0.61) | 4.97 (0.65) | 4.90 (0.58) | 4.73 (0.57) | 0.060 |
| Age, years | Mean (SD) | 53.19 (16.52) | 51.25 (16.75) | 55.52 (15.71) | 53.38 (16.9) | 0.385 |
| Age groups | ||||||
| <43 years | n (%) | 51 (27.87) | 22 (32.84) | 12 (24.00) | 17 (25.76) | 0.707 |
| 43–64 years | n (%) | 72 (39.34) | 27 (40.30) | 20 (40.00) | 25 (37.88) | |
| ≥65 years | n (%) | 60 (32.79) | 18 (26.87) | 18 (36.00) | 24 (36.36) | |
| Education, years | Mean (SD) | 16.33 (2.37) | 16.34 (2.17) | 16.38 (2.41) | 16.27 (2.55) | 0.969 |
| NARTIQ | Mean (SD) | 117.82 (8.20) | 118.39 (7.80) | 117.96 (8.91) | 117.14 (8.12) | 0.676 |
| Calorie, kcal | Mean (SD) | 1352.07 (557.11) | 1237.48 (484.98) | 1304.29 (518.13) | 1504.58 (623.63) | 0.016 * |
| Baseline WMH, log | Mean (SD) | 1.77 (1.29) | 1.68 (1.31) | 1.77 (1.31) | 1.85 (1.26) | 0.764 |
| Follow-up WMH, log | Mean (SD) | 2.07 (1.37) | 2.06 (1.30) | 2.03 (1.40) | 2.12 (1.43) | 0.924 |
| Change of WMH | Mean (SD) | 0.31 (0.48) *** a | 0.37 (0.53) *** a | 0.25 (0.47) *** a | 0.28 (0.42) *** a | 0.337 |
| Total grey matter volume, baseline, cm3 | Mean (SD) | 623.72 (58.65) | 630.31 (56.56) | 609.45 (64.68) | 627.84 (54.87) | 0.127 |
| Mean thickness, baseline, mm | Mean (SD) | 2.47 (0.15) | 2.46 (0.15) | 2.45 (0.15) | 2.49 (0.15) | 0.374 |
| Gender | ||||||
| Male | n (%) | 89 (48.63%) | 44 (65.67%) | 17 (34.00%) | 28 (42.42%) | 0.001 ** |
| Female | n (%) | 94 (51.37%) | 23 (34.33%) | 33 (66.00%) | 38 (57.58%) | |
| Race/ethnicity | ||||||
| Non-Hispanic white and others | n (%) | 120 (65.57%) | 44 (65.67%) | 34 (68.00%) | 42 (63.64%) | 0.650 |
| Non-Hispanic black | n (%) | 40 (21.86%) | 12 (17.91%) | 12 (24.00%) | 16 (24.24%) | |
| Hispanic | n (%) | 23 (12.57%) | 11 (16.42%) | 4 (8.00%) | 8 (12.12%) |
| Model 1 | Model 2 | Model 3 | |||||||
|---|---|---|---|---|---|---|---|---|---|
| β (95% CI) | p | p-Inter a | β (95% CI) | p | p-Inter a | β (95% CI) | p | p-Inter a | |
| MeDi score | −0.015 ** (−0.027–−0.002) | 0.020 | -- | −0.014 ** (−0.026–−0.002) | 0.028 | -- | −0.014 ** (−0.026–−0.001) | 0.034 | -- |
| By age group | |||||||||
| Aged < 43 yrs (n = 51) | −0.038 *** (−0.057–−0.018) | 0.0002 | Ref. | −0.035*** (−0.056–−0.014) | 0.002 | Ref. | −0.035 *** (−0.058–−0.013) | 0.003 | Ref. |
| Aged 43–64 yrs (n = 72) | −0.002 (−0.020–0.024) | 0.872 | 0.024 ** | −0.005 (−0.032–0.022) | 0.730 | 0.067 * | −0.004 (−0.032–0.023) | 0.771 | 0.075 * |
| Aged ≥ 65 yrs (n = 60) | −0.002 (−0.021–0.017) | 0.836 | 0.017 ** | 0.0001 (−0.018–0.018) | 0.991 | 0.037 ** | 0.0003 (−0.018–0.019) | 0.971 | 0.037 ** |
| By gender | |||||||||
| Male (n = 89) | −0.007 (−0.024–0.010) | 0.429 | Ref. | −0.008 (−0.026–0.011) | 0.401 | Ref. | −0.006 (−0.024–0.013) | 0.526 | Ref. |
| Female (n = 94) | −0.022 ** (−0.041–−0.003) | 0.025 | 0.332 | −0.016 (−0.035–0.002) | 0.088 | 0.618 | −0.017 (−0.036–0.002) | 0.071 | 0.624 |
| By race/ethnicity | |||||||||
| Non-Hispanic White and other (n = 120) | −0.011 (−0.026–0.004) | 0.154 | Ref. | −0.015 ** (−0.030–−0.0003) | 0.045 | Ref. | −0.015 (−0.030–0.0002) | 0.052 | Ref. |
| Non-Hispanic Black (n = 40) | −0.009 (−0.037–0.019) | 0.517 | 0.957 | −0.006 (−0.039–0.028) | 0.731 | 0.628 | −0.008 (−0.043–0.027) | 0.646 | 0.622 |
| Hispanic (n = 23) | −0.020 (−0.060–0.019) | 0.297 | 0.293 | −0.007 (−0.056–0.041) | 0.751 | 0.471 | −0.007 (−0.060–0.047) | 0.793 | 0.445 |
| By MeDi group | |||||||||
| Low MeDi (n = 67) | −0.056 *** (−0.091–−0.020) | 0.003 | Ref. | −0.052 *** (−0.089–−0.015) | 0.007 | Ref. | −0.053 *** (−0.091–−0.015) | 0.008 | Ref. |
| Middle MeDi (n = 50) | −0.029 (−0.158–0.099) | 0.647 | 0.769 | −0.048 (−0.185–0.089) | 0.481 | 0.938 | −0.053 (−0.194–0.088) | 0.451 | 0.913 |
| High MeDi (n = 66) | 0.001 (−0.031–0.033) | 0.957 | 0.034 ** | 0.005 (−0.026–0.037) | 0.737 | 0.050 ** | 0.007 (−0.026–0.039) | 0.685 | 0.052 * |
| Total Participants b | Interaction of Age × Food c | |||||
|---|---|---|---|---|---|---|
| β | 95% CI | p | β | 95% CI | p-Inter | |
| Cereal | −0.034 | (−0.077–0.009) | 0.122 | −0.001 | (−0.003–0.001) | 0.368 |
| Potato | 0.024 | (−0.029–0.076) | 0.376 | −0.001 | (−0.004–0.002) | 0.449 |
| Fruit | 0.022 | (−0.031–0.075) | 0.409 | 0.001 | (−0.001–0.004) | 0.338 |
| Vegetable | −0.095 | (−0.162–−0.028) | 0.006 | 0.003 | (−0.0002–0.007) | 0.068 |
| Legumes and nuts | −0.020 | (−0.066–0.025) | 0.378 | 0.001 | (−0.001–0.004) | 0.337 |
| Fish | 0.071 | (−0.002–0.143) | 0.056 | 0.001 | (−0.004–0.005) | 0.797 |
| Olive Oil | 0.009 | (−0.037–0.055) | 0.700 | 0.001 | (−0.002–0.004) | 0.677 |
| Poultry a | −0.036 | (−0.083–0.012) | 0.138 | −0.0005 | (−0.003–0.002) | 0.705 |
| Red meat a | 0.006 | (−0.038–0.050) | 0.790 | 0.001 | (−0.001–0.004) | 0.304 |
| Dairy a | −0.045 | (−0.086–−0.004) | 0.031 | 0.002 | (−0.0001–0.004) | 0.065 |
| Alcohol a | 0.010 | (−0.029–0.050) | 0.609 | 0.003 | (0.00005–0.005) | 0.046 |
Publisher’s Note: MDPI stays neutral with regard to jurisdictional claims in published maps and institutional affiliations. |
© 2022 by the authors. Licensee MDPI, Basel, Switzerland. This article is an open access article distributed under the terms and conditions of the Creative Commons Attribution (CC BY) license (https://creativecommons.org/licenses/by/4.0/).
Share and Cite
Song, S.; Gaynor, A.M.; Cruz, E.; Lee, S.; Gazes, Y.; Habeck, C.; Stern, Y.; Gu, Y. Mediterranean Diet and White Matter Hyperintensity Change over Time in Cognitively Intact Adults. Nutrients 2022, 14, 3664. https://doi.org/10.3390/nu14173664
Song S, Gaynor AM, Cruz E, Lee S, Gazes Y, Habeck C, Stern Y, Gu Y. Mediterranean Diet and White Matter Hyperintensity Change over Time in Cognitively Intact Adults. Nutrients. 2022; 14(17):3664. https://doi.org/10.3390/nu14173664
Chicago/Turabian StyleSong, Suhang, Alexandra M. Gaynor, Emily Cruz, Seonjoo Lee, Yunglin Gazes, Christian Habeck, Yaakov Stern, and Yian Gu. 2022. "Mediterranean Diet and White Matter Hyperintensity Change over Time in Cognitively Intact Adults" Nutrients 14, no. 17: 3664. https://doi.org/10.3390/nu14173664
APA StyleSong, S., Gaynor, A. M., Cruz, E., Lee, S., Gazes, Y., Habeck, C., Stern, Y., & Gu, Y. (2022). Mediterranean Diet and White Matter Hyperintensity Change over Time in Cognitively Intact Adults. Nutrients, 14(17), 3664. https://doi.org/10.3390/nu14173664