
Total and Added Sugar Intakes Are Increasing among Children and Adolescents in China: Findings from CHNS 1997–2011


Abstract
:1. Introduction
2. Methods
2.1. Study Sample
2.2. Assessment of Sugar Intakes and Dietary Sources
2.3. Demographic Variables
2.4. Anthropometric Measurements
2.5. Statistical Analysis
3. Results
3.1. Participant Basic Demographics and Characteristics by Years
3.2. Comparisons of Basic Demographics and Characteristics by Total Sugar Intake Levels
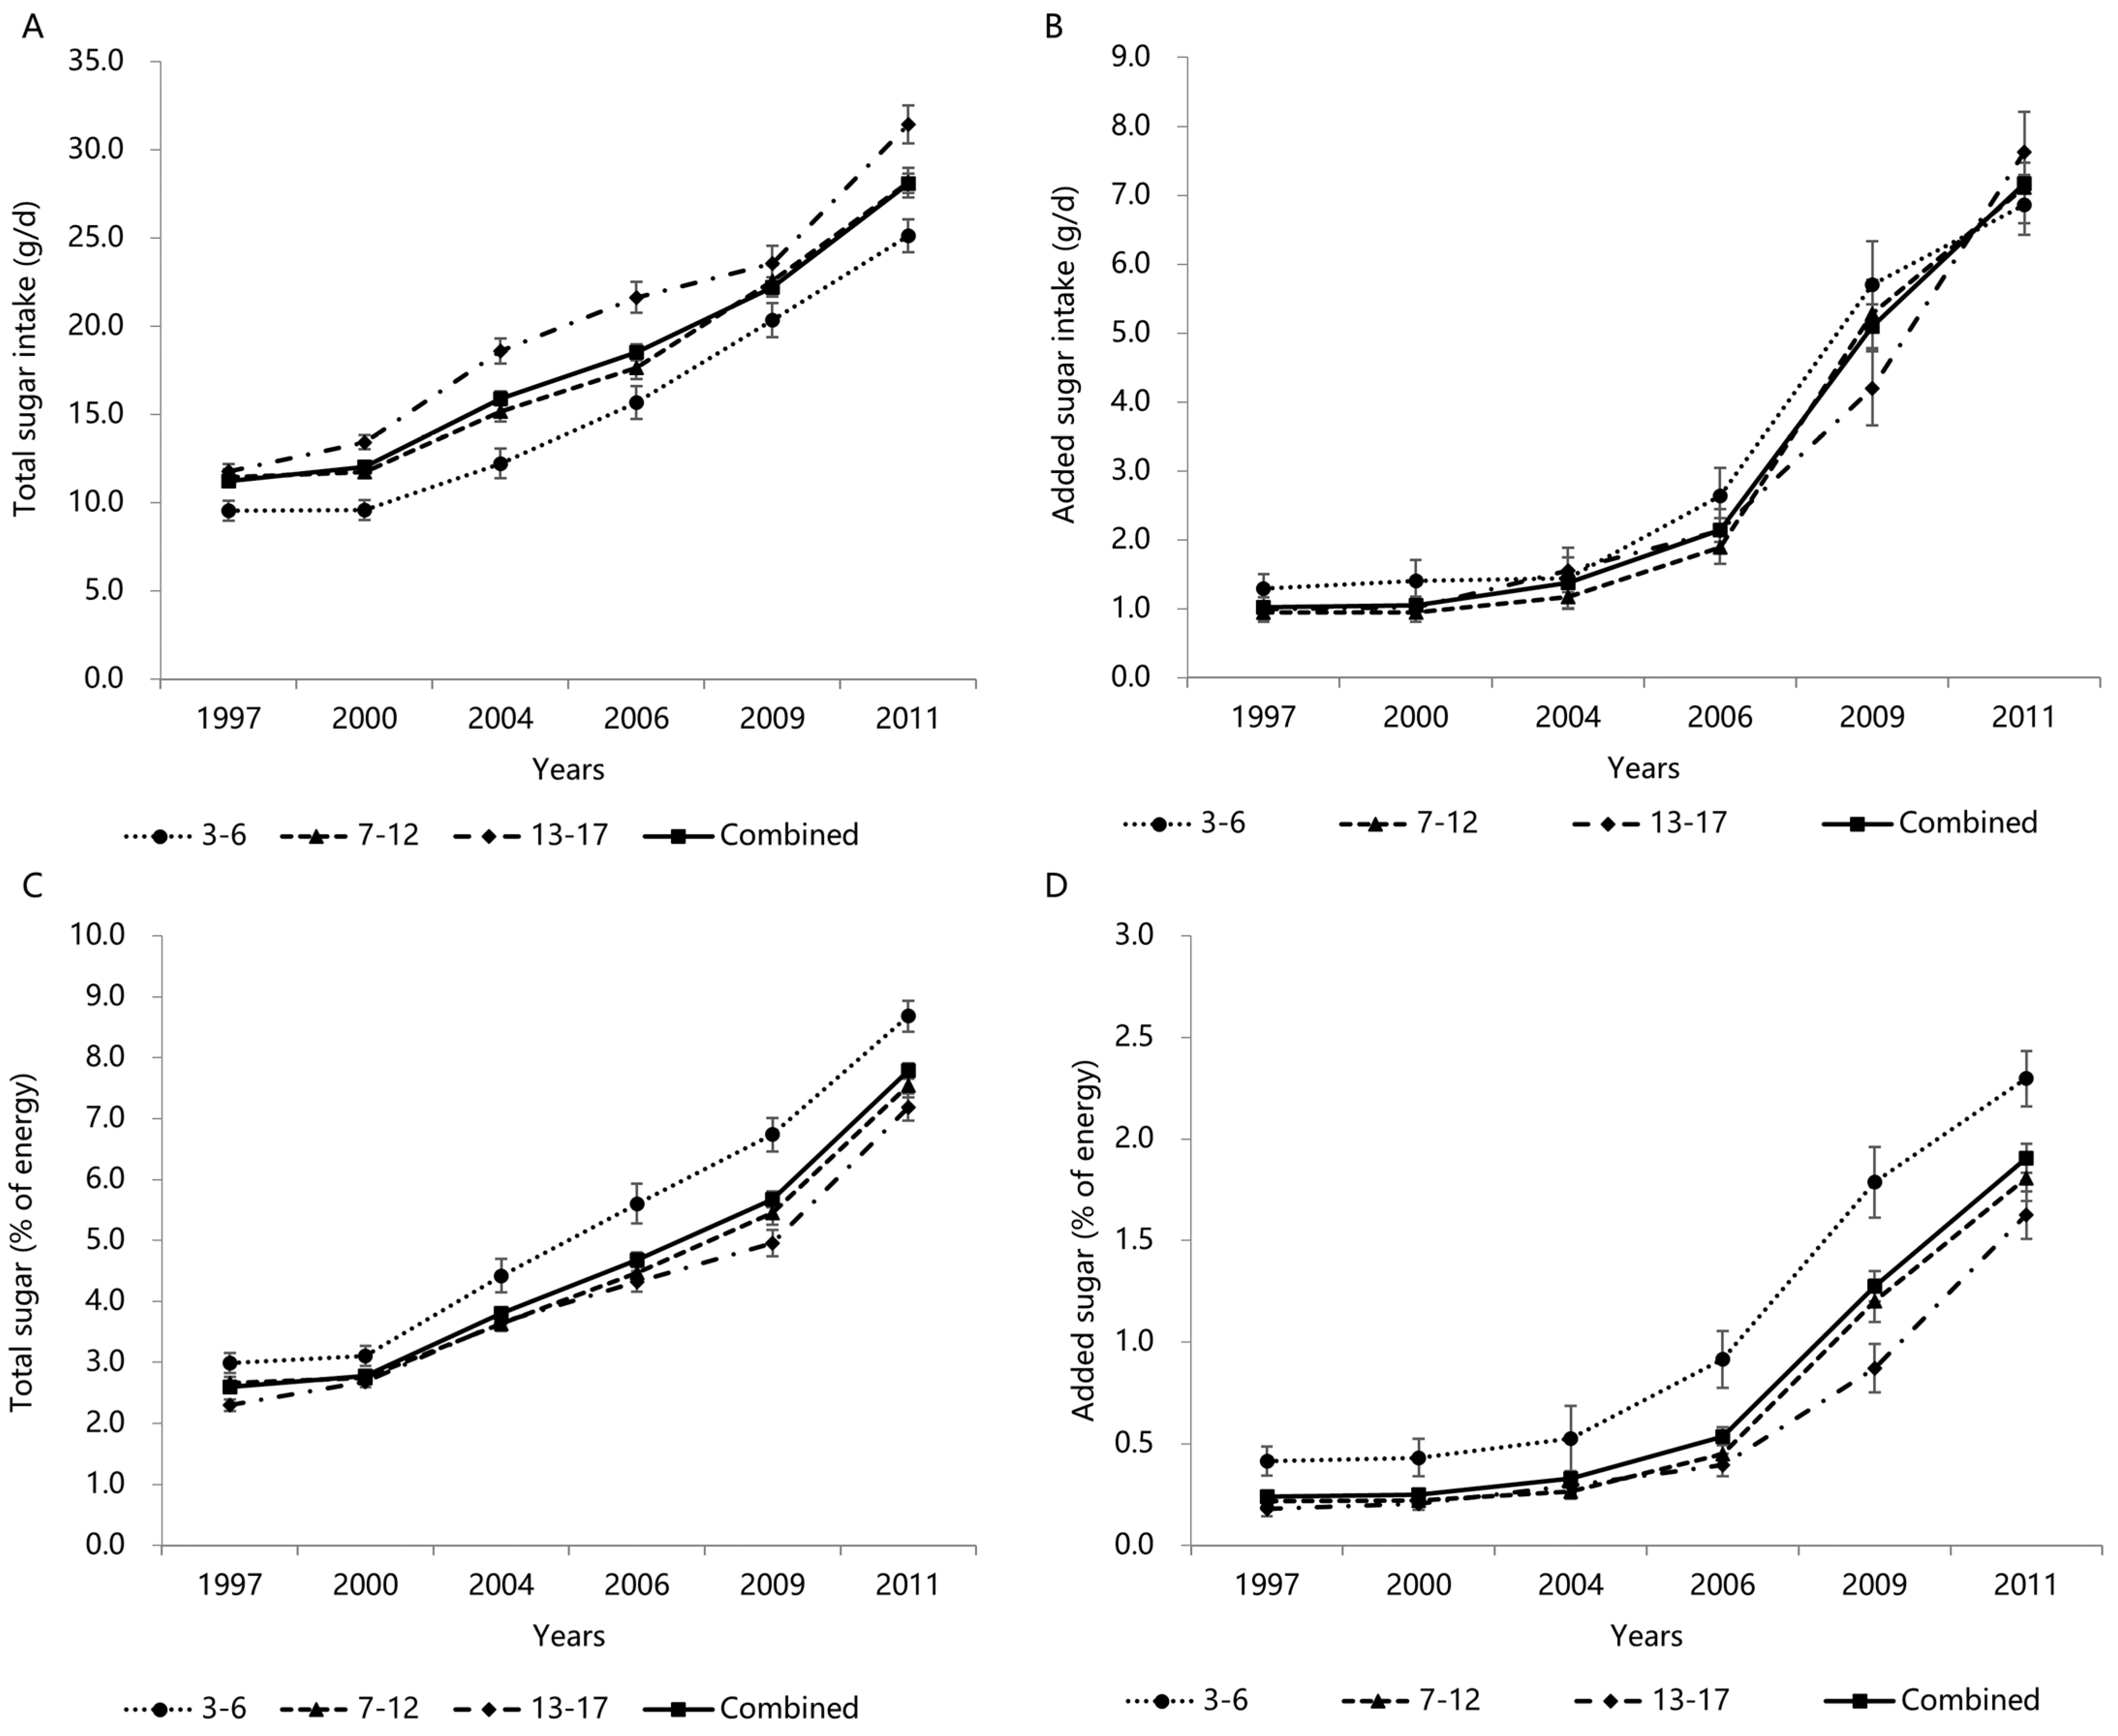
3.3. Trends in Total and Added Sugars Intake by Age Groups
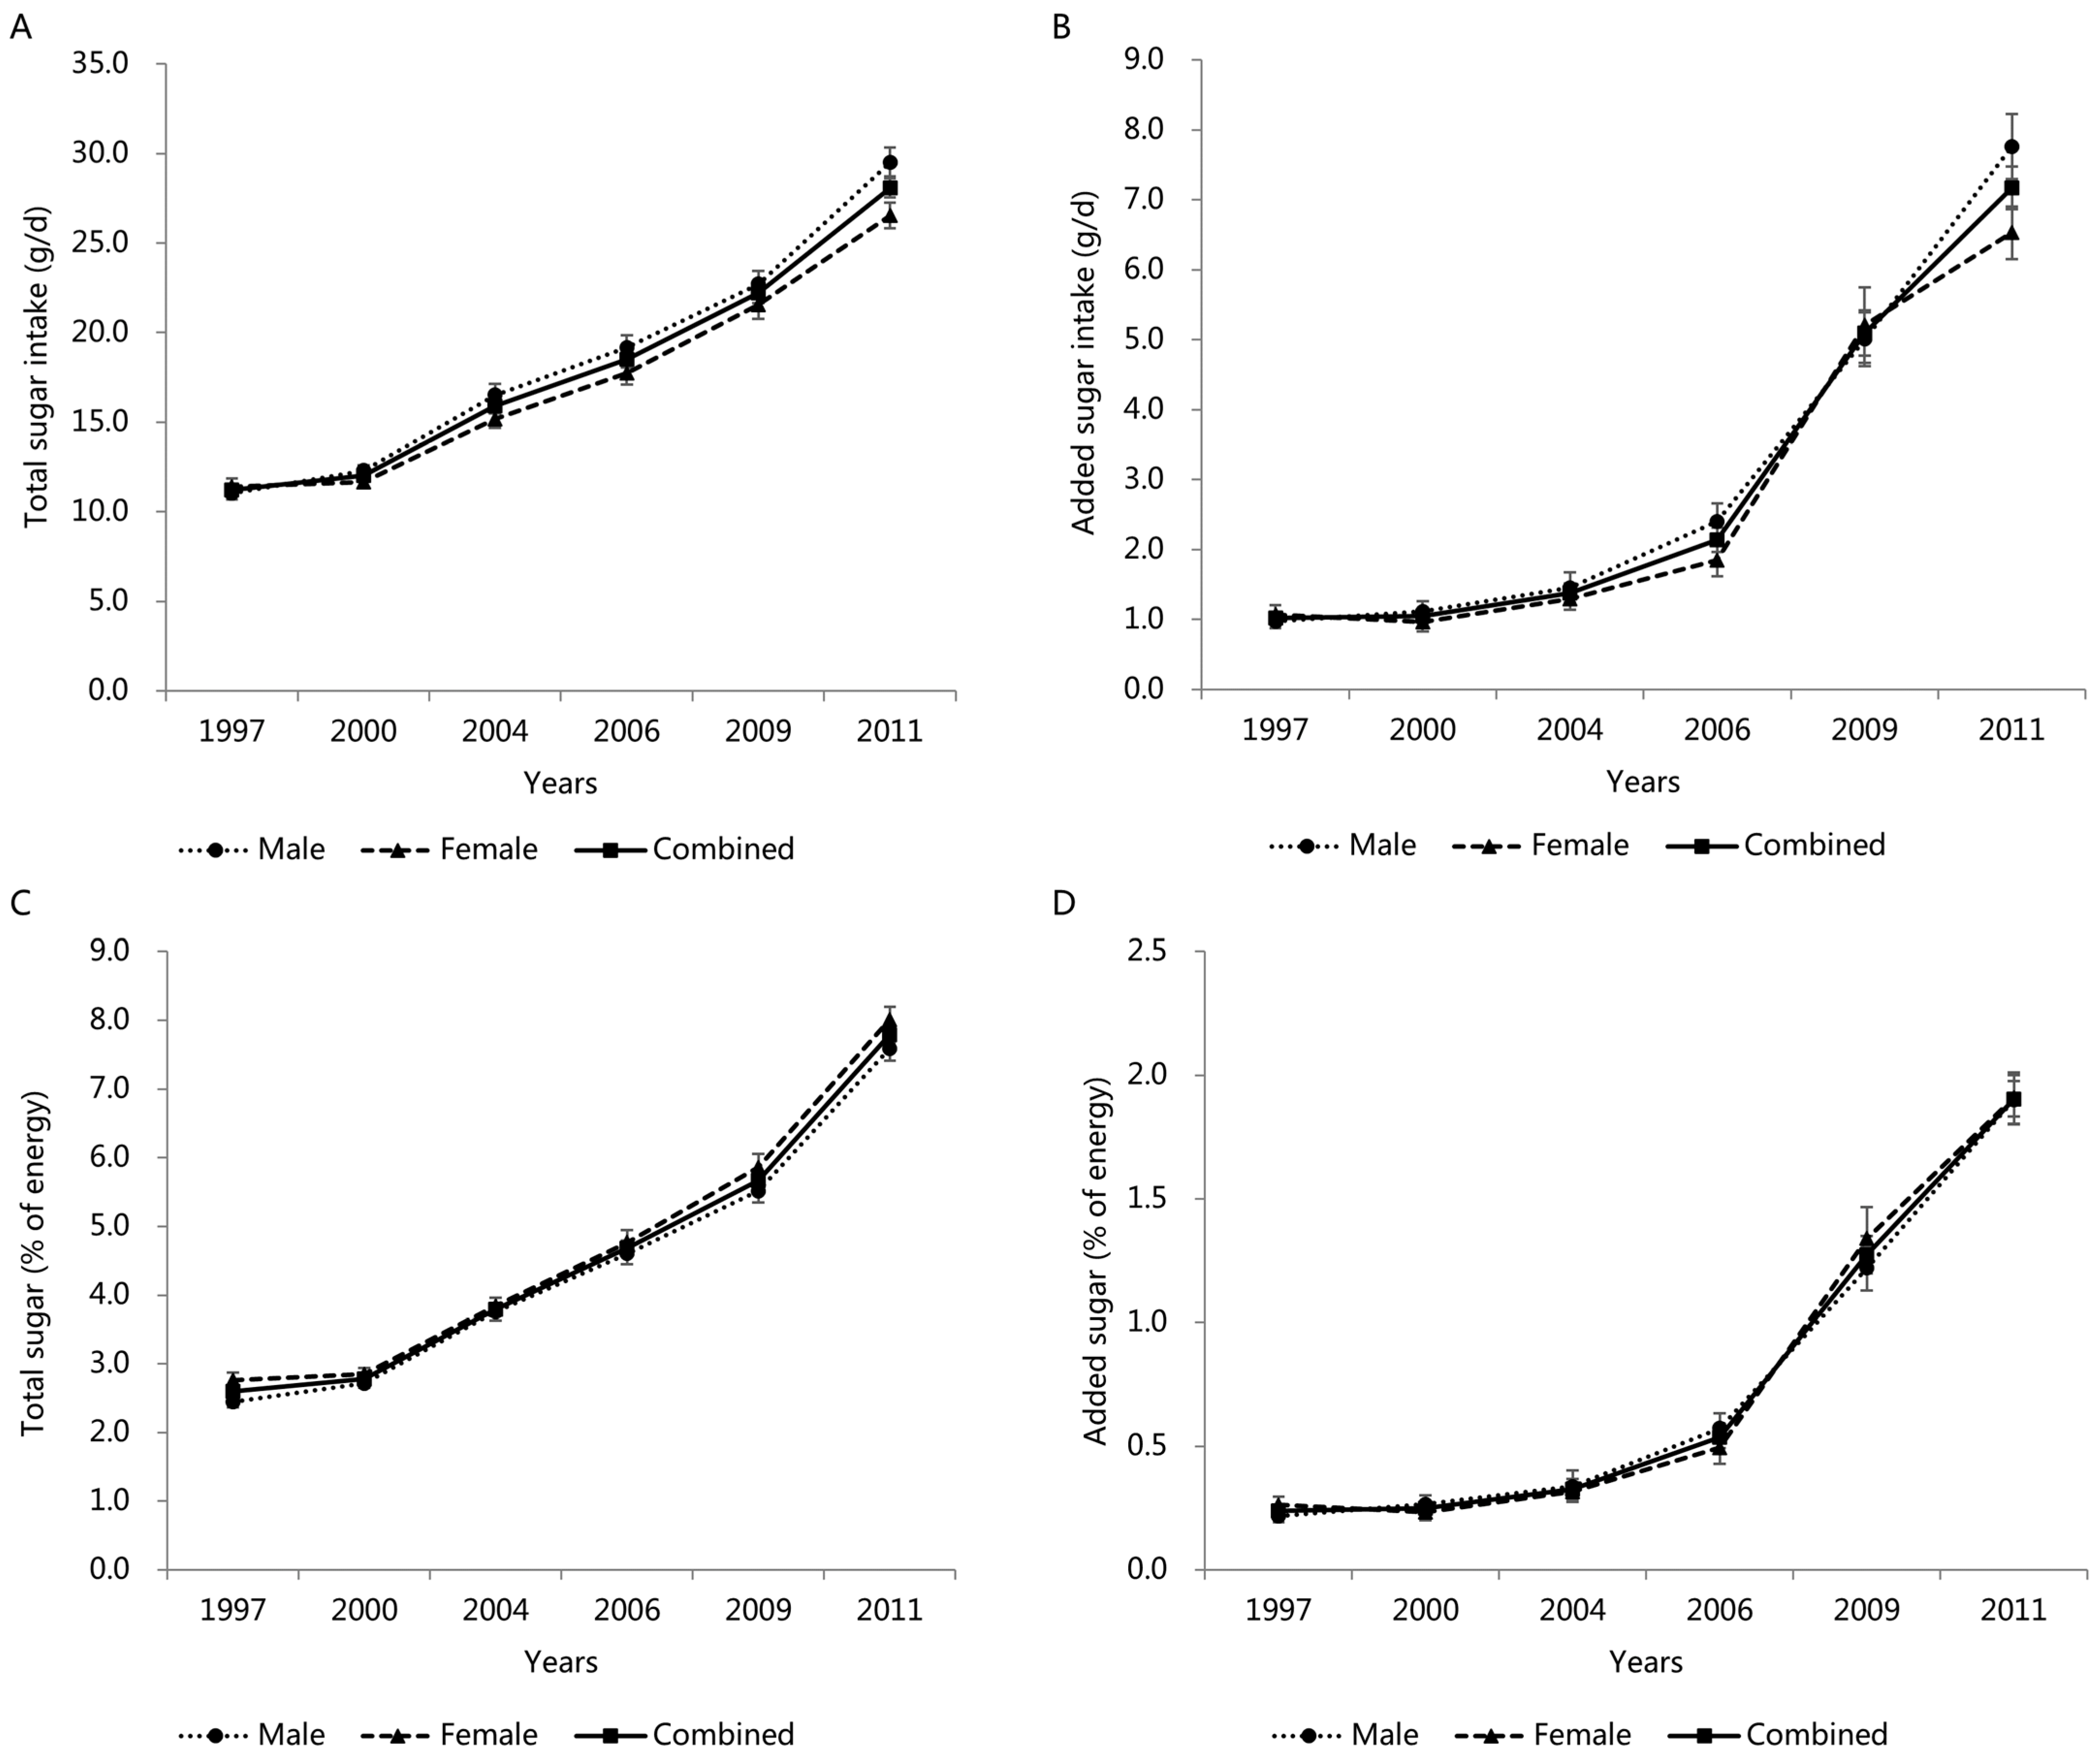
3.4. Trends in Total and Added Sugar Intake by Gender
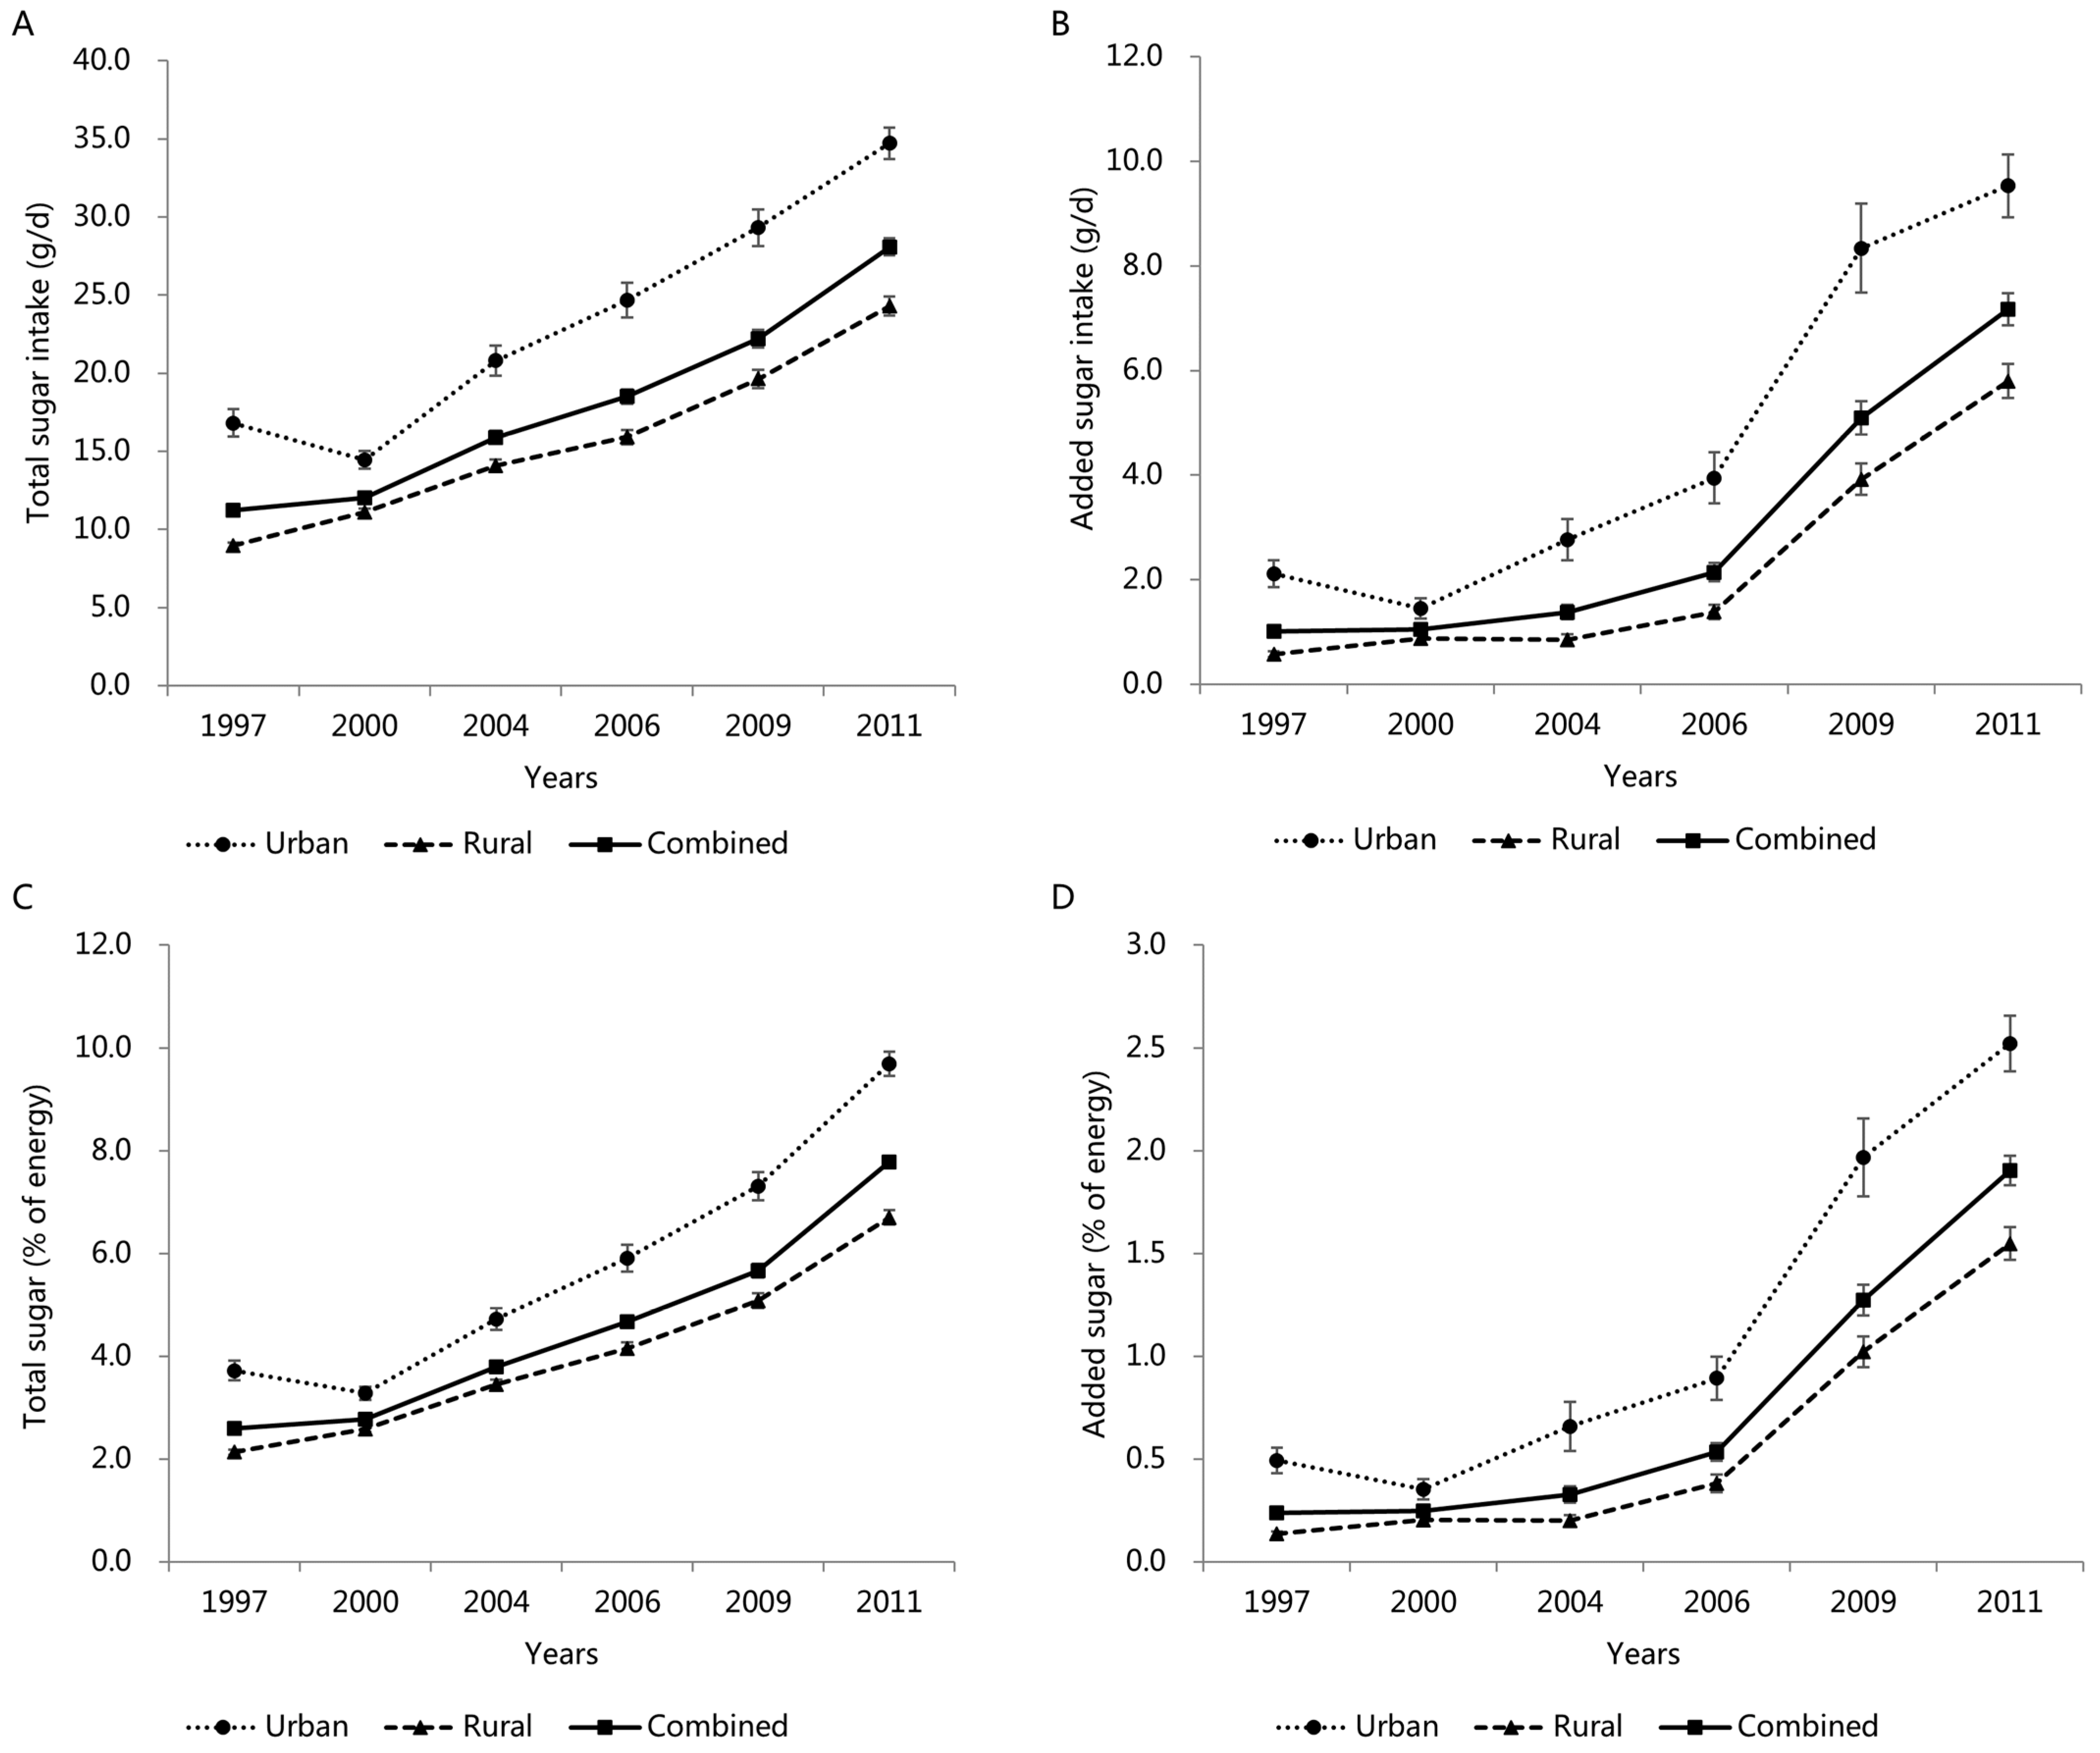
3.5. Trends in Total and Added Sugar Intake by Area
3.6. Trends in Total and Added Sugar Intake by BMI Categories
3.7. Trends in Total and Added Sugar Intake by Gender, Area, and BMI Categories among Different Age Groups
3.8. Dietary Sources of Total and Added Sugars
4. Discussion
5. Conclusions
Supplementary Materials
Author Contributions
Funding
Institutional Review Board Statement
Informed Consent Statement
Data Availability Statement
Acknowledgments
Conflicts of Interest
References
- Guideline: Sugars Intake for Adults and Children; World Health Organization: Geneva, Switzerland, 2015.
- Hong, J.; Whelton, H.; Douglas, G.; Kang, J. Consumption frequency of added sugars and UK children’s dental caries. Community Dent. Oral Epidemiol. 2018, 46, 457–464. [Google Scholar] [CrossRef] [PubMed]
- Gui, Z.H.; Zhu, Y.N.; Cai, L.; Sun, F.H.; Ma, Y.H.; Jing, J.; Chen, Y.J. Sugar-Sweetened Beverage Consumption and Risks of Obesity and Hypertension in Chinese Children and Adolescents: A National Cross-Sectional Analysis. Nutrients 2017, 9, 1302. [Google Scholar] [CrossRef] [PubMed]
- Malik, V.S.; Popkin, B.M.; Bray, G.A.; Després, J.P.; Willett, W.C.; Hu, F.B. Sugar-sweetened beverages and risk of metabolic syndrome and type 2 diabetes: A meta-analysis. Diabetes Care 2010, 33, 2477–2483. [Google Scholar] [CrossRef] [PubMed]
- Jensen, T.; Abdelmalek, M.F.; Sullivan, S.; Nadeau, K.J.; Green, M.; Roncal, C.; Nakagawa, T.; Kuwabara, M.; Sato, Y.; Kang, D.H.; et al. Fructose and sugar: A major mediator of non-alcoholic fatty liver disease. J. Hepatol. 2018, 68, 1063–1075. [Google Scholar] [CrossRef] [PubMed]
- Ter Horst, K.W.; Serlie, M.J. Fructose Consumption, Lipogenesis, and Non-Alcoholic Fatty Liver Disease. Nutrients 2017, 9, 981. [Google Scholar] [CrossRef] [PubMed]
- Vos, M.B.; Kaar, J.L.; Welsh, J.A.; Van Horn, L.V.; Feig, D.I.; Anderson, C.A.M.; Patel, M.J.; Cruz Munos, J.; Krebs, N.F.; Xanthakos, S.A.; et al. Added Sugars and Cardiovascular Disease Risk in Children: A Scientific Statement From the American Heart Association. Circulation 2017, 135, e1017–e1034. [Google Scholar] [CrossRef] [PubMed]
- U.S. Department of Agriculture & U.S. Department of Health and Human Services. Dietary Guidelines for Americans, 2020–2025 (9th ed.). Available online: https://www.dietaryguidelines.gov/resources/2020-2025-dietary-guidelines-online-materials (accessed on 25 April 2022).
- Welsh, J.A.; Welsh, J.A.; Sharma, A.J.; Grellinger, L.; Vos, M.B. Consumption of added sugars is decreasing in the United States. Am. J. Clin. Nutr. 2011, 94, 726–734. [Google Scholar] [CrossRef] [PubMed]
- Perrar, I.; Schmitting, S.; Della Corte, K.W.; Buyken, A.E.; Alexy, U. Age and time trends in sugar intake among children and adolescents: Results from the DONALD study. Eur. J. Nutr. 2020, 59, 1043–1054. [Google Scholar] [CrossRef] [PubMed]
- Hoffman, A.C.; Salgado, R.V.; Dresler, C.; Faller, R.W.; Bartlett, C. Flavour preferences in youth versus adults: A review. Tob. Control. 2016, 25 (Suppl. 2), ii32–ii39. [Google Scholar] [CrossRef] [PubMed]
- The, N.S.; Suchindran, C.; North, K.E.; Popkin, B.M.; Gordon-Larsen, P. Association of Adolescent Obesity With Risk of Severe Obesity in Adulthood. JAMA 2010, 304, 2042–2047. [Google Scholar] [CrossRef] [PubMed]
- Power, C.; Kuh, D.; Morton, S. From developmental origins of adult disease to life course research on adult disease and aging: Insights from birth cohort studies. Annu. Rev. Public Health 2013, 34, 7–28. [Google Scholar] [CrossRef] [PubMed]
- China Health and Nutrition Survey. Available online: https://www.cpc.unc.edu/projects/china (accessed on 11 May 2022).
- Popkin, B.M.; Du, S.; Zhai, F.; Zhang, B. Cohort Profile: The China Health and Nutrition Survey—Monitoring and understanding socio-economic and health change in China, 1989–2011. Int. J. Epidemiol. 2010, 39, 1435–1440. [Google Scholar] [CrossRef] [PubMed]
- Guangya, W.; Zhiping, S. China Food Composition Tables 1991; People’s Medical Publishing House: Beijing, China, 1991. [Google Scholar]
- Yuexin, Y.; Guangya, W.; Xingchang, P. China Food Composition Tables 2002; Peking University Medical Press: Beijing, China, 2002. [Google Scholar]
- Yuexin, Y. China Food Composition Tables 2004; Peking University Medical Press: Beijing, China, 2005. [Google Scholar]
- U.S. Department of Agriculture, Agricultural Research Service. USDA National Nutrient Database for Standard Reference, Release 28 (Slightly revised). Available online: http://www.ars.usda.gov/nea/bhnrc/mafcl (accessed on 12 March 2019).
- U.S. Department of Agriculture, Agricultural Research Service. Food Patterns Equivalents Database 2015–2016. Available online: http://www.ars.usda.gov/nea/bhnrc/fsrg (accessed on 12 March 2019).
- Cole, T.J. Establishing a standard definition for child overweight and obesity worldwide: International survey. BMJ 2000, 320, 1240. [Google Scholar] [CrossRef] [PubMed]
- Afeiche, M.C.; Koyratty, B.N.S.; Wang, D.; Jacquier, E.F.; Lê, K.A. Intakes and sources of total and added sugars among 4 to 13-year-old children in China, Mexico and the United States. Pediatr. Obes. 2018, 13, 204–212. [Google Scholar] [CrossRef] [PubMed]
- Li, Y.; Wang, D.D.; Ley, S.H.; Vasanti, M.; Howard, A.G.; He, Y.; Hu, F.B. Time Trends of Dietary and Lifestyle Factors and Their Potential Impact on Diabetes Burden in China. Diabetes Care 2017, 40, 1685–1694. [Google Scholar] [CrossRef] [PubMed]
- Zhemin, L. Change of Chinese Inhabitant’s Food Consumption and Nutrition Development in the Last 50 Years. Resour. Sci. 2007, 1, 27–35. [Google Scholar]
- Lei, L.; Rangan, A.; Flood, V.M.; Louie, J.C.Y. Dietary intake and food sources of added sugar in the Australian population. Br. J. Nutr. 2016, 115, 868–877. [Google Scholar] [CrossRef] [PubMed]
- Institute of Medicine (US). Committee on Prevention of Obesity in Children and Youth. In Preventing Childhood Obesity: Health in The Balance; Koplan, J.P., Liverman, C.T., Kraak, V.I., Eds.; National Academies Press (US): Washington, DC, USA, 2005. [Google Scholar]
- Ogden, C.L.; Carroll, M.D.; Curtin, L.R.; Lamb, M.M.; Flegal, K.M. Prevalence of high body mass index in US children and adolescents, 2007–2008. JAMA 2010, 303, 242–249. [Google Scholar] [CrossRef] [PubMed]
- U.S. Department of Agriculture & U.S. Department of Health and Human Services. Previous Editions of the Dietary Guidelines for Americans. Available online: https://www.dietaryguidelines.gov/about-dietary-guidelines/previous-editions (accessed on 11 May 2022).
- Li, B.; Pallan, M.; Liu, W.J.; Hemming, K.; Frew, E.; Lin, R.; Liu, W.; Martin, J.; Zanganeh, M.; Hurley, K.; et al. The CHIRPY DRAGON intervention in preventing obesity in Chinese primary-school--aged children: A cluster-randomised controlled trial. PLoS Med. 2019, 16, e1002971. [Google Scholar] [CrossRef] [PubMed]
- The Chinese Nutrition Society. Dietary Guidelines for Chinese Residents (2016). Available online: http://dg.cnsoc.org/article/2016b.html (accessed on 12 May 2022).
- The Chinese Nutrition Society. Dietary Guidelines for Chinese Residents (2022). Available online: http://dg.cnsoc.org/article/2021b.html (accessed on 12 May 2022).
- Chen, P.; Li, F.; Harmer, P. Healthy China 2030: Moving from blueprint to action with a new focus on public health. Lancet Public Health 2019, 4, e447. [Google Scholar] [CrossRef]


| 1997 (n = 3078) | 2000 (n = 2938) | 2004 (n = 1950) | 2006 (n = 1624) | 2009 (n = 1544) | 2011 (n = 2078) | Total (n = 13,212) | |
|---|---|---|---|---|---|---|---|
| Characteristics (mean ± SE 2) | |||||||
| Age (year) | 10.4 ± 0.1 | 10.9 ± 0.1 | 10.6 ± 0.1 | 10.2 ± 0.1 | 9.6 ± 0.1 | 9.3 ± 0.1 | 10.2 ± 0.0 |
| BMI 3 (kg/m2) | 17.0 ± 0.1 | 17.3 ± 0.1 | 17.6 ± 0.1 | 17.3 ± 0.1 | 17.2 ± 0.1 | 17.9 ± 0.1 | 17.4 ± 0.0 |
| Total energy intake (kcal/d) | 1844.3 ± 11.0 | 1831.9 ± 11.6 | 1747.7 ± 15.0 | 1668.5 ± 15.7 | 1601.4 ± 15.1 | 1471.4 ± 12.6 | 1719.3 ± 5.5 |
| Total fat intake (g/d) | 51.0 ± 0.6 | 57.7 ± 0.7 | 54.6 ± 0.8 | 54.3 ± 0.8 | 56.8 ± 1.0 | 54.7 ± 0.7 | 54.7 ± 0.3 |
| Total fat (%E 4) | 24.8 ± 0.2 | 27.5 ± 0.2 | 27.5 ± 0.3 | 29.0 ± 0.3 | 31.0 ± 0.3 | 33.4 ± 0.3 | 28.4 ± 0.1 |
| Total protein intake (g/d) | 55.6 ± 0.6 | 55.4 ± 0.4 | 53.5 ± 0.6 | 50.8 ± 0.5 | 50.1 ± 0.5 | 50.2 ± 0.5 | 53.1 ± 0.2 |
| Total protein (%E) | 12.1 ± 0.0 | 12.2 ± 0.0 | 12.4 ± 0.1 | 12.3 ± 0.1 | 12.7 ± 0.1 | 14.0 ± 0.1 | 12.5 ± 0.0 |
| Total carbohydrate intake (g/d) | 289.8 ± 2.0 | 273.4 ± 1.9 | 256.3 ± 2.3 | 241.2 ± 2.6 | 221.5 ± 2.2 | 190.2 ± 1.9 | 251.6 ± 0.9 |
| Total carbohydrate (%E) | 63.2 ± 0.2 | 60.3 ± 0.2 | 60.1 ± 0.3 | 58.6 ± 0.3 | 56.3 ± 0.3 | 52.5 ± 0.3 | 59.1 ± 0.1 |
| Total sugar intake (g/d) | 11.2 ± 0.3 | 12.0 ± 0.2 | 15.9 ± 0.4 | 18.5 ± 0.5 | 22.2 ± 0.5 | 28.1 ± 0.5 | 16.9 ± 0.2 |
| Total sugar (%E) | 2.6 ± 0.1 | 2.8 ± 0.1 | 3.8 ± 0.1 | 4.7 ± 0.1 | 5.7 ± 0.1 | 7.8 ± 0.1 | 4.2 ± 0.0 |
| Added sugar intake (g/d) | 1.0 ± 0.1 | 1.0 ± 0.1 | 1.4 ± 0.1 | 2.1 ± 0.2 | 5.1 ± 0.3 | 7.2 ± 0.3 | 2.7 ± 0.1 |
| Added sugar (%E) | 0.2 ± 0.0 | 0.3 ± 0.0 | 0.3 ± 0.0 | 0.5 ± 0.0 | 1.3 ± 0.1 | 1.9 ± 0.1 | 0.7 ± 0.0 |
| Annual household income (yuan) | 14,051.4 ± 229.7 | 15,727.7 ± 310.5 | 19,888.5 ± 421.5 | 23,930.9 ± 822.5 | 38,682.6 ± 1110.3 | 52,384.7 ± 1262.5 | 25,395.3 ± 304.0 |
| Characteristics (n (%)) | |||||||
| Gender | |||||||
| Boys | 1643 (53.4) | 1563 (53.2) | 1040 (53.3) | 870 (53.6) | 856 (55.4) | 1080 (52.0) | 7052 (53.4) |
| Girls | 1435 (46.6) | 1375 (46.8) | 910 (46.7) | 754 (46.4) | 688 (44.6) | 998 (48.0) | 6160 (46.6) |
| Area of residence | |||||||
| Urban | 883 (28.8) | 746 (27.8) | 542 (28.1) | 471 (29.4) | 413 (26.9) | 745 (36.2) | 3800 (29.5) |
| Rural | 2182 (71.2) | 1940 (72.2) | 1387 (71.9) | 1131 (70.6) | 1122 (73.1) | 1313 (63.8) | 9075 (70.5) |
| BMI categories | |||||||
| Non-overweight/obesity | 2527 (92.8) | 2370 (92.0) | 1548 (89.0) | 1248 (88.3) | 1191 (86.4) | 1605 (81.2) | 10,489 (88.8) |
| Overweight | 154 (5.7) | 162 (6.3) | 145 (8.3) | 118 (8.4) | 135 (9.8) | 223 (11.3) | 937 (7.9) |
| Obesity | 43 (1.6) | 44 (1.7) | 46 (2.6) | 47 (3.3) | 52 (3.8) | 149 (7.5) | 381 (3.2) |
| Medical insurance | |||||||
| Yes | 515 (17.1) | 466 (16.6) | 465 (24.3) | 659 (41.1) | 1323 (86.2) | 1901 (92.4) | 5329 (41.2) |
| No | 2489 (82.9) | 2334 (83.4) | 1447 (75.7) | 943 (58.9) | 212 (13.8) | 157 (7.6) | 7582 (58.7) |
| 3–6 Years | 7–12 Years | 13–17 Years | ||||||||||
|---|---|---|---|---|---|---|---|---|---|---|---|---|
| Boys (n = 1553) | Girls (n = 1316) | Boys (n = 3164) | Girls (n = 2793) | Boys (n = 2335) | Girls (n = 2051) | |||||||
| Q1 | Q2 | Q1 | Q2 | Q1 | Q2 | Q1 | Q2 | Q1 | Q2 | Q1 | Q2 | |
| Characteristics (mean ± SE 2) | ||||||||||||
| Age (year) | 4.5 ± 0.0 | 4.6 ± 0.0 | 4.6 ± 0.0 | 4.6 ± 0.0 | 9.6 ± 0.0 | 9.7 ± 0.0 c | 9.6 ± 0.0 | 9.7 ± 0.0 c | 14.8 ± 0.0 | 14.8 ± 0.0 | 14.7 ± 0.0 | 14.8 ± 0.0 |
| BMI 3 (kg/m2) | 16.0 ± 0.1 | 16.4 ± 0.2 c | 15.6 ± 0.1 | 15.8 ± 0.1 | 16.5 ± 0.1 | 17.1 ± 0.1 a | 16.2 ± 0.1 | 16.7 ± 0.1 a | 18.9 ± 0.1 | 19.6 ± 0.1 a | 19.0 ± 0.1 | 19.5 ± 0.1 a |
| Total energy intake (kcal/d) | 1162.7 ± 14.6 | 1320.0 ± 16.7 a | 1134.0 ± 15.9 | 1224.6 ± 15.5 a | 1718.7 ± 13.7 | 1814.1 ± 13.9 a | 1599.3 ± 13.8 | 1670.6 ± 14.7 b | 2151.3 ± 17.8 | 2297.7 ± 19.8 a | 1866.3 ± 16.4 | 1878.9 ± 17.4 |
| Total fat intake (g/d) | 36.3 ± 0.8 | 46.5 ± 0.9 a | 34.9 ± 1.4 | 44.8 ± 0.9 a | 51.4 ± 0.8 | 60.6 ± 0.8 a | 48.2 ± 0.8 | 57.0 ± 0.9 a | 63.2 ± 1.1 | 73.5 ± 1.4 a | 56.1 ± 1.0 | 63.0 ± 1.2 a |
| Total fat (%E 4) | 28.4 ± 0.4 | 31.4 ± 0.4 a | 27.5 ± 0.5 | 32.5 ± 0.4 a | 26.5 ± 0.3 | 29.6 ± 0.3 a | 27.0 ± 0.3 | 30.2 ± 0.3 a | 25.8 ± 0.3 | 28.0 ± 0.3 a | 26.8 ± 0.4 | 29.4 ± 0.4 a |
| Total protein intake (g/d) | 34.0 ± 0.5 | 43.4 ± 0.6 a | 32.8 ± 0.6 | 39.8 ± 0.6 a | 51.0 ± 0.5 | 59.3 ± 0.9 a | 47.1 ± 0.5 | 53.3 ± 0.5 a | 64.4 ± 0.7 | 73.0 ± 0.8 a | 55.8 ± 0.7 | 60.5 ± 0.6 a |
| Total protein (%E) | 12.1 ± 0.1 | 13.4 ± 0.1 a | 12.1 ± 0.1 | 13.3 ± 0.1 a | 12.0 ± 0.1 | 13.0 ± 0.1 a | 11.9 ± 0.1 | 13.0 ± 0.1 a | 12.0 ± 0.1 | 12.8 ± 0.1 a | 12.0 ± 0.1 | 13.0 ± 0.1 a |
| Total carbohydrate intake (g/d) | 167.4 ± 2.4 | 178.6 ± 2.6 a | 163.7 ± 2.7 | 163.1 ± 2.4 a | 260.6 ± 2.3 | 260.2 ± 2.5 | 242.6 ± 2.4 | 235.9 ± 2.4 b | 332.4 ± 3.1 | 338.7 ± 3.5 | 283.8 ± 2.9 | 267.3 ± 2.8 a |
| Total carbohydrate (%E) | 59.5 ± 0.4 | 55.2 ± 0.4 a | 60.4 ± 0.5 | 54.2 ± 0.5 a | 61.5 ± 0.3 | 57.4 ± 0.3 a | 61.1 ± 0.3 | 56.8 ± 0.3 a | 62.1 ± 0.3 | 59.1 ± 0.3 a | 61.2 ± 0.4 | 57.5 ± 0.4 a |
| Total sugar intake (g/d) | 4.2 ± 0.1 | 28.2 ± 0.8 a | 4.1 ± 0.1 | 26.8 ± 0.7 a | 5.3 ± 0.1 | 28.5 ± 0.6 a | 5.2 ± 0.1 | 26.7 ± 0.6 a | 6.5 ± 0.1 | 31.1 ± 0.6 a | 5.9 ± 0.1 | 29.3 ± 0.6 a |
| Total sugar (%E) | 1.6 ± 0.0 | 8.9 ± 0.2 a | 1.6 ± 0.0 | 9.1 ± 0.2 a | 1.3 ± 0.0 | 6.7 ± 0.1 a | 1.4 ± 0.0 | 6.8 ± 0.1 a | 1.3 ± 0.0 | 5.7 ± 0.1 a | 1.4 ± 0.0 | 6.7 ± 0.2 a |
| Added sugar intake (g/d) | 0.2 ± 0.0 | 6.9 ± 0.5 a | 0.2 ± 0.0 | 6.3 ± 0.5 a | 0.2 ± 0.0 | 5.1 ± 0.3 a | 0.2 ± 0.0 | 4.5 ± 0.3 a | 0.2 ± 0.0 | 4.7 ± 0.3 a | 0.2 ± 0.0 | 4.4 ± 0.4 a |
| Added sugar (%E) | 0.1 ± 0.0 | 2.2 ± 0.1 a | 0.1 ± 0.0 | 2.1 ± 0.1 a | 0.0 ± 0.0 | 1.2 ± 0.1 a | 0.1 ± 0.0 | 1.1 ± 0.1 a | 0.0 ± 0.0 | 0.9 ± 0.1 a | 0.1 ± 0.0 | 1.0 ± 0.1 a |
| Annual household income (yuan) | 21,096.9 ± 1041.1 | 38,736.2 ± 1797.0 a | 20,570.2 ± 860.5 | 40,766.4 ± 1921.7 a | 19,415.4 ± 775.4 | 30,091.0 ± 980.8 a | 18,016.9 ± 544.7 | 28,481.1 ± 919.1 a | 18,257.0 ± 615.2 | 29,277.5 ± 1276.7 a | 17,960.6 ± 525.3 | 30,632.4 ± 1292.8 a |
| Characteristics (n (%)) | ||||||||||||
| Area of residence | ||||||||||||
| Urban | 116 (15.3) | 250 (32.8) a | 133 (20.8) | 269 (41.2) a | 316 (20.3) | 493 (31.7) a | 288 (21.2) | 526 (32.8) a | 309 (27.7) | 417 (36.9) a | 283 (29.0) | 400 (40.1) a |
| Rural | 642 (84.7) | 512 (67.2) | 507 (79.2) | 384 (58.8) | 1243 (79.7) | 1061 (68.3) | 1068 (78.8) | 848 (67.2) | 805 (72.3) | 714 (63.1) | 694 (71.0) | 597 (59.9) |
| BMI categories | ||||||||||||
| Non-overweight/obesity | 586 (87.5) | 569 (83.6) | 484 (86.1) | 470 (81.7) | 1303 (90.0) | 1202 (83.3) a | 1154 (91.4) | 1110 (83.6) a | 948 (93.3) | 920 (89.3) b | 876 (96.6) | 867 (93.9) c |
| Overweight | 46 (6.9) | 54 (7.9) | 41 (7.3) | 59 (10.3) | 104 (7.2) | 176 (12.2) | 81 (6.4) | 145 (7.9) | 64 (6.3) | 92 (8.9) | 26 (2.9) | 49 (5.3) |
| Obesity | 38 (5.7) | 58 (8.5) | 37 (6.6) | 46 (8.0) | 41 (2.8) | 65 (4.5) | 27 (2.1) | 35 (8.5) | 4 (0.4) | 18 (1.7) | 5 (0.6) | 7 (0.8) |
| Medical insurance | ||||||||||||
| Yes | 281 (37.3) | 443 (58.2) a | 217 (33.9) | 399 (61.2) a | 474 (30.5) | 837 (53.9) a | 443 (32.3) | 678 (58.2) a | 296 (26.3) | 515 (45.1) a | 292 (29.5) | 454 (45.2) a |
| No | 473 (62.7) | 318 (41.8) | 423 (66.1) | 253 (38.8) | 1080 (69.5) | 717 (46.1) | 927 (67.7) | 684 (41.8) | 831 (73.7) | 626 (54.9) | 699 (70.5) | 551 (54.8) |
| 1997 | 2000 | 2004 | 2006 | 2009 | 2011 | ||
|---|---|---|---|---|---|---|---|
| 3–6 years | |||||||
| n = 525 | n = 482 | n = 403 | n = 377 | n = 445 | n = 637 | ||
| Gender | |||||||
| Boys | Total sugar intake (g/d) | 9.5 ± 0.8 | 10.1 ± 0.8 | 13.1 ± 1.4 | 16.2 ± 1.3 | 19.8 ± 1.3 | 25.8 ± 1.4 |
| Total sugar (%E 3) | 2.9 ± 0.3 | 3.1 ± 0.2 | 4.7 ± 0.4 | 5.6 ± 0.4 | 6.6 ± 0.4 | 8.3 ± 0.3 | |
| Added sugar intake (g/d) | 1.2 ± 0.3 | 2.1 ± 0.6 | 1.9 ± 0.8 | 2.8 ± 0.6 | 5.2 ± 0.8 | 6.9 ± 0.6 | |
| Added sugar (%E) | 0.4 ± 0.1 | 0.6 ± 0.2 | 0.7 ± 0.3 | 0.9 ± 0.2 | 1.7 ± 0.2 | 2.2 ± 0.2 | |
| Girls | Total sugar intake (g/d) | 9.6 ± 0.7 | 8.9 ± 0.7 | 11.1 ± 0.8 | 15.1 ± 1.4 | 21.1 ± 1.5 | 24.4 ± 1.1 |
| Total sugar (%E) | 3.1 ± 0.2 | 3.1 ± 0.2 | 4.1 ± 0.3 | 5.6 ± 0.5 | 7.0 ± 0.4 | 9.1 ± 0.4 | |
| Added sugar intake (g/d) | 1.4 ± 0.3 | 0.7 ± 0.2 | 0.8 ± 0.2 | 2.5 ± 0.6 | 6.3 ± 1.1 | 6.8 ± 0.6 | |
| Added sugar (%E) | 0.5 ± 0.1 | 0.2 ± 0.1 | 0.3 ± 0.1 | 0.9 ± 0.2 | 1.9 ± 0.3 | 2.4 ± 0.2 | |
| Area | |||||||
| Urban | Total sugar intake (g/d) | 15.8 ± 1.5 | 12.4 ± 1.4 | 19.9 ± 2.5 | 22.7 ± 2.4 | 26.0 ± 2.0 | 34.5 ± 1.9 |
| Total sugar (%E) | 4.6 ± 0.4 | 4.0 ± 0.4 | 6.8 ± 0.9 | 7.6 ± 0.8 | 8.3 ± 0.5 | 11.9 ± 0.5 | |
| Added sugar intake (g/d) | 3.0 ± 0.7 | 1.3 ± 0.4 | 4.0 ± 1.7 | 4.5 ± 1.2 | 8.9 ± 1.6 | 9.5 ± 0.9 | |
| Added sugar (%E) | 0.9 ± 0.2 | 0.5 ± 0.1 | 1.5 ± 0.6 | 1.4 ± 0.3 | 2.5 ± 0.4 | 3.2 ± 0.3 | |
| Rural | Total sugar intake (g/d) | 7.3 ± 0.5 | 8.4 ± 0.6 | 9.7 ± 0.7 | 12.9 ± 0.9 | 18.4 ± 1.1 | 20.8 ± 1.0 |
| Total sugar (%E) | 2.4 ± 0.2 | 2.8 ± 0.2 | 3.7 ± 0.2 | 4.8 ± 0.3 | 6.2 ± 0.3 | 7.2 ± 0.3 | |
| Added sugar intake (g/d) | 0.7 ± 0.1 | 1.2 ± 0.4 | 0.6 ± 0.2 | 1.9 ± 0.3 | 4.6 ± 0.7 | 5.7 ± 0.5 | |
| Added sugar (%E) | 0.2 ± 0.1 | 0.4 ± 0.1 | 0.2 ± 0.1 | 0.7 ± 0.1 | 1.5 ± 0.2 | 1.9 ± 0.1 | |
| BMI 1 categories | |||||||
| Non-overweight/obesity | Total sugar intake (g/d) | 10.0 ± 0.7 | 9.1 ± 0.6 | 12.1 ± 0.9 | 15.4 ± 1.0 | 20.4 ± 1.2 | 24.2 ± 0.9 |
| Total sugar (%E) | 3.1 ± 0.2 | 2.9 ± 0.2 | 4.2 ± 0.3 | 5.5 ± 0.4 | 6.8 ± 0.3 | 8.7 ± 0.3 | |
| Added sugar intake (g/d) | 1.4 ± 0.2 | 1.2 ± 0.3 | 1.3 ± 0.2 | 2.9 ± 0.5 | 5.9 ± 0.8 | 6.5 ± 0.5 | |
| Added sugar (%E) | 0.4 ± 0.1 | 0.4 ± 0.1 | 0.4 ± 0.1 | 1.0 ± 0.2 | 1.8 ± 0.2 | 2.2 ± 0.2 | |
| Overweight | Total sugar intake (g/d) | 9.5 ± 1.8 | 8.1 ± 1.8 | 13.3 ± 2.2 | 14.0 ± 3.5 | 26.0 ± 3.9 | 24.8 ± 2.3 |
| Total sugar (%E) | 3.0 ± 0.6 | 3.1 ± 0.8 | 4.8 ± 0.9 | 4.5 ± 1.0 | 8.5 ± 1.1 | 9.0 ± 0.8 | |
| Added sugar intake (g/d) | 1.2 ± 0.8 | 0.6 ± 0.6 | 0.6 ± 0.4 | 1.4 ± 0.9 | 5.8 ± 1.9 | 7.7 ± 1.4 | |
| Added sugar (%E) | 0.4 ± 0.2 | 0.2 ± 0.2 | 0.3 ± 0.2 | 0.5 ± 0.3 | 2.3 ± 0.9 | 2.6 ± 0.5 | |
| Obesity | Total sugar intake (g/d) | 7.7 ± 2.0 | 12.0 ± 3.1 | 10.9 ± 1.6 | 15.3 ± 2.7 | 14.0 ± 2.1 | 32.7 ± 4.6 |
| Total sugar (%E) | 2.1 ± 0.6 | 3.9 ± 1.1 | 4.1 ± 0.6 | 5.8 ± 1.1 | 4.6 ± 0.6 | 9.0 ± 0.9 | |
| Added sugar intake (g/d) | 0.3 ± 0.3 | 1.5 ± 1.0 | 0.5 ± 0.3 | 0.9 ± 0.5 | 4.0 ± 1.3 | 9.5 ± 1.5 | |
| Added sugar (%E) | 0.1 ± 0.1 | 0.3 ± 0.2 | 0.2 ± 0.1 | 0.3 ± 0.2 | 1.4 ± 0.5 | 2.7 ± 0.4 | |
| 7–12 years | |||||||
| n = 1567 | n = 1347 | n = 779 | n = 710 | n = 666 | n = 888 | ||
| Gender | |||||||
| Boys | Total sugar intake (g/d) | 11.4 ± 0.6 | 11.7 ± 0.4 | 14.7 ± 0.8 | 18.4 ± 1.0 | 23.7 ± 1.2 | 30.6 ± 1.2 |
| Total sugar (%E) | 2.6 ± 0.1 | 2.7 ± 0.1 | 3.4 ± 0.2 | 4.5 ± 0.2 | 5.4 ± 0.2 | 7.7 ± 0.3 | |
| Added sugar intake (g/d) | 0.9 ± 0.1 | 0.8 ± 0.1 | 0.9 ± 0.2 | 2.0 ± 0.4 | 5.5 ± 0.6 | 8.2 ± 0.9 | |
| Added sugar (%E) | 0.2 ± 0.0 | 0.2 ± 0.0 | 0.2 ± 0.0 | 0.5 ± 0.1 | 1.2 ± 0.1 | 1.9 ± 0.2 | |
| Girls | Total sugar intake (g/d) | 11.5 ± 0.7 | 11.8 ± 0.5 | 15.6 ± 0.8 | 16.8 ± 0.9 | 21.1 ± 1.3 | 25.5 ± 1.1 |
| Total sugar (%E) | 2.8 ± 0.2 | 2.8 ± 0.1 | 3.9 ± 0.2 | 4.4 ± 0.2 | 5.4 ± 0.3 | 7.4 ± 0.3 | |
| Added sugar intake (g/d) | 1.0 ± 0.2 | 1.1 ± 0.2 | 1.4 ± 0.3 | 1.7 ± 0.3 | 5.0 ± 0.8 | 6.0 ± 0.5 | |
| Added sugar (%E) | 0.2 ± 0.0 | 0.2 ± 0.1 | 0.3 ± 0.1 | 0.4 ± 0.1 | 1.2 ± 0.2 | 1.7 ± 0.1 | |
| Area | |||||||
| Urban | Total sugar intake (g/d) | 17.8 ± 1.5 | 15.0 ± 0.9 | 19.3 ± 1.3 | 23.8 ± 1.7 | 31.4 ± 2.0 | 34.3 ± 1.6 |
| Total sugar (%E) | 3.9 ± 0.3 | 3.4 ± 0.2 | 4.4 ± 0.3 | 5.7 ± 0.4 | 7.4 ± 0.4 | 9.2 ± 0.3 | |
| Added sugar intake (g/d) | 1.9 ± 0.3 | 1.5 ± 0.3 | 2.4 ± 0.4 | 3.5 ± 0.7 | 9.1 ± 1.4 | 9.5 ± 1.2 | |
| Added sugar (%E) | 0.4 ± 0.1 | 0.4 ± 0.1 | 0.5 ± 0.1 | 0.8 ± 0.1 | 2.0 ± 0.3 | 2.3 ± 0.2 | |
| Rural | Total sugar intake (g/d) | 8.9 ± 0.2 | 10.6 ± 0.3 | 13.8 ± 0.6 | 15.4 ± 0.7 | 19.7 ± 0.9 | 24.8 ± 0.9 |
| Total sugar (%E) | 2.2 ± 0.1 | 2.5 ± 0.1 | 3.4 ± 0.1 | 4.0 ± 0.2 | 4.8 ± 0.2 | 6.6 ± 0.2 | |
| Added sugar intake (g/d) | 0.6 ± 0.1 | 0.8 ± 0.2 | 0.7 ± 0.2 | 1.3 ± 0.2 | 4.1 ± 0.5 | 5.8 ± 0.5 | |
| Added sugar (%E) | 0.1 ± 0.0 | 0.2 ± 0.0 | 0.2 ± 0.0 | 0.3 ± 0.1 | 0.9 ± 0.1 | 1.5 ± 0.1 | |
| BMI categories | |||||||
| Non-overweight/obesity | Total sugar intake (g/d) | 11.4 ± 0.5 | 11.6 ± 0.4 | 14.4 ± 0.6 | 16.8 ± 0.7 | 22.3 ± 1.0 | 27.1 ± 0.9 |
| Total sugar (%E) | 2.6 ± 0.1 | 2.7 ± 0.1 | 3.5 ± 0.1 | 4.3 ± 0.2 | 5.4 ± 0.2 | 7.5 ± 0.2 | |
| Added sugar intake (g/d) | 0.9 ± 0.1 | 1.0 ± 0.2 | 1.0 ± 0.2 | 1.8 ± 0.3 | 5.4 ± 0.6 | 6.4 ± 0.5 | |
| Added sugar (%E) | 0.2 ± 0.0 | 0.2 ± 0.0 | 0.2 ± 0.0 | 0.4 ± 0.1 | 1.2 ± 0.1 | 1.7 ± 0.1 | |
| Overweight | Total sugar intake (g/d) | 15.8 ± 2.8 | 14.0 ± 1.2 | 17.4 ± 2.3 | 24.6 ± 3.0 | 30.2 ± 2.8 | 29.6 ± 2.0 |
| Total sugar (%E) | 3.4 ± 0.5 | 3.0 ± 0.2 | 4.1 ± 0.5 | 5.6 ± 0.6 | 6.9 ± 0.6 | 7.5 ± 0.4 | |
| Added sugar intake (g/d) | 1.7 ± 0.6 | 1.8 ± 0.6 | 2.3 ± 0.9 | 3.6 ± 1.2 | 6.8 ± 1.6 | 8.4 ± 1.2 | |
| Added sugar (%E) | 0.4 ± 0.1 | 0.3 ± 0.1 | 0.5 ± 0.2 | 0.8 ± 0.2 | 1.5 ± 0.3 | 2.0 ± 0.3 | |
| Obesity | Total sugar intake (g/d) | 9.7 ± 1.4 | 12.1 ± 3.2 | 21.0 ± 5.6 | 19.4 ± 3.3 | 20.6 ± 3.9 | 37.6 ± 5.4 |
| Total sugar (%E) | 3.0 ± 0.6 | 2.6 ± 0.5 | 4.6 ± 0.9 | 5.6 ± 0.9 | 5.8 ± 1.3 | 8.8 ± 0.9 | |
| Added sugar intake (g/d) | 0.3 ± 0.2 | 0.2 ± 0.1 | 2.0 ± 1.0 | 1.2 ± 0.5 | 3.2 ± 1.3 | 13.6 ± 4.9 | |
| Added sugar (%E) | 0.0 ± 0.0 | 0.0 ± 0.0 | 0.3 ± 0.2 | 0.4 ± 0.2 | 1.0 ± 0.4 | 2.8 ± 0.8 | |
| 13–17 years | |||||||
| n = 986 | n = 1109 | n = 768 | n = 537 | n = 433 | n = 553 | ||
| Gender | |||||||
| Boys | Total sugar intake (g/d) | 11.4 ± 0.5 | 14.0 ± 0.5 | 20.2 ± 1.1 | 22.4 ± 1.3 | 24.2 ± 1.4 | 32.4 ± 1.5 |
| Total sugar (%E) | 2.0 ± 0.1 | 2.6 ± 0.1 | 3.6 ± 0.2 | 4.0 ± 0.2 | 4.6 ± 0.3 | 6.5 ± 0.3 | |
| Added sugar intake (g/d) | 0.9 ± 0.2 | 1.0 ± 0.2 | 1.7 ± 0.3 | 2.6 ± 0.5 | 4.0 ± 0.6 | 8.1 ± 0.8 | |
| Added sugar (%E) | 0.1 ± 0.0 | 0.2 ± 0.0 | 0.3 ± 0.0 | 0.5 ± 0.1 | 0.8 ± 0.1 | 1.5 ± 0.1 | |
| Girls | Total sugar intake (g/d) | 12.2 ± 0.7 | 12.7 ± 0.6 | 16.8 ± 0.8 | 20.8 ± 1.1 | 22.8 ± 1.5 | 30.5 ± 1.5 |
| Total sugar (%E) | 2.6 ± 0.2 | 2.8 ± 0.1 | 3.7 ± 0.2 | 4.7 ± 0.3 | 5.4 ± 0.4 | 7.9 ± 0.3 | |
| Added sugar intake (g/d) | 1.1 ± 0.3 | 1.0 ± 0.2 | 1.4 ± 0.3 | 1.6 ± 0.4 | 4.4 ± 1.0 | 7.1 ± 0.8 | |
| Added sugar (%E) | 0.2 ± 0.1 | 0.2 ± 0.1 | 0.3 ± 0.1 | 0.3 ± 0.1 | 1.0 ± 0.2 | 1.7 ± 0.2 | |
| Area | |||||||
| Urban | Total sugar intake (g/d) | 15.8 ± 1.1 | 14.6 ± 0.8 | 22.4 ± 1.6 | 26.6 ± 1.9 | 29.6 ± 2.1 | 35.5 ± 1.7 |
| Total sugar (%E) | 3.1 ± 0.3 | 2.9 ± 0.2 | 4.2 ± 0.2 | 5.2 ± 0.3 | 6.3 ± 0.5 | 8.5 ± 0.4 | |
| Added sugar intake (g/d) | 2.1 ± 0.5 | 1.5 ± 0.3 | 2.5 ± 0.4 | 4.1 ± 0.8 | 7.0 ± 1.4 | 9.7 ± 0.9 | |
| Added sugar (%E) | 0.4 ± 0.1 | 0.3 ± 0.1 | 0.5 ± 0.1 | 0.7 ± 0.1 | 1.4 ± 0.3 | 2.2 ± 0.2 | |
| Rural | Total sugar intake (g/d) | 10.0 ± 0.4 | 13.1 ± 0.5 | 16.9 ± 0.7 | 19.1 ± 0.9 | 20.9 ± 1.1 | 28.4 ± 1.4 |
| Total sugar (%E) | 1.9 ± 0.1 | 2.6 ± 0.1 | 3.4 ± 0.1 | 3.9 ± 0.2 | 4.4 ± 0.2 | 6.2 ± 0.3 | |
| Added sugar intake (g/d) | 0.5 ± 0.1 | 0.8 ± 0.1 | 1.1 ± 0.2 | 1.1 ± 0.2 | 2.9 ± 0.4 | 6.0 ± 0.8 | |
| Added sugar (%E) | 0.1 ± 0.0 | 0.2 ± 0.0 | 0.2 ± 0.0 | 0.2 ± 0.0 | 0.6 ± 0.1 | 1.2 ± 0.1 | |
| BMI categories | |||||||
| Non-overweight/obesity | Total sugar intake (g/d) | 11.9 ± 0.5 | 13.2 ± 0.4 | 18.3 ± 0.8 | 21.5 ± 1.0 | 23.0 ± 1.1 | 31.6 ± 1.2 |
| Total sugar (%E) | 2.3 ± 0.1 | 2.7 ± 0.1 | 3.6 ± 0.1 | 4.3 ± 0.2 | 4.9 ± 0.2 | 7.3 ± 0.2 | |
| Added sugar intake (g/d) | 1.1 ± 0.2 | 1.0 ± 0.1 | 1.7 ± 0.2 | 2.4 ± 0.4 | 4.0 ± 0.6 | 7.6 ± 0.7 | |
| Added sugar (%E) | 0.2 ± 0.0 | 0.2 ± 0.0 | 0.3 ± 0.0 | 0.4 ± 0.1 | 0.9 ± 0.1 | 1.6 ± 0.1 | |
| Overweight | Total sugar intake (g/d) | 16.4 ± 2.5 | 19.4 ± 2.9 | 17.4 ± 2.3 | 25.3 ± 4.5 | 23.7 ± 3.3 | 32.4 ± 3.6 |
| Total sugar (%E) | 3.1 ± 0.5 | 3.4 ± 0.4 | 3.4 ± 0.5 | 4.8 ± 0.8 | 4.7 ± 0.6 | 6.5 ± 0.6 | |
| Added sugar intake (g/d) | 0.9 ± 0.4 | 1.9 ± 1.1 | 1.4 ± 0.8 | 1.2 ± 0.5 | 4.5 ± 1.7 | 7.5 ± 1.5 | |
| Added sugar (%E) | 0.1 ± 0.1 | 0.3 ± 0.1 | 0.3 ± 0.2 | 0.2 ± 0.1 | 1.0 ± 0.4 | 1.4 ± 0.2 | |
| Obesity | Total sugar intake (g/d) | 13.5 ± 1.8 | 11.0 ± 6.4 | 17.1 ± 4.0 | 6.3 ± 0.8 | 35.3 ± 7.5 | 37.9 ± 7.4 |
| Total sugar (%E) | 3.2 ± 1.6 | 1.7 ± 0.8 | 3.1 ± 1.1 | 1.4 ± 0.1 | 6.7 ± 0.9 | 8.0 ± 1.3 | |
| Added sugar intake (g/d) | 0.8 ± 0.5 | 0.4 ± 0.3 | 0.0 ± 0.0 | 0.4 ± 0.4 | 7.4 ± 7.0 | 7.4 ± 2.6 | |
| Added sugar (%E) | 0.1 ± 0.1 | 0.1 ± 0.1 | 0.0 ± 0.0 | 0.1 ± 0.1 | 0.9 ± 0.8 | 1.4 ± 0.5 | |
| Dietary Sources of Total Sugar | |||||
| 1997 | 2011 | ||||
| Rank | Food/Beverage Groups | % of Total Intake | Rank | Food/Beverage Groups | % of Total Intake |
| 1 | Vegetables and vegetable products | 34.3 | 1 | Fresh fruits | 22.9 |
| 2 | Cereals and cereals products | 32.1 | 2 | Cakes/pies/sweet rolls or other pastry | 20.3 |
| 3 | Dried legumes and legume products | 23.7 | 3 | Vegetables and vegetable products | 15.2 |
| 4 | Tubers/starches products | 6.8 | 4 | Liquid milk | 12.0 |
| 5 | Sugars/Candies | 1.6 | 5 | Cereals and cereals products | 5.0 |
| 6 | Others 2 | 1.3 | 6 | Dried legumes and legume products | 4.0 |
| 7 | Ice-creams | 2.4 | |||
| 8 | Carbonated drinks | 2.3 | |||
| 9 | Biscuits | 2.2 | |||
| 10 | Quick bread and bread products | 2.1 | |||
| 11 | Sugars/Candies | 1.8 | |||
| 12 | Yogurt | 1.6 | |||
| 13 | Infant foods | 1.4 | |||
| 14 | Fruit Juices and drinks | 1.3 | |||
| 15 | Tubers/starches products | 1.1 | |||
| 16 | Nuts and seeds | 1.1 | |||
| 17 | Others 2 | 3.4 | |||
| Dietary Sources of Added Sugar | |||||
| 1997 | 2011 | ||||
| Rank | Food/beverage groups | % of total intake | Rank | Food/beverage groups | % of total intake |
| 1 | Dried legumes and legume products | 68.1 | 1 | Cakes/pies/sweet rolls or other pastry | 56.8 |
| 2 | Vegetables and vegetable products | 13.9 | 2 | Carbonated drinks | 7.7 |
| 3 | Sugars/Candies | 11.2 | 3 | Ice-creams | 6.8 |
| 4 | Biscuits | 4.9 | 4 | Biscuits | 6.4 |
| 5 | Quick bread and bread products | 1.9 | 5 | Sugars/Candies | 6.1 |
| 6 | Quick bread and bread products | 4.6 | |||
| 7 | Infant foods | 4.4 | |||
| 8 | Fruit Juices and drinks | 3.4 | |||
| 9 | Dried legumes and legume products | 1.8 | |||
| 10 | Vegetable protein drinks | 1.1 | |||
| 11 | Others 2 | 0.9 | |||
Publisher’s Note: MDPI stays neutral with regard to jurisdictional claims in published maps and institutional affiliations. |
© 2022 by the authors. Licensee MDPI, Basel, Switzerland. This article is an open access article distributed under the terms and conditions of the Creative Commons Attribution (CC BY) license (https://creativecommons.org/licenses/by/4.0/).
Share and Cite
Liu, Y.; Cheng, J.; Wan, L.; Chen, W. Total and Added Sugar Intakes Are Increasing among Children and Adolescents in China: Findings from CHNS 1997–2011. Nutrients 2022, 14, 3340. https://doi.org/10.3390/nu14163340
Liu Y, Cheng J, Wan L, Chen W. Total and Added Sugar Intakes Are Increasing among Children and Adolescents in China: Findings from CHNS 1997–2011. Nutrients. 2022; 14(16):3340. https://doi.org/10.3390/nu14163340
Chicago/Turabian StyleLiu, Yan, Jing Cheng, Lijin Wan, and Wei Chen. 2022. "Total and Added Sugar Intakes Are Increasing among Children and Adolescents in China: Findings from CHNS 1997–2011" Nutrients 14, no. 16: 3340. https://doi.org/10.3390/nu14163340
APA StyleLiu, Y., Cheng, J., Wan, L., & Chen, W. (2022). Total and Added Sugar Intakes Are Increasing among Children and Adolescents in China: Findings from CHNS 1997–2011. Nutrients, 14(16), 3340. https://doi.org/10.3390/nu14163340