Article

Epidemiological Studies of Children’s Gut Microbiota: Validation of Sample Collection and Storage Methods and Microbiota Analysis of Toddlers’ Feces Collected from Diapers

1
Department of Occupational and Environmental Health, Graduate School of Medical Sciences, Nagoya City University, Mizuho-ku, Nagoya 4678601, Aichi, Japan
2
Department of Obstetrics and Gynecology, Graduate School of Medical Sciences, Nagoya City University, Mizuho-ku, Nagoya 4678601, Aichi, Japan
3
Department of Pediatrics and Neonatology, Graduate School of Medical Sciences, Nagoya City University, Mizuho-ku, Nagoya 4678601, Aichi, Japan
*
Author to whom correspondence should be addressed.
Nutrients 2022, 14(16), 3315; https://doi.org/10.3390/nu14163315
Submission received: 2 June 2022 / Revised: 3 August 2022 / Accepted: 8 August 2022 / Published: 12 August 2022
(This article belongs to the Section Nutrition Methodology & Assessment)

Abstract

:
The composition of human gut microbiota influences human health and disease over the long term. Since the flora in specimens can easily change at ambient temperature outside the body, epidemiological studies need feasible methods of stool specimen collection and storage to be established. We aimed to validate two methods: feces frozen-stored in tubes containing guanidine thiocyanate solution for two months after collection (Method B), and feces excreted in diapers and frozen-stored (Method C). Validation was by comparison with a gold standard Method A. Bacterial flora of five adults were sampled and stored by all three methods. Bacterial composition was examined by amplicon sequencing analysis. Bland–Altman analyses showed that Methods B and C might change relative abundances of certain bacterial flora. Thereafter, we analyzed the bacterial flora of 76 toddlers (two age groups) in stools sampled and processed by Method C. The diversity indices of toddlers’ flora were less than those of adults. The relative abundance of some bacteria differed significantly between children aged 1.5 and 3 years. The specimen collection and storage methods validated in this study are worth adopting in large-scale epidemiological studies, especially for small children, provided the limited accuracy for some specific bacteria is understood.

Graphical Abstract

1. Introduction

Microorganisms in the human intestinal tract number 1014 to 1015 cells, and have a symbiotic relationship with the host [1]. While the gut microbiota has beneficial functions for the host, such as digestion of polysaccharides, protection from pathogens, and support for the development of the immune system [2,3], dysbiosis has reportedly been associated with inflammatory bowel disease, irritable bowel syndrome, obesity, allergies, and psychiatric disorders [4]. In addition, evidence is accumulating that bacterial colonization affects host development and physiology, and health and disease over the long term [5,6]. Intestinal bacteria make up a complex “ecosystem” through in-depth interspecies interactions [7,8,9,10], and there are many reports at the genus and species levels of the physiological roles of microorganisms and their metabolites in humans. To clarify the relationship between human health and gut microbiota, it is necessary to clarify the composition of the gut microbiota in children that may affect their later health through epidemiological studies.
The storage conditions of specimens affect the results of bacterial flora analysis [11]. In general, the bacterial composition of feces changes after 15 min of storage at room temperature, which can be an obstacle to epidemiological studies; hence, it is desirable to immediately freeze fecal samples [12]. In previous studies of the gut microbiome of children, fecal samples were transported with cooling [13], in an anaerobic environment [14], using RNAlater [15,16], or fecal occult blood cards [17]. It is a heavy burden to both parents and researchers to collect samples from small children who cannot excrete autonomously. Our group previously established a method for extracting and analyzing urine samples collected from diapers [18]. If the use of diapers is also valid for sampling stools, it will be a very useful technique for investigating gut microbiota in epidemiological studies. A stool collection container that can be stored at room temperature was developed recently [19], although long-term storage of collected samples may be required in large-scale epidemiological studies from the viewpoint of cost and manpower. The present study aimed to achieve the following two goals: first, to validate methods that differ from the gold standard in terms of collection, storage temperature, and period; and secondly, to characterize the gut microbiota of toddler stool samples collected from diapers.

2. Materials and Methods

2.1. Study Design

This study comprised two parts, a method validation study (Research I), and a gut microbiota profiling study in toddlers (Research II). Research II was conducted as an Adjunct Study [20] of the Japan Environment and Children’s Study (JECS), a prospective observational birth cohort study that was outlined in the JECS protocol paper [21]. The ethics committee of the Nagoya City University Graduate School of Medical Sciences approved this study protocol (approval numbers 60-00-1116 and 70-19-0001).

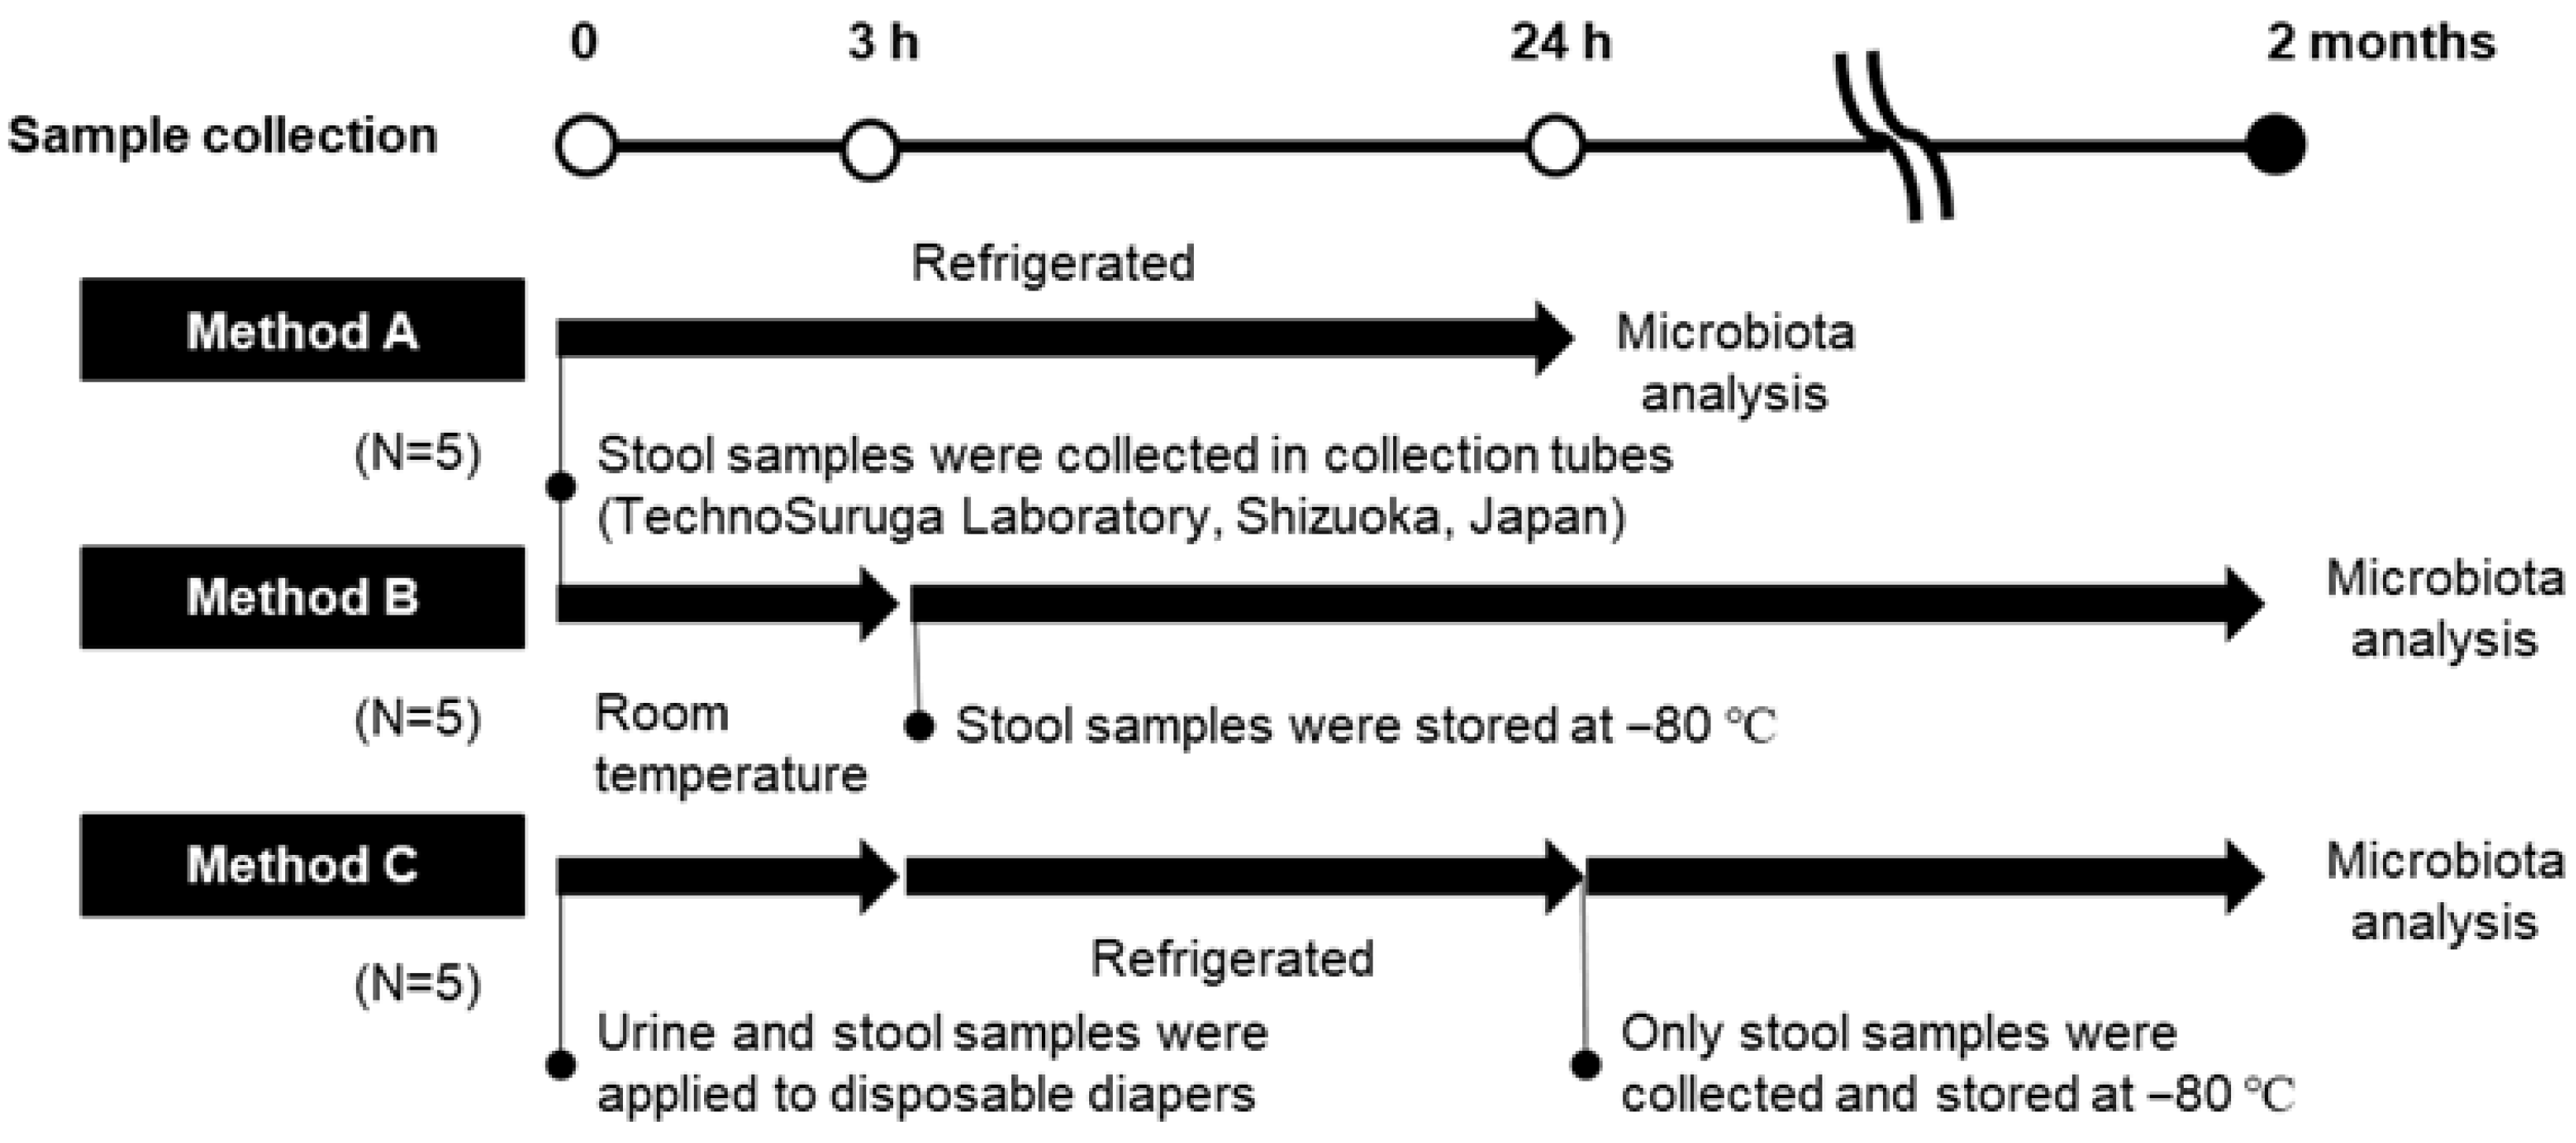
2.1.1. Research I: Gut Microbiota Analysis of Fecal Specimens Collected and Stored by Different Methods

Fecal samples were collected from five adult volunteers (#1–#5) by either the gold standard method (Method A) or two other methods that we consider to be more relevant to epidemiological studies (Methods B or C) and compared (Figure 1). In Method A, fecal samples were collected in collection tubes containing guanidine thiocyanate solution (TechnoSuruga Laboratory Co., Ltd., Shizuoka, Japan), kept under refrigeration, and shipped the next day to a contract laboratory (TechnoSuruga Laboratory) under refrigeration [19]. In Method B, fecal samples were collected in collection tubes in the same way as Method A, kept at room temperature for 3 h, stored at −80 °C for about two months until shipment, and then frozen-shipped. In Method C, urine and stool samples were applied to disposable diapers, kept at room temperature for 3 h, and subsequently stored under refrigeration for 24 h. After that, only feces were stored at −80 °C for about two months until shipment, and then frozen-shipped. Method C is a simulation from sampling to shipment, a plausible scenario in epidemiological studies targeting children with diapers.

2.1.2. Research II: Analysis of Toddlers’ Feces Excreted in Diapers

Children participating in the Aichi regional subcohort of JECS, JECS-A [20], which comprised 43% of the children in that age group who were born in the study area, were recruited at the time of their 18-month checkup provided by the local government. Their guardians as legally acceptable representatives were asked to participate in the study, and their informed consent for the present study was obtained. The overall participation rate among recruited participants was 83.0%. The participants of the present study wore designated disposable diapers, which had been distributed in advance, during the night, and these were collected as refrigerated cargoes the next day after their use. When stools excreted in diapers were found, they were stored at −80 °C and frozen-shipped for analysis. Used diapers were collected from 2721 children between 22 June 2015 and 31 July 2016 (children were approximately 1.5 years old), and between 11 May 2016, and 20 December 2017 (children were approximately 3 years old). Of these, 76 fecal samples (from 26 boys and 29 girls at 16–21 months and from 15 boys and 6 girls at 35–39 months) were available, and all of them were included in this analysis. In addition, we obtained information from the questionnaire asked in the main study of the JECS on the mode of delivery, the feeding method during the first month after birth, and the starting date of feeding solid foods. The characteristics of the study participants are presented in Table 1.

2.2. Gut Microbiota Analysis

The DNA extraction and polymerase chain reaction were conducted according to a previously described method [22,23,24,25,26]. Identification of sequence reads was performed manually using the Ribosomal Database Project (RDP) Classifier tool ver 2.11, which is available from the RDP website (http://rdp.cme.msu.edu/classifier/, accessed on 1 March 2021) [27]. Bacterial species were identified from sequences using the Metagenome@KIN Version 2.2.1 analysis software (World Fusion Co., Ltd., Tokyo, Japan). The joined amplicon sequence reads were processed through QIIME2 (Quantitative Insights Into Microbial Ecology version 2) ver 2020.6 [28]. The quality filtering and chimeric sequences were deleted using DADA2 (Divisive Amplicon Denoising Algorithm 2) denoise-single plugin Version 2017.6.0 using the default settings [29]. Taxonomy was assigned using Greengenes database Version 13.8 by training a naive Bayes classifier [30]. In addition, the diversity indices (Chao1, Shannon, Simpson, observed operational taxonomic units (OTUs), and Faith’s phylogenetic diversity (PD)) were calculated.
These analyses of fecal microbiota were outsourced to TechnoSuruga Laboratory Co., Ltd., Shizuoka, Japan.

2.3. Statistical Analysis

In Research I, Bland–Altman analyses were performed in each of the three relative abundance (%) ranges (“≥10”, “≥1 and <10”, and “<1”) at phylum and class levels and in four abundance ranges (“≥10”, “≥1 and <10”, “≥0.1 and <1”, and “<0.1”) at the order, family, genus, and species levels. Limits of agreement (LOAs, mean ± 1.96 × standard deviation (SD) of differences between two measurements) and 95% confidence intervals (CIs) of their upper/lower limits were calculated and plotted. In addition, the Firmicutes/Bacteroidetes (F/B) ratio was calculated.
Comparisons were made between Method A, the gold standard [19], and Method B or C. Dunnett’s test was performed to compare the diversity indices of Methods B and C with those of Method A as a control. Kruskal–Wallis and Mann–Whitney U tests were performed, and effect sizes were calculated to compare the F/B ratios. In these tests, p values were corrected by the Bonferroni method. Heatmap and cluster analyses (Ward’s method) were performed for log-converted relative abundance (%).
In Research II, Dunnett’s test was applied to compare the diversity indices between the adults and both children (1.5 years and 3 years) groups. Mann–Whitney U test was performed to compare the relative abundance between the two age groups of the children (1.5 years and 3 years). All analyses were performed using R version 3.6.2.
In the present study, a p value of <0.05 was considered statistically significant.

3. Results

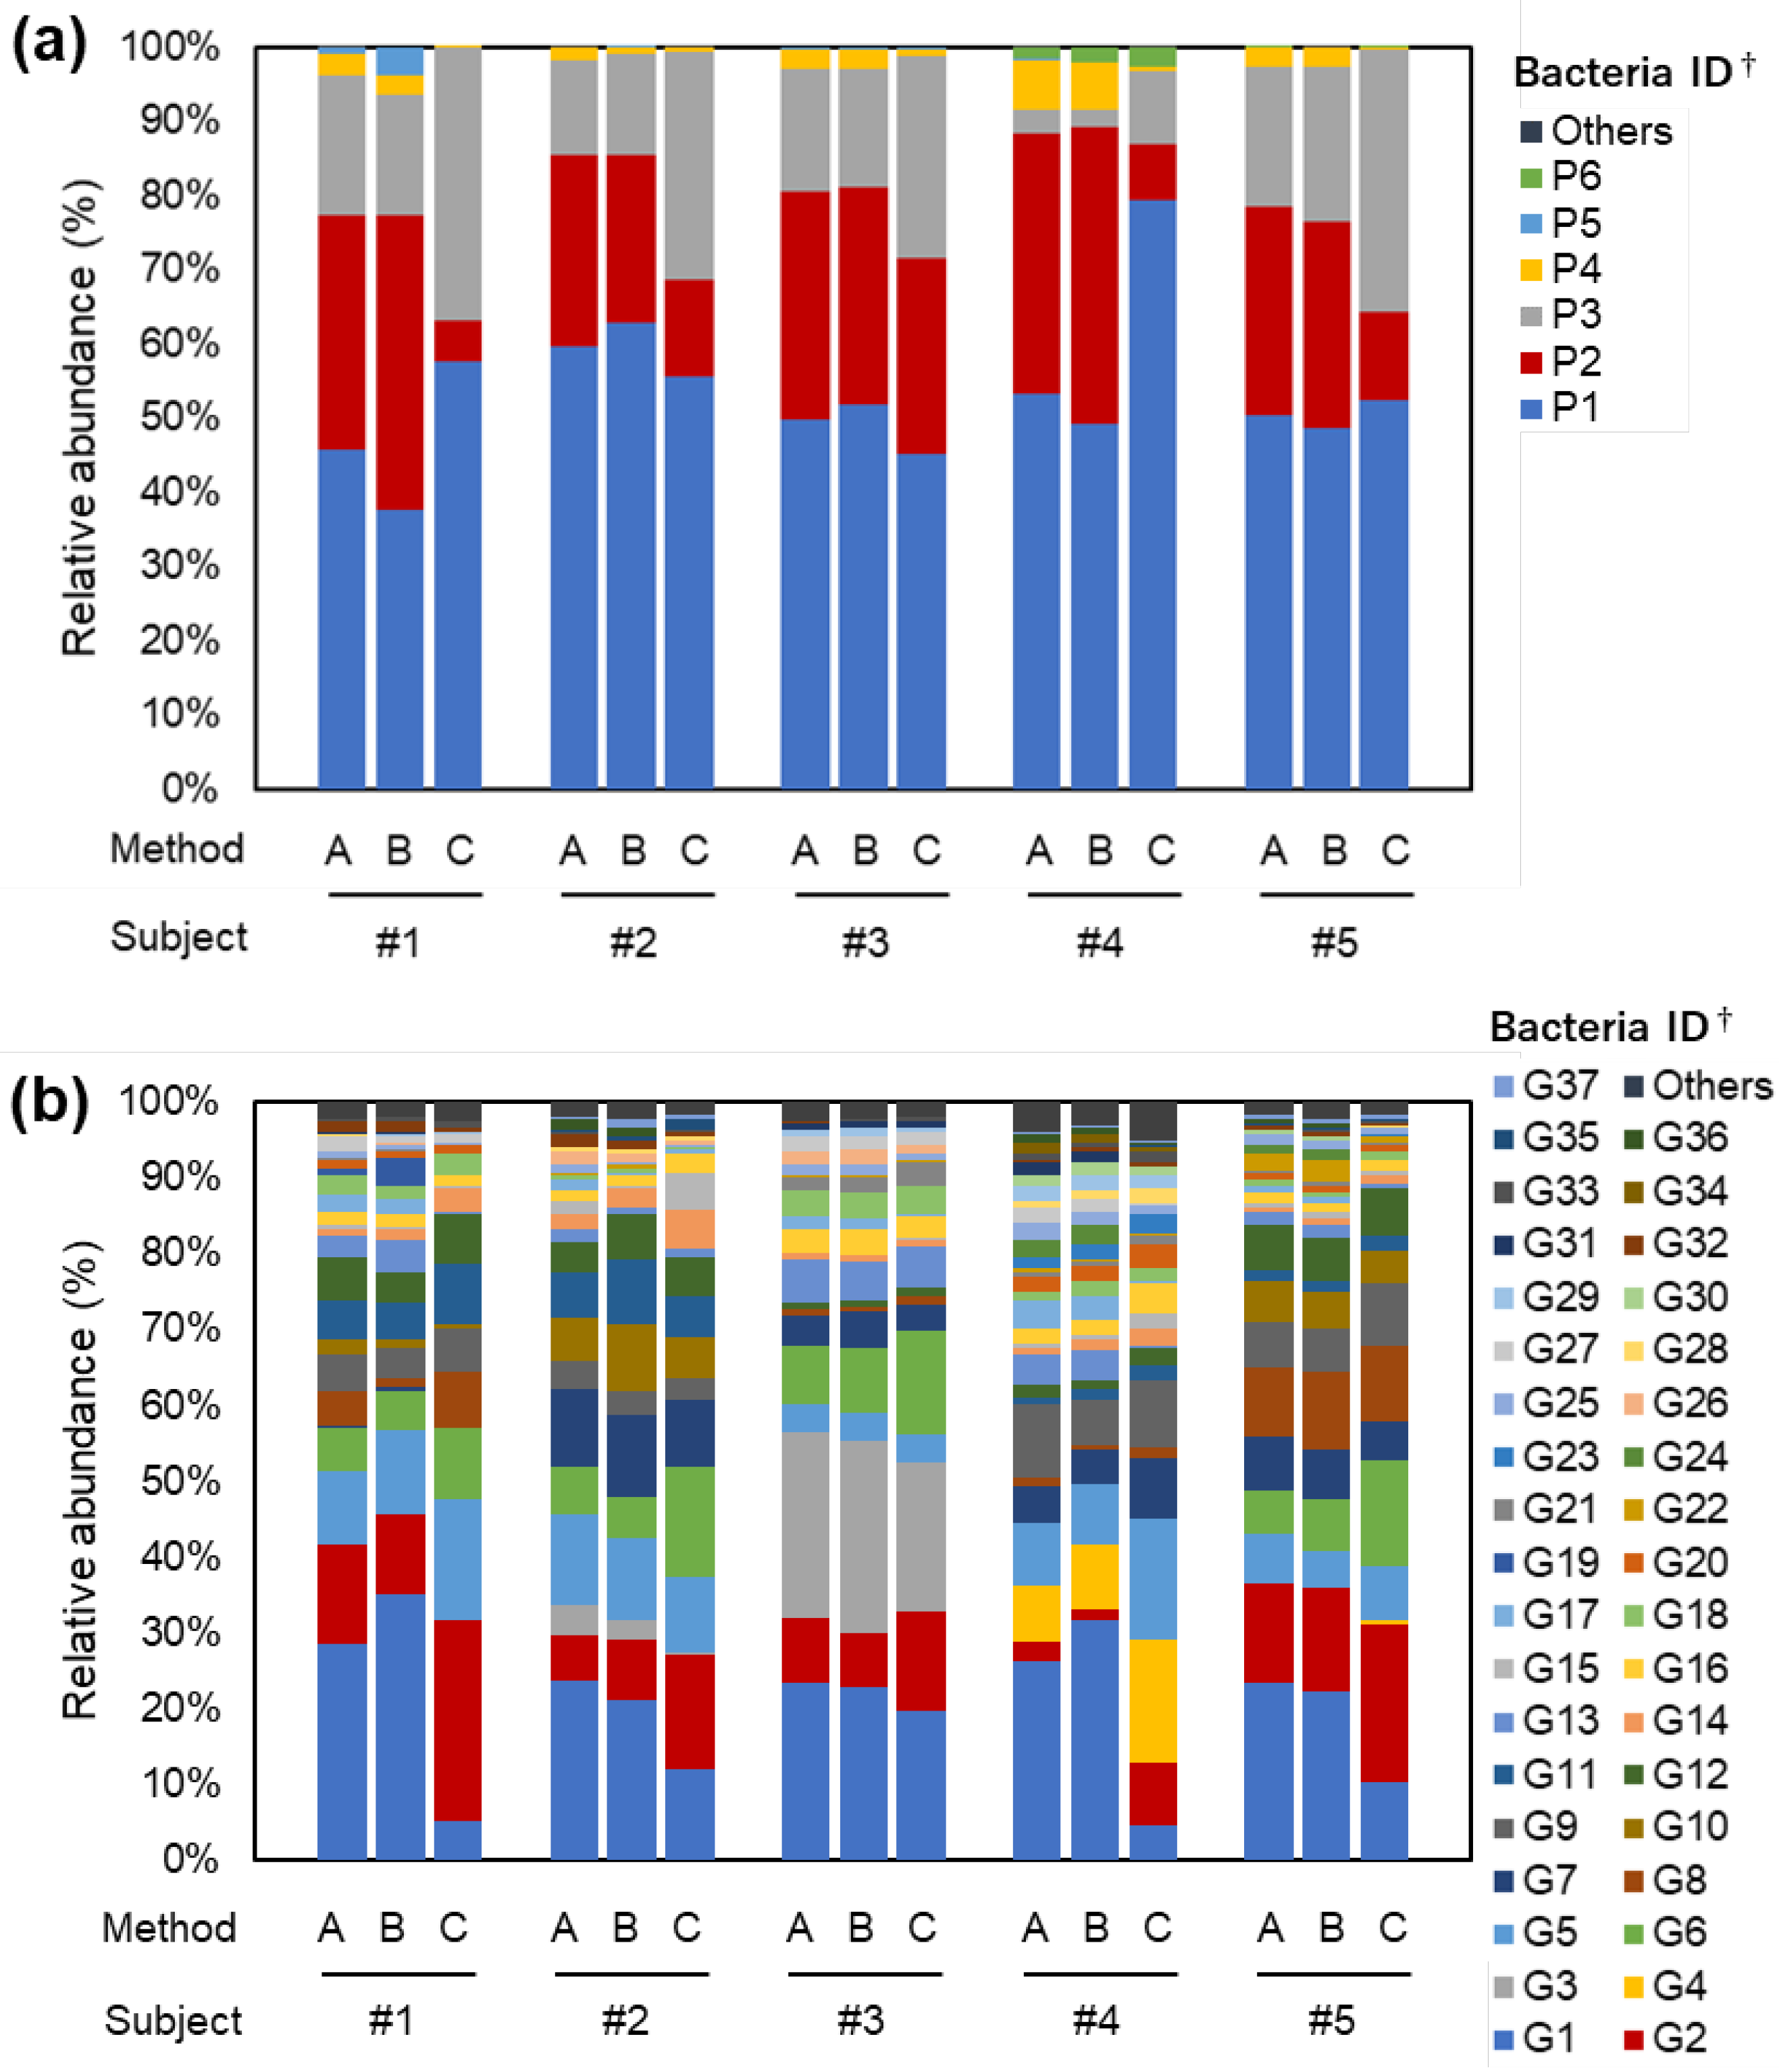
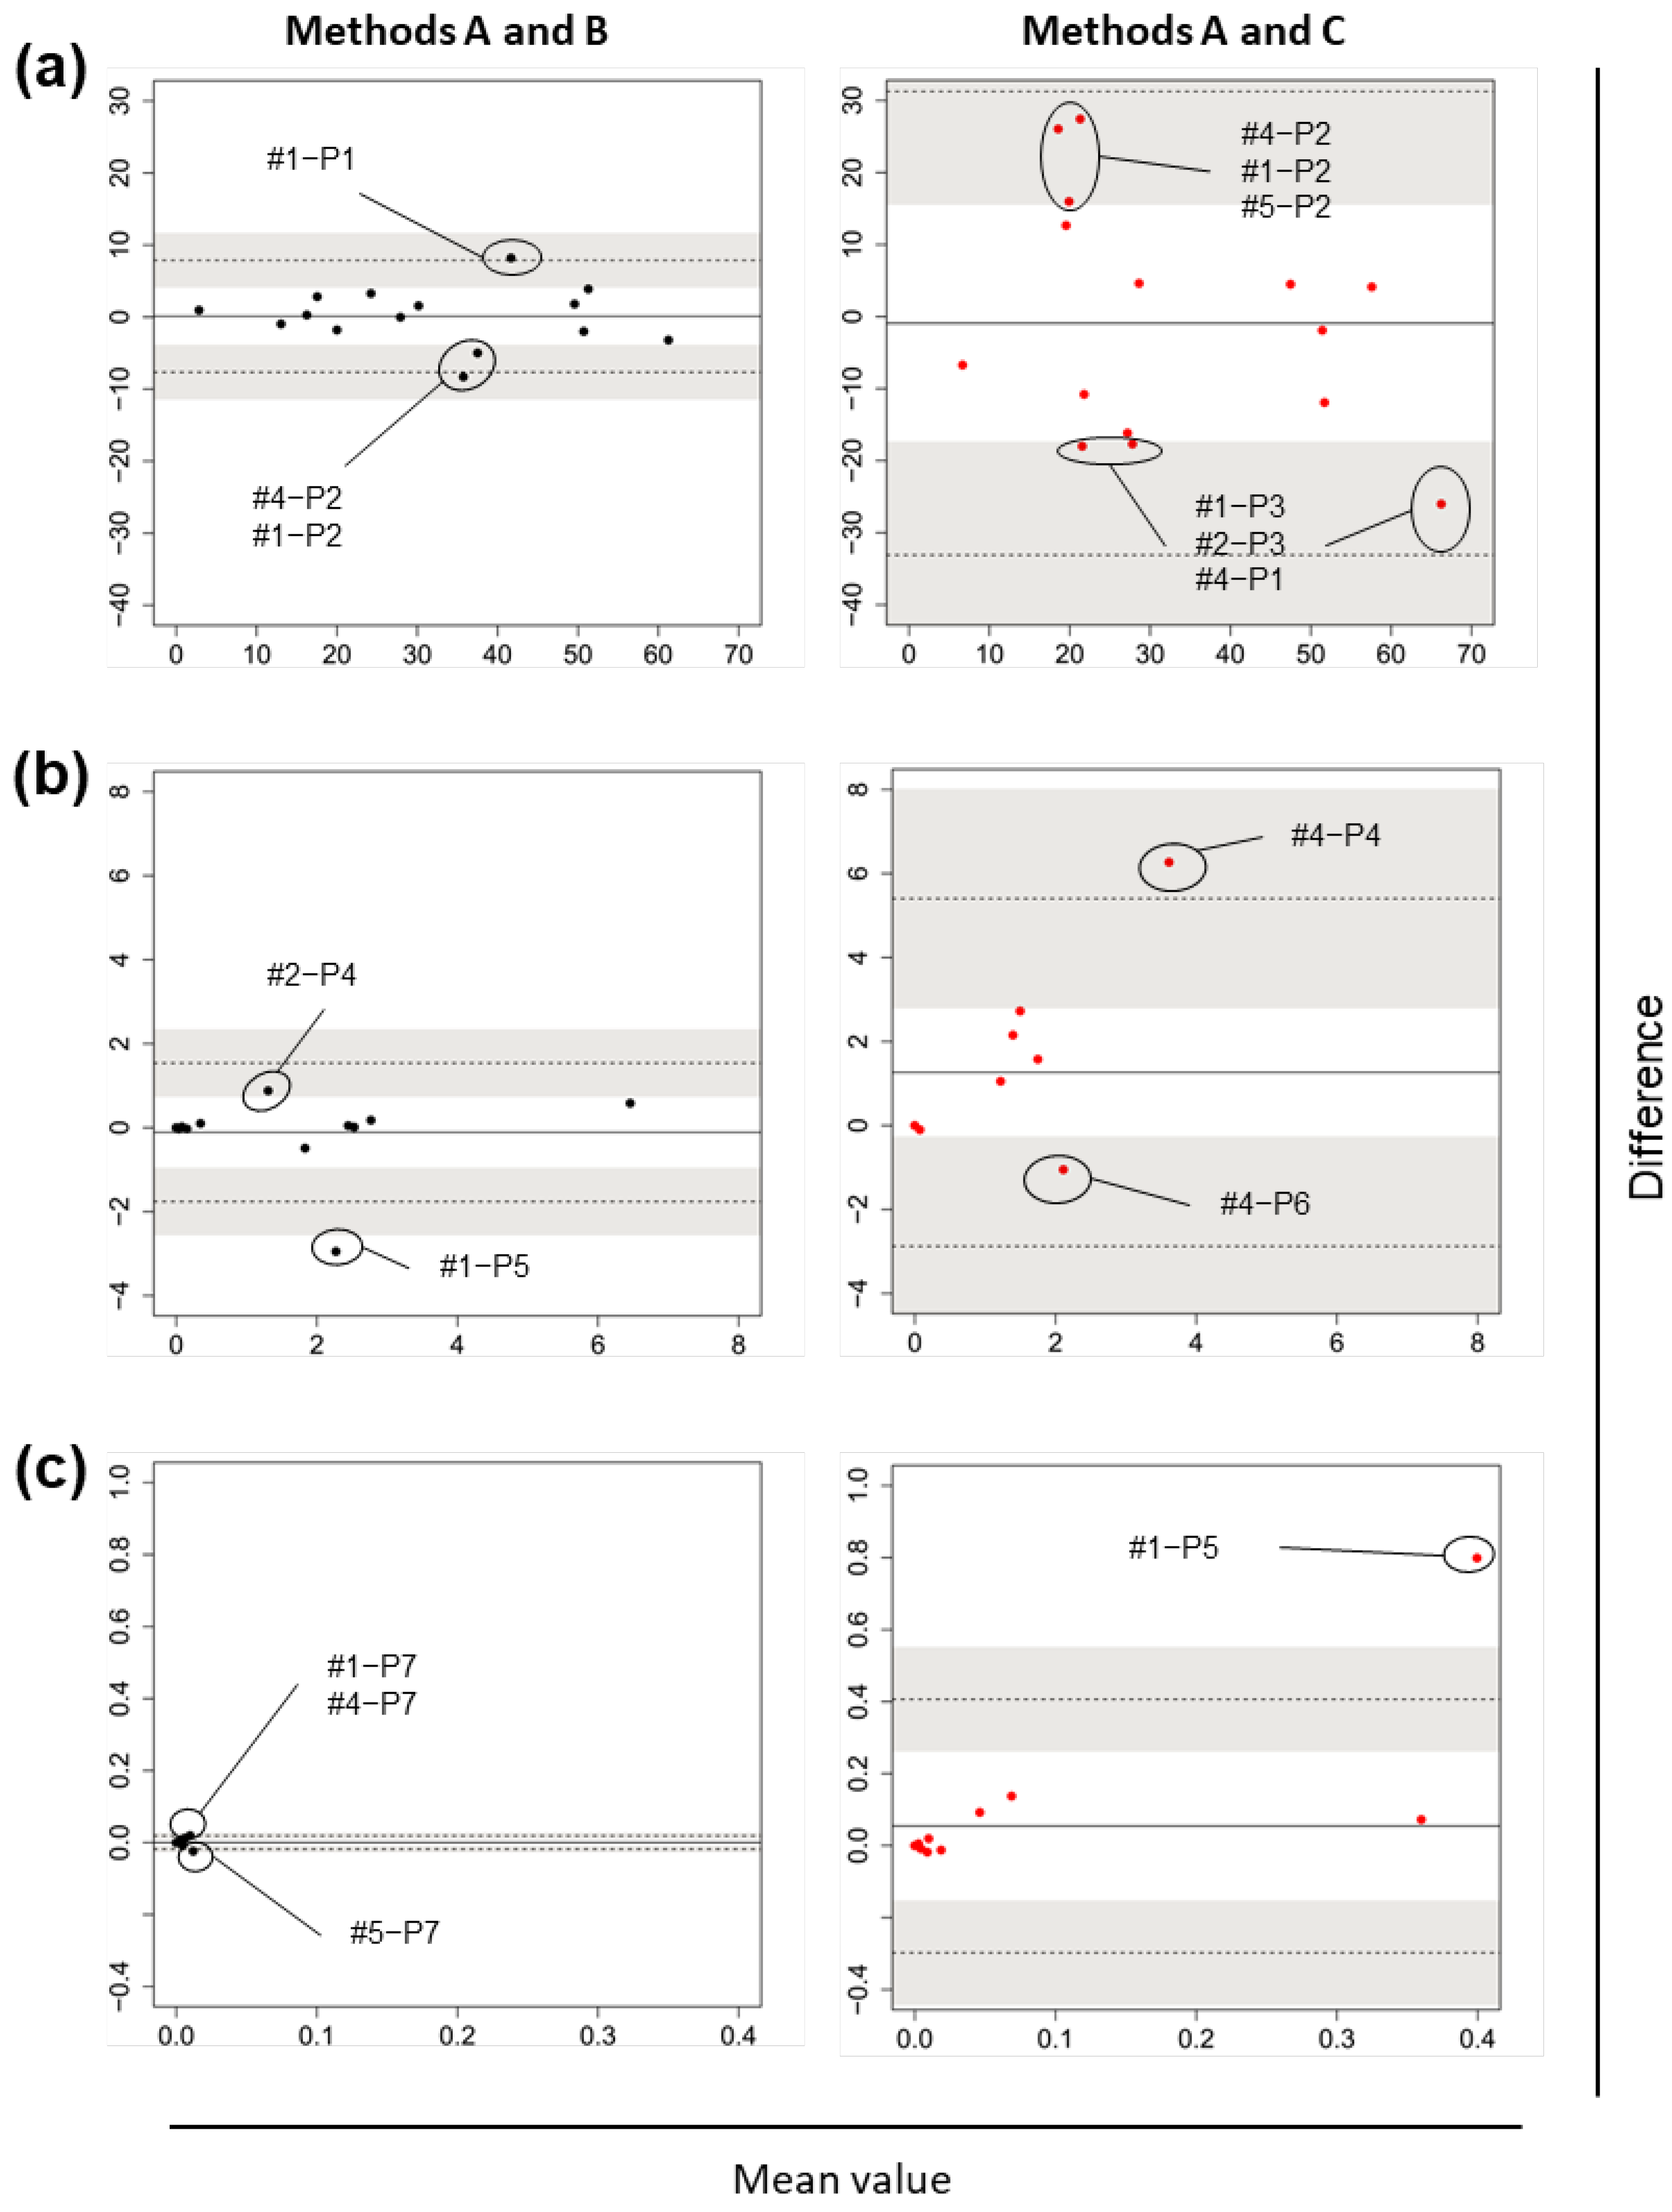
3.1. Research I: Gut Bacterial Compositions According to Three Different Methods

The bacterial compositions of samples from each subject are shown in Figure 2 and Figure S1 (see Tables S1–S6 for IDs of bacteria depicted in the figures). At the phylum level, Firmicutes (P1), Bacteroidetes (P2), Actinobacteria (P3), and Proteobacteria (P4) accounted for more than 96% of the occupancy in all the methods (Figure 2a). Method B yielded microbes at the phylum, class, order, family, genus, and species levels which did not differ markedly from Method A in their occupancy (Figure 2 and Figure S1). In Method C, at the phylum level, the relative abundance of Bacteroidetes (P2) tended to decrease and Actinobacteria (P3) tended to increase (Figure 2a). The decrease of P2 relative abundance was attributable to bacteria that belonged to Bacteroidia (C2) at the class level (Figure S1a), Bacteroidales (O2) at the order level (Figure S1b), Bacteroidaceae (F2) at the family level (Figure S1c), and Bacteroides (G1) at the genus level (Figure 2b). The increased Actinobacteria (P3) at the class, order, family, and genus levels mainly belonged to Actinobacteria (C3) (Figure S1a), Bifidobacteriales (O3) (Figure S1b), Bifidobacteriaceae (F4) (Figure S1c), and Bifidobacterium (G2) (Figure 2b), and Coriobacteriia (C5) (Figure S1a), Coriobacteriales (O5) (Figure S1b), Coriobacteriaceae (F7) (Figure S1c), and Collinsela (G6), respectively (Figure 2b).
The Chao1, Shannon, and Simpson diversity indices, the observed OTUs, and Faith’s PD did not differ significantly in Methods B and C compared to Method A (Figure 3a). The F/B ratio in Method C differed but not significantly compared with Method A (p = 0.188, Figure 3b), although the effect size was 0.589.
Bland–Altman plots in each relative abundance range category at the phylum, class, order, family, genus, and species levels (Figure 4, Figures S2, S3, S4, Figure 5 and Figure S5, respectively) revealed that LOAs and 95% CIs of their upper/lower limits in the comparison of Methods A–C were much wider than those in the comparison of Methods A–B, which indicated wider random fluctuations around the means in the Methods A–C comparison. In general, LOAs in both analyses covered 0, which indicated that systemic errors were not evident.
Table 2 shows that at the phylum level, the detection frequencies of bacteria at 1% or higher as the maximum relative abundance in any of the specimens were the same between Methods A and B (Table 2a), and between Methods A and C (Table 2b). Firmicutes (P1), Bacteroidetes (P2), Actinobacteria (P3), Proteobacteria (P4), and Verrucomicrobia (P6) fell within the 1% or higher category, while Fusobacteria (P5) did not, in the Methods A–C comparison (Table 2b), because its detection at ≥1% occurred only in Method B. Table 2 also shows that part of the abundance differences between the methods exceeded LOAs. For example, Bacteroidetes (P2) was detected in all five subjects in Methods A, B, and C, and the relative abundance was more than 10% in at least one specimen in each of the method pairs. When looking at the abundance differences in each specimen for this abundance range category, the Methods A–B comparison showed that the difference of the bacterium (P2) in one specimen (#1) was outside the LOA (Figure 4a, left panel), while there were no specimens in which the differences were outside the LOA in the Methods A–C comparison (Figure 4a, right panel). When taking the 95% CIs for the LOA into account, the differences in two specimens (#1 and #4) were outside an upper limit of 95% CI of a lower limit of LOA in the Methods A–B comparison (Figure 4a, left panel) and that in three specimens (#1, #4, and #5) were outside a lower limit of 95% CI of an upper limit of LOA in the Methods A–C comparison (Figure 4a, right panel). As for phyla that were detected at the maximum relative abundance of <1%, the frequencies of detection of the relevant phylum were not the same between the methods (Table 2).
The same analyses at the class, order, family, genus, and species levels are shown in Tables S7, S8, S9, Table 3 and Table S10, respectively. Again, the detection frequencies of bacteria whose relative abundance was >1% were almost the same among the methods, although part of the abundance differences between the methods exceeded LOAs (Figures S2, S3, S4, Figure 5 and Figure S5). As for the bacteria whose maximum abundances were ≤1%, the differences in their detection frequencies and relative abundances between the methods varied depending on the bacteria. For example, Clostridium (G42) showed stable detection (5/5) in all the methods with the maximum abundance of ≥0.1 and <1%, and the abundance differences between the Methods A–B pairs were within the LOAs (Table 3a). However, for some other bacteria, the detections were not so stable. When bacteria were detected by only one of the methods, the Bland–Altman plots were fan-shaped especially in the <0.1% range categories (Figure 5d and other supplemental figures).
Heatmap and cluster analyses at the genus and species levels showed that bacterial compositions identified by the three methods in each specimen collected from the same subject were classified into the same clusters that corresponded to each subject (#1–#5) (Figure 6 and Figure S6e), but at the higher-level taxonomic categories, the clusters did not correspond to the subjects (Figure S6a–d).

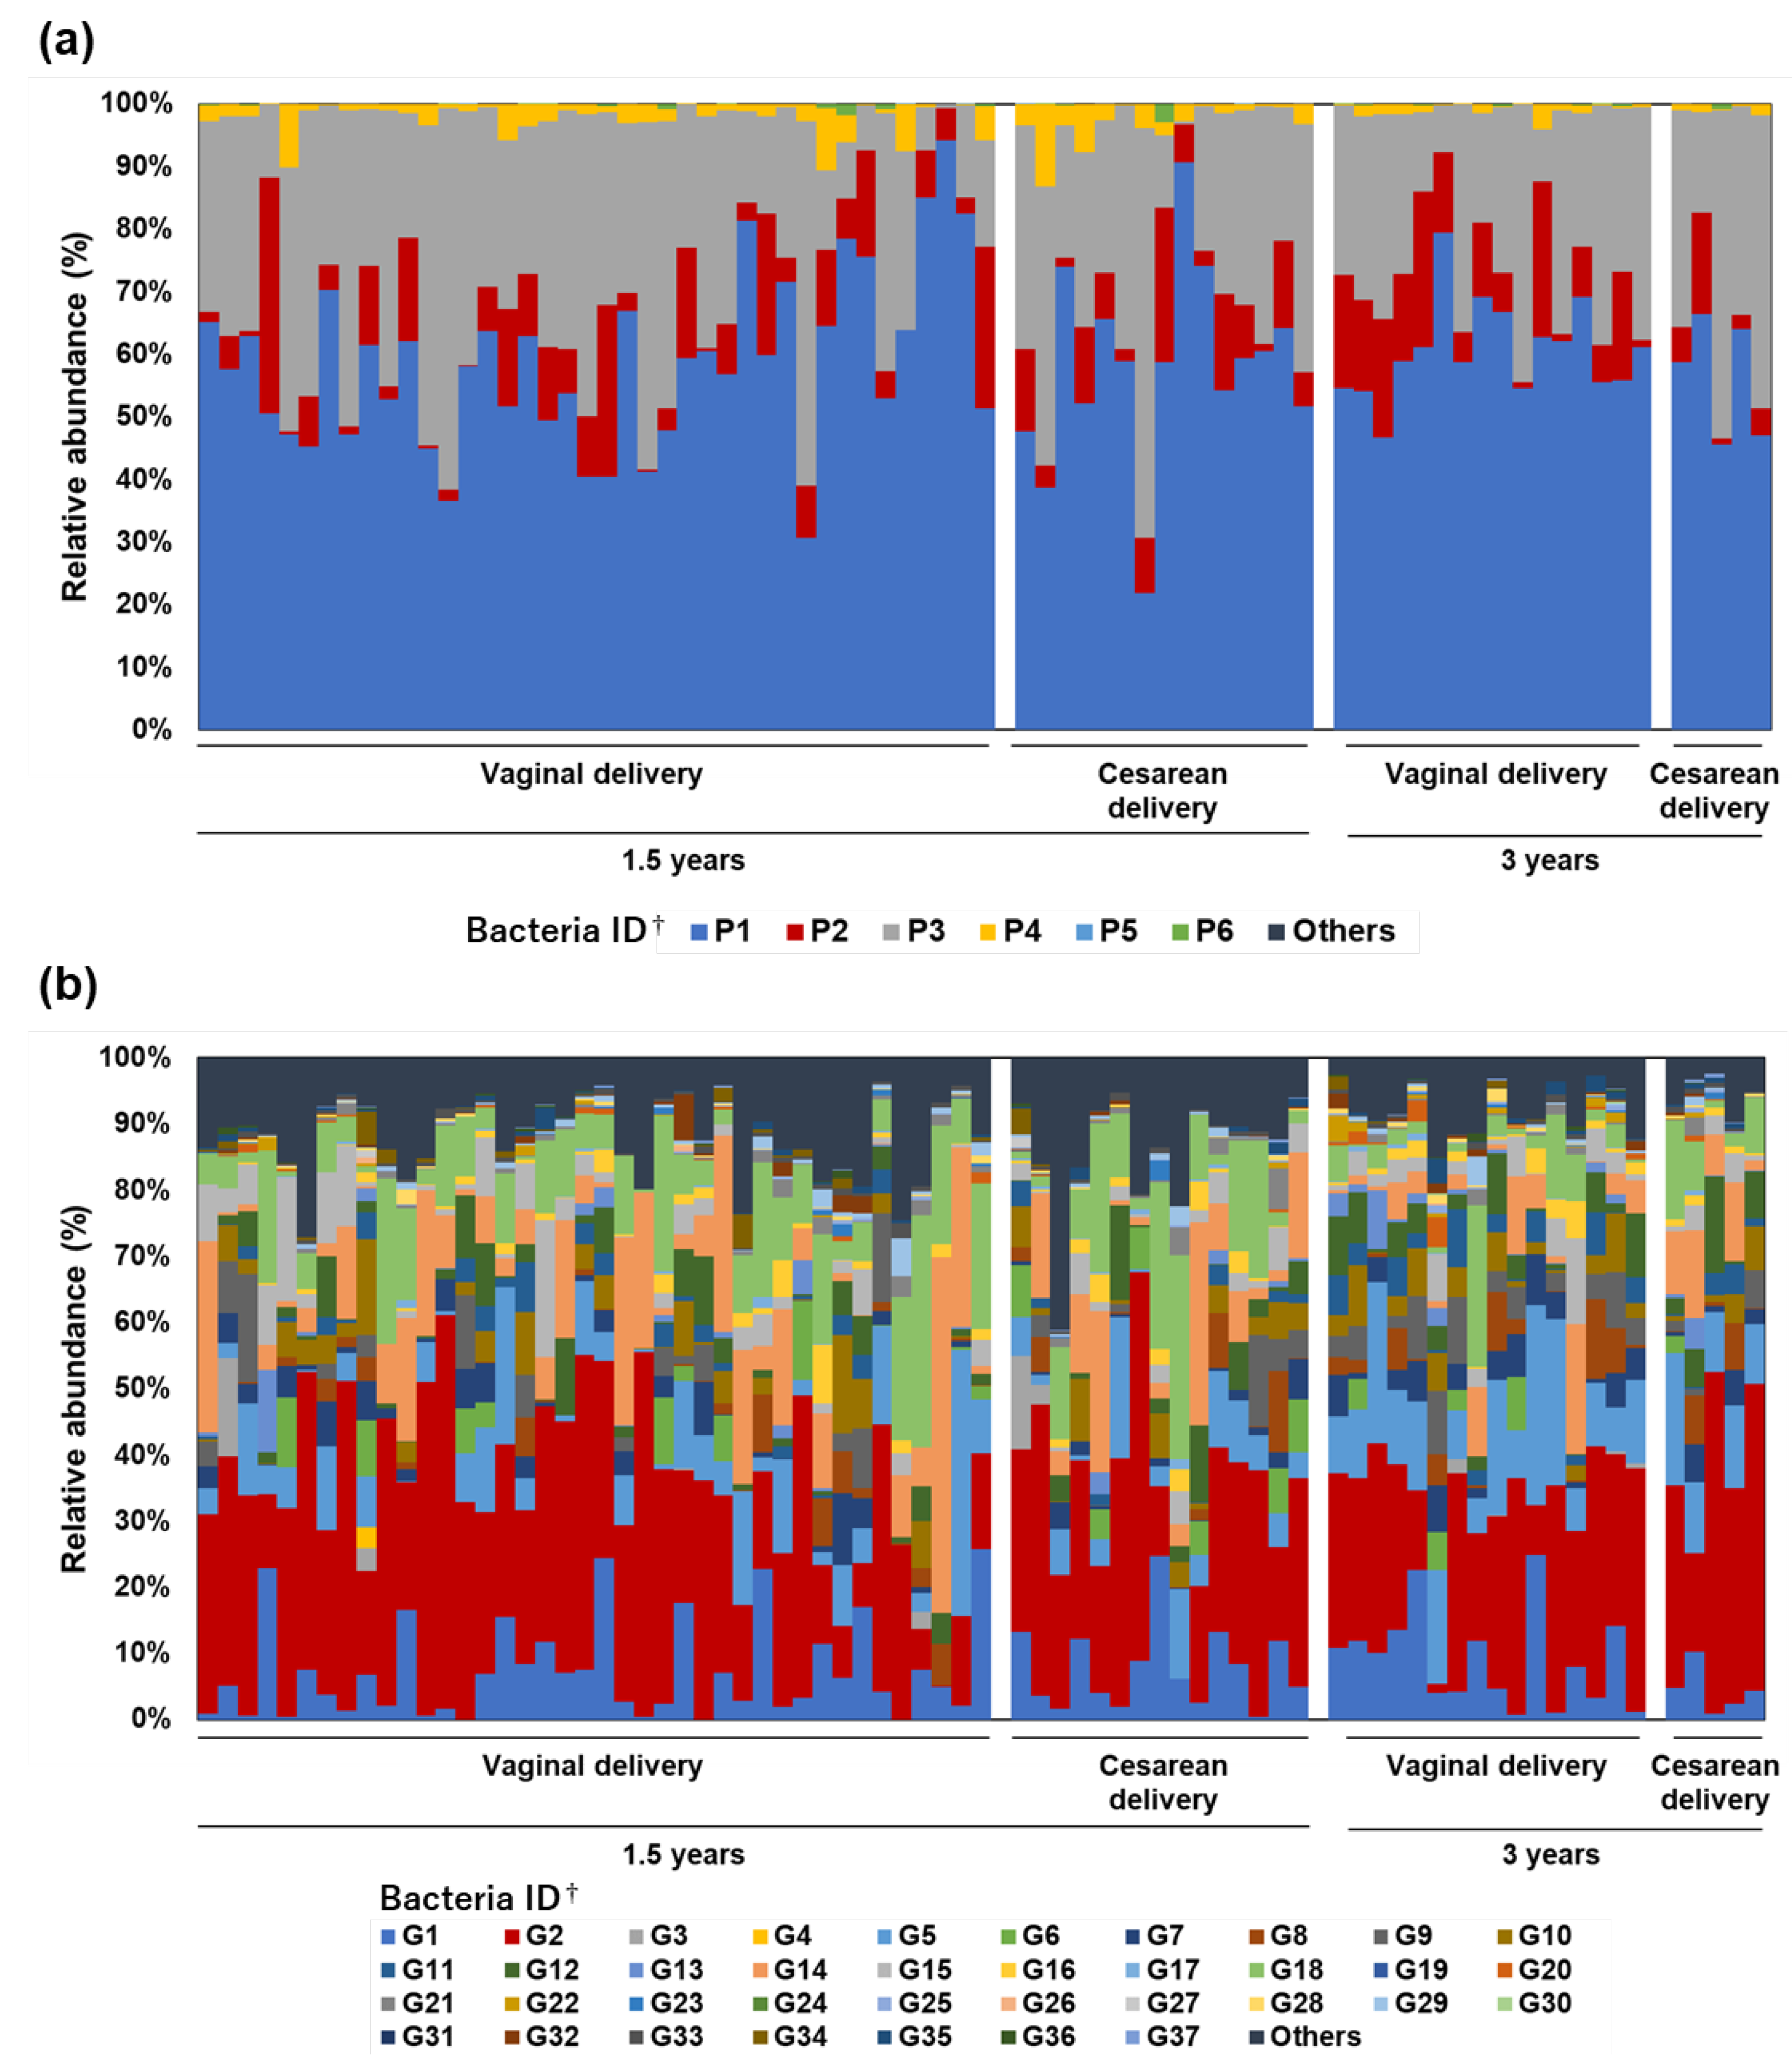
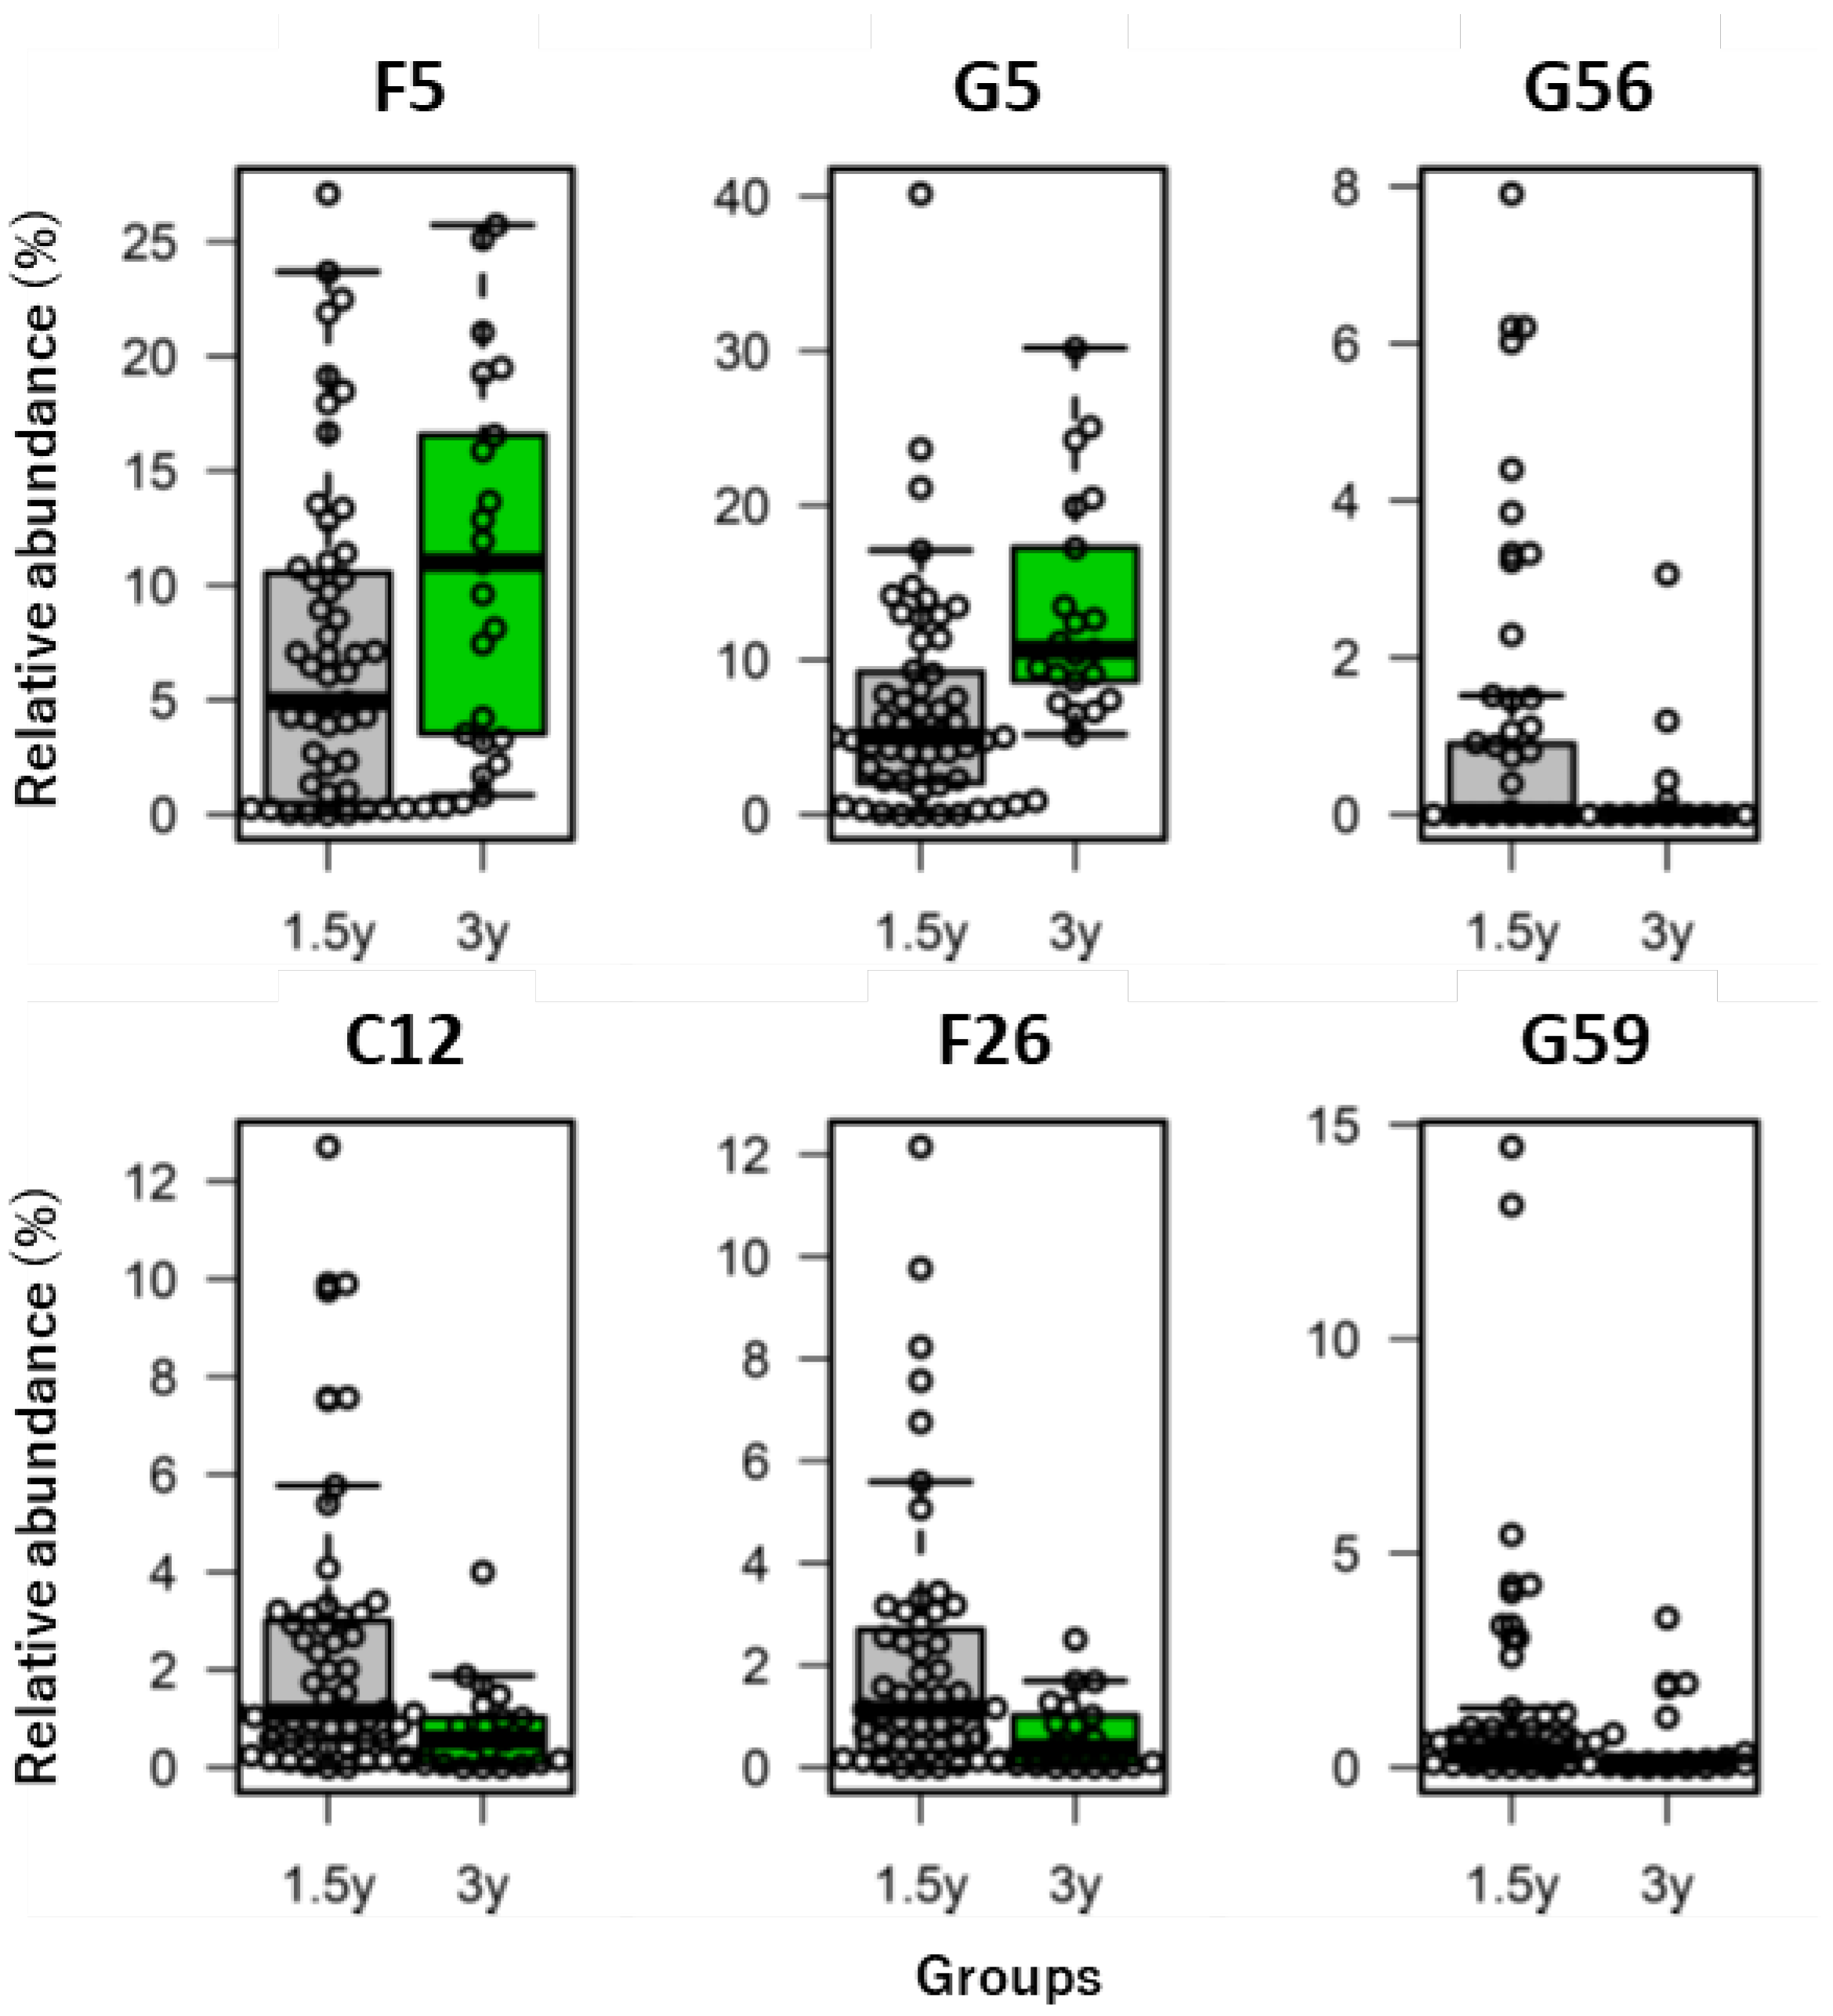
3.2. Research II: Bacterial Composition of Toddlers’ Feces Excreted in Diapers

Bacterial composition, at the phylum and genus levels, of 76 toddlers’ feces excreted in diapers is shown in Figure 7. There was no clear trend in the composition of the predominant bacteria at the phylum and genus levels according to age or mode of delivery.
Diversity indices of the toddlers’ specimens were significantly lower than those of adults obtained by Method C in Research I, except for the Simpson diversity index (Table 4).
Table 5 summarizes the results of the comparison between the 1.5 years and 3 years age groups for bacteria, for which Method C was validated in Research I, that were reported as potentially beneficial or detrimental to health in previous studies [7,8,31,32,33] and their coefficients of variation in each age group. For example, there was a significant difference between the 1.5 years and 3 years age groups in the relative abundance of Blautia (G5, p < 0.001). Figure 8 shows the bacteria whose abundance differences in the Methods A–C comparison were within the LOA, with significant differences between the 1.5 years and 3 years age groups in their relative abundances. Lactobacillus (G56) had a larger variation (relatively larger coefficients of variation of 1.980 and 3.000, respectively).

4. Discussion

The primary conclusion from Research I is that both Method B and C, the latter of which is more relevant to epidemiological studies targeting children with diapers, are worth adopting when Method A, a gold standard method, is difficult to adopt. Based on this finding, Research II was conducted, and it revealed that the bacterial flora composition of feces of toddlers differed from that of adults, as reported in previous studies [14]. Furthermore, the relative abundances of some bacteria differed between the ages of 1.5 and 3 years.
When adopting Method B or Method C, it is important to recognize the following limitation of the methods: bacterial flora composition resulting from these methods could change depending on their taxonomic category, (phylum/class/order/family/genus/species), when compared with Method A. Relative abundance differences of some bacteria were outside the LOA in Bland–Altman analyses; therefore, care should be taken when implementing Methods B and C and interpreting their results. Especially in Method C, the F/B ratio, which has been linked to obesity (although a complete consensus has not been reached) [34,35], deviated markedly; therefore, it is not appropriate to use this measure in diaper stools. However, the bacterial compositions as a whole at the genus and species levels identified by these methods had enough resolution to differentiate individual subjects. Diversity indices did not differ significantly among the methods, which suggested that bacterial community heterogeneities were maintained in Methods B and C.
The differences in bacterial composition in samples collected by Methods B or C compared to Method A may be due to different conditions during collection, storage, and transportation. Bacterial growth is influenced by several factors in the environment [36]. For example, the relative abundance of Bacteroides (G1) tended to decrease in Method C, which might have been because the bacteria are obligate anaerobes and their abundance was possibly affected by the aerobic environment of the diaper. However, the variation of each occupancy in the present study cannot be explained by oxygen demand alone, and must be examined in more detail in the future. The LOAs of the Bland–Altman analysis of Methods A–C were much larger than those of Methods A–B, and the 95% CIs of their upper and lower limits were also wider, probably due to wider random fluctuations of the measurement in Method C, which led to a more strict agreement range in Method B than in Method C. Method B was thus considered more sensitive than Method C for detecting statistically significant differences among the bacteria that could be tested by the methods. The bias of each measurement in both methods was not unidirectional in any taxonomic category, suggesting that the bias was due to the characteristics of each bacterial taxon.
Bacterial flora analysis of feces collected from toddlers’ diapers in Research II showed that their bacterial composition differed from that of adults, which replicated previous findings showing lower diversity compared to adults [14]. In addition, the abundance of bacteria that have been reported to be beneficial or detrimental in previous studies [7,8,31,32,33] was compared between children aged 1.5 years and 3 years. For example, the abundance of Blautia (G5), which is considered beneficial because of its significantly lower occupancy in older people with obesity [7,31], differed significantly between children aged 1.5 and 3 years. Such a comparison was possible since the abundance difference between Methods A and C was within the LOA in Research I. Another example in which the comparison was also possible was Bacteroides fragilis (S73), which was reportedly opportunistically harmful but also regarded as a beneficial species that might inhibit inflammation through the production of polysaccharide A [7,8,33]. No significant difference in abundance was observed between the two ages (Table 5).
The gut microbiota reportedly undergoes drastic changes in the first few years of life, including the increased diversity within an individual, a decrease in lactic acid bacteria, and increases in other bacteria such as Bacteroidaceae and Lachnospiraceae [14,37,38]. In an gut microbiota analysis study of 513 children and adults, specimens were stored at −80 °C within 30 min of their collection [39]. Another toddler gut microbiota study used commercial sampling tubes [40]. Gut microbiota analysis of toddlers using disposable diapers has also been conducted, but its validity has not been addressed [41,42]. The method of immersing stool specimens in ethanol is reportedly useful in areas such as Africa where resources and facilities may not be available [43]. Although there have been reports on the gut microbiota of toddlers, the human gut microbiota is influenced by factors such as race, genetics, country and region [6], and should be studied in various regions under different environments.
Microbiome research is currently actively conducted worldwide, and the function of various bacteria is likely to be further clarified in the future. Research II showed relatively higher coefficients of variation in some bacteria, which indicated relatively larger differences in their abundance among individuals, suggesting the possibility that these bacteria might play some role in the different predispositions for health or disease. Furthermore, the results of this study may be applicable not only to infants and toddlers, but also to the elderly who use diapers for elimination. The findings of this study will contribute to the further study of intestinal microbiomes, especially within epidemiological studies.
A limitation of this study is that in Research I, we could not examine the method validity for bacteria that were detected only in children because we used adult specimens. We used adult specimens for the following reason: the fecal bacterial composition of adults is more stable and more complex than that of toddlers, and individual differences are smaller [44], and we contemplated that comparisons between the methods were possible with the small number of adult volunteer specimens. Further studies, including those of bacteria that were not detected in the present study, are desirable in the future. Another limitation of this study is that in Research II, the comparison between ages was not based on the same participants, and this might have affected the results.

5. Conclusions

Both Method B and C are worth adopting when Method A, a gold standard method, is difficult to adopt, especially in large-scale epidemiological studies. When the study population is young children who cannot excrete autonomously, Method C is a practical strategy for investigating certain fecal bacteria of which the difference in abundance is within the LOA. In such studies, the interpretation of the data should be made with caution for bacteria of which the accuracy is reduced. Especially, the researchers should not use the results of bacteria for which the agreement between Methods A and C is poor. Even for bacteria whose abundance differences between Methods A and C were within the limits of agreement in all the specimens in Research I, larger sample sizes are desirable because random fluctuations around the means in the Methods A–C comparison were wider than those in the Methods A–B comparison. However, sending diapers back to the research team seems to be a relatively low hurdle for parents of the study participants (the diaper return rate was 88.4% in our previous study [18]). Thus, this method is acceptable to participants and has the advantage of reducing selection bias in epidemiological studies. As for profiles of the gut microbiota of toddlers, the observations in this study confirmed that their flora composition was different from that of adults, and that the relative abundance of some bacteria differed between the ages of 1.5 and 3 years.

Supplementary Materials

The following supporting information can be downloaded at: https://www.mdpi.com/article/10.3390/nu14163315/s1, Table S1: ID list of identified bacteria at the phylum level; Table S2: ID list of identified bacteria at the class level; Table S3: ID list of identified bacteria at the order level; Table S4: ID list of identified bacteria at the family level; Table S5: ID list of identified bacteria at the genus level; Table S6: ID list of identified bacteria at the species level; Table S7: Research I: Summary of bacteria detection and Bland–Altman plotting results (Methods A–B (a) and Methods A–C (b)) at the class level; Table S8: Research I: Summary of bacteria detection and Bland–Altman plotting results (Methods A–B (a) and Methods A–C (b)) at the order level; Table S9: Research I: Summary of bacteria detection and Bland–Altman plotting results (Methods A–B (a) and Methods A–C (b)) at the family level; Table S10. Research I: Summary of bacteria detection and Bland–Altman plotting results (Methods A–B (a) and Methods A–C (b)) at the species level; Figure S1: Research I: Fecal bacterial composition at the class, order, family, and species level in five adult volunteers. Bacterial composition at the (a) class, (b) order, (c) family, and (d) species levels; Figures S2–S5: Bland–Altman plots of the relative abundance of fecal bacterial at the class (Figure S2), order (Figure S3), family (Figure S4), and species (Figure S5) levels obtained by three methods from five adult volunteers. Analysis between Methods A–B (left) and Methods A–C (right); Figure S6: Research I: Heatmap of gut microbiota composition at the phylum, class, order, family, and species levels in five adult volunteers. Heatmap of log-transformed values of relative abundance at the (a) phylum, (b) class, (c) order, (d) family, and (e) species levels in the three methods of Research I using Ward’s method for clustering; Figure S7: Research II: Fecal bacterial composition in 76 toddlers at the (a) class, (b) order, (c) family, and (d) species levels.

Author Contributions

H.T. and Y.I. conceptualized the study and wrote the first draft of the manuscript. H.T. verified the underlying data and performed the statistical analysis. Y.I. and T.E. organized the study team, assisted H.T. with the statistical analysis, and helped in drafting the manuscript. S.K., K.K., T.M., S.S. and M.S.-O. were responsible for acquiring data, managing the cohort, and critically revising the manuscript. M.K. was responsible for supervision of the present study team, and corrected and finalized the manuscript. All authors have read and agreed to the published version of the manuscript.

Funding

This research was partly funded by the Grants-in-Aid for Scientific Research (grant numbers 19H01078, 19K24288, and 20K13824) from the Japan Society for the Promotion of Science (JSPS). The JECS was funded by the Ministry of the Environment, Japan. The findings and conclusions of this manuscript are solely the responsibility of the authors and do not represent the official views of the funding agencies. The sponsors had no role in the design, execution, interpretation, or writing of the study.

Institutional Review Board Statement

The study was conducted in accordance with the Declaration of Helsinki. The ethics committee of the Nagoya City University Graduate School of Medical Sciences approved this study protocol (approval numbers 60-00-1116 and 70-19-0001).

Informed Consent Statement

Informed consent was obtained from the guardians of the children, who, as legally acceptable representatives, were asked to participate in the study.

Data Availability Statement

Data are available upon reasonable request.

Acknowledgments

A part of this study (Research II) was conducted as an Adjunct Study of the JECS. We are grateful to the study participants and research staff of the Aichi regional subcohort of the JECS, JECS-A, and the local governments (cities of Nagoya and Ichinomiya) for their dedication and encouragement toward this study. In addition, we would like to thank Naoko Oya, Hirotaka Sato, Kazuki Matsuzaki, and Kyoko Minato for their assistance in conducting the experiments.

Conflicts of Interest

The authors declare no conflict of interest. The sponsors had no role in the design, execution, interpretation, or writing of the study.

References

  1. Nicholson, J.K.; Holmes, E.; Kinross, J.; Burcelin, R.; Gibson, G.; Jia, W.; Pettersson, S. Host-gut microbiota metabolic interactions. Science 2012, 336, 1262–1267. [Google Scholar] [CrossRef] [PubMed]
  2. Ottman, N.; Smidt, H.; de Vos, W.M.; Belzer, C. The function of our microbiota: Who is out there and what do they do? Front. Cell. Infect. Microbiol. 2012, 2, 104. [Google Scholar] [CrossRef] [PubMed]
  3. Chow, J.; Lee, S.M.; Shen, Y.; Khosravi, A.; Mazmanian, S.K. Host-bacterial symbiosis in health and disease. Adv. Immunol. 2010, 107, 243–274. [Google Scholar] [CrossRef]
  4. Biedermann, L.; Rogler, G. The intestinal microbiota: Its role in health and disease. Eur. J. Pediatrics 2015, 174, 151–167. [Google Scholar] [CrossRef]
  5. Milani, C.; Duranti, S.; Bottacini, F.; Casey, E.; Turroni, F.; Mahony, J.; Belzer, C.; Delgado Palacio, S.; Arboleya Montes, S.; Mancabelli, L.; et al. The first microbial colonizers of the human gut: Composition, activities, and health implications of the infant gut microbiota. Microbiol. Mol. Biol. Rev. MMBR 2017, 81, e00036-17. [Google Scholar] [CrossRef]
  6. Tanaka, M.; Nakayama, J. Development of the gut microbiota in infancy and its impact on health in later life. Allergol. Int. Off. J. Jpn. Soc. Allergol. 2017, 66, 515–522. [Google Scholar] [CrossRef]
  7. Yang, Q.; Liang, Q.; Balakrishnan, B.; Belobrajdic, D.P.; Feng, Q.J.; Zhang, W. Role of dietary nutrients in the modulation of gut microbiota: A narrative review. Nutrients 2020, 12, 381. [Google Scholar] [CrossRef]
  8. Hiippala, K.; Jouhten, H.; Ronkainen, A.; Hartikainen, A.; Kainulainen, V.; Jalanka, J.; Satokari, R. The potential of gut commensals in reinforcing intestinal barrier function and alleviating inflammation. Nutrients 2018, 10, 988. [Google Scholar] [CrossRef]
  9. O’Callaghan, A.A.; Corr, S.C. Establishing Boundaries: The relationship that exists between intestinal epithelial cells and gut-dwelling bacteria. Microorganisms 2019, 7, 663. [Google Scholar] [CrossRef]
  10. Gagnière, J.; Raisch, J.; Veziant, J.; Barnich, N.; Bonnet, R.; Buc, E.; Bringer, M.A.; Pezet, D.; Bonnet, M. Gut microbiota imbalance and colorectal cancer. World J. Gastroenterol. 2016, 22, 501–518. [Google Scholar] [CrossRef]
  11. Sinha, R.; Abu-Ali, G.; Vogtmann, E.; Fodor, A.A.; Ren, B.; Amir, A.; Schwager, E.; Crabtree, J.; Ma, S.; Abnet, C.C.; et al. Assessment of variation in microbial community amplicon sequencing by the Microbiome Quality Control (MBQC) project consortium. Nat. Biotechnol. 2017, 35, 1077–1086. [Google Scholar] [CrossRef]
  12. Gorzelak, M.A.; Gill, S.K.; Tasnim, N.; Ahmadi-Vand, Z.; Jay, M.; Gibson, D.L. Methods for improving human gut microbiome data by reducing variability through sample processing and storage of stool. PLoS ONE 2015, 10, e0134802. [Google Scholar] [CrossRef] [PubMed]
  13. Lin, A.; Bik, E.M.; Costello, E.K.; Dethlefsen, L.; Haque, R.; Relman, D.A.; Singh, U. Distinct distal gut microbiome diversity and composition in healthy children from Bangladesh and the United States. PLoS ONE 2013, 8, e53838. [Google Scholar] [CrossRef] [PubMed]
  14. Odamaki, T.; Kato, K.; Sugahara, H.; Hashikura, N.; Takahashi, S.; Xiao, J.Z.; Abe, F.; Osawa, R. Age-related changes in gut microbiota composition from newborn to centenarian: A cross-sectional study. BMC Microbiol. 2016, 16, 90. [Google Scholar] [CrossRef]
  15. Nakayama, J.; Yamamoto, A.; Palermo-Conde, L.A.; Higashi, K.; Sonomoto, K.; Tan, J.; Lee, Y.K. Impact of westernized diet on gut microbiota in children on Leyte Island. Front. Microbiol. 2017, 8, 197. [Google Scholar] [CrossRef]
  16. Nakayama, J.; Watanabe, K.; Jiang, J.; Matsuda, K.; Chao, S.H.; Haryono, P.; La-Ongkham, O.; Sarwoko, M.A.; Sujaya, I.N.; Zhao, L.; et al. Diversity in gut bacterial community of school-age children in Asia. Sci. Rep. 2015, 5, 8397. [Google Scholar] [CrossRef]
  17. Wong, W.S.W.; Clemency, N.; Klein, E.; Provenzano, M.; Iyer, R.; Niederhuber, J.E.; Hourigan, S.K. Collection of non-meconium stool on fecal occult blood cards is an effective method for fecal microbiota studies in infants. Microbiome 2017, 5, 114. [Google Scholar] [CrossRef]
  18. Oya, N.; Ito, Y.; Hioki, K.; Asai, Y.; Aoi, A.; Sugiura, Y.; Ueyama, J.; Oguri, T.; Kato, S.; Ebara, T.; et al. Quantitative analysis of organophosphate insecticide metabolites in urine extracted from disposable diapers of toddlers in Japan. Int. J. Hyg. Environ. Health 2017, 220, 209–216. [Google Scholar] [CrossRef]
  19. Nishimoto, Y.; Mizutani, S.; Nakajima, T.; Hosoda, F.; Watanabe, H.; Saito, Y.; Shibata, T.; Yachida, S.; Yamada, T. High stability of faecal microbiome composition in guanidine thiocyanate solution at room temperature and robustness during colonoscopy. Gut 2016, 65, 1574–1575. [Google Scholar] [CrossRef]
  20. Ebara, T.; Yamada, Y.; Shoji, N.; Ito, Y.; Nakagawa, A.; Miyachi, T.; Ozaki, Y.; Omori, T.; Suzuki, S.; Kojima, M.; et al. Cohort profile: Aichi regional sub-cohort of the Japan Environment and Children’s Study (JECS-A). BMJ Open 2019, 9, e028105. [Google Scholar] [CrossRef]
  21. Kawamoto, T.; Nitta, H.; Murata, K.; Toda, E.; Tsukamoto, N.; Hasegawa, M.; Yamagata, Z.; Kayama, F.; Kishi, R.; Ohya, Y.; et al. Rationale and study design of the Japan environment and children’s study (JECS). BMC Public Health 2014, 14, 25. [Google Scholar] [CrossRef] [PubMed]
  22. Takahashi, S.; Tomita, J.; Nishioka, K.; Hisada, T.; Nishijima, M. Development of a prokaryotic universal primer for simultaneous analysis of Bacteria and Archaea using next-generation sequencing. PLoS ONE 2014, 9, e105592. [Google Scholar] [CrossRef] [PubMed]
  23. Muyzer, G.; de Waal, E.C.; Uitterlinden, A.G. Profiling of complex microbial populations by denaturing gradient gel electrophoresis analysis of polymerase chain reaction-amplified genes coding for 16S rRNA. Appl. Environ. Microbiol. 1993, 59, 695–700. [Google Scholar] [CrossRef] [PubMed]
  24. Caporaso, J.G.; Lauber, C.L.; Walters, W.A.; Berg-Lyons, D.; Lozupone, C.A.; Turnbaugh, P.J.; Fierer, N.; Knight, R. Global patterns of 16S rRNA diversity at a depth of millions of sequences per sample. Proc. Natl. Acad. Sci. USA 2011, 108 (Suppl. S1), 4516–4522. [Google Scholar] [CrossRef]
  25. Hisada, T.; Endoh, K.; Kuriki, K. Inter- and intra-individual variations in seasonal and daily stabilities of the human gut microbiota in Japanese. Arch. Microbiol. 2015, 197, 919–934. [Google Scholar] [CrossRef]
  26. Aronesty, E. Comparison of sequencing utility programs. Open Bioinform. J. 2013, 7, 1–8. [Google Scholar] [CrossRef]
  27. Wang, Q.; Garrity, G.M.; Tiedje, J.M.; Cole, J.R. Naive Bayesian classifier for rapid assignment of rRNA sequences into the new bacterial taxonomy. Appl. Environ. Microbiol. 2007, 73, 5261–5267. [Google Scholar] [CrossRef]
  28. Bolyen, E.; Rideout, J.R.; Dillon, M.R.; Bokulich, N.A.; Abnet, C.C.; Al-Ghalith, G.A.; Alexander, H.; Alm, E.J.; Arumugam, M.; Asnicar, F.; et al. Reproducible, interactive, scalable and extensible microbiome data science using QIIME 2. Nat. Biotechnol. 2019, 37, 852–857. [Google Scholar] [CrossRef]
  29. Callahan, B.J.; McMurdie, P.J.; Rosen, M.J.; Han, A.W.; Johnson, A.J.; Holmes, S.P. DADA2: High-resolution sample inference from Illumina amplicon data. Nat. Methods 2016, 13, 581–583. [Google Scholar] [CrossRef]
  30. DeSantis, T.Z.; Hugenholtz, P.; Larsen, N.; Rojas, M.; Brodie, E.L.; Keller, K.; Huber, T.; Dalevi, D.; Hu, P.; Andersen, G.L. Greengenes, a chimera-checked 16S rRNA gene database and workbench compatible with ARB. Appl. Environ. Microbiol. 2006, 72, 5069–5072. [Google Scholar] [CrossRef]
  31. Cancello, R.; Turroni, S.; Rampelli, S.; Cattaldo, S.; Candela, M.; Cattani, L.; Mai, S.; Vietti, R.; Scacchi, M.; Brigidi, P.; et al. Effect of short-term dietary intervention and probiotic mix supplementation on the gut microbiota of elderly obese women. Nutrients 2019, 11, 3011. [Google Scholar] [CrossRef]
  32. Kowalska-Duplaga, K.; Gosiewski, T.; Kapusta, P.; Sroka-Oleksiak, A.; Wędrychowicz, A.; Pieczarkowski, S.; Ludwig-Słomczyńska, A.H.; Wołkow, P.P.; Fyderek, K. Differences in the intestinal microbiome of healthy children and patients with newly diagnosed Crohn’s disease. Sci. Rep. 2019, 9, 18880. [Google Scholar] [CrossRef]
  33. Alhinai, E.A.; Walton, G.E.; Commane, D.M. The role of the gut microbiota in colorectal cancer causation. Int. J. Mol. Sci. 2019, 20, 5295. [Google Scholar] [CrossRef]
  34. Indiani, C.; Rizzardi, K.F.; Castelo, P.M.; Ferraz, L.F.C.; Darrieux, M.; Parisotto, T.M. Childhood obesity and firmicutes/bacteroidetes ratio in the gut microbiota: A systematic review. Child. Obes. 2018, 14, 501–509. [Google Scholar] [CrossRef]
  35. Magne, F.; Gotteland, M.; Gauthier, L.; Zazueta, A.; Pesoa, S.; Navarrete, P.; Balamurugan, R. The firmicutes/bacteroidetes ratio: A relevant marker of gut dysbiosis in obese patients? Nutrients 2020, 12, 1474. [Google Scholar] [CrossRef]
  36. Monod, J. The growth of bacterial cultures. Annu. Rev. Microbiol. 1949, 3, 371–394. [Google Scholar] [CrossRef]
  37. Laursen, M.F. Gut microbiota development: Influence of diet from infancy to toddlerhood. Ann. Nutr. Metab. 2021, 77, 21–34. [Google Scholar] [CrossRef]
  38. Albenberg, L.G.; Wu, G.D. Diet and the intestinal microbiome: Associations, functions, and implications for health and disease. Gastroenterology 2014, 146, 1564–1572. [Google Scholar] [CrossRef]
  39. Yatsunenko, T.; Rey, F.E.; Manary, M.J.; Trehan, I.; Dominguez-Bello, M.G.; Contreras, M.; Magris, M.; Hidalgo, G.; Baldassano, R.N.; Anokhin, A.P.; et al. Human gut microbiome viewed across age and geography. Nature 2012, 486, 222–227. [Google Scholar] [CrossRef]
  40. Sugino, K.Y.; Ma, T.; Paneth, N.; Comstock, S.S. Effect of environmental exposures on the gut microbiota from early infancy to two years of age. Microorganisms 2021, 9, 2140. [Google Scholar] [CrossRef]
  41. Christian, L.M.; Galley, J.D.; Hade, E.M.; Schoppe-Sullivan, S.; Kamp Dush, C.; Bailey, M.T. Gut microbiome composition is associated with temperament during early childhood. Brain Behav. Immun. 2015, 45, 118–127. [Google Scholar] [CrossRef]
  42. Galley, J.D.; Bailey, M.; Kamp Dush, C.; Schoppe-Sullivan, S.; Christian, L.M. Maternal obesity is associated with alterations in the gut microbiome in toddlers. PLoS ONE 2014, 9, e113026. [Google Scholar] [CrossRef]
  43. Ayeni, K.I.; Berry, D.; Wisgrill, L.; Warth, B.; Ezekiel, C.N. Early-life chemical exposome and gut microbiome development: African research perspectives within a global environmental health context. Trends Microbiol. 2022. [Google Scholar] [CrossRef]
  44. Lim, E.S.; Wang, D.; Holtz, L.R. The bacterial microbiome and virome milestones of infant development. Trends Microbiol. 2016, 24, 801–810. [Google Scholar] [CrossRef]
Figure 1. Experimental overview of Research I. For Methods A and B, stool samples were collected using commercial collection tubes. For Method C, urine and stool samples were applied to disposable diapers. For Methods B and C, the samples were stored at −80 °C for 2 months.
Nutrients 14 03315 g001
Figure 2. Research I: Fecal bacterial composition in five adult volunteers. Bacterial composition at the (a) phylum and (b) genus levels. Bacteria detected at a relative abundance of less than 1% were grouped together as Others. See Table S1 or Table S5 for the bacterial taxonomy name corresponding to each ID.
Nutrients 14 03315 g002
Figure 3. Research I: Diversity indices and the Firmicutes/Bacteroidetes ratio of the fecal bacterial community in five adult volunteers. (a) Diversity indices and the (b) Firmicutes/Bacteroidetes ratio in each method.
Nutrients 14 03315 g003
Figure 4. Research I: Bland–Altman plots of the relative abundance of fecal bacteria at the phylum level obtained by each method from five adult volunteers. Comparisons between Methods A–B (left) and Methods A–C (right). The relative abundance of bacteria in each specimen was plotted. (a) Their maximum abundance in any of the specimens was ≥10%; (b) ≥1% and <10%; (c) <1%. Solid lines indicate the means of the differences between the two test values, dotted lines indicate the limits of agreement (the mean of the difference ± 1.96 × standard deviation), and the gray shaded area indicates the 95% confidence interval of the limits of agreement. For Methods A and B, stool samples were collected using commercial collection tubes. For Method C, urine and stool samples were applied to disposable diapers. For Methods B and C, the samples were stored at −80 °C for 2 months.
Nutrients 14 03315 g004
Figure 5. Research I: Bland–Altman plots of the relative abundance of fecal bacteria at the genus level obtained by each method from five adult volunteers. Comparisons between Methods A–B (left) and Methods A–C (right). The relative abundance of bacteria in each specimen was plotted. (a) Their maximum abundance in any of the specimens was ≥10%; (b) ≥1% and <10%; (c) ≥0.1% and <1%; (d) <0.1%. Solid lines indicate the means of the differences between the two test values, dotted lines indicate the limits of agreement (the mean of the difference ± 1.96 × standard deviation), and the gray shaded area indicates the 95% confidence interval of the limits of agreement. For Methods A and B, stool samples were collected using commercial collection tubes. For Method C, urine and stool samples were applied to disposable diapers. For Methods B and C, the samples were stored at −80 °C for 2 months.
Nutrients 14 03315 g005
Figure 6. Research I: Heatmap of the gut microbiota composition at the genus level in five adult volunteers. Heatmap of log-transformed values of the relative abundance at the genus level in each method of Research I, using Ward’s method for clustering.
Nutrients 14 03315 g006
Figure 7. Research II: Fecal bacterial composition at the phylum and genus levels in 76 toddlers. (a) Phylum and (b) genus levels. Bacteria detected at less than 1% of their relative abundance were grouped together as Others. These were sorted by age and mode of delivery. See Table S1 or Table S5 for the bacterial taxonomy name corresponding to each ID.
Nutrients 14 03315 g007
Figure 8. Box plots of the bacteria listed in Table 5 that showed significant different relative abundances between the two age groups (1.5 years and 3 years). The depicted bacteria are those whose abundance differences between Methods A–C were within the limits of agreement in all the specimens (See Table 5). Bold lines in the middle of the box are the medians, the top of the box is the 3rd quartile, the bottom of the box is the 1st quartile, the upper whiskers are the largest data less than or equal to “3rd quartile + 1.5 × (3rd quartile − 1st quartile)” and the lower whiskers are the smallest data equal to “1st quartile − 1.5 × (3rd quartile − 1st quartile)”. See Tables S1–S6 for the bacterial taxonomy name corresponding to each ID.
Nutrients 14 03315 g008
Table 1. Characteristics of the study participants in Research II.
TotalAge during Stool Collection
1.5 Years3 Years
n(%)n(%)
Sex
Male4126(47)15(71)
Female3529(53)6(29)
Mode of delivery
Spontaneous delivery3323(42)10(48)
Induced delivery1813(24)5(24)
Vacuum extraction54(7)1(5)
Planned Cesarean delivery1914(25)5(24)
/Emergent Cesarean delivery
Missing11(2)0(0)
Feeding method during the first month after birth
Breastfeeding only3627(49)9(43)
Mixed feeding3725(45)12(57)
Infant formula only22(4)0(0)
Missing11(2)0(0)
Starting date of feeding solid foods
4 months old11(2)0(0)
5 months old3826(47)12(57)
6 months old2922(40)7(33)
7 months old32(4)1(5)
8 months old11(2)0(0)
Missing43(5)1(5)
Table 2. Research I: Summary of bacteria detection and Bland–Altman plotting results (Methods A–B (a) and Methods A–C (b) at the phylum level.
(a)
Maximum Relative
Abundance
Bacteria ID Number of Specimens with the Bacteria Detection (/5)Number of Specimens with the Bacteria Abundance Out of the LOA
Method AMethod BSD CI
≥10%P15511
P25512
P35500
≥1%, <10%P45501
P54411
P62200
<1%P72123
P90100
P101000
(b)
Maximum Relative
Abundance
Bacteria ID Number of Specimens with the Bacteria Detection (/5)Number of Specimens with the Bacteria Abundance Out of the LOA
Method AMethod CSD CI
≥10%P15501
P25503
P35502
≥1%, <10%P45511
P62201
<1%P54111
P72200
P80100
P101000
See Table S1 for the bacterial taxonomy name corresponding to each ID. SD, LOA was defined as mean ± 1.96 × SD of the differences between two measurements. CI, LOA was defined as the lower or upper limit of 95% CI of the upper or lower limit, respectively, of SD. LOA, limit of agreement; SD, standard deviation; CI, confidence interval.
Table 3. Research I: Summary of bacteria detection and Bland–Altman plotting results (Methods A–B (a) and Methods A–C (b)) at the genus level.
(a)
Maximum
Relative
Abundance
Bacteria ID Number of Specimens with the Bacteria Detection (/5)Number of Specimens with the Bacteria Abundance Out of the LOA
Method AMethod BSD CI
≥10%G15522
G25500
G32200
G55500
G75500
G85501
≥1%, <10%G41101
G64401
G94411
G103411
G114411
G125522
G135511
G145500
G155501
G165500
G175500
G185500
G192211
G203400
G215500
G224500
G232200
G242200
G255500
G262300
G274400
G285400
G294400
G304300
G314400
G325500
G341200
G363400
G373400
≥0.1%, <1%G335501
G353301
G384422
G392311
G405512
G410111
G425500
G433211
G445511
G452200
G461111
G474400
G481100
G492200
G504400
G514400
G521200
G545501
G555300
G571100
G584400
G592000
<0.1%G531011
G562222
G604401
G611100
G620100
G634400
G641100
G651101
G663100
G672300
G682111
G690100
G702211
G710211
G721111
G730111
G741200
G752200
G763301
G770100
G781000
G800100
G812000
G830100
G841100
G850100
G862000
G870200
G880100
G892000
G911000
G921000
G930100
(b)
Maximum Relative
Abundance
Bacteria ID Number of Specimens with the Bacteria Detection (/5)Number of Specimens with the Bacteria Abundance Out of the LOA
Method AMethod CSD CI
≥10%G15524
G25501
G32200
G41200
G55500
G64400
G75500
G85500
≥1%, <10%G94411
G103300
G114411
G125500
G135522
G145522
G155511
G165511
G175522
G185500
G203300
G215500
G224500
G232200
G242211
G255500
G262200
G274400
G285400
G294300
G304200
G314300
G325500
G335500
G341100
G353400
G363400
≥0.1%, <1%G192011
G373300
G384422
G392200
G405501
G410211
G425511
G433200
G445422
G452211
G461211
G474411
G481100
G492100
G504300
G514300
G521200
G531100
G545500
G555400
G562300
G571200
G584300
G592300
<0.1%G604411
G611211
G620111
G634433
G641111
G651011
G663411
G672301
G682000
G690111
G702200
G710111
G721111
G741300
G752100
G763300
G770100
G781200
G790100
G800100
G812100
G820100
G841100
G850100
G862000
G892000
G900100
G911000
G921000
See Table S5 for the bacterial taxonomy name corresponding to each ID. SD, LOA was defined as mean ± 1.96 × SD of the differences between two measurements. CI, LOA was defined as the lower or upper limit of 95% CI of the upper or lower limit, respectively, of SD. LOA, limit of agreement; SD, standard deviation; CI, confidence interval.
Table 4. Diversity indices of the adult and toddler gut microbiota.
Adults
(Research I, Method C)
1.5 Years Group
(Research II)
3 Years Group
(Research II)
Chao1131.2 ± 36.564.9 ± 12.8 **83.9 ± 16.4 **
Shannon5.0 ± 0.54.4 ± 0.5 *4.7 ± 0.5
Simpson0.94 ± 0.020.91 ± 0.040.92 ± 0.03
Observed operational taxonomic units129.4 ± 36.464.8 ± 12.8 **83.8 ± 16.4 **
Faith’s phylogenetic diversity10.1 ± 2.65.9 ± 1.0 **7.0 ± 1.2 **
* p < 0.001, ** p < 0.0001 when compared to adults by Dunnett’s test.
Table 5. Between-age comparisons of potentially beneficial or detrimental bacteria detected in Research II.
FunctionalityReferencesCategoryID p-Value Coefficient of Variation §
1.5 Years Group3 Years Group
Beneficial[31]FamilyF50.0181.0110.697
[7,31]GenusG50.0001.0510.529
[7,32] G100.1941.2350.862
[31,32] G120.0771.1590.847
[7] G230.3313.1201.844
[31] G250.0711.2671.234
[7] G560.0191.9803.000
[32] G570.5513.8394.583
[7,8]SpeciesS290.3313.1201.844
[32] S400.0792.2661.384
[7] S430.9170.7740.701
[7] S1270.2865.204-
Both[7,8,33]SpeciesS730.8961.9932.452
Detrimental[8]ClassC120.0031.2091.242
[31]FamilyF70.5151.3521.333
[8] F260.0031.2741.157
[31]GenusG60.2601.8142.023
[7,32] G590.0152.1781.869
[7]SpeciesS1470.4767.4164.583
[7] S1670.1397.4164.583
Bacteria presented in this table are those of which all the Bland–Altman plots were within the lower or upper limit of the 95% CI of the upper or lower limit, respectively, of SD as the LOA in Research I. See footnotes of Table 2 or Table 3 for definition of SD and CI. LOA, limit of agreement; SD, standard deviation; CI, confidence interval. -, bacteria not detected. See Tables S1–S6 for the bacterial taxonomy name corresponding to each ID. Mann–Whitney U test for a between-age comparison of the bacterial relative abundance. § Calculated as standard deviation/mean.
Publisher’s Note: MDPI stays neutral with regard to jurisdictional claims in published maps and institutional affiliations.

