
Comparative Effects of Co-Ingesting Whey Protein and Glucose Alone and Combined on Blood Glucose, Plasma Insulin and Glucagon Concentrations in Younger and Older Men

 , ,
, ,  ,
, 
Abstract
:1. Introduction
2. Materials and Methods
2.1. Subjects
2.2. Protocol
2.3. Measurements
2.3.1. Blood Glucose and Plasma Insulin and Glucagon Concentrations
2.3.2. Gastric Emptying
2.3.3. Energy Intake
2.3.4. Perceptions of Appetite
2.4. Data and Statistical Analysis
3. Results
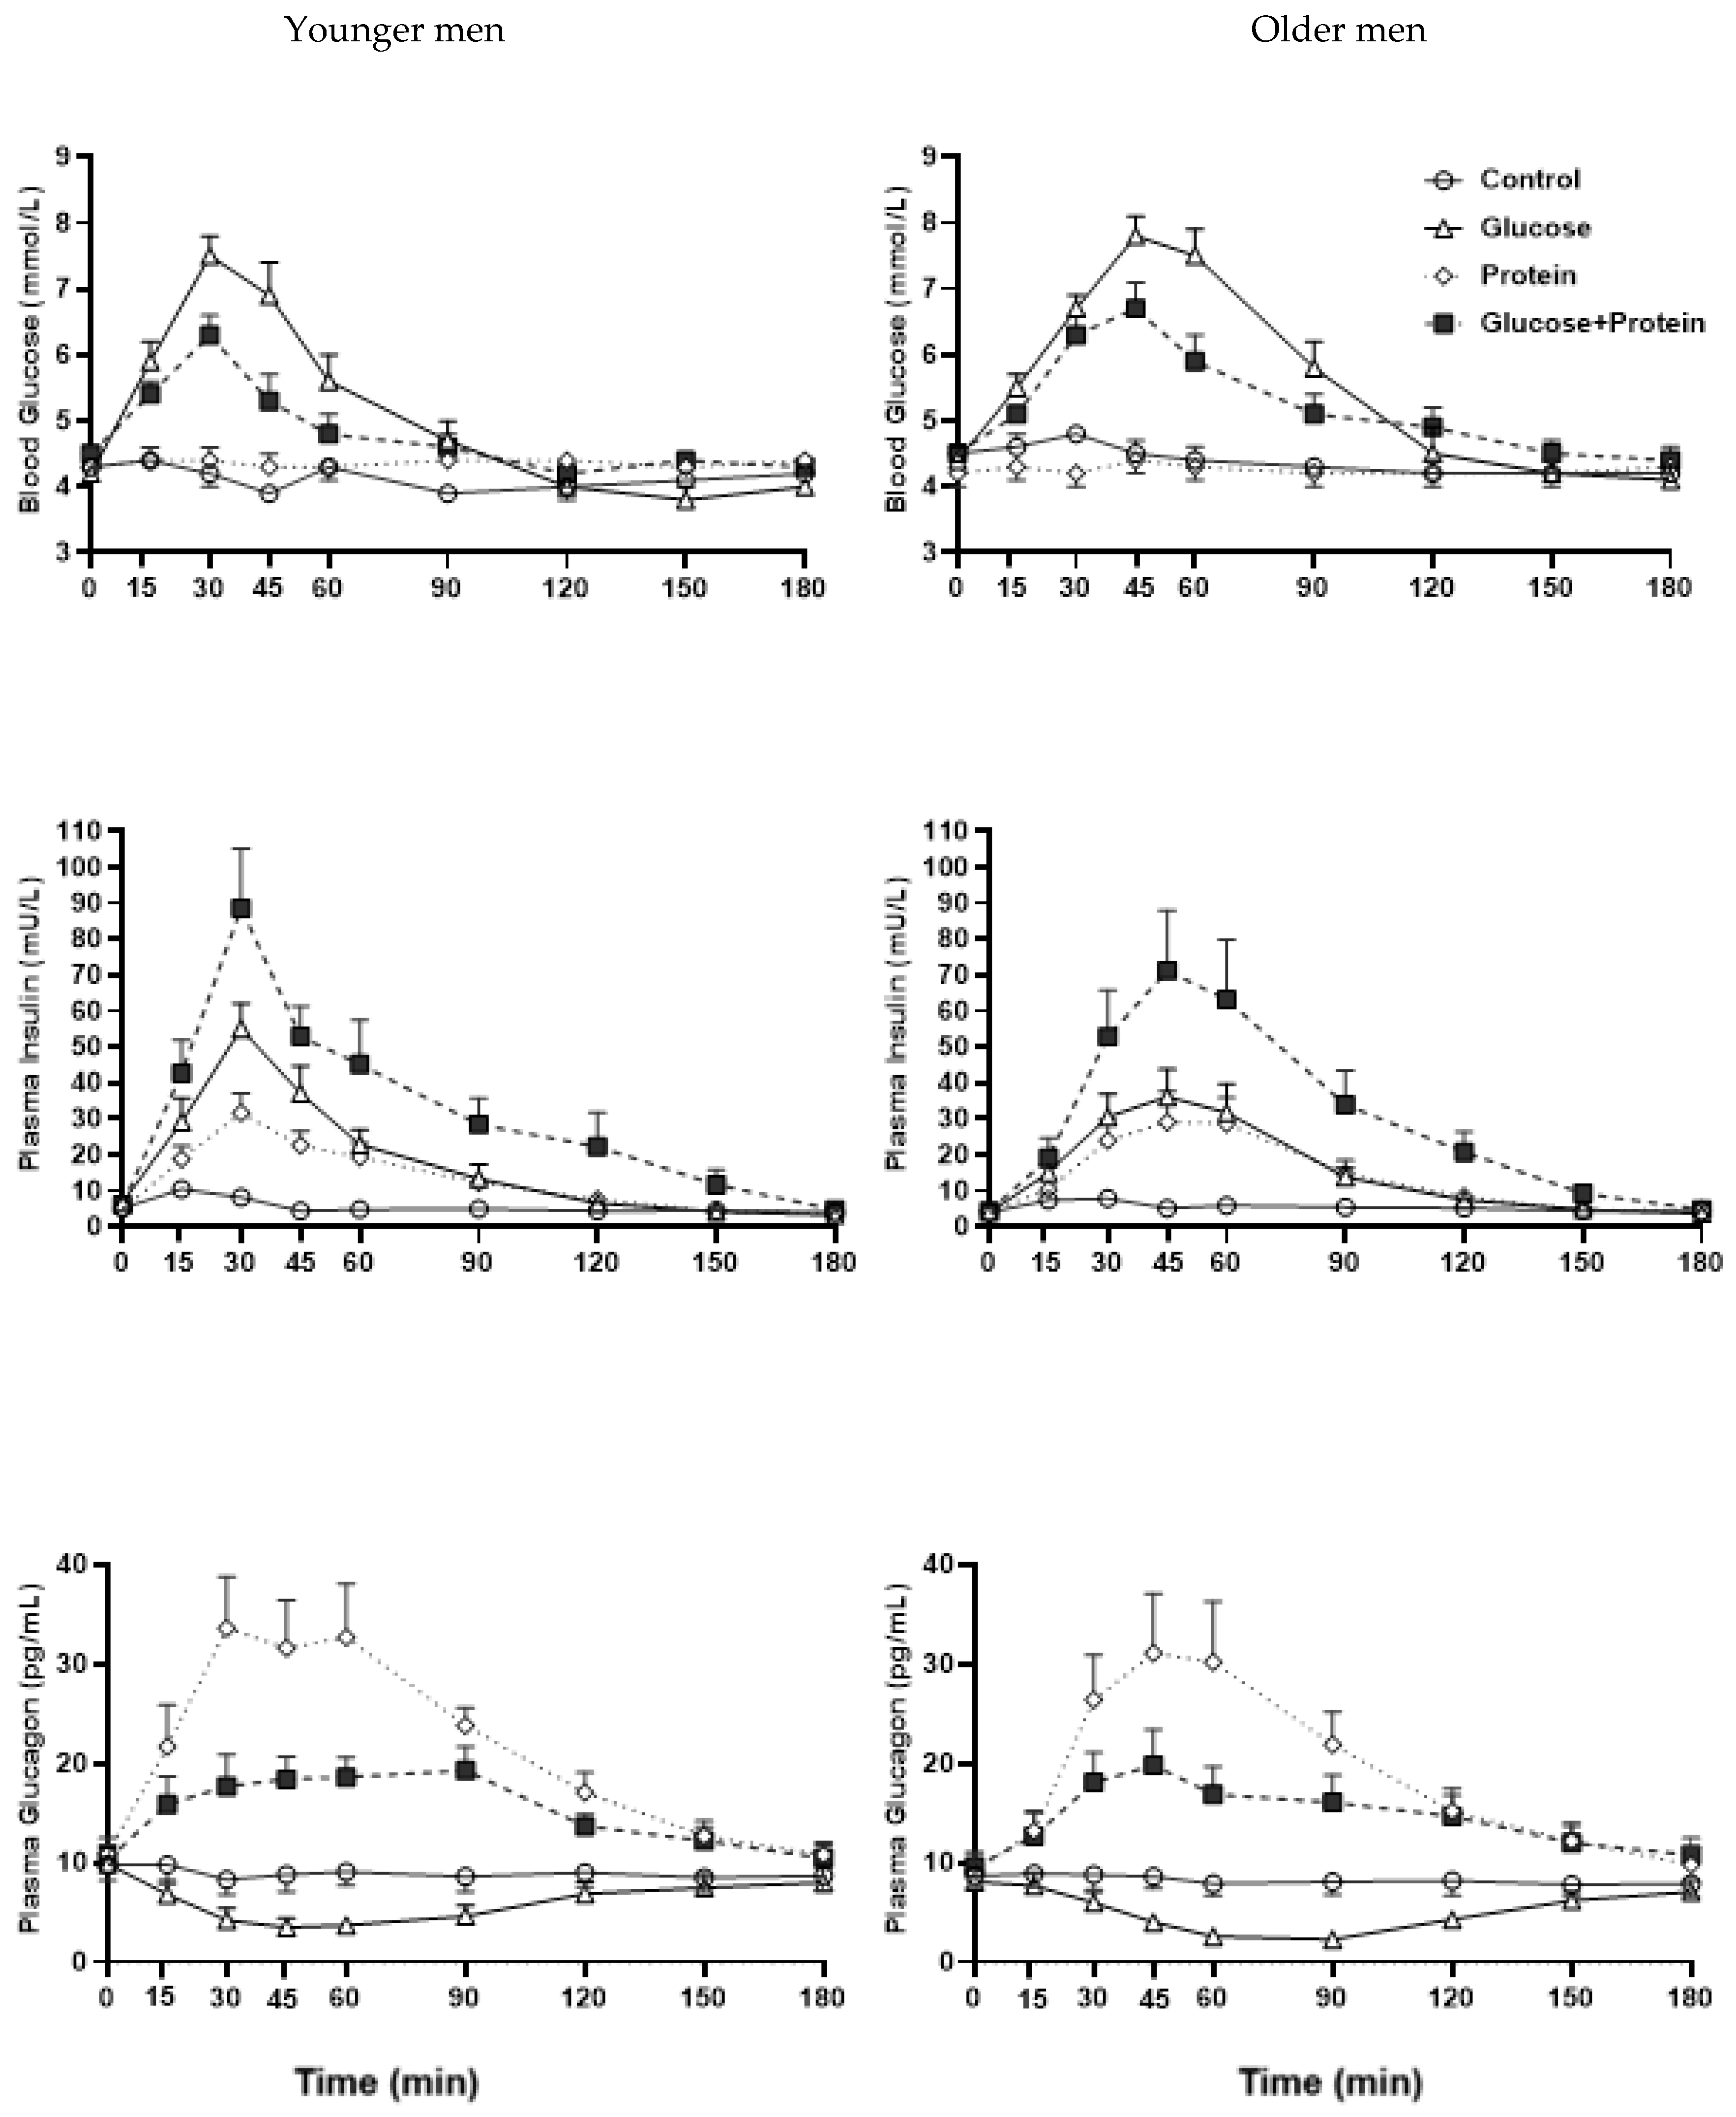
3.1. Blood Glucose
3.1.1. Interaction Effects
3.1.2. Drink-Condition Effects
3.1.3. Age Effects
3.2. Plasma Insulin
3.2.1. Interaction Effects
3.2.2. Drink-Condition Effects
3.2.3. Age Effects
3.3. Plasma Glucagon
3.3.1. Interaction Effects
3.3.2. Drink-Condition Effects
3.3.3. Age Effects
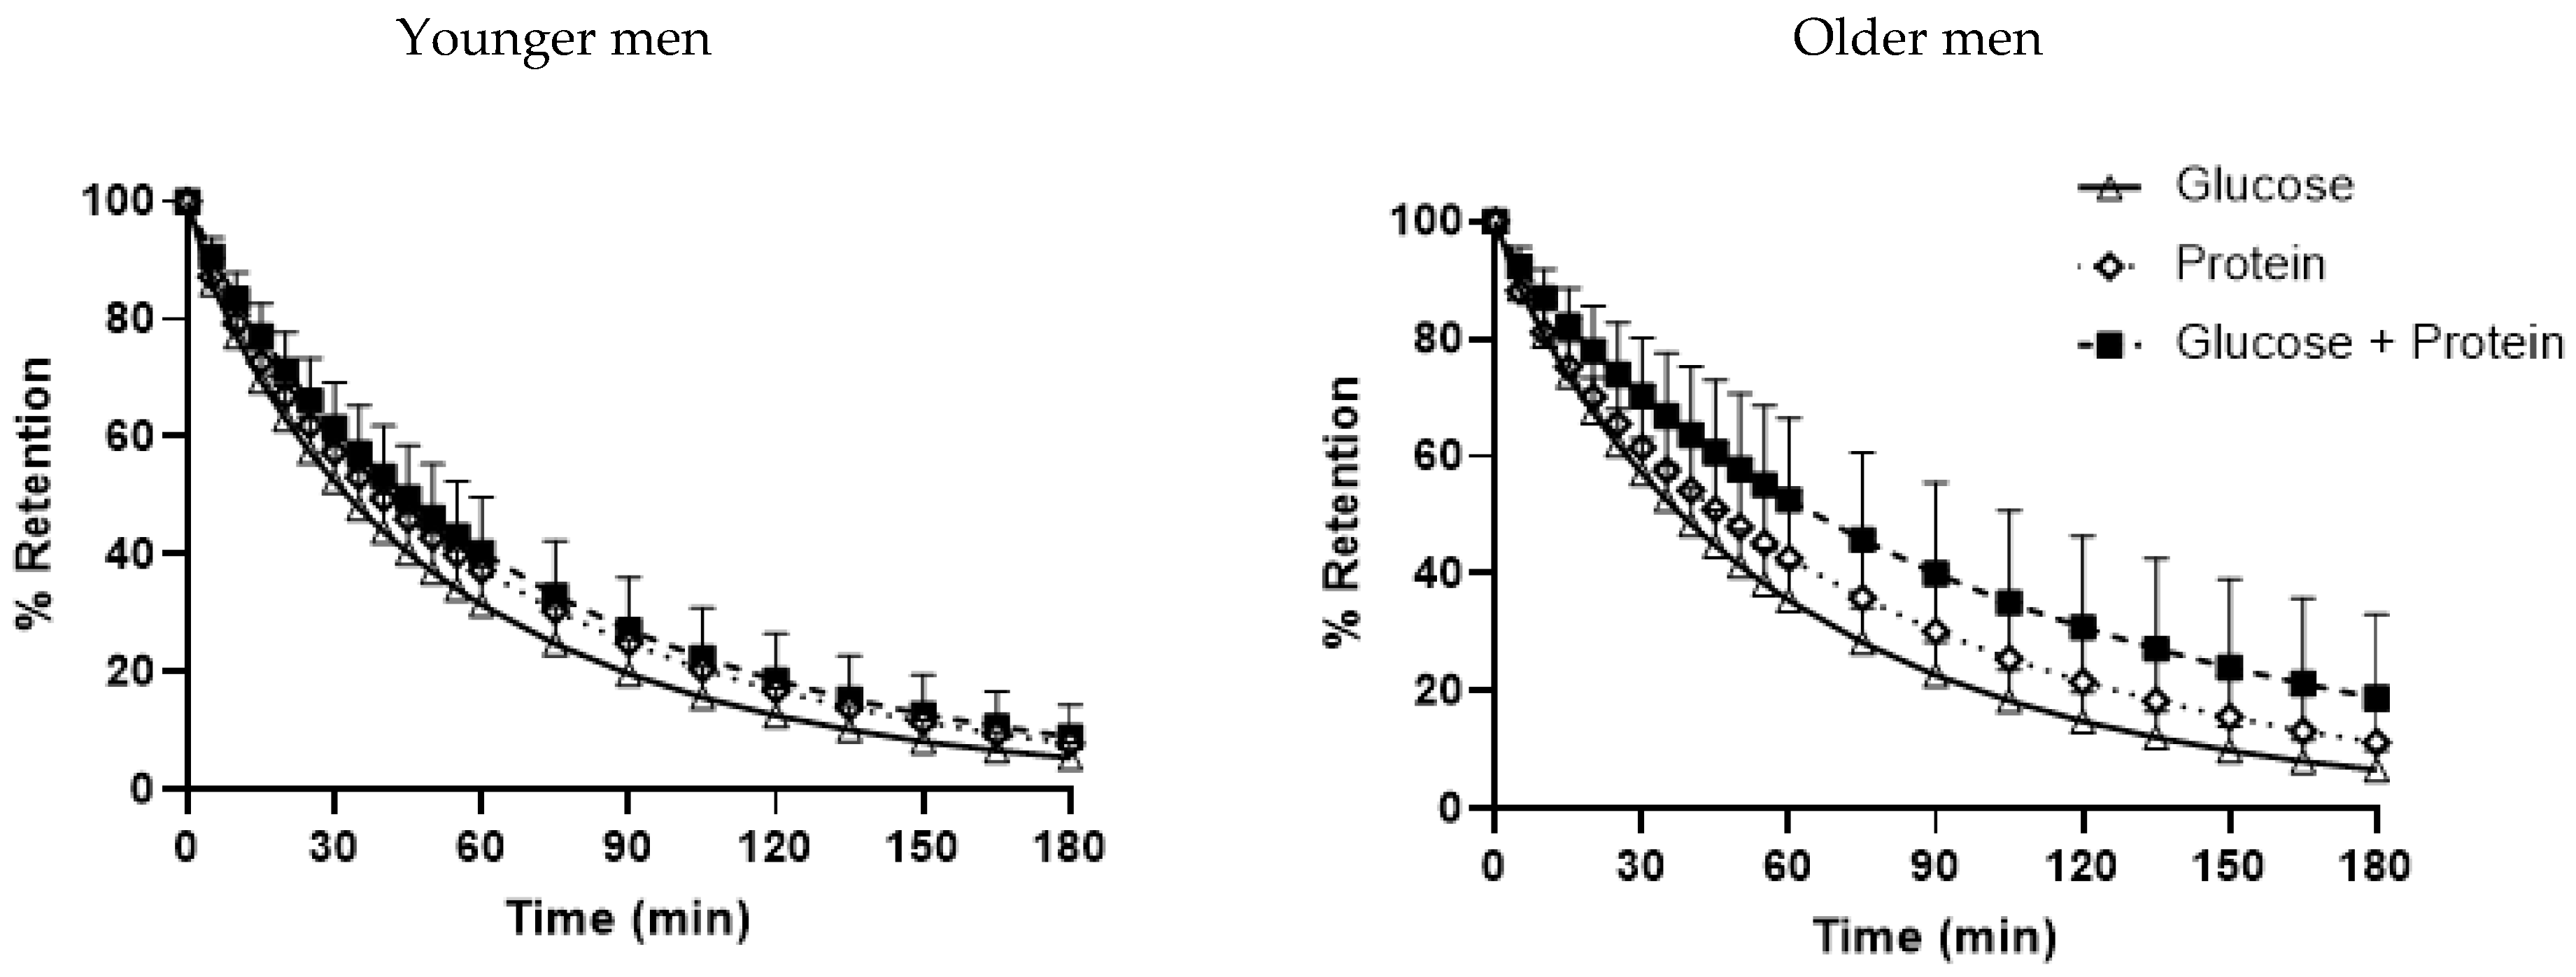
3.4. Gastric Emptying
3.5. Energy Intake
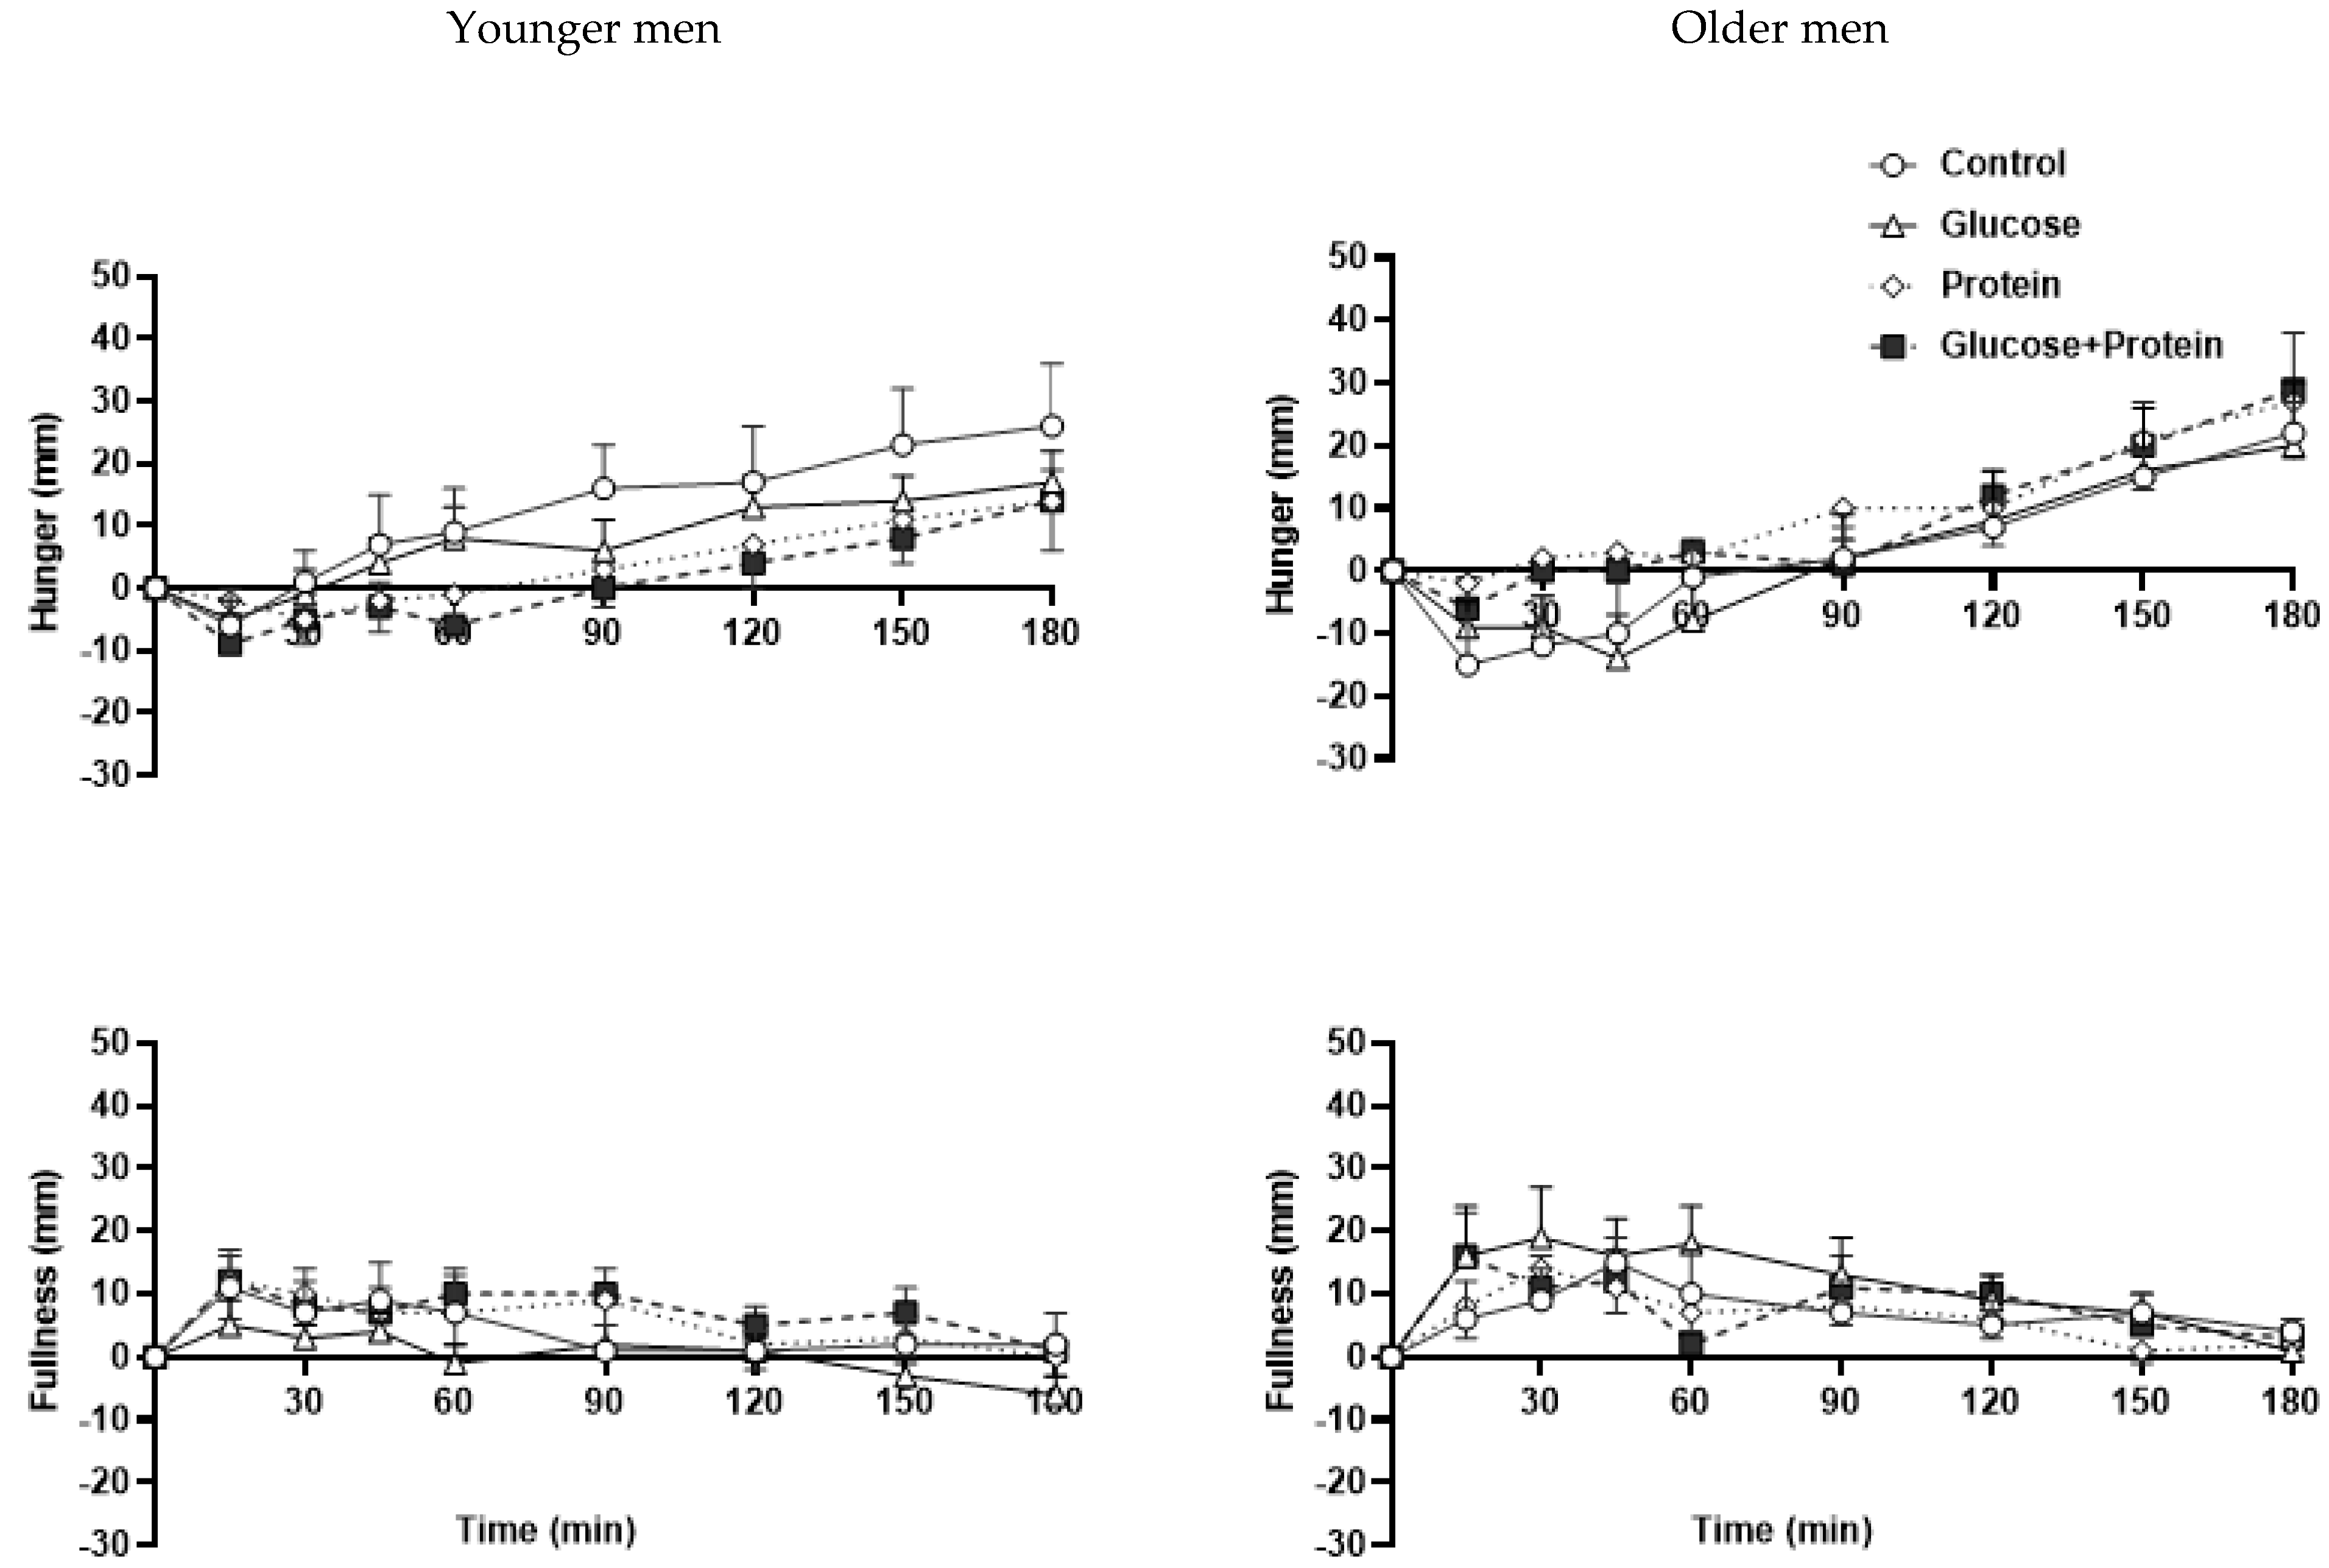
3.6. Perceptions of Appetite
4. Discussion
5. Conclusions
Author Contributions
Funding
Institutional Review Board Statement
Informed Consent Statement
Acknowledgments
Conflicts of Interest
References
- Khan, M.A.B.; Hashim, M.J.; King, J.K.; Govender, R.D.; Mustafa, H.; Al Kaabi, J. Epidemiology of Type 2 Diabetes—Global Burden of Disease and Forecasted Trends. J. Epidemiol. Glob. Health 2020, 10, 107–111. [Google Scholar] [CrossRef] [PubMed] [Green Version]
- Lin, X.; Xu, Y.; Pan, X.; Xu, J.; Ding, Y.; Sun, X.; Song, X.; Ren, Y.; Shan, P.-F. Global, regional, and national burden and trend of diabetes in 195 countries and territories: An analysis from 1990 to 2025. Sci. Rep. 2020, 10, 14790. [Google Scholar] [CrossRef] [PubMed]
- Dunstan, D.W.; Zimmet, P.Z.; Welborn, T.A.; de Courten, M.P.; Cameron, A.J.; Sicree, R.A.; Dwyer, T.; Colagiuri, S.; Jolley, D.; Knuiman, M.; et al. The rising prevalence of diabetes and impaired glucose tolerance: The Australian diabetes, obesity and lifestyle study. Diabetes Care 2002, 25, 829–834. [Google Scholar] [CrossRef] [PubMed] [Green Version]
- Australian Institute of Health and Welfare. Diabetes Prevalence in Australia: Detailed Estimates for 2007–08; Australian Institute of Health and Welfare: Canberra, Australia, 2011; Diabetes Series No. 17, Cat. No. CVD 56.
- Monnier, L.; Colette, C. Contributions of fasting and postprandial glucose to hemoglobin A1c. Endocr. Pract. Off. J. Am. Coll. Endocrinol. Am. Assoc. Clin. Endocrinol. 2006, 12 (Suppl. S1), 42–46. [Google Scholar] [CrossRef] [PubMed]
- Stevenson, E.J.; Allerton, D.M. The role of whey protein in postprandial glycaemic control. Proc. Nutr. Soc. 2018, 77, 42–51. [Google Scholar] [CrossRef] [Green Version]
- Kirkman, M.S.; Briscoe, V.J.; Clark, N.; Florez, H.; Haas, L.B.; Halter, J.B.; Huang, E.S.; Korytkowski, M.T.; Munshi, M.N.; Odegard, P.S.; et al. Diabetes in Older Adults. Diabetes Care 2012, 35, 2650–2664. [Google Scholar] [CrossRef] [Green Version]
- Leung, E.; Wongrakpanich, S.; Munshi, M.N. Diabetes Management in the Elderly. Diabetes Spectr. 2018, 31, 245–253. [Google Scholar] [CrossRef] [Green Version]
- Node, K.; Inoue, T. Postprandial hyperglycemia as an etiological factor in vascular failure. Cardiovasc. Diabetol. 2009, 8, 23. [Google Scholar] [CrossRef] [PubMed] [Green Version]
- Blaak, E.E.; Antoine, J.M.; Benton, D.; Björck, I.; Bozzetto, L.; Brouns, F.; Diamant, M.; Dye, L.; Hulshof, T.; Holst, J.J.; et al. Impact of postprandial glycaemia on health and prevention of disease. Obes. Rev. 2012, 13, 923–984. [Google Scholar] [CrossRef]
- Giezenaar, C.; Hutchison, A.T.; Luscombe-Marsh, N.D.; Chapman, I.; Horowitz, M.; Soenen, S. Effect of Age on Blood Glucose and Plasma Insulin, Glucagon, Ghrelin, CCK, GIP, and GLP-1 Responses to Whey Protein Ingestion. Nutrients 2018, 10, 2. [Google Scholar] [CrossRef] [Green Version]
- Gannon, M.C.; Nuttall, F.Q. Amino acid ingestion and glucose metabolism—A review. IUBMB Life 2010, 62, 660–668. [Google Scholar] [CrossRef] [PubMed]
- Pallotta, J.A.; Kennedy, P.J. Response of plasma insulin and growth hormone to carbohydrate and protein feeding. Metabolism 1968, 17, 901–908. [Google Scholar] [CrossRef]
- Gannon, M.C.; Nuttall, F.Q.; Lane, J.T.; Burmeister, L.A. Metabolic response to cottage cheese or egg white protein, with or without glucose, in type II diabetic subjects. Metabolism 1992, 41, 1137–1145. [Google Scholar] [CrossRef]
- Gannon, M.C.; Nuttall, F.Q.; Grant, C.T.; Ercan-Fang, S.; Ercan-Fang, N. Stimulation of insulin secretion by fructose ingested with protein in people with untreated type 2 diabetes. Diabetes Care 1998, 21, 16–22. [Google Scholar] [CrossRef] [PubMed]
- Nuttall, F.Q.; Gannon, M.C.; Wald, J.L.; Ahmed, M. Plasma glucose and insulin profiles in normal subjects ingesting diets of varying carbohydrate, fat, and protein content. J. Am. Coll. Nutr. 1985, 4, 437–450. [Google Scholar] [CrossRef] [PubMed]
- Gunnerud, U.; Östman, E.; Björck, I. Effects of whey proteins on glycaemia and insulinaemia to an oral glucose load in healthy adults; a dose–response study. Eur. J. Clin. Nutr. 2013, 67, 749–753. [Google Scholar] [CrossRef]
- Ma, J.; Stevens, J.E.; Cukier, K.; Maddox, A.F.; Wishart, J.M.; Jones, K.L.; Clifton, P.M.; Horowitz, M.; Rayner, C.K. Effects of a protein preload on gastric emptying, glycemia, and gut hormones after a carbohydrate meal in diet-controlled type 2 diabetes. Diabetes Care 2009, 32, 1600–1602. [Google Scholar] [CrossRef] [PubMed] [Green Version]
- Nilsson, M.; Stenberg, M.; Frid, A.H.; Holst, J.J.; Björck, I.M. Glycemia and insulinemia in healthy subjects after lactose-equivalent meals of milk and other food proteins: The role of plasma amino acids and incretins. Am. J. Clin. Nutr. 2004, 80, 1246–1253. [Google Scholar] [CrossRef]
- Kung, B.; Anderson, G.H.; Paré, S.; Tucker, A.J.; Vien, S.; Wright, A.J.; Goff, H.D. Effect of milk protein intake and casein-to-whey ratio in breakfast meals on postprandial glucose, satiety ratings, and subsequent meal intake. J. Dairy Sci. 2018, 101, 8688–8701. [Google Scholar] [CrossRef]
- Floyd, J.C., Jr.; Fajans, S.S.; Conn, J.W.; Knopf, R.F.; Rull, J. Insulin secretion in response to protein ingestion. J. Clin. Investig. 1966, 45, 1479–1486. [Google Scholar] [CrossRef] [PubMed]
- Adams, R.L.; Broughton, K.S. Insulinotropic Effects of Whey: Mechanisms of Action, Recent Clinical Trials, and Clinical Applications. Ann. Nutr. Metab. 2016, 69, 56–63. [Google Scholar] [CrossRef]
- McGregor, R.A.; Poppitt, S.D. Milk protein for improved metabolic health: A review of the evidence. Nutr. Metab. 2013, 10, 46. [Google Scholar] [CrossRef] [Green Version]
- Pal, S.; Ellis, V.; Dhaliwal, S. Effects of whey protein isolate on body composition, lipids, insulin and glucose in overweight and obese individuals. Br. J. Nutr. 2010, 104, 716–723. [Google Scholar] [CrossRef] [PubMed]
- Akhavan, T.; Luhovyy, B.L.; Brown, P.H.; Cho, C.E.; Anderson, G.H. Effect of premeal consumption of whey protein and its hydrolysate on food intake and postmeal glycemia and insulin responses in young adults. Am. J. Clin. Nutr. 2010, 91, 966–975. [Google Scholar] [CrossRef]
- Chapman, I.; Oberoi, A.; Giezenaar, C.; Soenen, S. Rational Use of Protein Supplements in the elderly—Relevance of gastrointestinal mechanisms. Nutrients 2021, 13, 1227. [Google Scholar] [CrossRef]
- Phillips, S.M. Current Concepts and Unresolved Questions in Dietary Protein Requirements and Supplements in Adults. Front. Nutr. 2017, 4, 13. [Google Scholar] [CrossRef] [Green Version]
- Bauer, J.; Biolo, G.; Cederholm, T.; Cesari, M.; Cruz-Jentoft, A.J.; Morley, J.E.; Phillips, S.; Sieber, C.; Stehle, P.; Teta, D.; et al. Evidence-based recommendations for optimal dietary protein intake in older people: A position paper from the PROT-AGE Study Group. J. Am. Med. Dir. Assoc. 2013, 14, 542–559. [Google Scholar] [CrossRef]
- Hermans, M.P.; Pepersack, T.M.; Godeaux, L.H.; Beyer, I.; Turc, A.P. Prevalence and Determinants of Impaired Glucose Metabolism in Frail Elderly Patients: The Belgian Elderly Diabetes Survey (BEDS). J. Gerontol. Ser. A 2005, 60, 241–247. [Google Scholar] [CrossRef] [PubMed] [Green Version]
- Chia, C.W.; Egan, J.M.; Ferrucci, L. Age-Related Changes in Glucose Metabolism, Hyperglycemia, and Cardiovascular Risk. Circ. Res. 2018, 123, 886–904. [Google Scholar] [CrossRef]
- Kalyani, R.R.; Egan, J.M. Diabetes and altered glucose metabolism with aging. Endocrinol. Metab. Clin. N. Am. 2013, 42, 333–347. [Google Scholar] [CrossRef] [PubMed] [Green Version]
- Giezenaar, C.; Lange, K.; Hausken, T.; Jones, K.L.; Horowitz, M.; Chapman, I.; Soenen, S. Effects of Age on Acute Appetite-Related Responses to Whey-Protein Drinks, Including Energy Intake, Gastric Emptying, Blood Glucose, and Plasma Gut Hormone Concentrations-A Randomized Controlled Trial. Nutrients 2020, 12, 1008. [Google Scholar] [CrossRef] [Green Version]
- Giezenaar, C.; Trahair, L.G.; Rigda, R.; Hutchison, A.T.; Feinle-Bisset, C.; Luscombe-Marsh, N.D.; Hausken, T.; Jones, K.L.; Horowitz, M.; Chapman, I.; et al. Lesser suppression of energy intake by orally ingested whey protein in healthy older men compared with young controls. Am. J. Physiology. Regul. Integr. Comp. Physiol. 2015, 309, R845–R854. [Google Scholar] [CrossRef]
- Soenen, S.; Giezenaar, C.; Hutchison, A.T.; Horowitz, M.; Chapman, I.; Luscombe-Marsh, N.D. Effects of intraduodenal protein on appetite, energy intake, and antropyloroduodenal motility in healthy older compared with young men in a randomized trial. Am. J. Clin. Nutr. 2014, 100, 1108–1115. [Google Scholar] [CrossRef] [PubMed] [Green Version]
- Hutchison, A.T.; Piscitelli, D.; Horowitz, M.; Jones, K.L.; Clifton, P.M.; Standfield, S.; Hausken, T.; Feinle-Bisset, C.; Luscombe-Marsh, N.D. Acute load-dependent effects of oral whey protein on gastric emptying, gut hormone release, glycemia, appetite, and energy intake in healthy men. Am. J. Clin. Nutr. 2015, 102, 1574–1584. [Google Scholar] [CrossRef] [PubMed]
- Giezenaar, C.; van der Burgh, Y.; Lange, K.; Hatzinikolas, S.; Hausken, T.; Jones, K.L.; Horowitz, M.; Chapman, I.; Soenen, S. Effects of Substitution, and Adding of Carbohydrate and Fat to Whey-Protein on Energy Intake, Appetite, Gastric Emptying, Glucose, Insulin, Ghrelin, CCK and GLP-1 in Healthy Older Men-A Randomized Controlled Trial. Nutrients 2018, 10, 113. [Google Scholar] [CrossRef] [PubMed] [Green Version]
- Lindström, T.; Hedman, C.A.; Arnqvist, H.J. Use of a novel double-antibody technique to describe the pharmacokinetics of rapid-acting insulin analogs. Diabetes Care 2002, 25, 1049–1054. [Google Scholar] [CrossRef] [PubMed] [Green Version]
- Braden, B.; Adams, S.; Duan, L.P.; Orth, K.H.; Maul, F.D.; Lembcke, B.; Hör, G.; Caspary, W.F. The [13C] acetate breath test accurately reflects gastric emptying of liquids in both liquid and semisolid test meals. Gastroenterology 1995, 108, 1048–1055. [Google Scholar] [CrossRef]
- Bjorkman, D.J.; Moore, J.G.; Klein, P.D.; Graham, D.Y. 13C-bicarbonate breath test as a measure of gastric emptying. Am. J. Gastroenterol. 1991, 86, 821–823. [Google Scholar] [CrossRef]
- Sanaka, M.; Yamamoto, T.; Ishii, T.; Kuyama, Y. The Wagner-Nelson method can generate an accurate gastric emptying flow curve from 13CO2 data obtained by a 13C-labeled substrate breath test. Digestion 2004, 69, 71–78. [Google Scholar] [CrossRef]
- Sanaka, M.; Nakada, K.; Nosaka, C.; Kuyama, Y. The Wagner-Nelson method makes the [13C]-breath test comparable to radioscintigraphy in measuring gastric emptying of a solid/liquid mixed meal in humans. Clin. Exp. Pharmacol. Physiol. 2007, 34, 641–644. [Google Scholar] [CrossRef] [PubMed]
- Trahair, L.G.; Nauck, M.A.; Wu, T.; Stevens, J.E.; Buttfield, M.D.; Hatzinikolas, S.; Pham, H.; Meier, J.J.; Rayner, C.K.; Horowitz, M.; et al. Measurement of Gastric Emptying Using a 13C-octanoic Acid Breath Test with Wagner-Nelson Analysis and Scintigraphy in Type 2 Diabetes. Exp. Clin. Endocrinol. Diabetes Off. J. Ger. Soc. Endocrinol. Ger. Diabetes Assoc. 2022, 130, 423–494. [Google Scholar] [CrossRef]
- Giezenaar, C.; Trahair, L.G.; Luscombe-Marsh, N.D.; Hausken, T.; Standfield, S.; Jones, K.L.; Lange, K.; Horowitz, M.; Chapman, I.; Soenen, S. Effects of randomized whey-protein loads on energy intake, appetite, gastric emptying, and plasma gut-hormone concentrations in older men and women. Am. J. Clin. Nutr. 2017, 106, 865–877. [Google Scholar] [CrossRef] [PubMed] [Green Version]
- Pham, H.; Marathe, C.S.; Phillips, L.K.; Trahair, L.G.; Hatzinikolas, S.; Huynh, L.; Wu, T.; Nauck, M.A.; Rayner, C.K.; Horowitz, M.; et al. Longitudinal Changes in Fasting and Glucose-Stimulated GLP-1 and GIP in Healthy Older Subjects. J. Clin. Endocrinol. Metab. 2019, 104, 6201–6206. [Google Scholar] [CrossRef] [PubMed]
- Meneilly, G.S.; Ryan, A.S.; Minaker, K.L.; Elahi, D. The Effect of Age and Glycemic Level on the Response of theβ-Cell to Glucose-Dependent Insulinotropic Polypeptide and Peripheral Tissue Sensitivity to Endogenously Released Insulin. J. Clin. Endocrinol. Metab. 1998, 83, 2925–2932. [Google Scholar] [CrossRef] [PubMed] [Green Version]
- Mann, E.; Sunni, M.; Bellin, M.D. Secretion of Insulin in Response to Diet and Hormones. Pancreapedia Exocrine Pancreas Knowl. Base 2016, 1. [Google Scholar] [CrossRef]
- Weber, P.; Kolácný, I. Glucose tolerance in the elderly—Changes in insulin, C-peptide and glucagon secretion. Wien. Med. Wochenschr. 1992, 142, 73–78. [Google Scholar]
- Stevic, R.; Zivkovic, T.B.; Erceg, P.; Milosevic, D.; Despotovic, N.; Davidovic, M. Oral glucose tolerance test in the assessment of glucose-tolerance in the elderly people. Age Ageing 2007, 36, 459–462. [Google Scholar] [CrossRef] [Green Version]
- Gorissen, S.H.M.; Crombag, J.J.R.; Senden, J.M.G.; Waterval, W.A.H.; Bierau, J.; Verdijk, L.B.; van Loon, L.J.C. Protein content and amino acid composition of commercially available plant-based protein isolates. Amino Acids 2018, 50, 1685–1695. [Google Scholar] [CrossRef] [Green Version]
- Watson, L.E.; Phillips, L.K.; Wu, T.; Bound, M.J.; Checklin, H.L.; Grivell, J.; Jones, K.L.; Clifton, P.M.; Horowitz, M.; Rayner, C.K. A whey/guar “preload” improves postprandial glycaemia and glycated haemoglobin levels in type 2 diabetes: A 12-week, single-blind, randomized, placebo-controlled trial. Diabetes Obes. Metab. 2019, 21, 930–938. [Google Scholar] [CrossRef]
- Sousa, G.T.D.; Lira, F.S.; Rosa, J.C.; de Oliveira, E.P.; Oyama, L.M.; Santos, R.V.; Pimentel, G.D. Dietary whey protein lessens several risk factors for metabolic diseases: A review. Lipids Health Dis. 2012, 11, 67. [Google Scholar] [CrossRef] [Green Version]
- Pennings, B.; Groen, B.; de Lange, A.; Gijsen, A.P.; Zorenc, A.H.; Senden, J.M.; van Loon, L.J. Amino acid absorption and subsequent muscle protein accretion following graded intakes of whey protein in elderly men. Am. J. Physiol. Endocrinol. Metab. 2012, 302, E992–E999. [Google Scholar] [CrossRef] [Green Version]
- Soenen, S.; Chapman, I.M. Body weight, anorexia, and undernutrition in older people. J. Am. Med. Dir. Assoc. 2013, 14, 642–648. [Google Scholar] [CrossRef] [PubMed]
- MacIntosh, C.G.; Horowitz, M.; Verhagen, M.A.; Smout, A.J.; Wishart, J.; Morris, H.; Goble, E.; Morley, J.E.; Chapman, I.M. Effect of small intestinal nutrient infusion on appetite, gastrointestinal hormone release, and gastric myoelectrical activity in young and older men. Am. J. Gastroenterol. 2001, 96, 997–1007. [Google Scholar] [CrossRef]
- Giezenaar, C.; Luscombe-Marsh, N.D.; Hutchison, A.T.; Standfield, S.; Feinle-Bisset, C.; Horowitz, M.; Chapman, I.; Soenen, S. Dose-Dependent Effects of Randomized Intraduodenal Whey-Protein Loads on Glucose, Gut Hormone, and Amino Acid Concentrations in Healthy Older and Younger Men. Nutrients 2018, 10, 78. [Google Scholar] [CrossRef] [PubMed] [Green Version]


| Younger Men | Older Men | p Value | |||||||||
|---|---|---|---|---|---|---|---|---|---|---|---|
| C | P | G | GP | C | P | G | GP | Age | Drink Condition | Interaction | |
| Blood glucose (mmol/L) | |||||||||||
| Fasted | 4.3 ± 0.1 | 4.3 ± 0.2 | 4.2 ± 0.2 | 4.5 ± 0.1 | 4.5 ± 0.1 | 4.2 ± 0.2 | 4.4 ± 0.2 | 4.5 ± 0.1 | 0.68 | 0.24 | 0.23 |
| Peak | 4.7 ± 0.1 | 4.8 ± 0.1 | 7.8 ± 0.3 | 6.3 ± 0.3 | 4.9 ± 0.1 | 4.7 ± 0.1 | 8.1 ± 0.3 | 6.9 ± 0.3 | 0.27 | <0.001 | 0.54 |
| Time to peak (min) | 50 ± 13 | 68 ± 17 | 34 ± 3 1 | 30 ± 3 | 26 ± 13 | 75 ± 17 | 51 ± 3 1 | 36 ± 3 | 0.007 | <0.001 | 0.031 |
| Return to baseline | 88 ± 26 | 41 ± 13 | 106 ± 15 | 91 ± 18 | 60 ± 22 | 125 ± 23 | 132 ± 15 | 153 ± 18 | 0.030 | 0.83 | 0.23 |
| Net iAUC0–60min | −0.1 ± 0.1 | 0.0 ± 0.1 | 2.1 ± 0.2 | 0.9 ± 0.2 | 0.1 ± 0.1 | 0.1 ± 0.1 | 2.1 ± 0.2 | 1.3 ± 0.2 | 0.29 | <0.001 | 0.48 |
| Net iAUC0–180min | −0.1 ± 0.1 | 0.0 ± 0.1 | 0.7 ± 0.2 | 0.3 ± 0.1 | −0.1 ± 0.1 | 0.1 ± 0.1 | 1.1 ± 0.2 | 0.7 ± 0.2 | 0.08 | <0.001 | 0.27 |
| Plasma insulin (mU/L) | |||||||||||
| Fasted | 5.3 ± 1.0 | 4.8 ± 0.8 | 6.9 ± 1.1 | 6.2 ± 1.0 | 4.1 ± 1.0 | 4.5 ± 0.8 | 4.1 ± 1.1 | 4.5 ± 1.0 | 0.22 | 0.41 | 0.13 |
| Peak | 11.7 ± 1.9 | 33.2 ± 6.9 2 | 55.9 ± 7.3 2 | 93.3 ± 16.8 | 9.7 ± 1.9 | 31.7 ± 6.9 | 36.5 ± 7.3 | 72.7 ± 16.9 | 0.34 | <0.001 | 0.006 |
| Time to peak (min) | 35 ± 13 | 32 ± 3 3 | 33 ± 2 3 | 36 ± 3 | 32 ± 4 | 48 ± 3 3 | 46 ± 2 3 | 42 ± 3 | 0.001 | 0.91 | 0.038 |
| Return to baseline | 73 ± 26 | 132 ± 8 | 112 ± 12 | 160 ± 11 | 109 ± 18 | 149 ± 8 | 163 ± 12 | 166 ± 11 | 0.011 | 0.068 | 0.14 |
| Net iAUC0–60min | 1.8 ± 0.5 | 16.5 ± 3.8 | 27.1 ± 4.4 | 46.2 ± 9.3 | 2.3 ± 0.5 | 15.5 ± 3.8 | 20.9 ± 4.4 | 39.8 ± 9.3 | 0.59 | <0.001 | 0.26 |
| Net iAUC0–180min | 0.2 ± 0.6 | 8.3 ± 1.9 | 10.7 ± 2.4 | 25.8 ± 6.2 | 1.5 ± 0.6 | 9.6 ± 1.9 | 11.6 ± 2.4 | 26.6 ± 6.2 | 0.77 | <0.001 | 0.99 |
| Plasma glucagon (pg/mL) | |||||||||||
| Fasted | 9.7 ± 1.4 | 10.9 ± 1.6 | 9.8 ± 1.4 | 10.3 ± 1.5 | 8.7 ± 1.4 | 9.1 ± 1.6 | 8.1 ± 1.4 | 9.6 ± 1.5 | 0.51 | 0.27 | 0.69 |
| Peak/Nadir | 11.2 ± 1.5 | 36.4 ± 5.8 | 10.7 ± 1.4 | 22.6 ± 3.1 | 10.2 ± 1.5 | 33.1 ± 5.8 | 9.1 ± 1.4 | 22.1 ± 3.1 | 0.71 | <0.001 | 0.73 |
| Time to peak (min) | 68 ± 22 | 57 ± 17 | 68 ± 24 | 54 ± 9 | 65 ± 22 | 51 ± 17 | 56 ± 24 | 48 ± 9 | 0.83 | 0.65 | 0.98 |
| Return to baseline | 54 ± 16 | 176 ± 153 | 71 ± 29 | 176 ± 51 | 126 ± 39 | 391 ± 153 | 133 ± 29 | 277 ± 51 | 0.11 | 0.011 | 0.69 |
| Net iAUC0–60min | −0.7 ± 0.0 | 16.3 ± 2.6 | −4.6 ± 0.7 | 6.3 ± 1.5 | −0.1 ± 0.0 | 13.5 ± 2.6 | −2.4 ± 0.7 | 6.3 ± 1.5 | 0.98 | <0.001 | 0.33 |
| Net iAUC0–180min | −0.9 ± 0.3 | 10.8 ± 1.3 | −3.9 ± 0.8 | 5.2 ± 1.3 | −0.5 ± 0.3 | 9.9 ± 1.3 | −3.2 ± 0.8 | 5.1 ± 1.3 | 0.95 | <0.001 | 0.92 |
Publisher’s Note: MDPI stays neutral with regard to jurisdictional claims in published maps and institutional affiliations. |
© 2022 by the authors. Licensee MDPI, Basel, Switzerland. This article is an open access article distributed under the terms and conditions of the Creative Commons Attribution (CC BY) license (https://creativecommons.org/licenses/by/4.0/).
Share and Cite
Oberoi, A.; Giezenaar, C.; Rigda, R.S.; Lange, K.; Horowitz, M.; Jones, K.L.; Chapman, I.; Soenen, S. Comparative Effects of Co-Ingesting Whey Protein and Glucose Alone and Combined on Blood Glucose, Plasma Insulin and Glucagon Concentrations in Younger and Older Men. Nutrients 2022, 14, 3111. https://doi.org/10.3390/nu14153111
Oberoi A, Giezenaar C, Rigda RS, Lange K, Horowitz M, Jones KL, Chapman I, Soenen S. Comparative Effects of Co-Ingesting Whey Protein and Glucose Alone and Combined on Blood Glucose, Plasma Insulin and Glucagon Concentrations in Younger and Older Men. Nutrients. 2022; 14(15):3111. https://doi.org/10.3390/nu14153111
Chicago/Turabian StyleOberoi, Avneet, Caroline Giezenaar, Rachael S. Rigda, Kylie Lange, Michael Horowitz, Karen L. Jones, Ian Chapman, and Stijn Soenen. 2022. "Comparative Effects of Co-Ingesting Whey Protein and Glucose Alone and Combined on Blood Glucose, Plasma Insulin and Glucagon Concentrations in Younger and Older Men" Nutrients 14, no. 15: 3111. https://doi.org/10.3390/nu14153111
APA StyleOberoi, A., Giezenaar, C., Rigda, R. S., Lange, K., Horowitz, M., Jones, K. L., Chapman, I., & Soenen, S. (2022). Comparative Effects of Co-Ingesting Whey Protein and Glucose Alone and Combined on Blood Glucose, Plasma Insulin and Glucagon Concentrations in Younger and Older Men. Nutrients, 14(15), 3111. https://doi.org/10.3390/nu14153111