
Gut Microbiota Characteristics of People with Obesity by Meta-Analysis of Existing Datasets

 ,
,
Abstract
:
1. Introduction
2. Materials and Methods
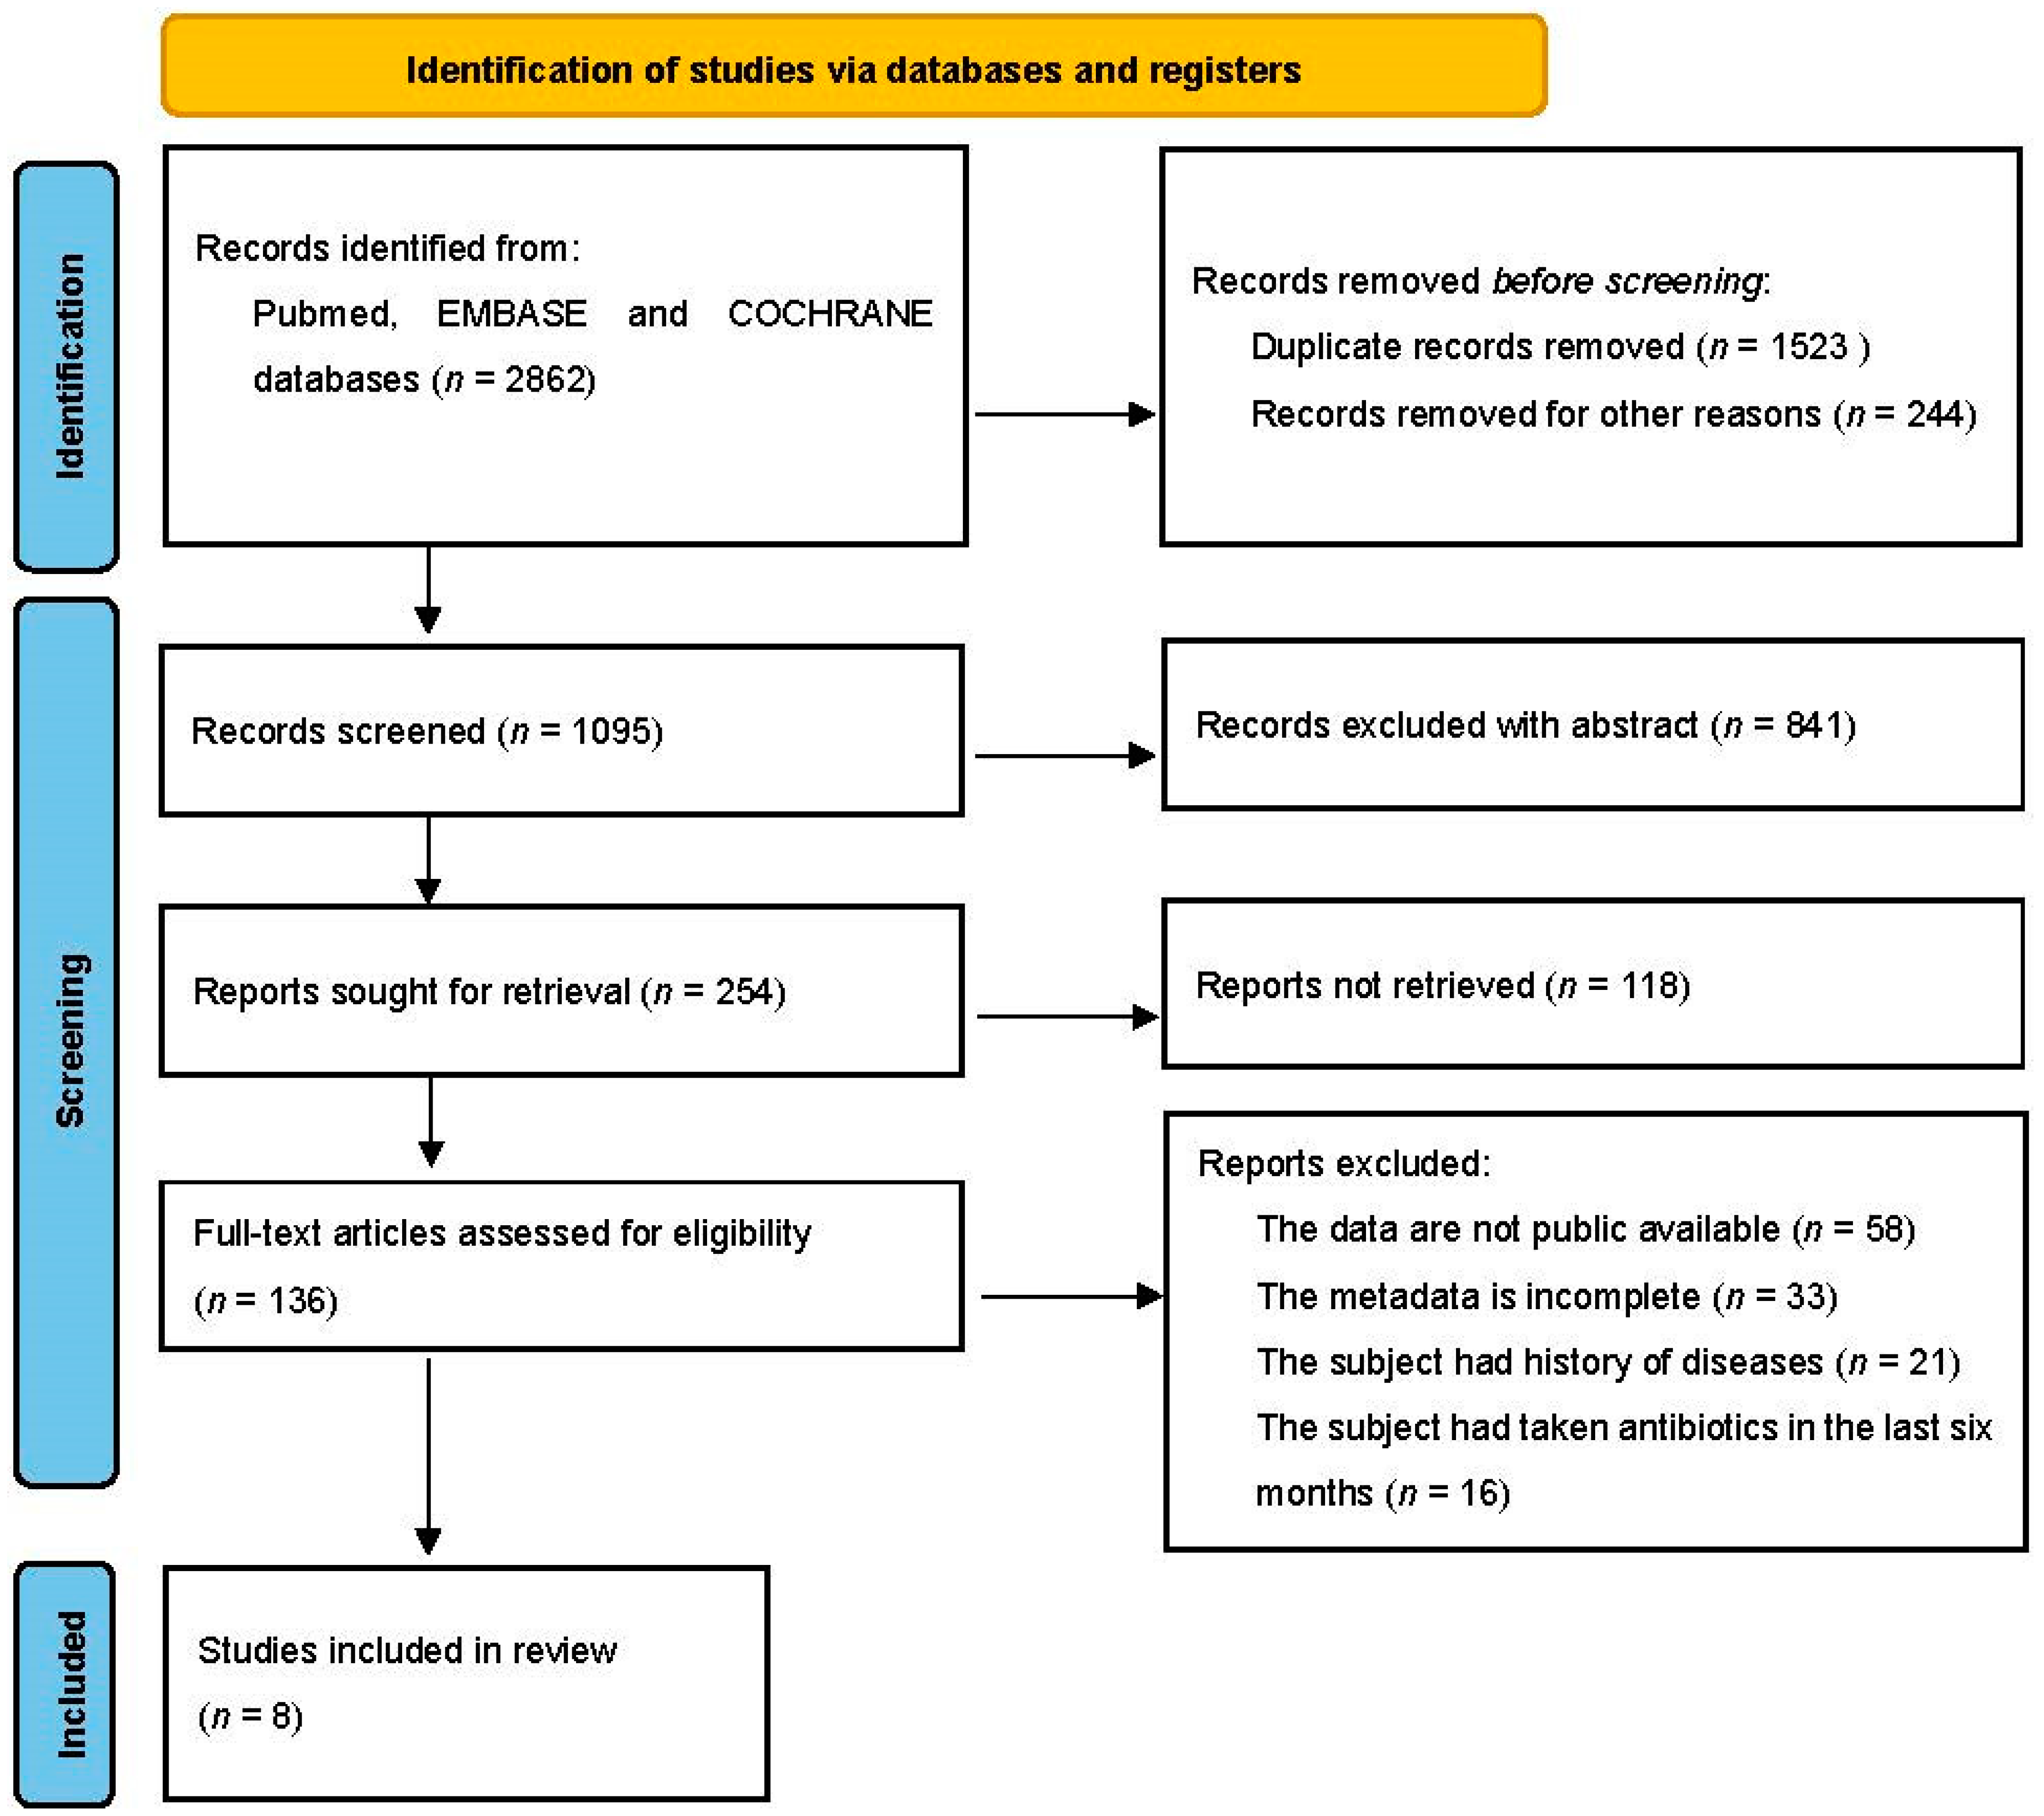
2.1. Database Search and Study Selection
2.2. Microbiome Data Processing
2.3. Statistical Analysis
3. Results
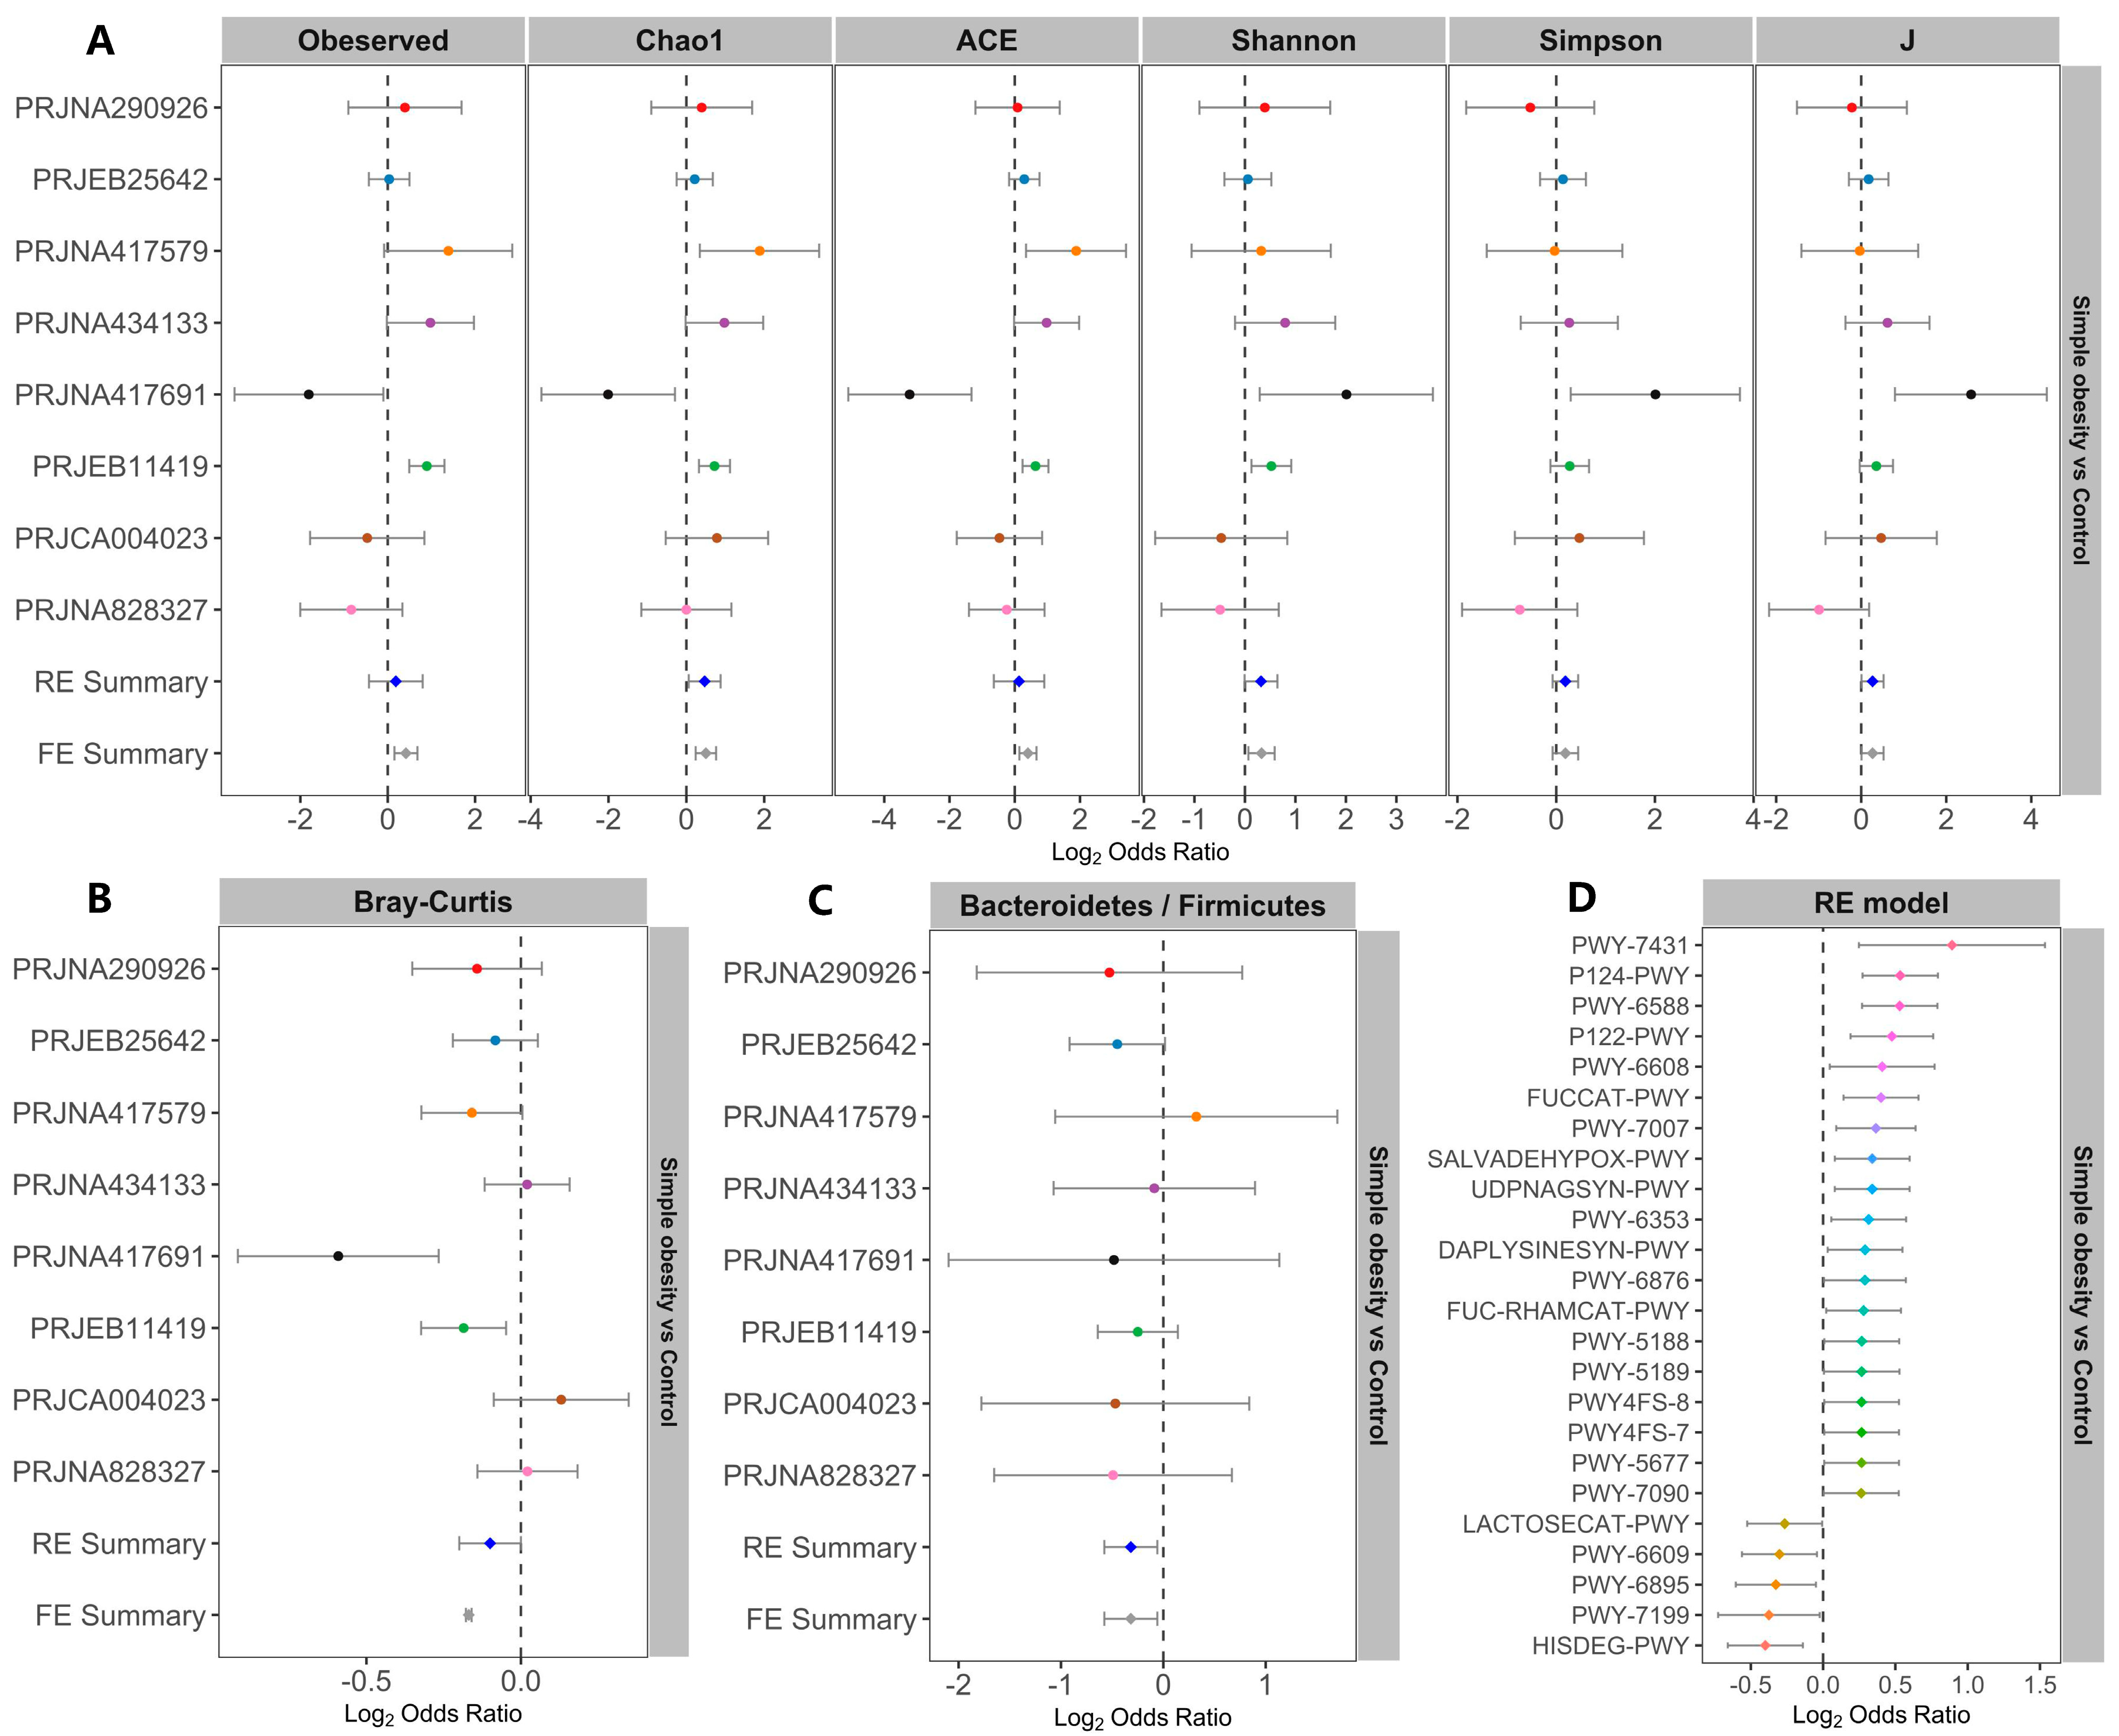
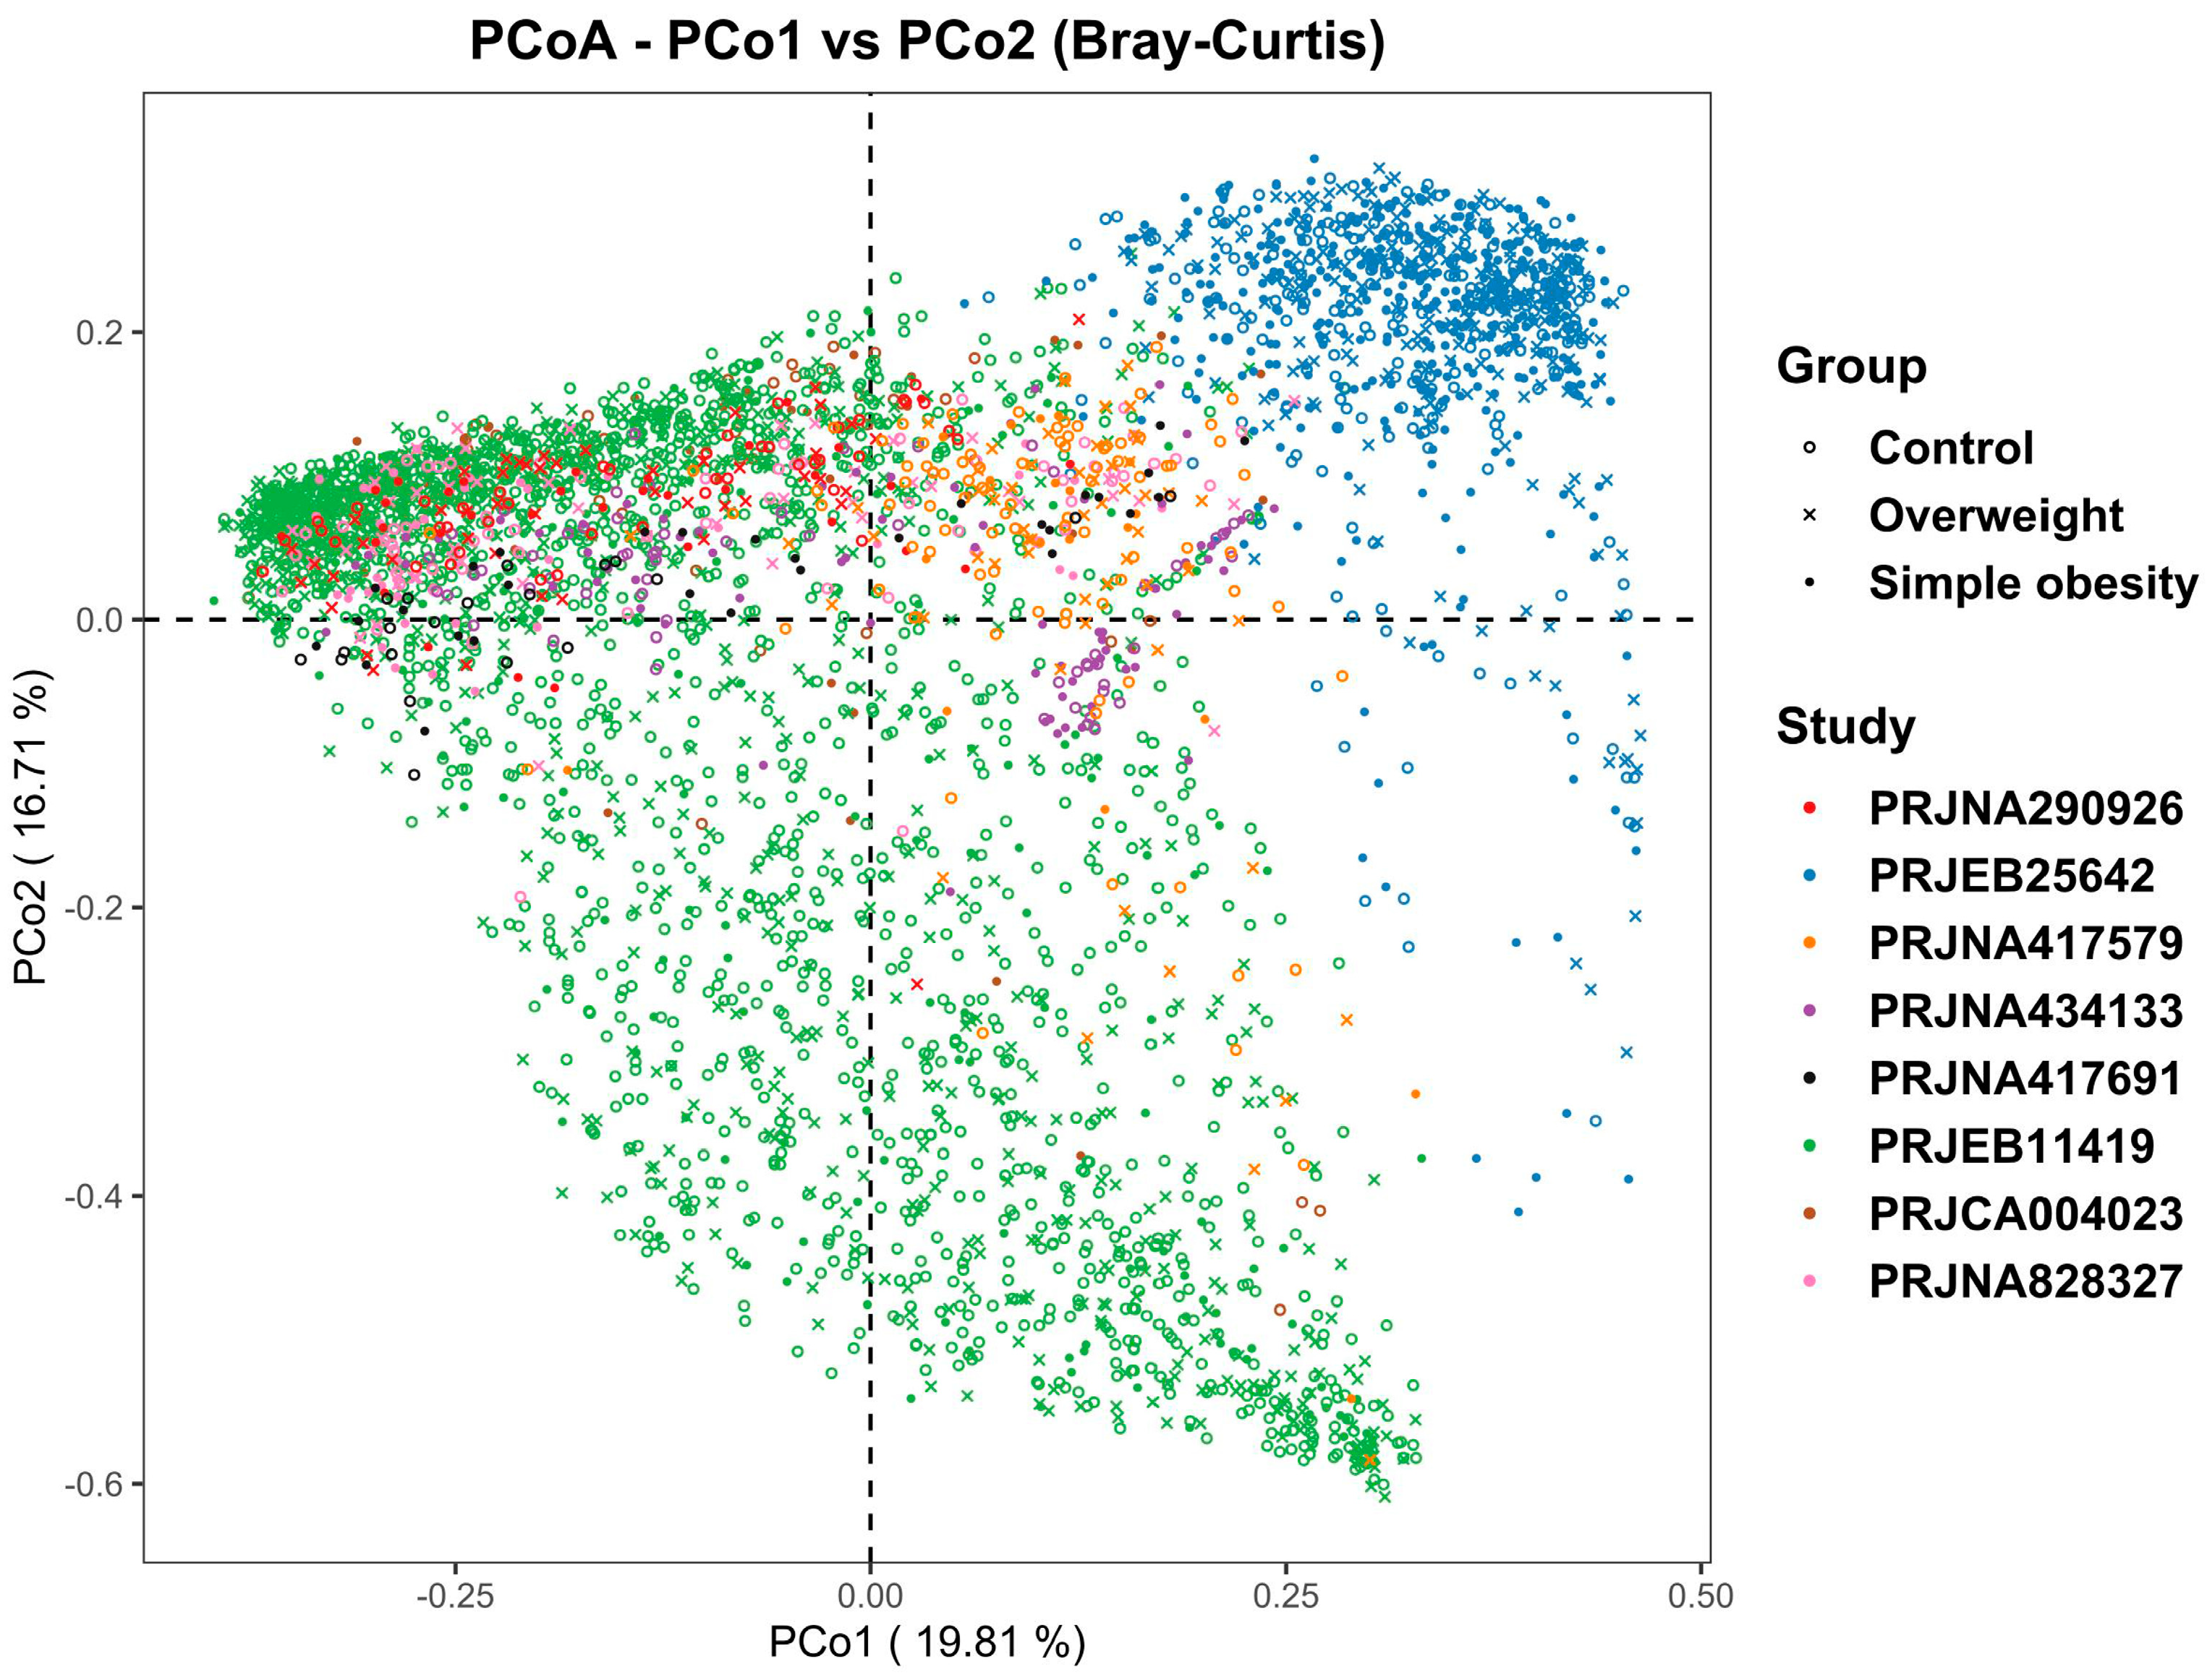
3.1. Microbiome Profile Differences among the Simple Obesity, Overweight, and Control Groups
3.2. Metagenomic Simple Obesity and Overweight Classification Models
4. Discussion
5. Conclusions
Supplementary Materials
Author Contributions
Funding
Institutional Review Board Statement
Informed Consent Statement
Data Availability Statement
Acknowledgments
Conflicts of Interest
References
- World Health Organization. Obesity: Preventing and Managing the Global Epidemic; Report of a WHO Consultation; World Health Organization Technical Report Series; World Health Organization: Geneva, Switzerland, 2000; Volume 894, pp. 1–253.
- Bray, G.; Kim, K.K.; Wilding, J. Obesity: A Chronic Relapsing Progressive Disease Process. A Position Statement of the World Obesity Federation. Obes. Rev. 2017, 18, 715–723. [Google Scholar] [CrossRef] [PubMed] [Green Version]
- Collaboration, N.C.D.R.F. Worldwide trends in body-mass index, underweight, overweight, and obesity from 1975 to 2016: A pooled analysis of 2416 population-based measurement studies in 128.9 million children, adolescents, and adults. Lancet 2017, 390, 2627–2642. [Google Scholar]
- Lobstein, T.; Brinsden, H.; Neveux, M. World Obesity Atlas 2022; World Obesity Federation: London, UK, 2022. [Google Scholar]
- Pan, X.-F.; Wang, L.; Pan, A. Epidemiology and determinants of obesity in China. Lancet Diabetes Endocrinol. 2021, 9, 373–392. [Google Scholar] [CrossRef]
- Petrilli, C.; Jones, S.A.; Yang, J.; Rajagopalan, H.; O’Donnell, L.; Chernyak, Y.; Tobin, K.A.; Cerfolio, R.J.; Francois, F.; Horwitz, L.I. Factors associated with hospitalization and critical illness among 4103 patients with COVID-19 disease in New York City. BMJ 2020, 369, m1966. [Google Scholar] [CrossRef]
- World Health Organization. Global Action Plan for the Prevention and Control of Noncommunicable Diseases 2013–2020; World Health Organization: Geneva, Switzerland, 2013.
- Cani, P.D.; Van Hul, M.; Lefort, C.; Depommier, C.; Rastelli, M.; Everard, A. Microbial regulation of organismal energy homeostasis. Nat. Metab. 2019, 1, 34–46. [Google Scholar] [CrossRef]
- Fan, Y.; Pedersen, O. Gut microbiota in human metabolic health and disease. Nat. Rev. Microbiol. 2021, 19, 55–71. [Google Scholar] [CrossRef]
- Bäckhed, F.; Ding, H.; Wang, T.; Hooper, L.V.; Koh, G.Y.; Nagy, A.; Semenkovich, C.F.; Gordon, J.I. The gut microbiota as an environmental factor that regulates fat storage. Proc. Natl. Acad. Sci. USA 2004, 101, 15718–15723. [Google Scholar] [CrossRef] [Green Version]
- Ridaura, V.K.; Faith, J.J.; Rey, F.E.; Cheng, J.; Duncan, A.E.; Kau, A.L.; Griffin, N.W.; Lombard, V.; Henrissat, B.; Bain, J.R.; et al. Gut Microbiota from Twins Discordant for Obesity Modulate Metabolism in Mice. Science 2013, 341, 1241214. [Google Scholar] [CrossRef] [Green Version]
- Duncan, S.H.; Lobley, G.E.; Holtrop, G.; Ince, J.; Johnstone, A.M.; Louis, P.; Flint, H.J. Human Colonic Microbiota Associated with Diet, Obesity and Weight Loss. Int. J. Obes. 2008, 32, 1720–1724. [Google Scholar] [CrossRef] [Green Version]
- Duan, M.; Wang, Y.; Zhang, Q.; Zou, R.; Guo, M.; Zheng, H. Characteristics of gut microbiota in people with obesity. PLoS ONE 2021, 16, e0255446. [Google Scholar] [CrossRef]
- Gomes, A.C.; Hoffmann, C.; Mota, J.F. The human gut microbiota: Metabolism and perspective in obesity. Gut Microbes 2018, 9, 308–325. [Google Scholar] [CrossRef] [Green Version]
- Pinart, M.; Dötsch, A.; Schlicht, K.; Laudes, M.; Bouwman, J.; Forslund, S.K.; Pischon, T.; Nimptsch, K. Gut Microbiome Composition in Obese and Non-Obese Persons: A Systematic Review and Meta-Analysis. Nutrients 2021, 14, 12. [Google Scholar] [CrossRef] [PubMed]
- Crovesy, L.; Masterson, D.; Rosado, E.L. Profile of the gut microbiota of adults with obesity: A systematic review. Eur. J. Clin. Nutr. 2020, 74, 1251–1262. [Google Scholar] [CrossRef] [PubMed]
- Castaner, O.; Goday, A.; Park, Y.-M.; Lee, S.-H.; Magkos, F.; Shiow, S.T.E.; Schröder, H. The Gut Microbiome Profile in Obesity: A Systematic Review. Int. J. Endocrinol. 2018, 2018, 4095789. [Google Scholar] [CrossRef] [PubMed]
- Grahnemo, L.; Nethander, M.; Coward, E.; Gabrielsen, M.E.; Sree, S.; Billod, J.-M.; Engstrand, L.; Abrahamsson, S.; Langhammer, A.; Hveem, K.; et al. Cross-sectional associations between the gut microbe Ruminococcus gnavus and features of the metabolic syndrome. Lancet Diabetes Endocrinol. 2022, 10, 481–483. [Google Scholar] [CrossRef]
- World Health Organization. WHO: Global Database on Body Mass Index; WHO: Geneva, Switzerland, 2015.
- Baxter, N.T.; Ruffin, M.T.I.; Rogers, M.A.M.; Schloss, P.D. Microbiota-based model improves the sensitivity of fecal immunochemical test for detecting colonic lesions. Genome Med. 2016, 8, 37. [Google Scholar] [CrossRef] [Green Version]
- Chávez-Carbajal, A.; Nirmalkar, K.; Pérez-Lizaur, A.; Hernández-Quiroz, F.; Ramírez-Del-Alto, S.; García-Mena, J.; Hernández-Guerrero, C. Gut Microbiota and Predicted Metabolic Pathways in a Sample of Mexican Women Affected by Obesity and Obesity Plus Metabolic Syndrome. Int. J. Mol. Sci. 2019, 20, 438. [Google Scholar] [CrossRef] [Green Version]
- de la Cuesta-Zuluaga, J.; Mueller, N.T.; Álvarez-Quintero, R.; Velásquez-Mejía, E.P.; Sierra, J.A.; Corrales-Agudelo, V.; Carmona, J.A.; Abad, J.M.; Escobar, J.S. Higher Fecal Short-Chain Fatty Acid Levels Are Associated with Gut Microbiome Dysbiosis, Obesity, Hypertension and Cardiometabolic Disease Risk Factors. Nutrients 2018, 11, 51. [Google Scholar] [CrossRef] [Green Version]
- Dubey, A.K.; Uppadhyaya, N.; Nilawe, P.; Chauhan, N.; Kumar, S.; Gupta, U.A.; Bhaduri, A. LogMPIE, pan-India profiling of the human gut microbiome using 16S rRNA sequencing. Sci. Data 2018, 5, 180232. [Google Scholar] [CrossRef]
- Michalovich, D.; Rodriguez-Perez, N.; Smolinska, S.; Pirozynski, M.; Mayhew, D.; Uddin, S.; Van Horn, S.; Sokolowska, M.; Altunbulakli, C.; Eljaszewicz, A.; et al. Obesity and disease severity magnify disturbed microbiome-immune interactions in asthma patients. Nat. Commun. 2019, 10, 5711. [Google Scholar] [CrossRef] [Green Version]
- Zhou, Q.; Zhang, Y.; Wang, X.; Yang, R.; Zhu, X.; Zhang, Y.; Chen, C.; Yuan, H.; Yang, Z.; Sun, L. Gut bacteria Akkermansia is associated with reduced risk of obesity: Evidence from the American Gut Project. Nutr. Metab. 2020, 17, 90. [Google Scholar] [CrossRef] [PubMed]
- Magoč, T.; Salzberg, S.L. FLASH: Fast length adjustment of short reads to improve genome assemblies. Bioinformatics 2011, 27, 2957–2963. [Google Scholar] [CrossRef] [PubMed]
- Martin, M. Cutadapt removes adapter sequences from high-throughput sequencing reads. EMBnet. J. 2011, 17, 3. [Google Scholar] [CrossRef]
- Edgar, R.C. UPARSE: Highly accurate OTU sequences from microbial amplicon reads. Nat. Methods 2013, 10, 996–998. [Google Scholar] [CrossRef] [PubMed]
- Edgar, R.C.; Haas, B.J.; Clemente, J.C.; Quince, C.; Knight, R. UCHIME improves sensitivity and speed of chimera detection. Bioinformatics 2011, 27, 2194–2200. [Google Scholar] [CrossRef] [Green Version]
- Cole, J.R.; Wang, Q.; Fish, J.A.; Chai, B.; McGarrell, D.M.; Sun, Y.; Brown, C.T.; Porras-Alfaro, A.; Kuske, C.R.; Tiedje, J.M. Ribosomal Database Project: Data and tools for high throughput rRNA analysis. Nucleic Acids Res. 2014, 42, D633–D642. [Google Scholar] [CrossRef] [Green Version]
- Douglas, G.M.; Maffei, V.J.; Zaneveld, J.R.; Yurgel, S.N.; Brown, J.R.; Taylor, C.M.; Huttenhower, C.; Langille, M.G.I. PICRUSt2 for prediction of metagenome functions. Nat. Biotechnol. 2020, 38, 685–688. [Google Scholar] [CrossRef]
- Oksanen, J.; Blanchet, F.G.; Kindt, R.; Legendre, P.; Minchin, P.R.; O’Hara, R.B.; Simpson, G.L.; Solymos, P.; Stevens, M.; Wagner, H.H. Vegan: Community Ecology Package. R Package Version 2.3–5. 2016. Available online: http://cran.r-project.org/package=vegan (accessed on 9 June 2022).
- Wolfgang, V. Conducting Meta-Analyses in R with the metafor Package. J. Stat. Softw. 2010, 36, 3. [Google Scholar]
- Deist, T.M.; Dankers, F.J.W.M.; Valdes, G.; Wijsman, R.; Hsu, I.; Oberije, C.; Lustberg, T.; Van Soest, J.; Hoebers, F.; Jochems, A.; et al. Machine learning algorithms for outcome prediction in (chemo)radiotherapy: An empirical comparison of classifiers. Med. Phys. 2018, 45, 3449–3459. [Google Scholar] [CrossRef]
- Que, Y.; Cao, M.; He, J.; Zhang, Q.; Chen, Q.; Yan, C.; Lin, A.; Yang, L.; Wu, Z.; Zhu, D.; et al. Gut Bacterial Characteristics of Patients With Type 2 Diabetes Mellitus and the Application Potential. Front. Immunol. 2021, 12, 722206. [Google Scholar] [CrossRef]
- Schwiertz, A.; Taras, D.; Schäfer, K.; Beijer, S.; Bos, N.A.; Donus, C.; Hardt, P.D. Microbiota and SCFA in Lean and Overweight Healthy Subjects. Obesity 2010, 18, 190–195. [Google Scholar] [CrossRef] [PubMed]
- Krajmalnik-Brown, R.; Ilhan, Z.-E.; Kang, D.-W.; DiBaise, J.K. Effects of Gut Microbes on Nutrient Absorption and Energy Regulation. Nutr. Clin. Pract. 2012, 27, 201–214. [Google Scholar] [CrossRef] [PubMed] [Green Version]
- Zhao, L. The gut microbiota and obesity: From correlation to causality. Nat. Rev. Genet. 2013, 11, 639–647. [Google Scholar] [CrossRef]
- Cani, P.D.; Amar, J.; Iglesias, M.A.; Poggi, M.; Knauf, C.; Bastelica, D.; Neyrinck, A.M.; Fava, F.; Tuohy, K.M.; Chabo, C.; et al. Metabolic endotoxemia initiates obesity and insulin resistance. Diabetes 2007, 56, 1761–1772. [Google Scholar] [CrossRef] [PubMed] [Green Version]
- Lindberg, A.A.; Weintraub, A.; Zähringer, U.; Rietschel, E.T. Structure-Activity Relationships in Lipopolysaccharides of Bacteroides fragilis. Clin. Infect. Dis. 1990, 12, S133–S141. [Google Scholar] [CrossRef] [PubMed]
- Depommier, C.; van Hul, M.; Everard, A.; Delzenne, N.M.; de Vos, W.M.; Cani, P.D. Pasteurized Akkermansia muciniphila increases whole-body energy expenditure and fecal energy excretion in diet-induced obese mice. Gut Microbes 2020, 11, 1231–1245. [Google Scholar] [CrossRef] [Green Version]
- Jie, Z.; Yu, X.; Liu, Y.; Sun, L.; Chen, P.; Ding, Q.; Gao, Y.; Zhang, X.; Yu, M.; Liu, Y.; et al. The Baseline Gut Microbiota Directs Dieting-Induced Weight Loss Trajectories. Gastroenterology 2021, 160, 2029–2042.e16. [Google Scholar] [CrossRef]
- Liu, R.; Hong, J.; Xu, X.; Feng, Q.; Zhang, D.; Gu, Y.; Shi, J.; Zhao, S.; Liu, W.; Wang, X.; et al. Gut microbiome and serum metabolome alterations in obesity and after weight-loss intervention. Nat. Med. 2017, 23, 859–868. [Google Scholar] [CrossRef]
- Truax, A.D.; Chen, L.; Tam, J.W.; Cheng, N.; Guo, H.; Koblansky, A.A.; Chou, W.-C.; Wilson, J.E.; Brickey, W.J.; Petrucelli, A.; et al. The Inhibitory Innate Immune Sensor NLRP12 Maintains a Threshold against Obesity by Regulating Gut Microbiota Homeostasis. Cell Host Microbe 2018, 24, 364–378.e6. [Google Scholar] [CrossRef] [Green Version]
- Deng, K.; Shuai, M.; Zhang, Z.; Jiang, Z.; Fu, Y.; Shen, L.; Zheng, J.-S.; Chen, Y.-M. Temporal relationship among adiposity, gut microbiota, and insulin resistance in a longitudinal human cohort. BMC Med. 2022, 20, 171. [Google Scholar] [CrossRef]
- Goodrich, J.K.; Waters, J.L.; Poole, A.C.; Sutter, J.L.; Koren, O.; Blekhman, R.; Beaumont, M.; Van Treuren, W.; Knight, R.; Bell, J.T.; et al. Human Genetics Shape the Gut Microbiome. Cell 2014, 159, 789–799. [Google Scholar] [CrossRef] [PubMed] [Green Version]
- Mazier, W.; Le Corf, K.; Martinez, C.; Tudela, H.; Kissi, D.; Kropp, C.; Coubard, C.; Soto, M.; Elustondo, F.; Rawadi, G.; et al. A New Strain of Christensenella minuta as a Potential Biotherapy for Obesity and Associated Metabolic Diseases. Cells 2021, 10, 823. [Google Scholar] [CrossRef] [PubMed]
- Leong, K.S.W.; Jayasinghe, T.N.; Wilson, B.C.; Derraik, J.G.B.; Albert, B.B.; Chiavaroli, V.; Svirskis, D.M.; Beck, K.L.; Conlon, C.A.; Jiang, Y.; et al. Effects of Fecal Microbiome Transfer in Adolescents With Obesity: The Gut Bugs Randomized Controlled Trial. JAMA Netw. Open 2020, 3, e2030415. [Google Scholar] [CrossRef] [PubMed]
- Yu, E.W.; Gao, L.; Stastka, P.; Cheney, M.C.; Mahabamunuge, J.; Soto, M.T.; Ford, C.B.; Bryant, J.A.; Henn, M.R.; Hohmann, E.L. Fecal microbiota transplantation for the improvement of metabolism in obesity: The FMT-TRIM double-blind placebo-controlled pilot trial. PLoS Med. 2020, 17, e1003051. [Google Scholar] [CrossRef]
- Singh, H.; Torralba, M.G.; Moncera, K.J.; DiLello, L.; Petrini, J.; Nelson, K.E.; Pieper, R. Gastro-intestinal and oral microbiome signatures associated with healthy aging. GeroScience 2019, 41, 907–921. [Google Scholar] [CrossRef]
- Pardo, F.; Villalobos-Labra, R.; Chiarello, D.I.; Salsoso, R.; Toledo, F.; Gutierrez, J.; Leiva, A.; Sobrevia, L. Molecular implications of adenosine in obesity. Mol. Asp. Med. 2017, 55, 90–101. [Google Scholar] [CrossRef] [Green Version]
- Krautkramer, K.A.; Fan, J.; Bäckhed, F. Gut microbial metabolites as multi-kingdom intermediates. Nat. Rev. Genet. 2020, 19, 77–94. [Google Scholar] [CrossRef]
- Koh, A.; Molinaro, A.; Ståhlman, M.; Khan, M.T.; Schmidt, C.; Mannerås-Holm, L.; Wu, H.; Carreras, A.; Jeong, H.; Olofsson, L.E.; et al. Microbially Produced Imidazole Propionate Impairs Insulin Signaling through mTORC1. Cell 2018, 175, 947–961.e17. [Google Scholar] [CrossRef] [Green Version]
- Niu, Y.-C.; Feng, R.-N.; Hou, Y.; Li, K.; Kang, Z.; Wang, J.; Sun, C.-H.; Li, Y. Histidine and arginine are associated with inflammation and oxidative stress in obese women. Br. J. Nutr. 2011, 108, 57–61. [Google Scholar] [CrossRef] [Green Version]
- Feng, R.N.; Niu, Y.C.; Sun, X.W.; Li, Q.; Zhao, C.; Wang, C.; Guo, F.C.; Sun, C.H.; Li, Y. Histidine supplementation improves insulin resistance through suppressed inflammation in obese women with the metabolic syndrome: A randomised controlled trial. Diabetologia 2013, 56, 985–994. [Google Scholar] [CrossRef]
- Ejtahed, H.-S.; Angoorani, P.; Soroush, A.-R.; Hasani-Ranjbar, S.; Siadat, S.-D.; Larijani, B. Gut microbiota-derived metabolites in obesity: A systematic review. Biosci. Microbiota Food Health 2020, 39, 65–76. [Google Scholar] [CrossRef] [PubMed] [Green Version]
- Zeng, Q.; Li, D.; He, Y.; Li, Y.; Yang, Z.; Zhao, X.; Liu, Y.; Wang, Y.; Sun, J.; Feng, X.; et al. Discrepant gut microbiota markers for the classification of obesity-related metabolic abnormalities. Sci. Rep. 2019, 9, 13424. [Google Scholar] [CrossRef] [PubMed] [Green Version]


| Source | Year | Country | Control | Overweight | Obesity | DNA Extraction | Region | Sequencing Platform |
|---|---|---|---|---|---|---|---|---|
| PRJNA290926 [20] | 2016 | USA, Canada | 44 | 48 | 33 | PowerSoil-htp 96 Well Soil DNA isolation kit | V4 | MiSeq |
| PRJEB25642 [23] | 2018 | India | 228 | 259 | 425 | QIAamp DNA Stool Mini Kit | V4 | Ion torrent |
| PRJNA417579 [22] | 2019 | Columbia | 87 | 57 | 20 | QIAamp DNA Stool Mini Kit | V4 | MiSeq |
| PRJNA434133 [24] | 2019 | UK | 61 | - | 71 | PSP Spin Stool DNA Plus Kit | V4 | MiSeq |
| PRJNA417691 [21] | 2019 | Mexico | 20 | - | 30 | ZR Faecal DNA MiniPrep | V3 | Ion torrent |
| PRJEB11419 [25] | 2019 | USA, UK | 1697 | 739 | 240 | - | V4 | MiSeq, HiSeq |
| PRJCA004023 [13] | 2021 | China | 37 | - | 37 | QIAamp DNA Stool Mini Kit | V3-V4 | MiSeq |
| PRJNA828327 | 2021 | China | 62 | 49 | 38 | QIAamp Fast DNA Stool Mini Kit | V4 | MiSeq |
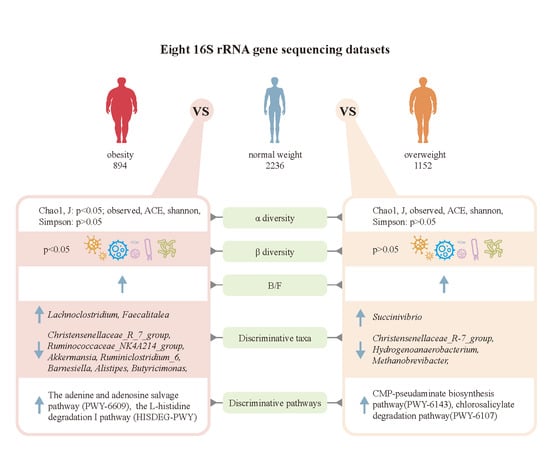
| Genera | Mean Decrease Accuracy | OR | CI_ub | CI_lb | p-Value | Abundance (%) in Control | Abundance (%) in Simple Obesity |
|---|---|---|---|---|---|---|---|
| Christensenellaceae_R-7_group | 4.80 × 10−³ | 1.726 | 1.280 | 2.326 | 3.45 × 10⁻⁴ | 1.707 ± 0.03 | 1.098 ± 0.02 |
| Ruminococcaceae_NK4A214_group | 1.56 × 10−³ | 1.596 | 1.209 | 2.107 | 9.61 × 10⁻⁴ | 0.488 ± 0.01 | 0.437 ± 0.01 |
| Akkermansia | 1.05 × 10−³ | 1.514 | 1.242 | 1.845 | 4.11 × 10⁻⁵ | 2.169 ± 0.07 | 0.985 ± 0.04 |
| Ruminiclostridium_6 | 3.85 × 10⁻⁴ | 1.471 | 1.092 | 1.982 | 1.11 × 10⁻² | 0.375 ± 0.01 | 0.175 ± 0.01 |
| Barnesiella | 6.29 × 10⁻⁴ | 1.380 | 1.009 | 1.888 | 4.39 × 10⁻² | 0.453 ± 0.01 | 0.237 ± 0.01 |
| Alistipes | 2.18 × 10−³ | 1.269 | 1.060 | 1.520 | 9.58 × 10−³ | 1.798 ± 0.02 | 1.148 ± 0.03 |
| Butyricimonas | 5.67 × 10⁻⁴ | 1.243 | 1.024 | 1.509 | 2.82 × 10⁻² | 0.084 ± 0.002 | 0.063 ± 0.002 |
| Lachnoclostridium | 6.37 × 10−³ | 0.755 | 0.575 | 0.990 | 4.18 × 10⁻² | 0.451 ± 0.01 | 0.516 ± 0.01 |
| Genera | Mean Decrease Accuracy | OR | CI_ub | CI_lb | p-Value | Abundance (%) in Control | Abundance (%) in Overweight |
|---|---|---|---|---|---|---|---|
| Succinivibrio | 5.33 × 10−³ | 0.656 | 0.509 | 0.846 | 1.13 × 10−³ | 1.525 ± 0.03 | 3.679 ± 0.12 |
| Christensenellaceae_R-7_group | 3.10 × 10−³ | 1.335 | 1.029 | 1.732 | 2.99 × 10⁻² | 1.78 ± 3 × 10⁻⁴ | 1.356 ± 0.02 |
| Hydrogenoanaerobacterium | 6.62 × 10⁻⁴ | 1.928 | 1.535 | 2.423 | 1.71 × 10⁻⁸ | 0.007 ± 0.02 | 0.003 ± 2 × 10⁻⁴ |
| Methanobrevibacter | 2.67 × 10⁻⁴ | 1.358 | 1.132 | 1.629 | 9.94 × 10⁻⁴ | 0.227 ± 0.08 | 0.168 ± 0.01 |
Publisher’s Note: MDPI stays neutral with regard to jurisdictional claims in published maps and institutional affiliations. |
© 2022 by the authors. Licensee MDPI, Basel, Switzerland. This article is an open access article distributed under the terms and conditions of the Creative Commons Attribution (CC BY) license (https://creativecommons.org/licenses/by/4.0/).
Share and Cite
Gong, J.; Shen, Y.; Zhang, H.; Cao, M.; Guo, M.; He, J.; Zhang, B.; Xiao, C. Gut Microbiota Characteristics of People with Obesity by Meta-Analysis of Existing Datasets. Nutrients 2022, 14, 2993. https://doi.org/10.3390/nu14142993
Gong J, Shen Y, Zhang H, Cao M, Guo M, He J, Zhang B, Xiao C. Gut Microbiota Characteristics of People with Obesity by Meta-Analysis of Existing Datasets. Nutrients. 2022; 14(14):2993. https://doi.org/10.3390/nu14142993
Chicago/Turabian StyleGong, Jinhua, Yun Shen, Hongcheng Zhang, Man Cao, Muyun Guo, Jianquan He, Bangzhou Zhang, and Chuanxing Xiao. 2022. "Gut Microbiota Characteristics of People with Obesity by Meta-Analysis of Existing Datasets" Nutrients 14, no. 14: 2993. https://doi.org/10.3390/nu14142993
APA StyleGong, J., Shen, Y., Zhang, H., Cao, M., Guo, M., He, J., Zhang, B., & Xiao, C. (2022). Gut Microbiota Characteristics of People with Obesity by Meta-Analysis of Existing Datasets. Nutrients, 14(14), 2993. https://doi.org/10.3390/nu14142993