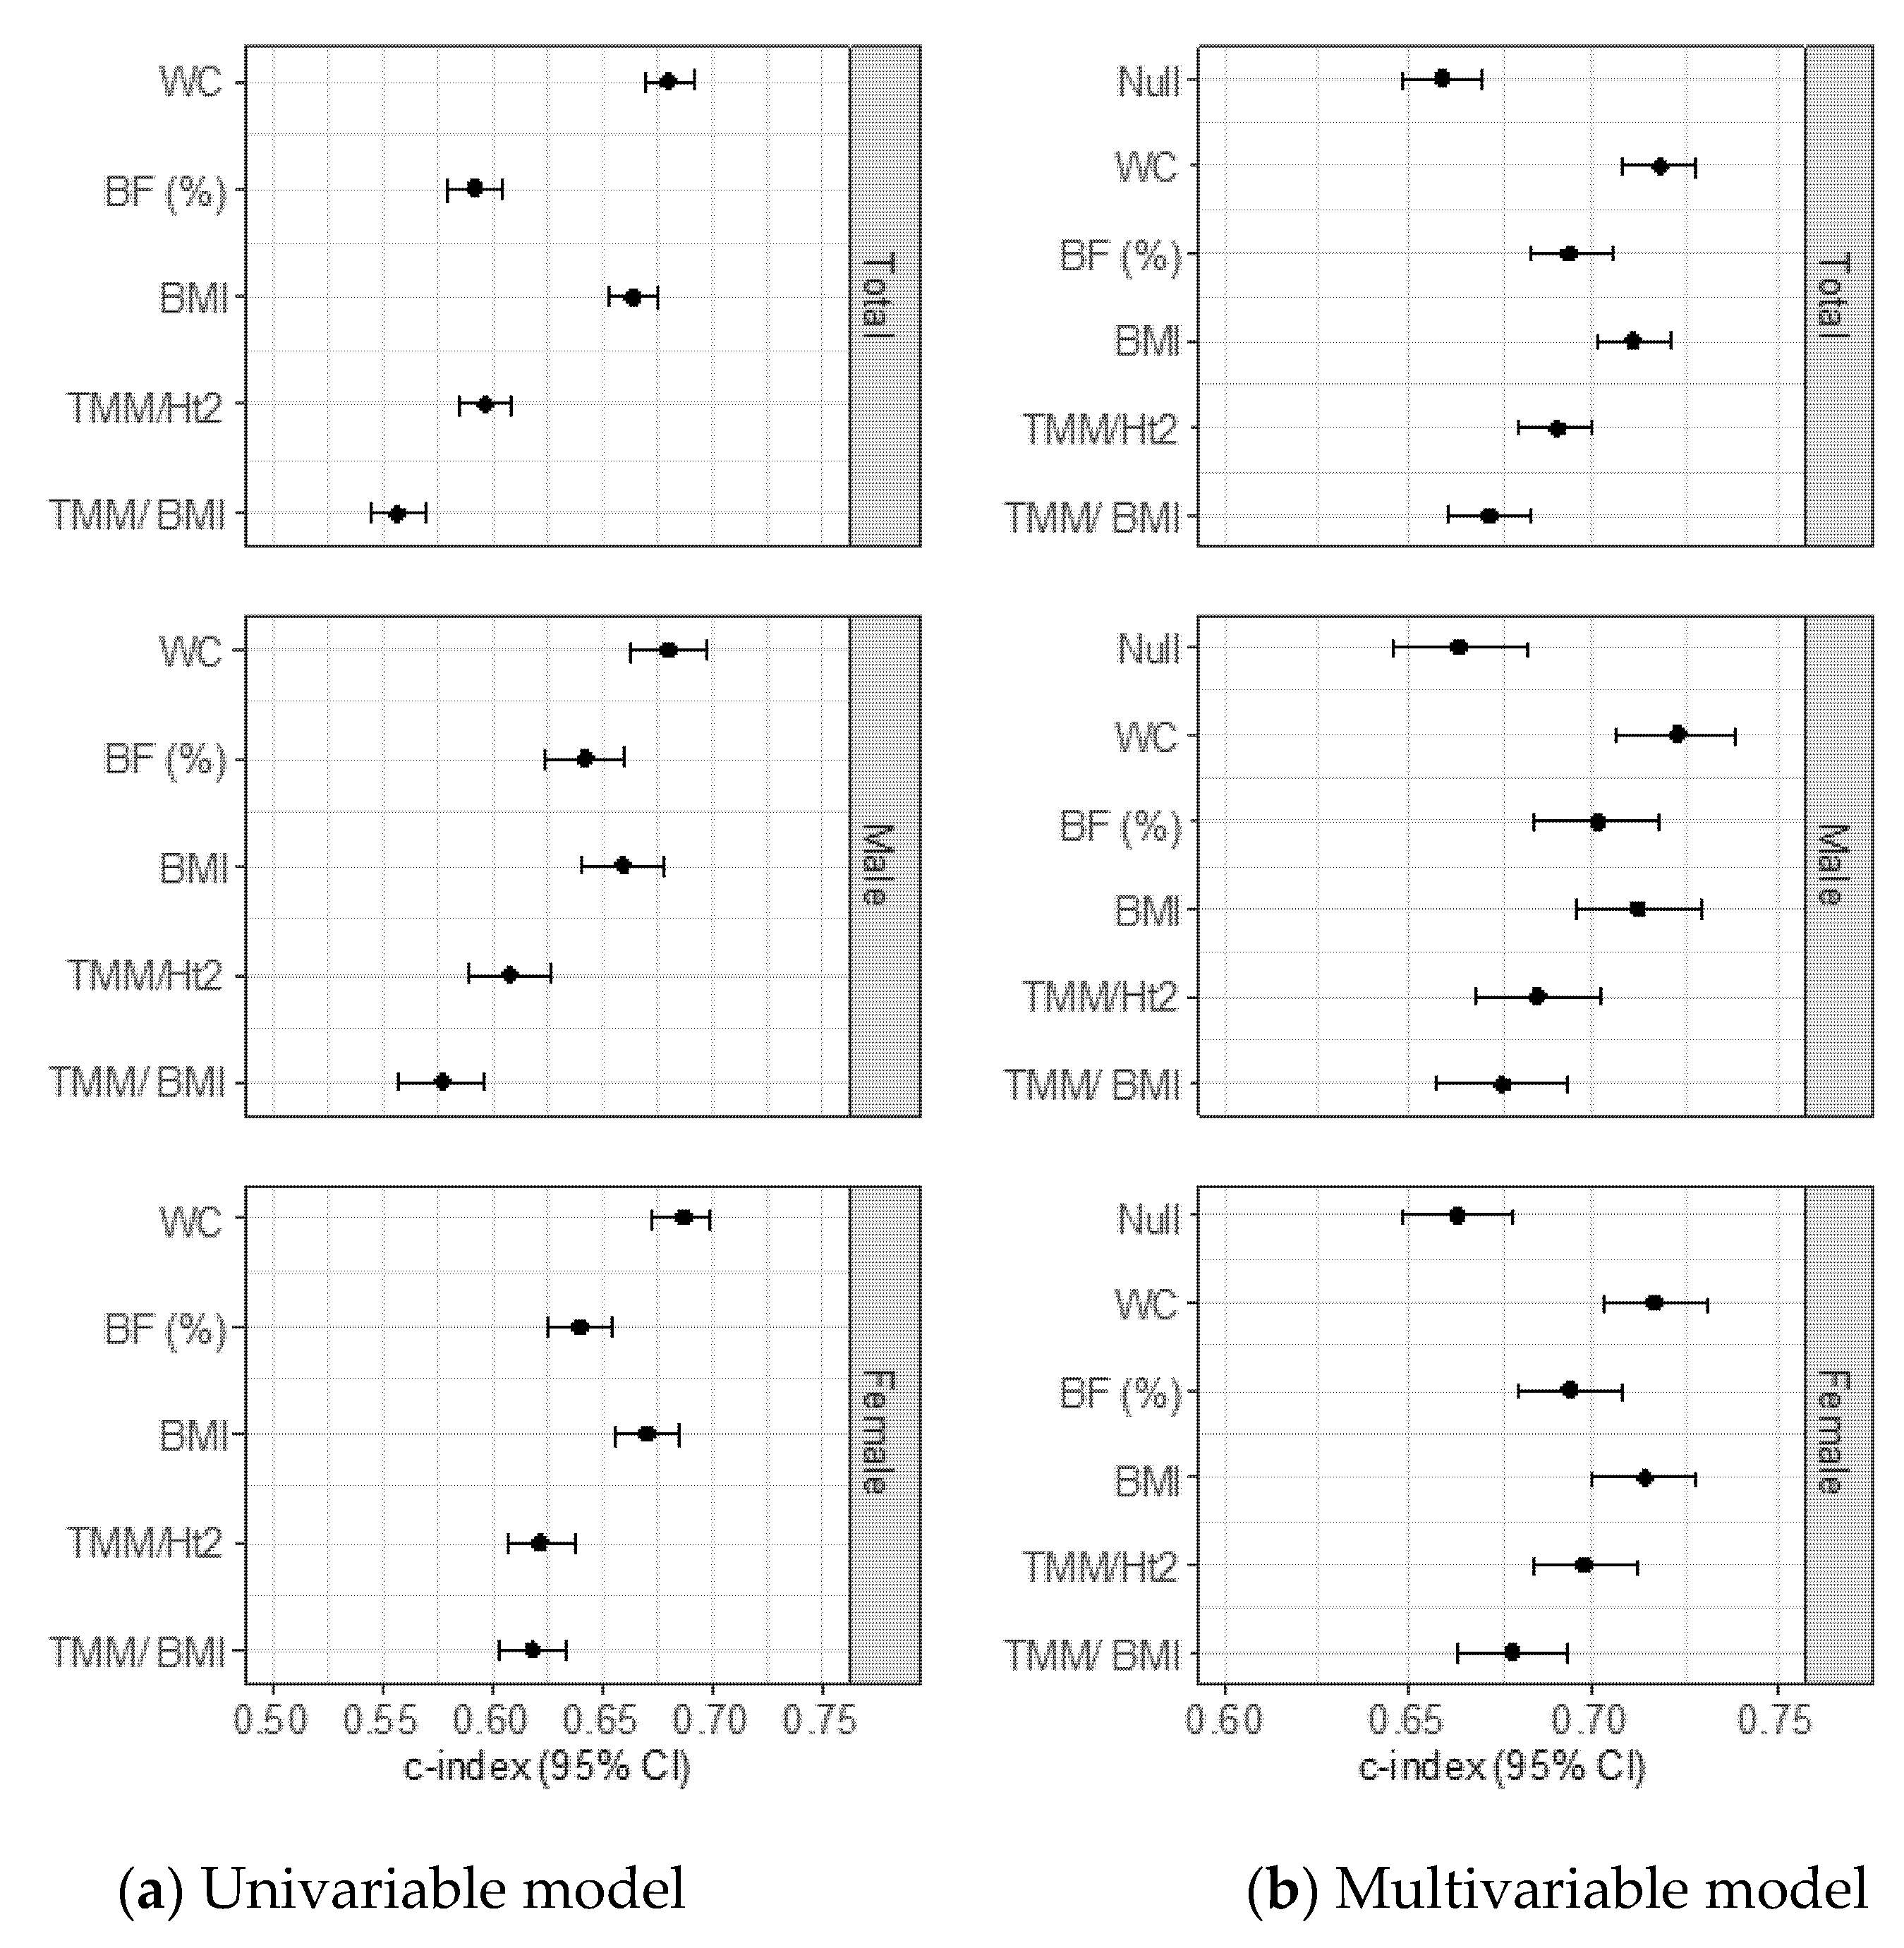
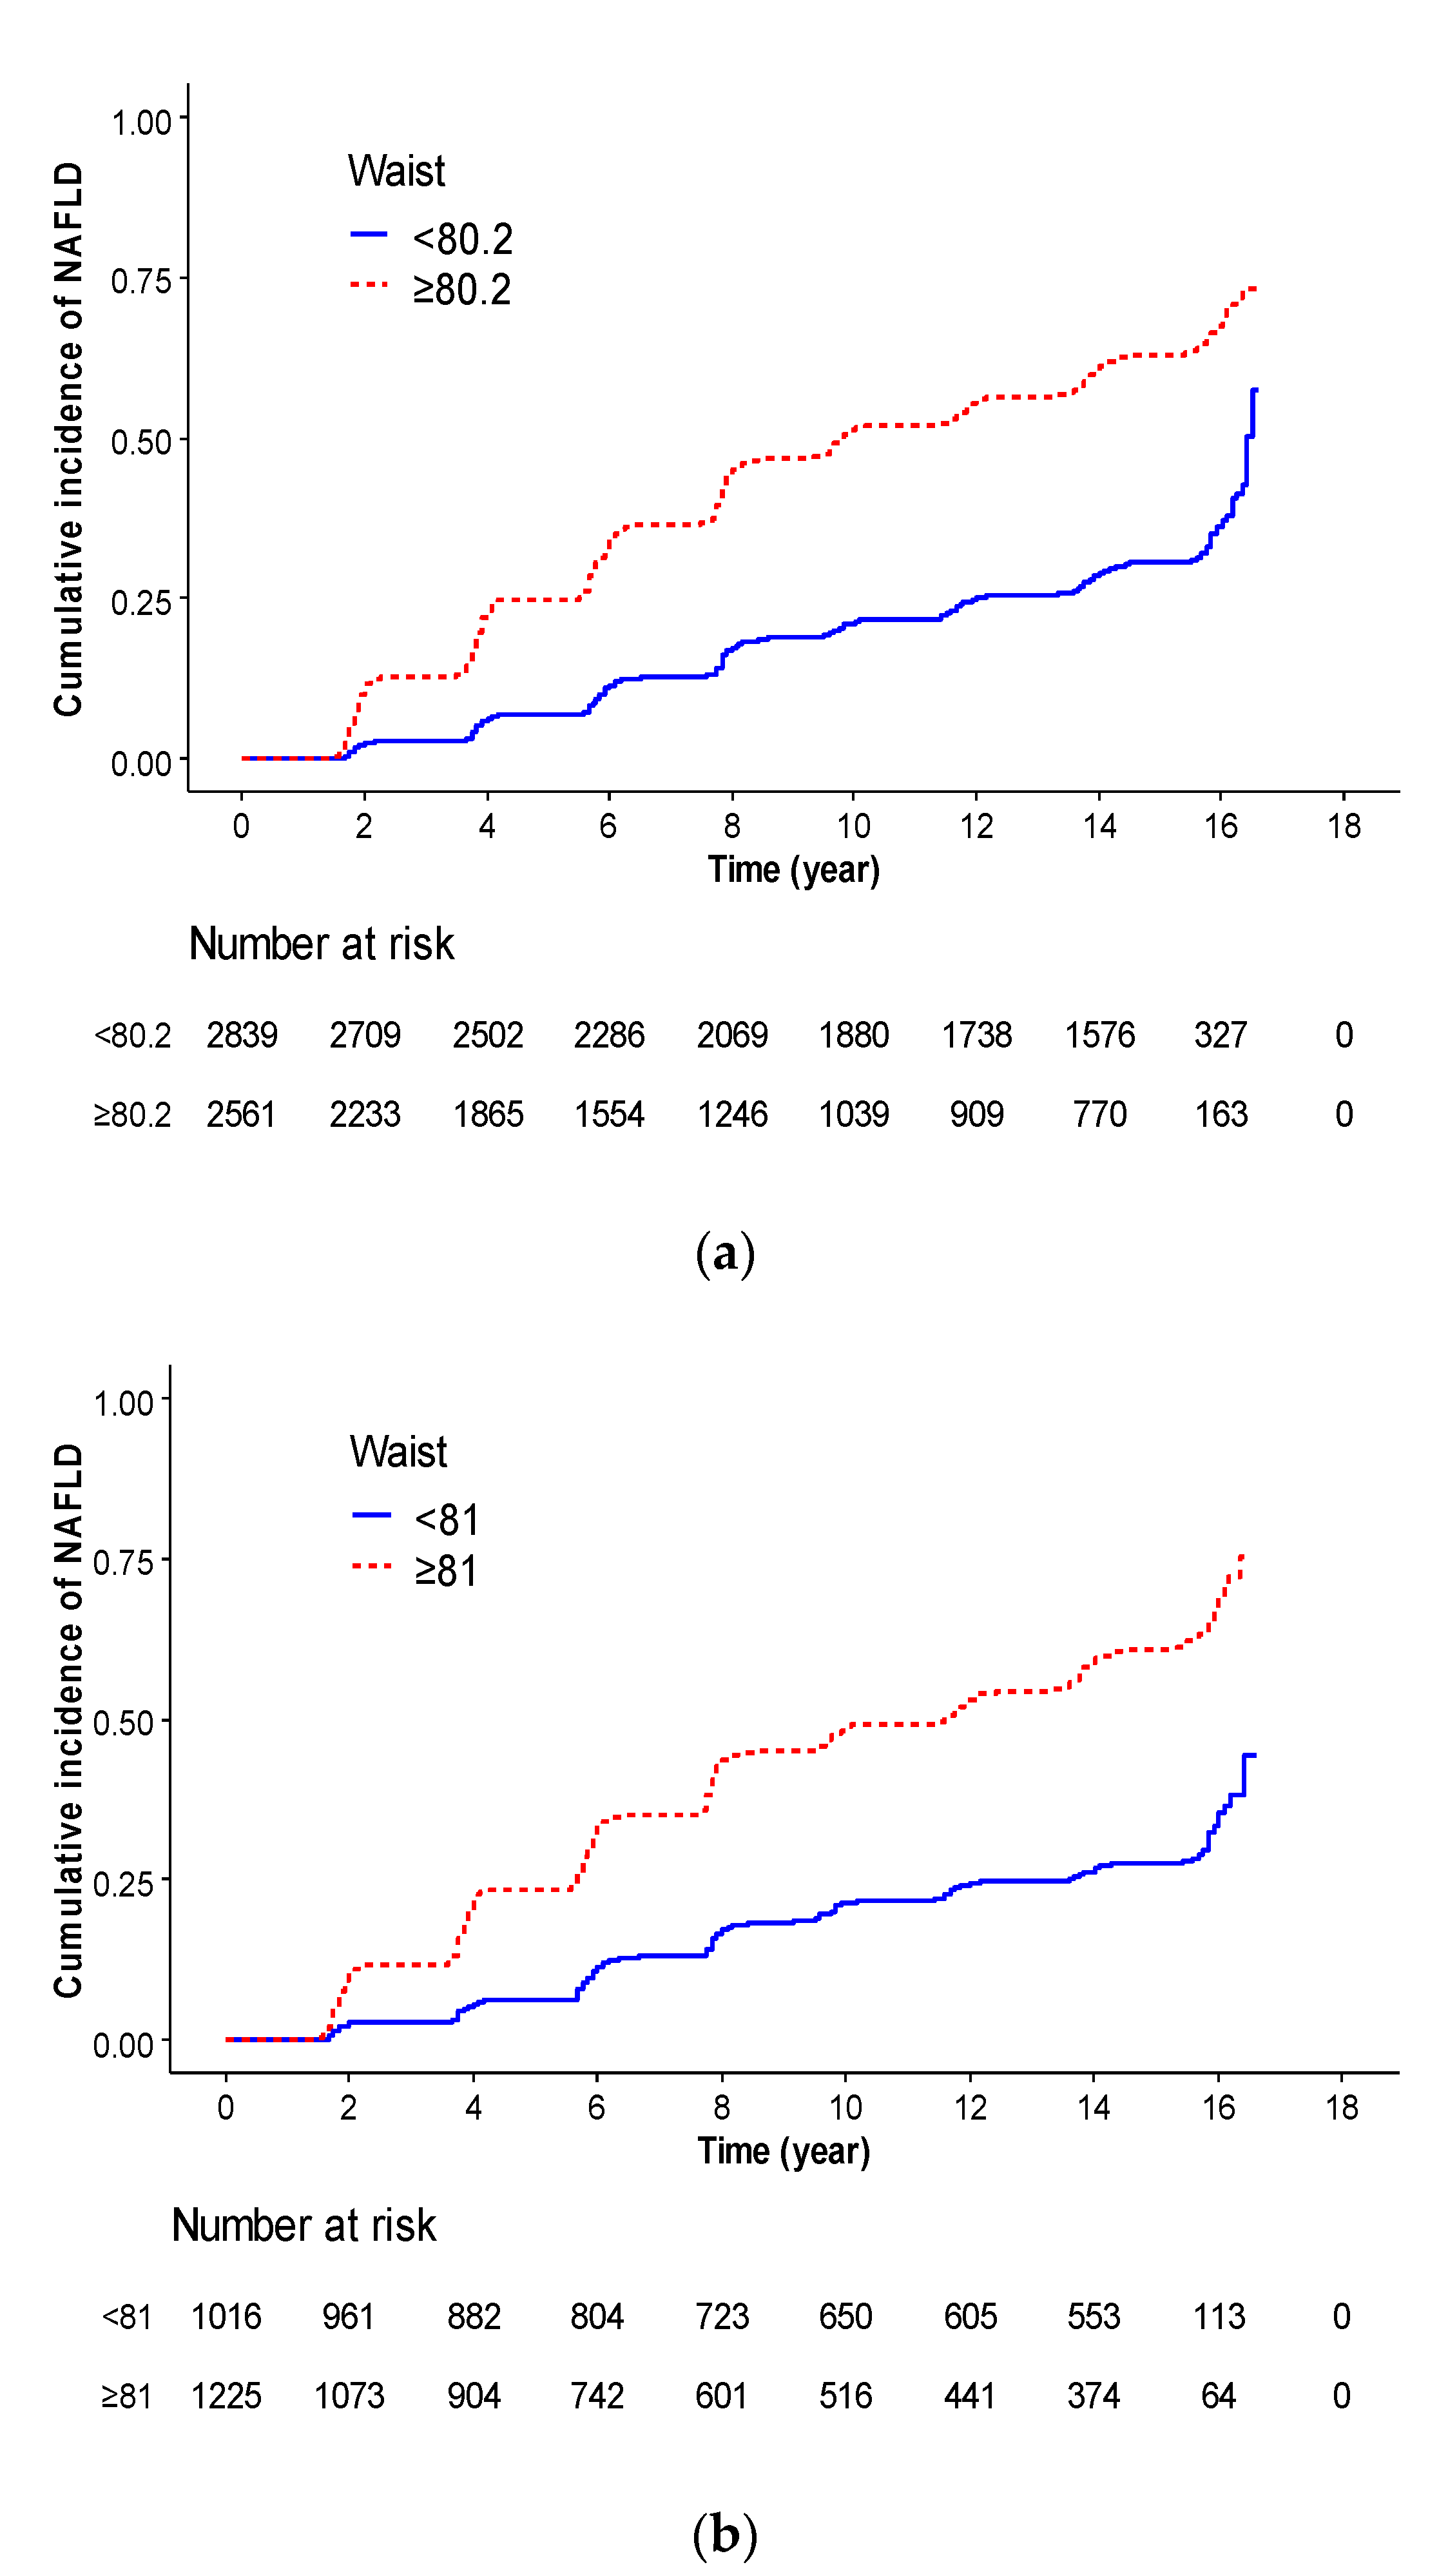
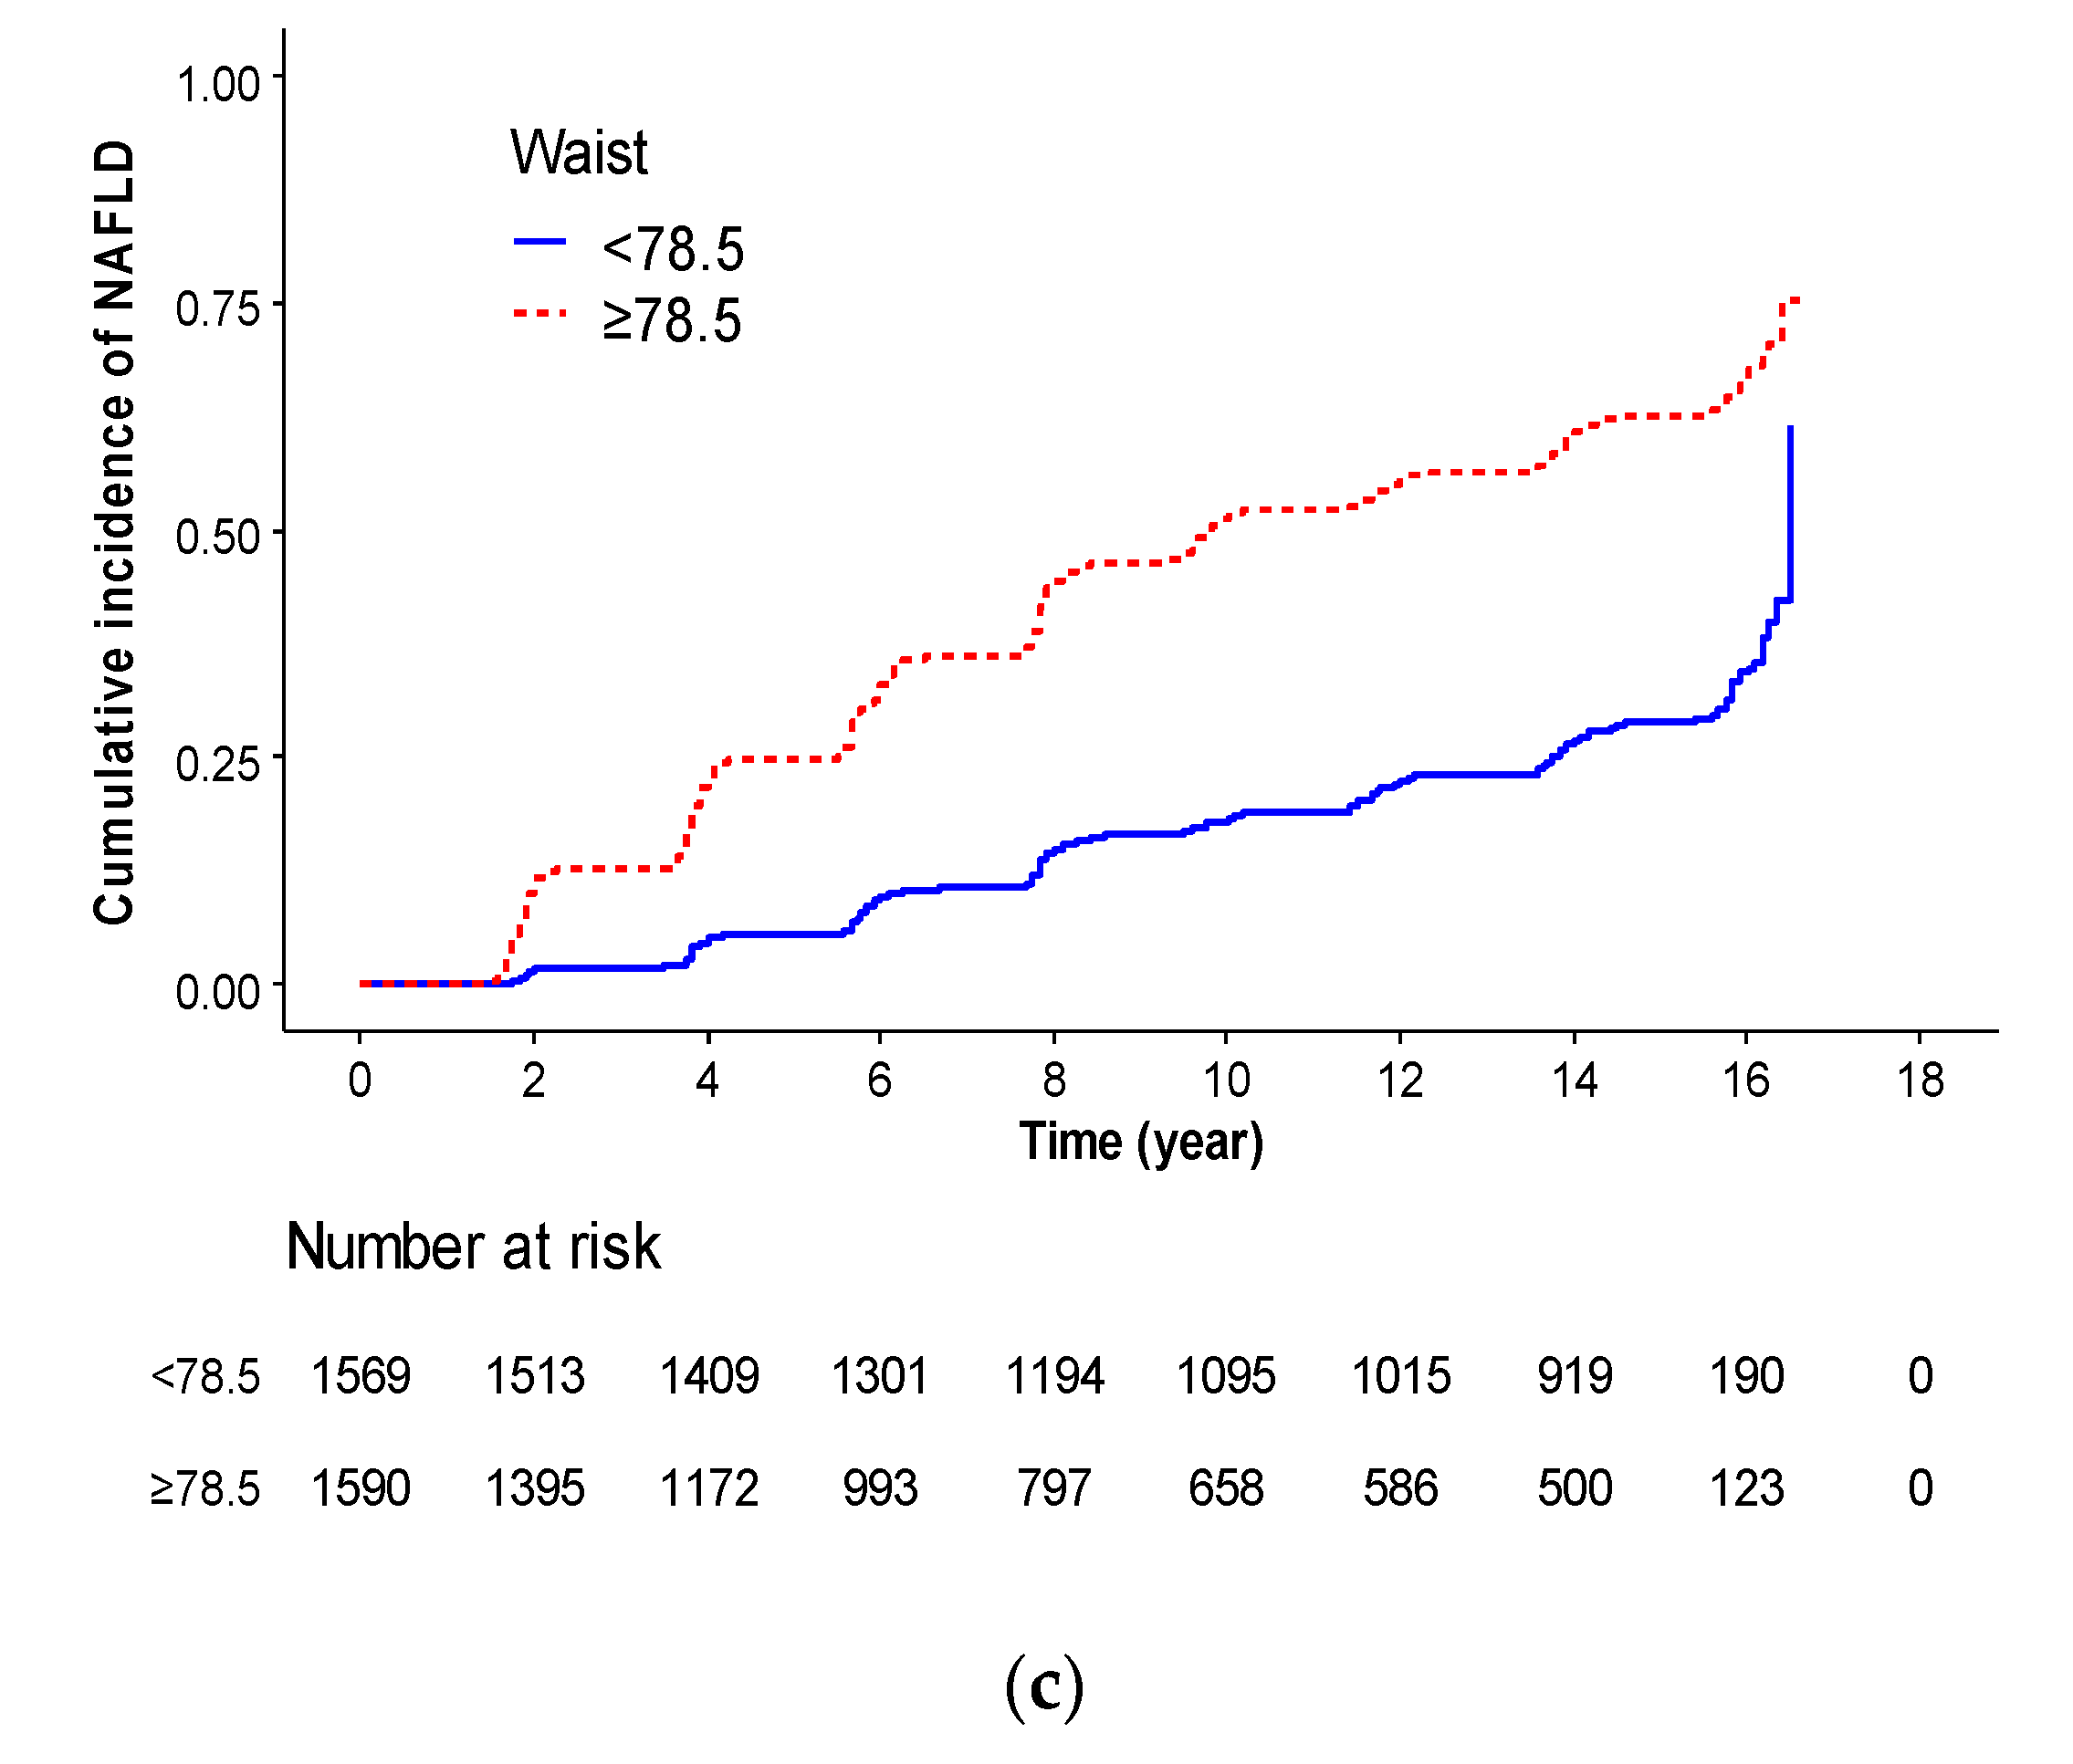
Cutoff Points of Waist Circumference for Predicting Incident Non-Alcoholic Fatty Liver Disease in Middle-Aged and Older Korean Adults
Abstract
:1. Introduction
2. Materials and Methods
2.1. Study Population
2.2. Assessment of Non-Alcoholic Fatty Liver Disease
2.3. Assessment of Body Composition
2.4. Covariates
2.5. Statistical Analysis
3. Results
4. Discussion
5. Conclusions
Supplementary Materials
Author Contributions
Funding
Institutional Review Board Statement
Informed Consent Statement
Data Availability Statement
Acknowledgments
Conflicts of Interest
References
- Younossi, Z.; Anstee, Q.M.; Marietti, M.; Hardy, T.; Henry, L.; Eslam, M.; George, J.; Bugianesi, E. Global burden of nafld and nash: Trends, predictions, risk factors and prevention. Nat. Rev. Gastroenterol. Hepatol. 2018, 15, 11–20. [Google Scholar] [CrossRef]
- Younossi, Z.M.; Koenig, A.B.; Abdelatif, D.; Fazel, Y.; Henry, L.; Wymer, M. Global epidemiology of nonalcoholic fatty liver disease-meta-analytic assessment of prevalence, incidence, and outcomes. Hepatology 2016, 64, 73–84. [Google Scholar] [CrossRef] [PubMed] [Green Version]
- Fan, J.G.; Kim, S.U.; Wong, V.W. New trends on obesity and nafld in asia. J. Hepatol. 2017, 67, 862–873. [Google Scholar] [CrossRef] [PubMed] [Green Version]
- Paik, J.M.; Golabi, P.; Younossi, Y.; Saleh, N.; Nhyira, A.; Younossi, Z.M. The growing burden of disability related to chronic liver disease in the United States: Data from the global burden of disease study 2007–2017. Hepatol. Commun. 2021, 5, 749–759. [Google Scholar] [CrossRef] [PubMed]
- Seto, W.K.; Yuen, M.F. Nonalcoholic fatty liver disease in asia: Emerging perspectives. J. Gastroenterol. 2017, 52, 164–174. [Google Scholar] [CrossRef] [PubMed]
- Sheka, A.C.; Adeyi, O.; Thompson, J.; Hameed, B.; Crawford, P.A.; Ikramuddin, S. Nonalcoholic steatohepatitis: A review. JAMA 2020, 323, 1175–1183. [Google Scholar] [CrossRef]
- Miyake, T.; Miyazaki, M.; Yoshida, O.; Kanzaki, S.; Nakaguchi, H.; Nakamura, Y.; Watanabe, T.; Yamamoto, Y.; Koizumi, Y.; Tokumoto, Y.; et al. Relationship between body composition and the histology of non-alcoholic fatty liver disease: A cross-sectional study. BMC Gastroenterol. 2021, 21, 170. [Google Scholar] [CrossRef] [PubMed]
- Loomis, A.K.; Kabadi, S.; Preiss, D.; Hyde, C.; Bonato, V.; St Louis, M.; Desai, J.; Gill, J.M.; Welsh, P.; Waterworth, D.; et al. Body mass index and risk of nonalcoholic fatty liver disease: Two electronic health record prospective studies. J. Clin. Endocrinol Metab. 2016, 101, 945–952. [Google Scholar] [CrossRef]
- Alferink, L.J.M.; Trajanoska, K.; Erler, N.S.; Schoufour, J.D.; de Knegt, R.J.; Ikram, M.A.; Janssen, H.L.A.; Franco, O.H.; Metselaar, H.J.; Rivadeneira, F.; et al. Nonalcoholic fatty liver disease in the rotterdam study: About muscle mass, sarcopenia, fat mass, and fat distribution. J. Bone Miner. Res. 2019, 34, 1254–1263. [Google Scholar] [CrossRef]
- Lee, J.H.; Lee, H.S.; Lee, B.K.; Kwon, Y.J.; Lee, J.W. Relationship between muscle mass and non-alcoholic fatty liver disease. Biology 2021, 10, 122. [Google Scholar] [CrossRef]
- Lee, M.J.; Kim, E.H.; Bae, S.J.; Kim, G.A.; Park, S.W.; Choe, J.; Jung, C.H.; Lee, W.J.; Kim, H.K. Age-related decrease in skeletal muscle mass is an independent risk factor for incident nonalcoholic fatty liver disease: A 10-year retrospective cohort study. Gut Liver 2019, 13, 67–76. [Google Scholar] [CrossRef] [PubMed] [Green Version]
- Pang, Q.; Zhang, J.Y.; Song, S.D.; Qu, K.; Xu, X.S.; Liu, S.S.; Liu, C. Central obesity and nonalcoholic fatty liver disease risk after adjusting for body mass index. World J. Gastroenterol. 2015, 21, 1650–1662. [Google Scholar] [CrossRef] [PubMed]
- Lee, S.Y.; Park, H.S.; Kim, D.J.; Han, J.H.; Kim, S.M.; Cho, G.J.; Kim, D.Y.; Kwon, H.S.; Kim, S.R.; Lee, C.B.; et al. Appropriate waist circumference cutoff points for central obesity in korean adults. Diabetes Res. Clin. Pract. 2007, 75, 72–80. [Google Scholar] [CrossRef] [PubMed]
- Yoo, H.J.; Park, M.S.; Lee, C.H.; Yang, S.J.; Kim, T.N.; Lim, K.I.; Kang, H.J.; Song, W.; Yeon, J.E.; Baik, S.H.; et al. Cutoff points of abdominal obesity indices in screening for non-alcoholic fatty liver disease in asians. Liver Int. 2010, 30, 1189–1196. [Google Scholar] [CrossRef]
- Kim, Y.; Han, B.G.; Ko, G.E.S.G. Cohort profile: The korean genome and epidemiology study (koges) consortium. Int. J. Epidemiol. 2017, 46, e20. [Google Scholar] [CrossRef]
- Kotronen, A.; Peltonen, M.; Hakkarainen, A.; Sevastianova, K.; Bergholm, R.; Johansson, L.M.; Lundbom, N.; Rissanen, A.; Ridderstråle, M.; Groop, L.; et al. Prediction of non-alcoholic fatty liver disease and liver fat using metabolic and genetic factors. Gastroenterology 2009, 137, 865–872. [Google Scholar] [CrossRef]
- National Center for Health Statistics. Adult Tobacco Use Information. Available online: https://www.cdc.gov/nchs/nhis/tobacco/tobacco_glossary.htm (accessed on 4 July 2021).
- Jang, M.; Won, C.; Choi, H.; Kim, S.; Park, W.; Kim, D.; Jeong, S.; Kim, B. Effects of physical activity on fractures in adults: A community-based korean cohort study. Korean J. Sports Med. 2017, 35, 97–102. [Google Scholar] [CrossRef] [Green Version]
- Contal, C.; O’Quigley, J. An application of changepoint methods in studying the effect of age on survival in breast cancer. Comput. Stat. Data Anal. 1999, 30, 253–270. [Google Scholar] [CrossRef]
- Tison, G.H.; Blaha, M.J.; Nasir, K.; Blumenthal, R.S.; Szklo, M.; Ding, J.; Budoff, M.J. Relation of anthropometric obesity and computed tomography measured nonalcoholic fatty liver disease (from the multiethnic study of atherosclerosis). Am. J. Cardiol. 2015, 116, 541–546. [Google Scholar] [CrossRef] [Green Version]
- van der Poorten, D.; Milner, K.L.; Hui, J.; Hodge, A.; Trenell, M.I.; Kench, J.G.; London, R.; Peduto, T.; Chisholm, D.J.; George, J. Visceral fat: A key mediator of steatohepatitis in metabolic liver disease. Hepatology 2008, 48, 449–457. [Google Scholar] [CrossRef]
- Alberti, K.G.; Zimmet, P.; Shaw, J. The metabolic syndrome—A new worldwide definition. Lancet 2005, 366, 1059–1062. [Google Scholar] [CrossRef]
- Yki-Järvinen, H. Non-alcoholic fatty liver disease as a cause and a consequence of metabolic syndrome. Lancet Diabetes Endocrinol. 2014, 2, 901–910. [Google Scholar] [CrossRef]
- Weisberg, S.P.; McCann, D.; Desai, M.; Rosenbaum, M.; Leibel, R.L.; Ferrante, A.W., Jr. Obesity is associated with macrophage accumulation in adipose tissue. J. Clin. Investig. 2003, 112, 1796–1808. [Google Scholar] [CrossRef] [PubMed]
- Turer, A.T.; Browning, J.D.; Ayers, C.R.; Das, S.R.; Khera, A.; Vega, G.L.; Grundy, S.M.; Scherer, P.E. Adiponectin as an independent predictor of the presence and degree of hepatic steatosis in the dallas heart study. J. Clin. Endocrinol. Metab. 2012, 97, E982–E986. [Google Scholar] [CrossRef] [Green Version]
- Turer, A.T.; Scherer, P.E. Adiponectin: Mechanistic insights and clinical implications. Diabetologia 2012, 55, 2319–2326. [Google Scholar] [CrossRef] [PubMed] [Green Version]
- Balakrishnan, M.; Patel, P.; Dunn-Valadez, S.; Dao, C.; Khan, V.; Ali, H.; El-Serag, L.; Hernaez, R.; Sisson, A.; Thrift, A.P.; et al. Women Have a Lower Risk of Nonalcoholic Fatty Liver Disease but a Higher Risk of Progression vs Men: A Systematic Review and Meta-analysis. Clin. Gastroenterol. Hepatol. 2021, 19, 61–71.e15. [Google Scholar] [CrossRef]
- Appropriate body-mass index for asian populations and its implications for policy and intervention strategies. Lancet 2004, 363, 157–163. [CrossRef]
- Camhi, S.M.; Bray, G.A.; Bouchard, C.; Greenway, F.L.; Johnson, W.D.; Newton, R.L.; Ravussin, E.; Ryan, D.H.; Smith, S.R.; Katzmarzyk, P.T. The relationship of waist circumference and bmi to visceral, subcutaneous, and total body fat: Sex and race differences. Obesity 2011, 19, 402–408. [Google Scholar] [CrossRef]
- Demerath, E.W.; Sun, S.S.; Rogers, N.; Lee, M.; Reed, D.; Choh, A.C.; Couch, W.; Czerwinski, S.A.; Chumlea, W.C.; Siervogel, R.M.; et al. Anatomical patterning of visceral adipose tissue: Race, sex, and age variation. Obesity 2007, 15, 2984–2993. [Google Scholar] [CrossRef]
- Grundy, S.M.; Cleeman, J.I.; Daniels, S.R.; Donato, K.A.; Eckel, R.H.; Franklin, B.A.; Gordon, D.J.; Krauss, R.M.; Savage, P.J.; Smith, S.C., Jr.; et al. Diagnosis and management of the metabolic syndrome: An american heart association/national heart, lung, and blood institute scientific statement. Circulation 2005, 112, 2735–2752. [Google Scholar] [CrossRef] [Green Version]
- Lonardo, A.; Ballestri, S.; Marchesini, G.; Angulo, P.; Loria, P. Nonalcoholic fatty liver disease: A precursor of the metabolic syndrome. Dig. Liver Dis. 2015, 47, 181–190. [Google Scholar] [CrossRef] [PubMed] [Green Version]
- Srikanthan, P.; Karlamangla, A.S. Relative muscle mass is inversely associated with insulin resistance and prediabetes. Findings from the third national health and nutrition examination survey. J. Clin. Endocrinol. Metab. 2011, 96, 2898–2903. [Google Scholar] [CrossRef] [PubMed] [Green Version]
- Cho, A.R.; Lee, J.H.; Kwon, Y.J. Differences among three skeletal muscle mass indices in predicting non-alcoholic fatty liver disease: Korean nationwide population-based study. Life 2021, 11, 751. [Google Scholar] [CrossRef] [PubMed]
- Park, H.; Jun, D.W.; Park, H.K.; Park, K.Y.; Kim, M.; Hwang, H.S. A critical appraisal of the definition of sarcopenia in patients with non-alcoholic fatty liver disease: Pitfall of adjusted muscle mass by body weight. Life 2020, 10, 218. [Google Scholar] [CrossRef] [PubMed]
- Böhm, A.; Heitmann, B.L. The use of bioelectrical impedance analysis for body composition in epidemiological studies. Eur. J. Clin. Nutr. 2013, 67 (Suppl. 1), S79–S85. [Google Scholar] [CrossRef]


| Variables | Total (n = 5400) | Men (n = 2241) | Women (n = 3159) | p |
|---|---|---|---|---|
| Age, years | 51.7 ± 8.8 | 52.1 ± 8.8 | 51.3 ± 8.8 | 0.001 |
| WC, cm | 80.0 ± 8.1 | 81.2 ± 6.9 | 79.1 ± 8.7 | <0.001 |
| Body fat, % | 26.3 ± 7.2 | 20.4 ± 4.9 | 30.5 ± 5.3 | <0.001 |
| BMI, kg/m2 | 23.9 ± 2.9 | 23.5 ± 2.6 | 24.1 ± 3.0 | <0.001 |
| TMM, kg | 42.0 ± 7.6 | 48.8 ± 6.0 | 37.2 ± 4.2 | <0.001 |
| Height-adjusted TMM, kg/m2 | 16.5 ± 1.7 | 17.6 ± 1.5 | 15.7 ± 1.2 | <0.001 |
| BMI-adjusted TMM, m2 | 1.8 ± 0.3 | 2.1 ± 0.2 | 1.6 ± 0.2 | <0.001 |
| Body weight, kg | 60.5 ± 9.1 | 65.1 ± 8.8 | 57.2 ± 7.8 | <0.001 |
| Smoking status, n (%) | <0.001 | |||
| Non-smoker | 3561 (66.8) | 578 (25.9) | 2983 (96.2) | |
| Ex-smoker | 683 (12.8) | 653 (29.3) | 30 (1.0) | |
| Intermittent smoker | 114 (2.1) | 89 (4.0) | 25 (0.8) | |
| Every day smoker | 973 (18.3) | 910 (40.8) | 63 (2.0) | |
| Physical activity, n (%) | <0.001 | |||
| Low (< 7.5 METS-h/wk) | 392 (7.6) | 121 (5.6) | 271 (8.9) | |
| Moderate (7.5–30 METS-h/wk) | 3148 (60.6) | 1241 (57.8) | 1907 (62.7) | |
| High (> 30 METS-h/wk) | 1651 (31.8) | 787 (36.6) | 864 (28.4) | |
| Alcohol drinking, yes, n (%) | 2305 (43.0) | 1440 (64.7) | 865 (27.7) | <0.001 |
| Total energy intake, kcal/day | 1937.1 ± 706.1 | 1997.7 ± 665.8 | 1894.1 ± 730.4 | <0.001 |
| MBP, mmHg | 94.0 ± 12.6 | 95.6 ± 11.9 | 92.8 ± 13.0 | <0.001 |
| FPG, mg/dL | 82.6 ± 11.8 | 84.3 ± 12.6 | 81.4 ± 11.1 | <0.001 |
| Insulin, μU/mL | 6.3 (4.8;8.2] | 5.8 (4.5;7.5) | 6.7 (5.2;8.7) | <0.001 |
| TC, mg/dL | 188.0 ± 33.6 | 189.3 ± 33.8 | 187.0 ± 33.4 | 0.0142 |
| TG, mg/dL | 119.0 (92.0;156.0) | 128.0 (98.0;171.0) | 113.0 (88.0;147.0) | <0.001 |
| HDL-C, mg/dL | 46.1 ± 9.9 | 44.4 ± 9.5 | 47.2 ± 10.0 | <0.001 |
| CRP, mg/dL | 0.23 ± 0.60 | 0.24 ± 0.51 | 0.22 ± 0.65 | 0.185 |
| ALT, IU/L | 22.1 ± 8.8 | 25.9 ± 10.0 | 19.5 ± 6.8 | <0.001 |
| AST, IU/L | 26.4 ± 6.9 | 28.1 ± 7.4 | 25.2 ± 6.2 | <0.001 |
| Steroid medication, n (%) | 5 (0.1) | 1 (0.0) | 4 (0.1) | 1.000 |
| Anticonvulsant medication, n (%) | 3 (0.0) | 2 (0.1) | 1 (0.0) | 1.000 |
| HTN medication, n (%) | 351 (6.5) | 110 (4.9) | 241 (7.6) | 0.014 |
| DM medication n (%) | 13 (0.2) | 10 (0.4) | 3 (0.1) | 1.000 |
| Dyslipidemia medication, n (%) | 10 (0.2) | 7 (0.3) | 3 (0.1) | 0.790 |
| Total | Univariable Model | Multivariable Model 1 | Multivariable Model 2 | Multivariable Model 3 | ||||
|---|---|---|---|---|---|---|---|---|
| HR (95% CI) | p | HR (95% CI) | p | HR (95% CI) | p | HR (95% CI) | p | |
| WC, cm | 1.07 (1.07–1.08) | <0.001 | 1.07 (1.07–1.08) | <0.001 | 1.07 (1.07–1.08) | <0.001 | 1.07 (1.06–1.07) | <0.001 |
| Body fat, % | 1.05 (1.04–1.05) | <0.001 | 1.10 (1.09–1.10) | <0.001 | 1.10 (1.09–1.11) | <0.001 | 1.09 (1.08–1.09) | <0.001 |
| BMI, kg/m2 | 1.21 (1.19–1.22) | <0.001 | 1.22 (1.20–1.23) | <0.001 | 1.22 (1.20–1.24) | <0.001 | 1.19 (1.18–1.21) | <0.001 |
| TMM/Ht2, kg/m2 | 1.21 (1.18–1.24) | <0.001 | 1.37 (1.33–1.41) | <0.001 | 1.38 (1.33–1.42) | <0.001 | 1.32 (1.28–1.36) | <0.001 |
| TMM/BMI | 0.56 (0.49–0.64) | <0.001 | 0.20 (0.16–0.24) | <0.001 | 0.19 (0.15–0.24) | <0.001 | 0.26 (0.20–0.33) | <0.001 |
| Men | ||||||||
| WC, cm | 1.09 (1.08–1.10) | <0.001 | 1.09 (1.08–1.10) | <0.001 | 1.10 (1.09–1.11) | <0.001 | 1.09 (1.08–1.10) | <0.001 |
| Body fat, % | 1.09 (1.08–1.10) | <0.001 | 1.09 (1.08–1.11) | <0.001 | 1.10 (1.09–1.11) | <0.001 | 1.09 (1.07–1.10) | <0.001 |
| BMI, kg/m2 | 1.23 (1.20–1.26) | <0.001 | 1.23 (1.20–1.26) | <0.001 | 1.25 (1.22–1.28) | <0.001 | 1.22 (1.19–1.25) | <0.001 |
| TMM/Ht2, kg/m2 | 1.28 (1.27–1.34) | <0.001 | 1.29 (1.23–1.35) | <0.001 | 1.30 (1.24–1.36) | <0.001 | 1.27 (1.21–1.33) | <0.001 |
| TMM/BMI | 0.33 (0.25–0.44) | <0.001 | 0.27 (0.20–0.37) | <0.001 | 0.24 (0.18–0.34) | <0.001 | 0.34 (0.25–0.48) | <0.001 |
| Women | ||||||||
| WC, cm | 1.07 (1.06–1.07) | <0.001 | 1.06 (1.06–1.07) | <0.001 | 1.06 (1.06–1.07) | <0.001 | 1.06 (1.05–1.07) | <0.001 |
| Body fat, % | 1.10 (1.09–1.12) | <0.001 | 1.10 (1.09–1.11) | <0.001 | 1.10 (1.09–1.11) | <0.001 | 1.09 (1.08–1.10) | <0.001 |
| BMI, kg/m2 | 1.21 (1.19–1.23) | <0.001 | 1.21 (1.19–1.23) | <0.001 | 1.20 (1.18–1.23) | <0.001 | 1.18 (1.16–1.21) | <0.001 |
| TMM/Ht2, kg/m2 | 1.38 (1.32–1.44) | <0.001 | 1.417 (1.36–1.48) | <0.001 | 1.42 (1.36–1.48) | <0.001 | 1.36 (1.30–1.42) | <0.001 |
| TMM/BMI | 0.11 (0.08–0.14) | <0.001 | 0.13 (0.10–0.18) | <0.001 | 0.14 (0.10–0.19) | <0.001 | 0.18 (0.13–0.25) | <0.001 |
| Unadjusted | Model 1 | Model 2 | Model 3 | ||||||
|---|---|---|---|---|---|---|---|---|---|
| HR (95% CI) | p | HR (95% CI) | p | HR (95% CI) | p | HR (95% CI) | p | ||
| Total | WC | ||||||||
| < 80.2 | reference | reference | reference | reference | |||||
| ≥80.2 | 2.75 (2.53–2.99) | <0.001 | 2.76 (2.53–3.01) | <0.001 | 2.76 (2.53–3.02) | <0.001 | 2.44 (2.23–2.67) | <0.001 | |
| Men | WC | ||||||||
| <81 | reference | reference | reference | reference | |||||
| ≥81 | 2.88 (2.50–3.32) | <0.001 | 2.87 (2.50–3.31) | <0.001 | 2.99 (2.58–3.46) | <0.001 | 2.65 (2.28–3.08) | <0.001 | |
| Women | WC | ||||||||
| <78.5 | reference | reference | reference | reference | |||||
| ≥78.5 | 2.93 (2.62–3.28) | <0.001 | 2.77 (2.47–3.12) | <0.001 | 2.77 (2.45–3.13) | <0.001 | 2.54 (2.25–2.87) | <0.001 | |
Publisher’s Note: MDPI stays neutral with regard to jurisdictional claims in published maps and institutional affiliations. |
© 2022 by the authors. Licensee MDPI, Basel, Switzerland. This article is an open access article distributed under the terms and conditions of the Creative Commons Attribution (CC BY) license (https://creativecommons.org/licenses/by/4.0/).
Share and Cite
Lee, J.-H.; Jeon, S.; Lee, H.S.; Kwon, Y.-J. Cutoff Points of Waist Circumference for Predicting Incident Non-Alcoholic Fatty Liver Disease in Middle-Aged and Older Korean Adults. Nutrients 2022, 14, 2994. https://doi.org/10.3390/nu14142994
Lee J-H, Jeon S, Lee HS, Kwon Y-J. Cutoff Points of Waist Circumference for Predicting Incident Non-Alcoholic Fatty Liver Disease in Middle-Aged and Older Korean Adults. Nutrients. 2022; 14(14):2994. https://doi.org/10.3390/nu14142994
Chicago/Turabian StyleLee, Jun-Hyuk, Soyoung Jeon, Hye Sun Lee, and Yu-Jin Kwon. 2022. "Cutoff Points of Waist Circumference for Predicting Incident Non-Alcoholic Fatty Liver Disease in Middle-Aged and Older Korean Adults" Nutrients 14, no. 14: 2994. https://doi.org/10.3390/nu14142994
APA StyleLee, J.-H., Jeon, S., Lee, H. S., & Kwon, Y.-J. (2022). Cutoff Points of Waist Circumference for Predicting Incident Non-Alcoholic Fatty Liver Disease in Middle-Aged and Older Korean Adults. Nutrients, 14(14), 2994. https://doi.org/10.3390/nu14142994


