
High-Fat or High-Carbohydrate Meal—Does It Affect the Metabolism of Men with Excess Body Weight?

 ,
,  , ,
, ,
Abstract
:1. Introduction
2. Materials and Methods
2.1. Biochemical Analysis
2.2. Calorimetry Measurements
2.3. Statistical Analysi
3. Results
3.1. Blood Glucose Concentration
3.2. Serum Insulin Concentration
3.3. Triglyceride Concentrations
3.4. Homocysteine Concentrations
3.5. Indirect Calorimetry
3.5.1. Energy Expenditure
3.5.2. Glucose Oxidation
3.5.3. Lipid Oxidation
4. Discussion
5. Conclusions
- It was observed that following a high-fat or high-carbohydrate meal, men with excessive body weight metabolize the main nutrients differently than men with normal body weight, and postprandial insulin secretion is also different (even without any significant differences in glucose concentrations).
- Overweight/obesity, which is in itself a risk factor for cardiovascular disease, contributes to an increase in the concentration of other risk factors such as the concentration of homocysteine and triglycerides, which is referred to as cardiometabolic risk.
- Consumption of a high-fat meal increased the number of potential risk factors for cardiovascular diseases (homocysteine and triglycerides) compared to a high-carbohydrate meal.
Supplementary Materials
Author Contributions
Funding
Institutional Review Board Statement
Informed Consent Statement
Data Availability Statement
Acknowledgments
Conflicts of Interest
References
- World Health Organization. Obesity and Overweight. 2020. Available online: https://www.who.int/news-room/fact-sheets/detail/obesity-and-overweight (accessed on 7 June 2022).
- Olszanecka-Glinianowicz, M.; Ostrowska, L.; Płaczkiewicz-Jankowska, E. Otyłość. In Interna Szczeklika; Szczeklik, A., Piotr, G., Eds.; Medycyna Praktyczna: Krakow, Poland, 2021; Volume wyd.12, p. 2745. [Google Scholar]
- Jia, A.; Xu, S.; Xing, Y.; Zhang, W.; Yu, X.; Zhao, Y.; Ming, J.; Ji, Q. Prevalence and cardiometabolic risks of normal weight obesity in Chinese population: A nationwide study. Nutr. Metab. Cardiovasc. Dis. 2018, 28, 1045–1053. [Google Scholar] [CrossRef] [PubMed]
- O’Keefe, J.H.; Bell, D.S. Postprandial hyperglycemia/hyperlipidemina (postprandial dysmetabolism) is a cardiovascular risk factor. Am. J. Cardio 2007, 100, 899–904. [Google Scholar] [CrossRef] [PubMed]
- Lairon, D.; Lopez-Miranda, J.; Williams, C. Methodology for studying postprandial lipid metabolism. Eur. J. Clin. Nutr. 2007, 61, 1145–1161. [Google Scholar] [CrossRef] [PubMed]
- Piepoli, M.F.; et. ds. Wytyczne ESC Dotyczące Prewencji Chorób Układu Sercowo-Naczyniowego W Praktyce Klinicznej w 2016 roku. (S.W.G.R.E.T.K.) s. Kardiol Pol. 2016, 74, 821–936. Available online: https://ptkardio.pl/wytyczne/14-wytyczne_esc_dotyczace_prewencji_chorob_ukladu_sercowo_naczyniowego_w_praktyce_klinicznej (accessed on 7 June 2022). [CrossRef] [PubMed] [Green Version]
- Zielińska, M.; Buczkowska-Radlińska, J. The impact of a low-carbohydrate diet on human health. Pomeranian J. Life Sci. 2017, 63, 56–61. [Google Scholar]
- Hu, T.; Bazzano, A.L. The low-carbohydrate diet and cardiovascular risk factors: Evidence from epidemiologic studiem. Nutr. Metab. Cardiovasc Dis. 2014, 24, 337–343. [Google Scholar] [CrossRef] [PubMed] [Green Version]
- Bell, D.S.; O’Keefe, J.H.; Jellinger, P. Postprandial dysmetabolism: The missing link between diabetes and cardiovascular events? Endocr. Pract. 2008, 14, 112–124. [Google Scholar] [CrossRef]
- Pappas, C.; Kandaraki, E.A.; Tsirona, S.; Kountouras, D.; Kassi, G.; Diamanti-Kandarakis, E. Postprandial dysmetabolism: Too early or too late? Hormones 2016, 15, 321–344. [Google Scholar] [CrossRef] [Green Version]
- Shi, H.; Seeley, R.J.; Clegg, D.J. Sexual differences in the control of energy homeostasis. Front. Neuroendocr. 2009, 30, 396–404. [Google Scholar] [CrossRef] [Green Version]
- Sugiyama, M.G.; Agellon, L.B. Sex differences in lipid metabolism and metabolic disease risk. Biochem. Cell Biol. 2012, 90, 124–141. [Google Scholar] [CrossRef]
- Ford, E.S. Prevalence of the metabolic syndrome defined by the International Diabetes Federation among adults in the U.S. Diabetes Care 2005, 28, 2745–2749. [Google Scholar] [CrossRef] [PubMed] [Green Version]
- Lam, Y.Y.; Ravussin, E. Indirect calorimetry: An indispensable tool to understand and predict obesity. Eur. J. Clin. Nutr. 2017, 71, 318–322. [Google Scholar] [CrossRef] [PubMed]
- Adamska-Patruno, E.; Ostrowska, L.; Golonko, A.; Pietraszewska, B.; Goscik, J.; Kretowski, A.; Gorska, M. Evaluation of Energy Expenditure and Oxidation of Energy Substrates in Adult Males after Intake of Meals with Varying Fat and Carbohydrate Content. Nutrients 2018, 10, 627. [Google Scholar] [CrossRef] [Green Version]
- Urbain, P.; Strom, L.; Morawski, L.; Wehrle, A.; Deibert, P.; Bertz, H. Impact of a 6-week non-energy-restricted ketogenic diet on physical fitness, body composition and biochemical parameters in healthy adults. Nutr. Metab. 2017, 14, 17. [Google Scholar] [CrossRef] [PubMed] [Green Version]
- Raben, A.; Agerholm-Larsen, L.; Flint, A.; Holst, J.J.; Astrup, A. Meals with similar energy densities but rich in protein, fat, carbohydrate, or alcohol have different effects on energy expenditure and substrate metabolism but not on appetite and energy intake. Am. J. Clin. Nutr. 2003, 77, 91–100. [Google Scholar] [CrossRef] [PubMed] [Green Version]
- El Khoury, D.; Hwalla, N. Metabolic and Appetite Hormone Responses of Hyperinsulinemic Normoglycemic Males to Meals with Varied Macronutrient Compositions. Ann. Nutr. Metab. 2010, 57, 59–67. [Google Scholar] [CrossRef] [PubMed]
- Wycherley, T.; Brinkworth, G.D.; Keogh, J.B.; Noakes, M.; Buckley, J.; Clifton, P. Long-term effects of weight loss with a very low carbohydrate and low fat diet on vascular function in overweight and obese patients. J. Intern. Med. 2010, 267, 452–461. [Google Scholar] [CrossRef]
- de Roos, N.M.; Bots, M.L.; Siebelink, E.; Schouten, E.; Katan, M.B. Flow-mediated vasodilation is not impaired when HDL-cholesterol is lowered by substituting carbohydrates for monounsaturated fat. Br. J. Nutr. 2001, 86, 181–188. [Google Scholar] [CrossRef] [Green Version]
- Lu, M.; Wan, Y.; Yang, B.; Huggins, C.E.; Li, D. Effects of low-fat compared with high-fat diet on cardiometabolic indicators in people with overweight and obesity without overt metabolic disturbance: A systematic review and meta-analysis of randomised controlled trials. Br. J. Nutr. 2018, 119, 96–108. [Google Scholar] [CrossRef]
- Grabysa, R. Hyperhomocysteinemia: A real risk factor for atheroclerosis? Pol. Prz. Kardiol. 2007, 9, 289–293. [Google Scholar]
- Eckel, N.; Meidtner, K.; Kalle-Uhlmann, T.; Stefan, N.; Schulze, M.B. Metabolically healthy obesity and cardiovascular events: A systematic review and meta-analysis. Eur. J. Prev. Cardiol. 2016, 23, 956–966. [Google Scholar] [CrossRef] [PubMed]
- Ding, C.; Chan, Z.; Chooi, Y.C.; Choo, J.; Sadananthan, S.A.; Chang, A.; Sasikala, S.; Michael, N.; Velan, S.S.; Magkos, F. Regulation of glucose metabolism in nondiabetic, metabolically obese normal-weight Asians. Am. J. Physiol. Metab. 2018, 314, E494–E502. [Google Scholar] [CrossRef] [PubMed]
- Grieb, P.; Kłapcińska, B.; Smol, E.; Pilis, T.; Pilis, W.; Sadowska-Krępa, E.; Sobczak, A.; Bartoszewicz, Z.; Nauman, J.; Stańczak, K.; et al. Long-term consumption of a carbohydrate-restricted diet does not induce deleterious metabolic effects. Nutr. Res. 2008, 28, 825–833. [Google Scholar] [CrossRef] [PubMed]


| GS (n = 13) | GC (n = 13) | p | |
|---|---|---|---|
| Age (years) | 37.42 ± 3.15 | 32.10 ± 3.12 | 0.2431 |
| BMI (kg/m2) | 32.36 ± 2.03 | 23.81 ± 0.21 | 0.0003 * |
| HC Meal (Nutridrink Fat-Free) Meal Portion: 300 mL | HF Meal (Calogen) Meal Portion: 95 mL | |
|---|---|---|
| Energy value | 450 kcal | 450 kcal |
| Carbohydrates | 100.5 g | 4.0 g |
| % of energy | 89.3% | 4% |
| Mono-and disaccharides | 42.3 g | 3.8 g |
| Glucose | 1.0 g | 0 g |
| Fructose | 0 g | 0 g |
| Lactose | <0.0075 g | 0 g |
| Maltose | 36.3 g | 0 g |
| Saccharose | 5.0 g | 3.8 g |
| Polysaccharides | 57.9 g | 0 g |
| Fats | 0 g | 47.5 g |
| % of energy | 0% | 96% |
| Saturated fat | 0g | 5 g |
| Vegetable fat | 0 g | 42.5 g |
| Milk fat | 0 g | 0 g |
| Monounsaturated fats | 0 g | 28.9 g |
| Polyunsaturated fats | 0 g | 13.6 g |
| Cholesterol | 0 mg | 0 mg |
| Protein | 12 g | 0 g |
| % of energy | 10.7% | 0% |
| % of energy | ||
| Fiber | 0 g | 0 g |
| High-Fat Meal (HF) | ||||||||||||
| Glucose (mg/dL) | Insulin (IU/mL) | Triglycerides (mg/dL) | Homocysteine (µmol/L) | |||||||||
| Time | GS | GC | p | GS | GC | p | GS | GC | p | GS | GC | p |
| 0′ | 98.4 ± 10.58 | 94.5 ± 8.98 | 0.6622 | 14.7 ± 14.36 | 8.2 ± 2.30 | 0.0812 | 122.0 ± 58.36 | 80.5 ± 35.92 | 0.0377 | 17.3 ± 7.73 | 15.7 ± 5.78 | 0.3172 |
| 30′ | 95.3 ± 10.37 | 92.7 ± 9.29 | 0.8772 | 21.3 ± 21.88 | 10.1 ± 3.89 | 0.0355 | 127.1 ± 65.81 | 81.3 ± 37.01 | 0.0256 | 16.9 ± 6.03 | 13.8 ± 2.53 | 0.0686 |
| 60′ | 88.6 ± 12.44 | 89.9 ± 7.92 | 0.5041 | 21.1 ± 18.12 | 9.6 ± 3.72 | 0.0024 | 126.3 ± 77.72 | 84.3 ± 34.47 | 0.0576 | 24.7 ± 14.01 | 14.4 ± 2.35 | 0.0292 |
| 120′ | 89.7 ± 9.90 | 89.7 ± 6.40 | 0.4399 | 17.6 ± 10.77 | 8.4 ± 2.13 | 0.0065 | 166.3 ± 97.78 | 109.9 ± 34.51 | 0.0158 | 21.5 ± 6.91 | 13.0 ± 2.60 | 0.0011 |
| 180′ | 91.6 ± 9.26 | 88.0 ± 5.78 | 0.4257 | 15.4 ± 11.45 | 8.1 ± 2.66 | 0.0159 | 205.9 ± 91.93 | 136.5 ± 48.25 | 0.0311 | 22.9 ± 14.81 | 14.6 ± 4.82 | 0.2701 |
| 240′ | 90.9 ± 7.18 | 89.3 ± 6.77 | 0.9794 | 12.4 ± 8.27 | 8.5 ± 3.28 | 0.2184 | 206.6 ± 91.53 | 148.5 ± 72.81 | 0.1508 | 23.2 ± 10.80 | 14.7 ± 2.88 | 0.0377 |
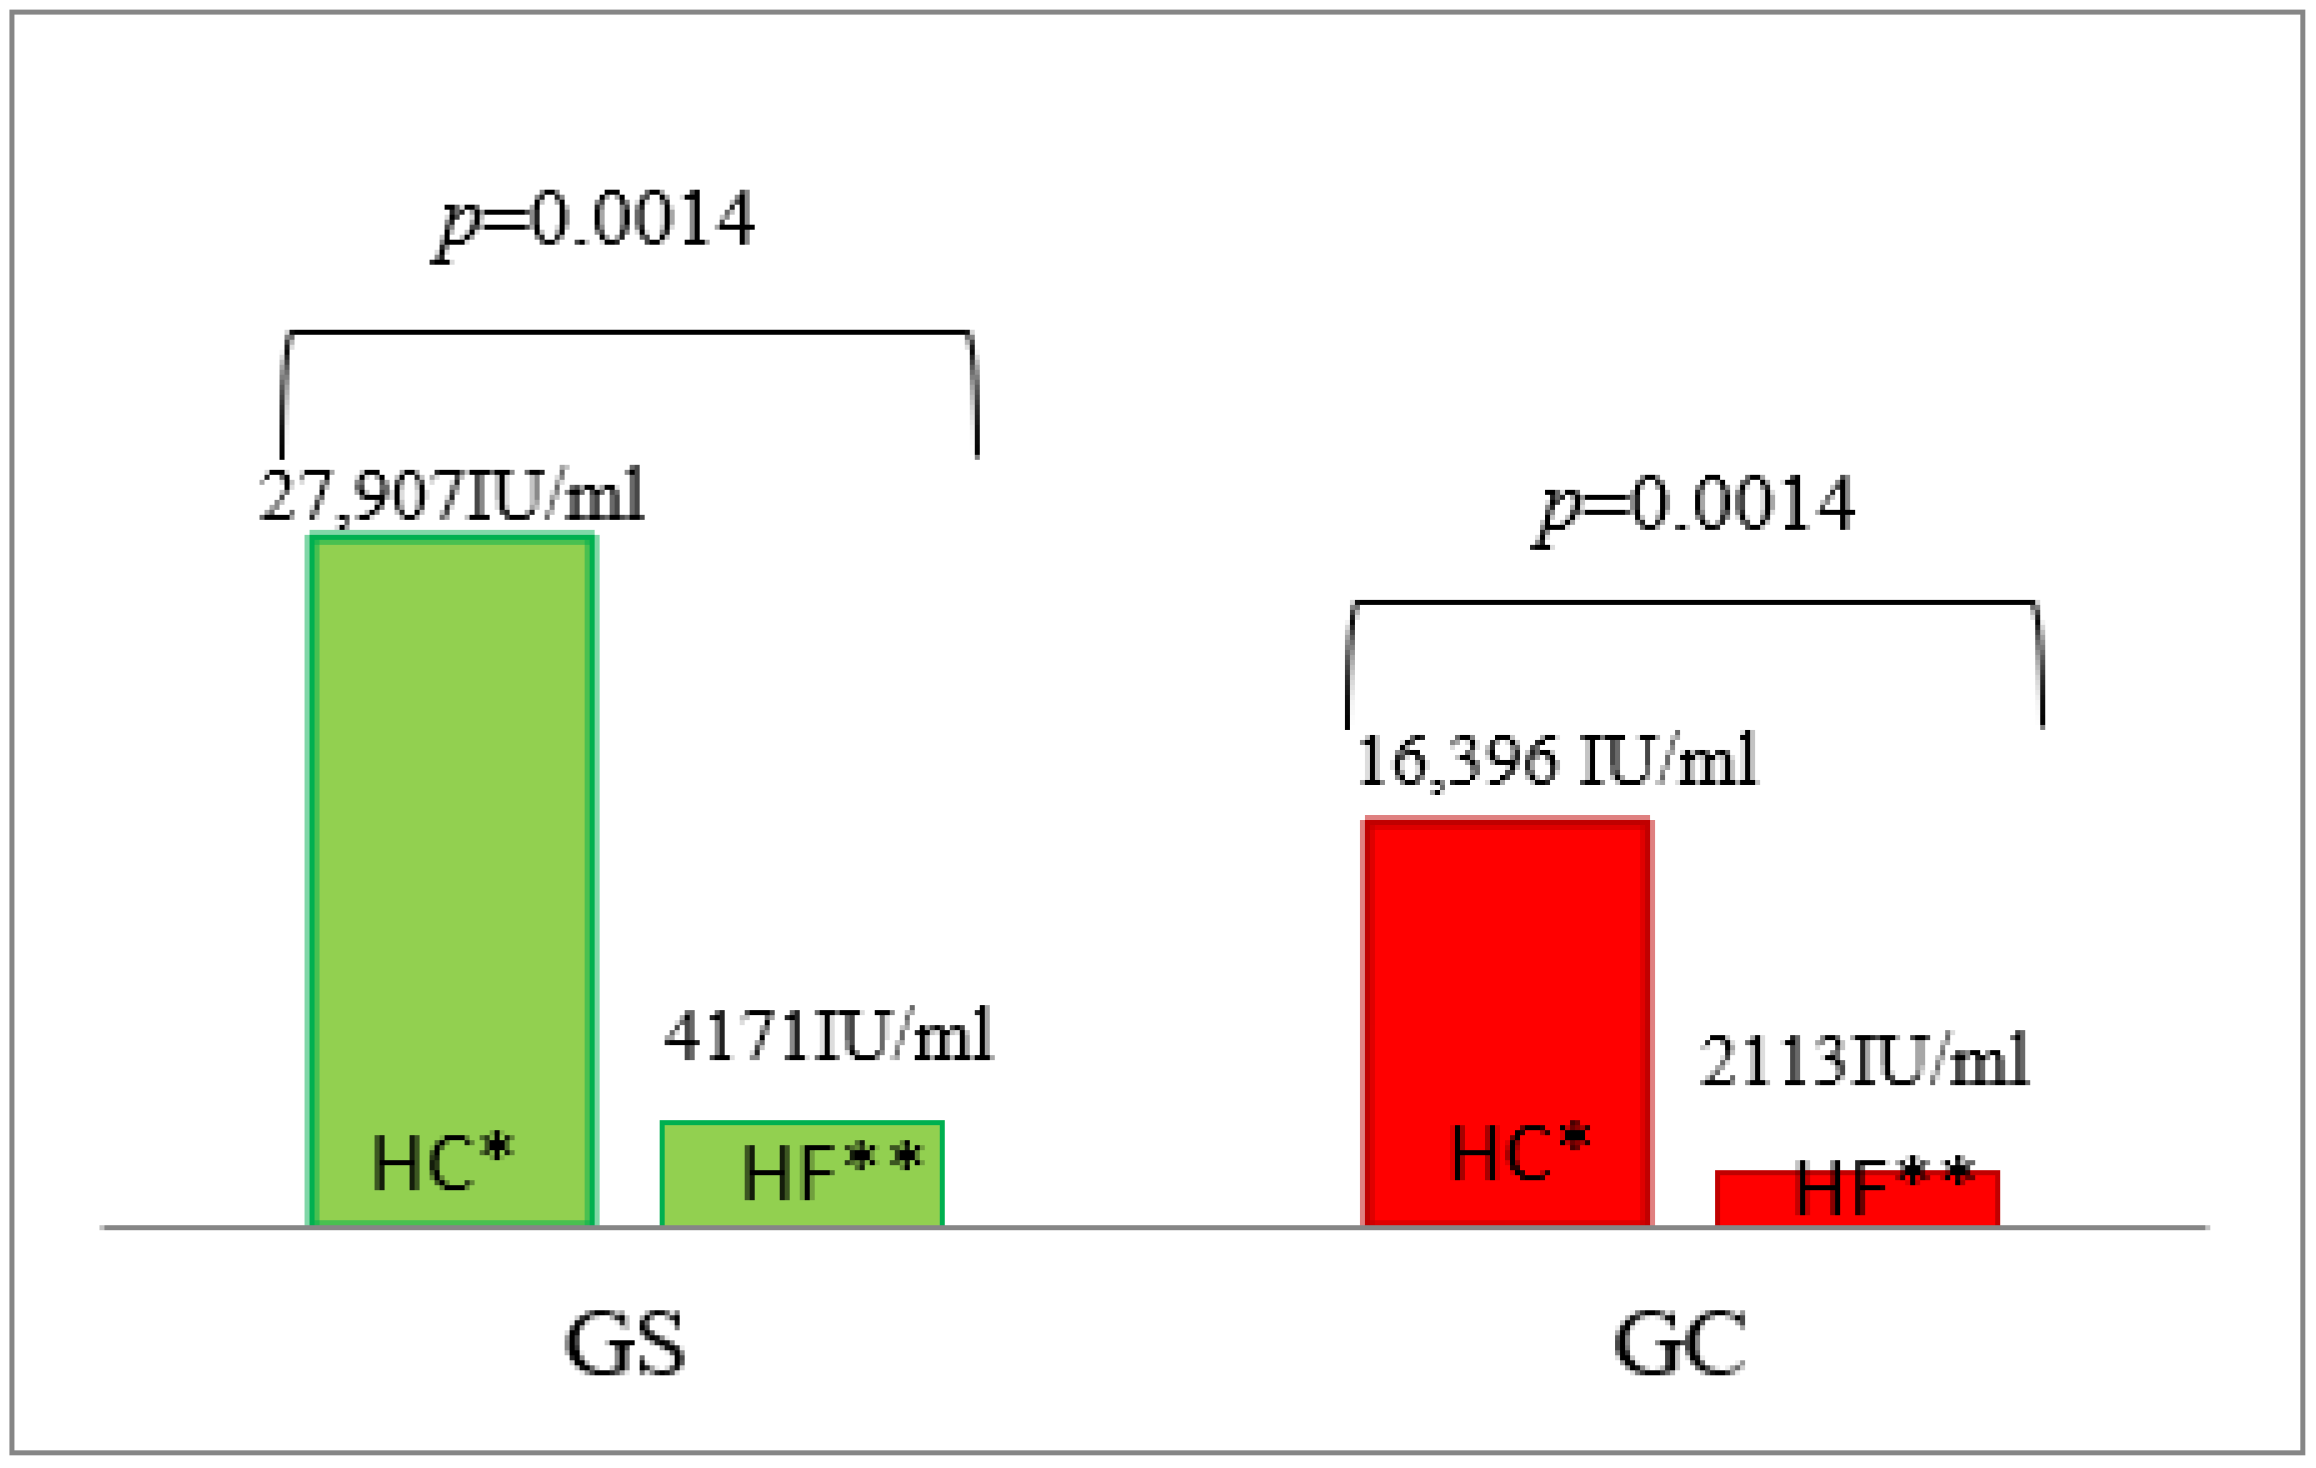
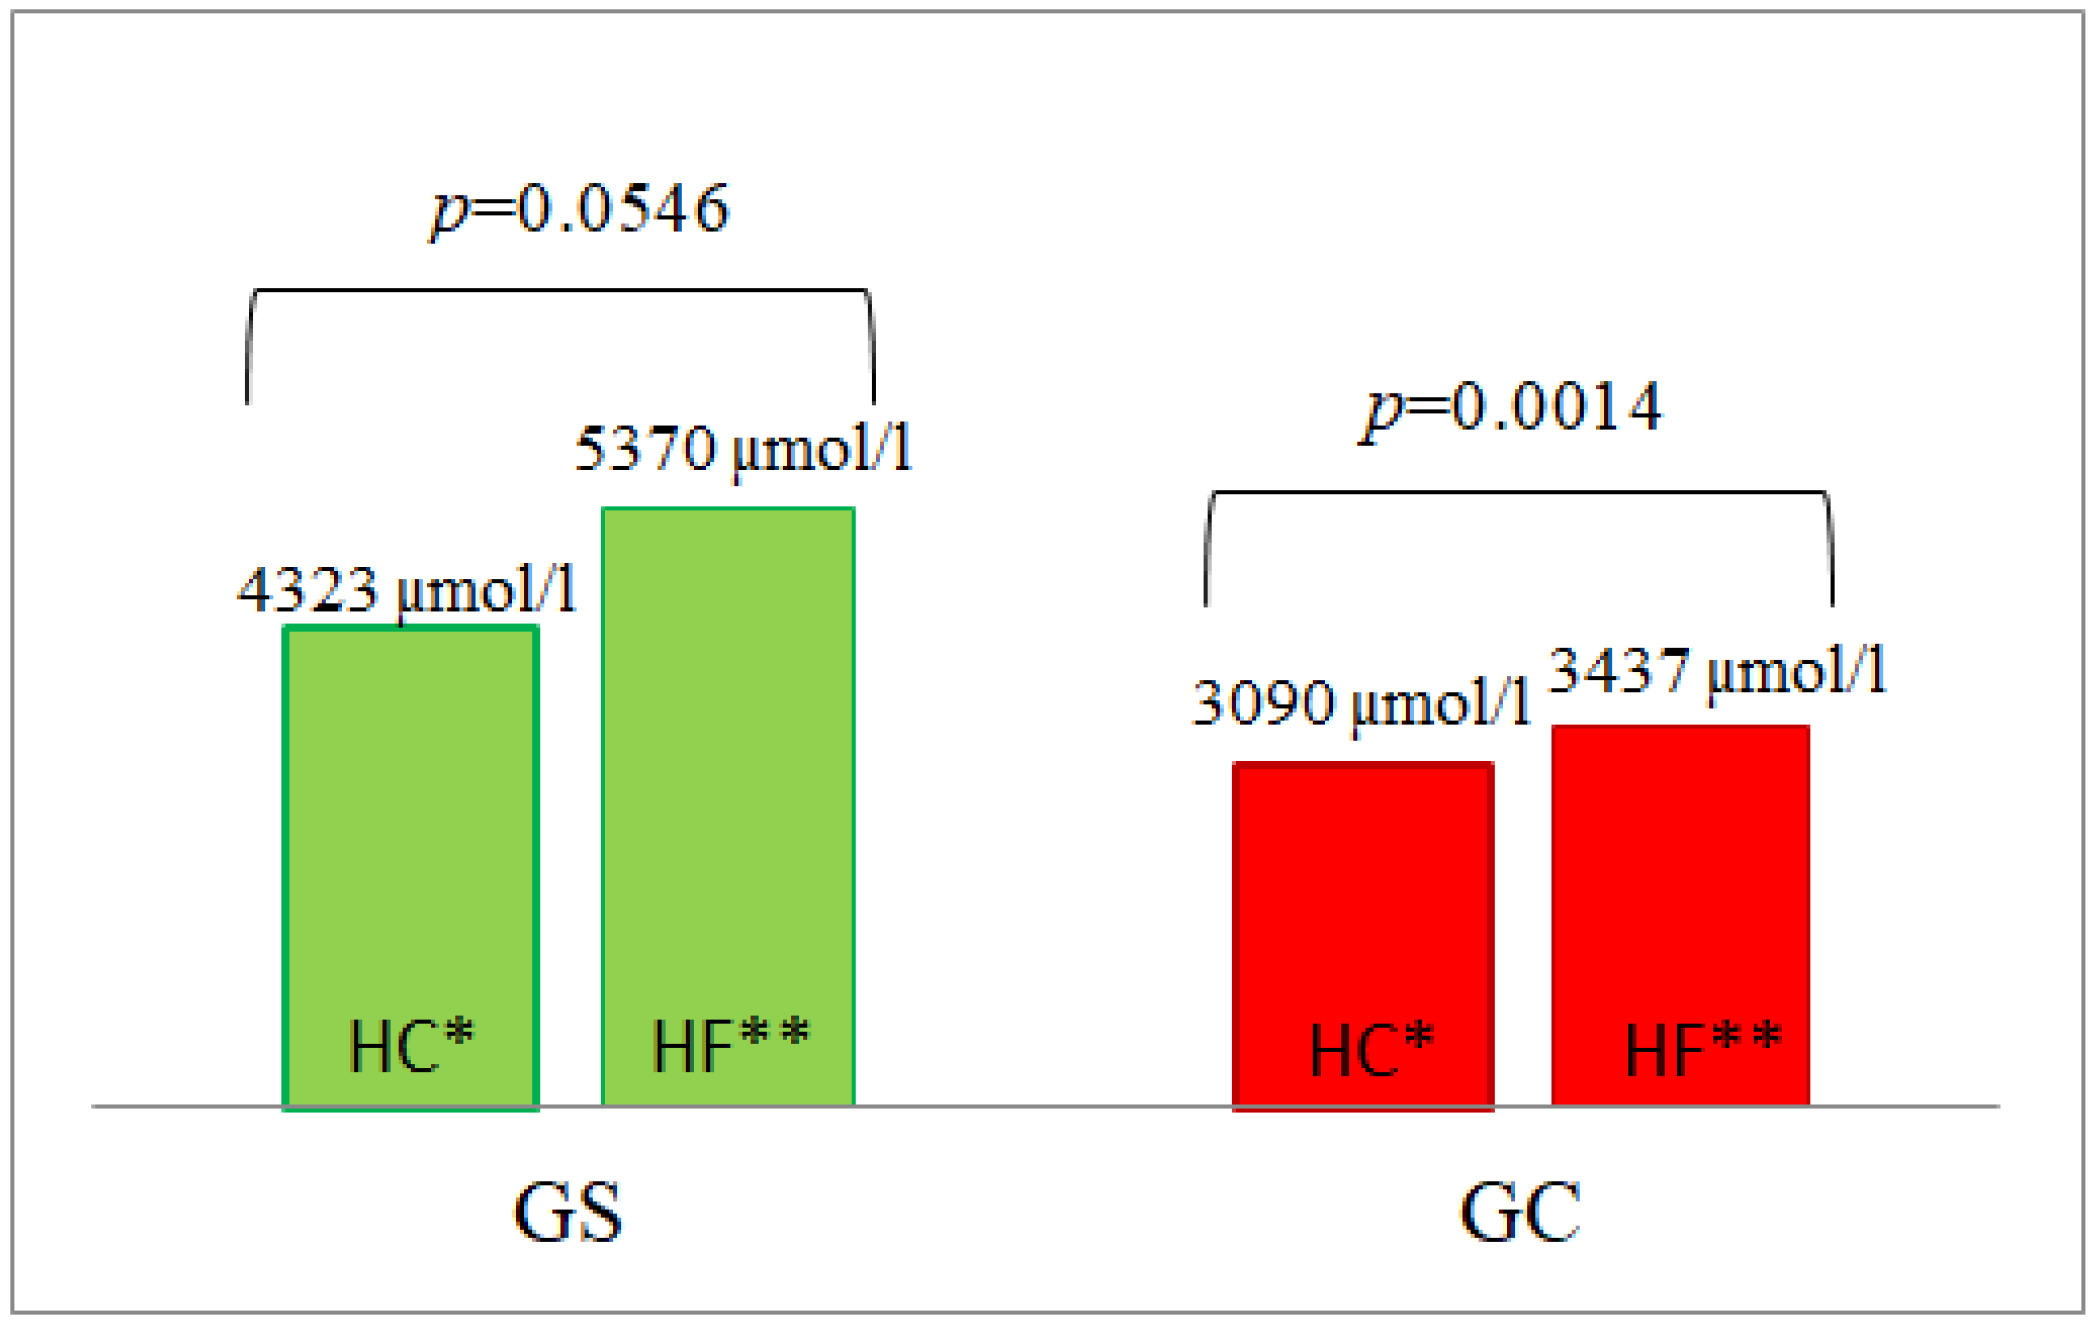
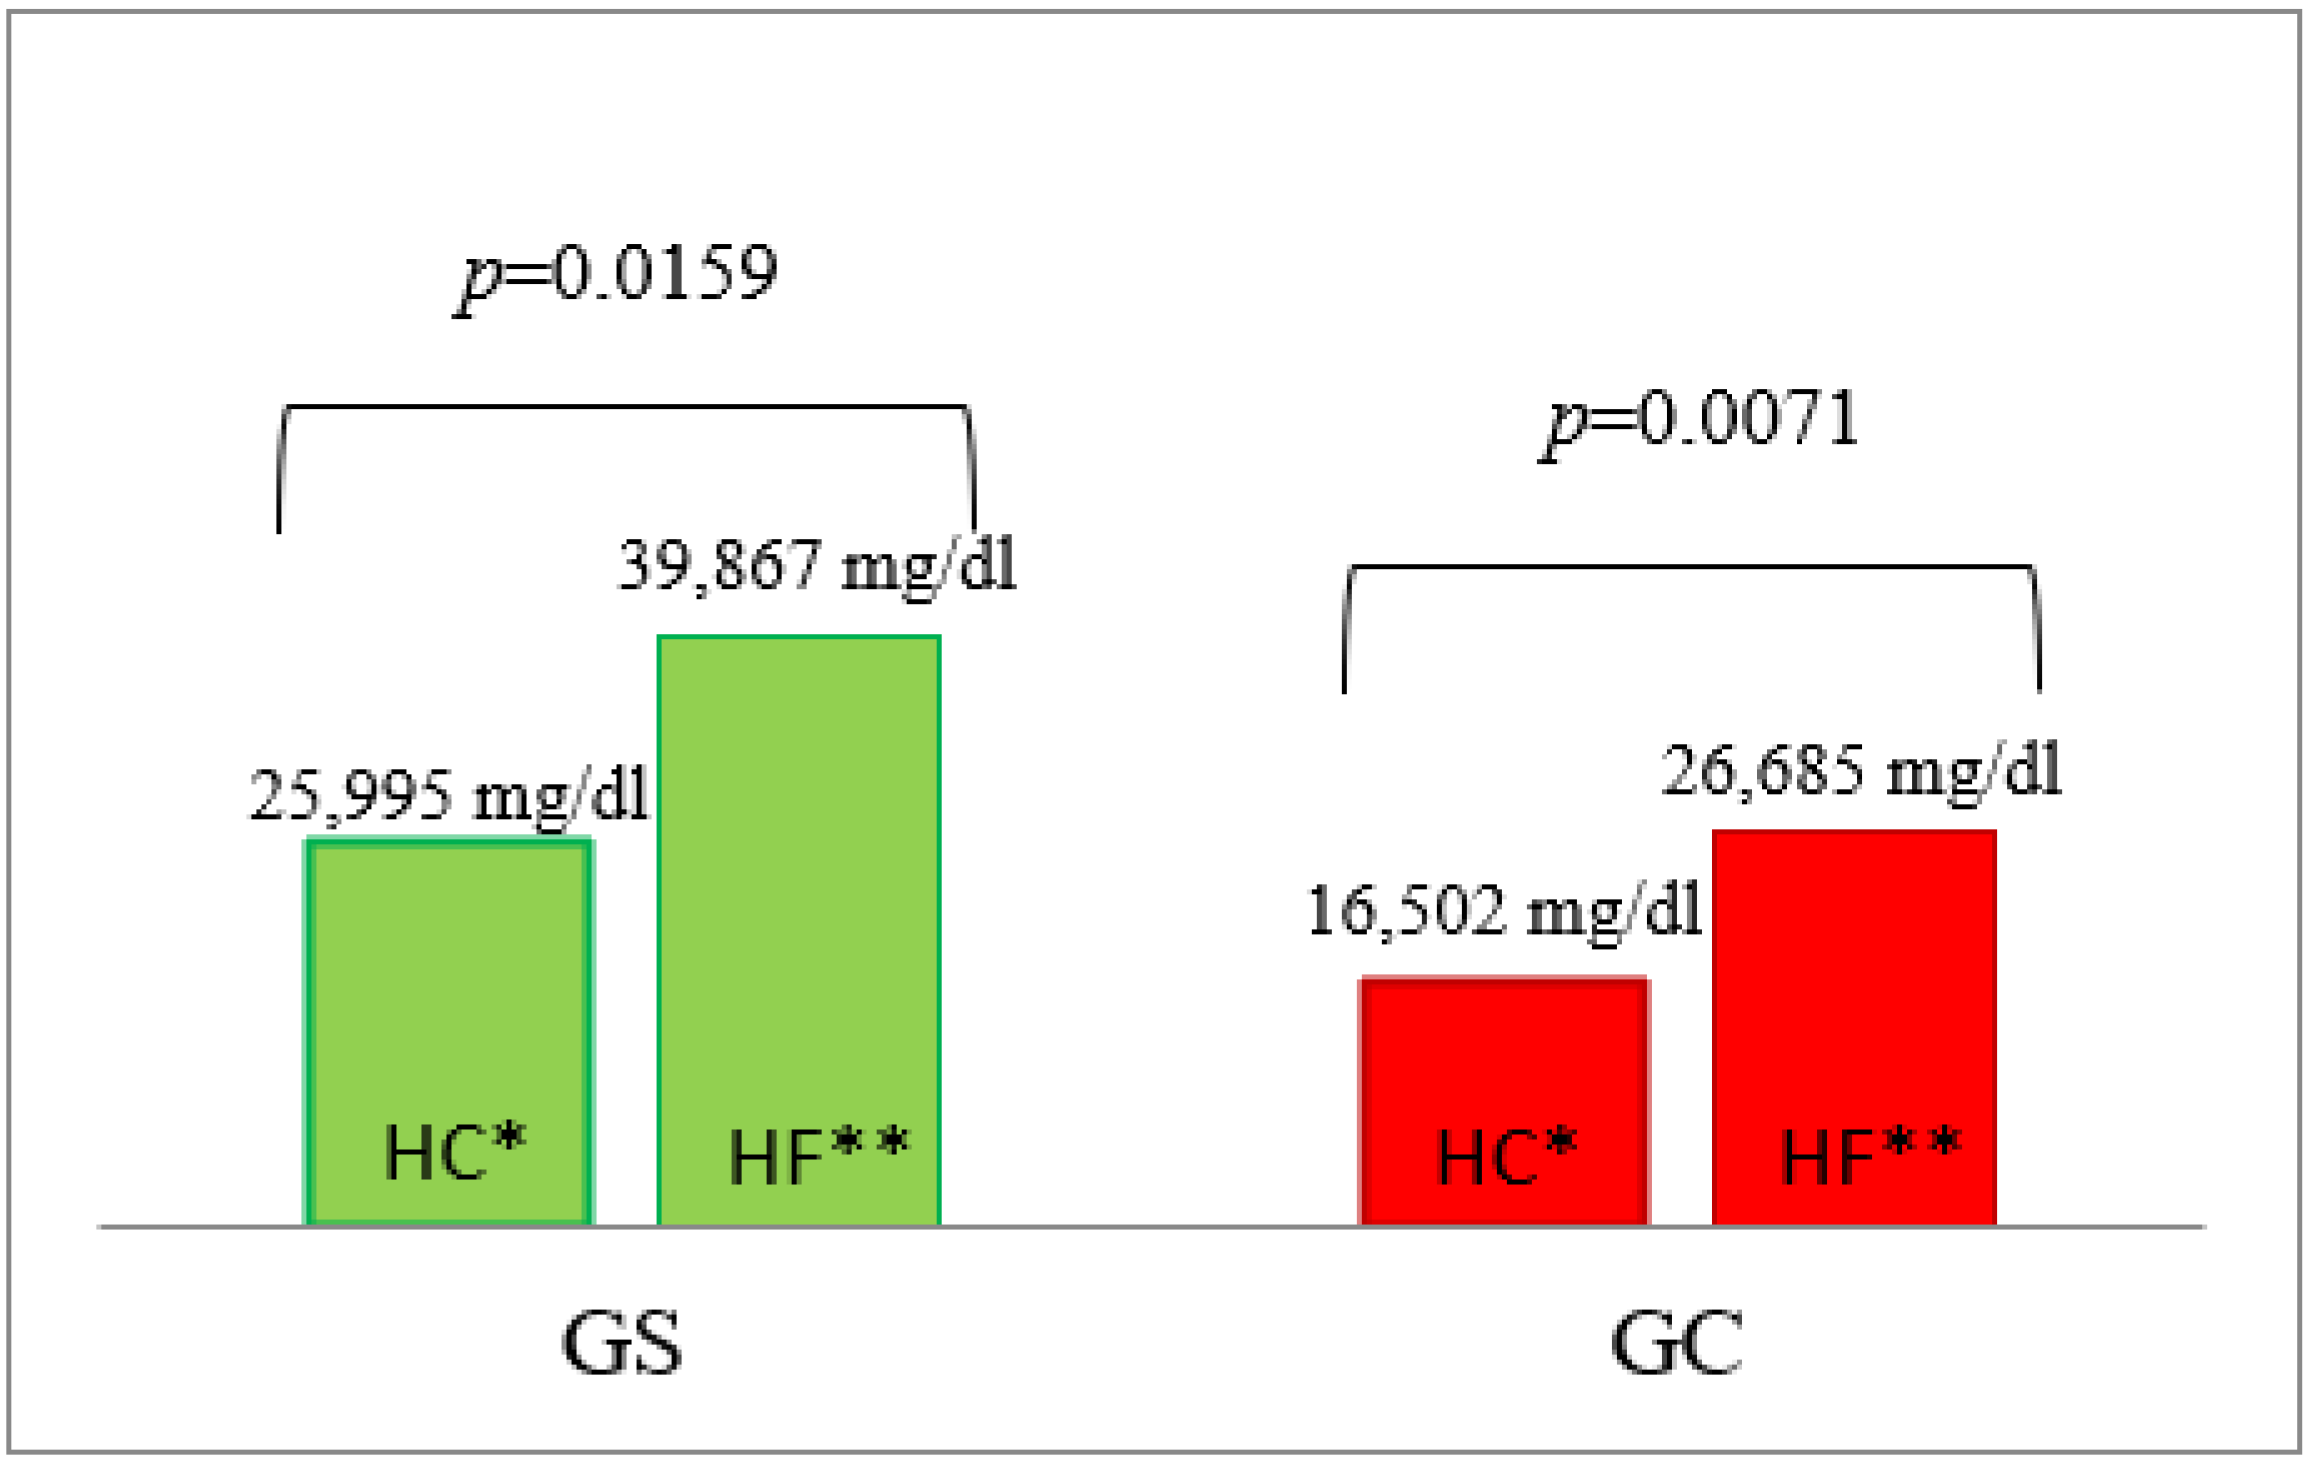
| AUC | 21658 ± 334 | 21,593 ± 442 | 0.7004 | 4171 ± 857 | 2113 ± 157 | 0.0040 | 39,867 ± 5453 | 26,685 ± 2713 | 0.0240 | 5370 ± 539 | 3437 ± 147 | 0.0040 |
| High-Carbohydrate Meal (HC) | ||||||||||||
| Glucose (mg/dL) | Insulin (IU/mL) | Triglycerides (mg/dL) | Homocysteine (µmol/L) | |||||||||
| Time | GS | GC | p | GS | GC | p | GS | GC | p | GS | GC | p |
| 0′ | 96.2 ± 9.18 | 91.6 ± 18.31 | 0.6254 | 14.8 ± 14.10 | 10.2 ± 5.20 | 0.6628 | 113.5 ± 41.25 | 75.3 ± 41.03 | 0.0294 | 16.8 ± 4.17 | 13.2 ± 2.49 | 0.0221 |
| 30′ | 158.0 ± 25.65 | 152.3 ± 30.28 | 0.9794 | 181.1 ± 283.38 | 86.2 ± 31.06 | 0.7778 | 116.6 ± 39.65 | 77.0 ± 42.18 | 0.0294 | 19.4 ± 9.10 | 13.2 ± 4.02 | 0.0042 |
| 60′ | 169.3 ± 46.81 | 149.3 ± 31.33 | 0.3166 | 238.1 ± 342.86 | 120.8 ± 86.53 | 0.9795 | 118.3 ± 47.64 | 74.5 ± 42.35 | 0.0190 | 15.7 ± 7.35 | 13.8 ± 5.55 | 0.3107 |
| 120′ | 140.6 ± 51.61 | 127.0 ± 26.94 | 0.6440 | 141.1 ± 197.22 | 84.1 ± 41.21 | 0.7388 | 105.5 ± 45.08 | 62.9 ± 38.55 | 0.0119 | 19.0 ± 11.41 | 12.3 ± 1.74 | 0.0255 |
| 180′ | 105.3 ± 19.81 | 104.6 ± 25.86 | 0.8174 | 42.4 ± 33.24 | 45.9 ± 32.18 | 0.6628 | 102.8 ± 49.75 | 63.0 ± 42.15 | 0.0190 | 19.6 ± 11.12 | 12.6 ± 3.20 | 0.0190 |
| 240′ | 78.7 ± 19.00 | 77.1 ± 18.98 | 0.9386 | 17.1 ± 13.30 | 13.6 ± 6.02 | 0.8979 | 98.7 ± 51.86 | 71.5 ± 51.03 | 0.0908 | 15.1 ± 8.97 | 12.4 ± 3.27 | 0.5787 |
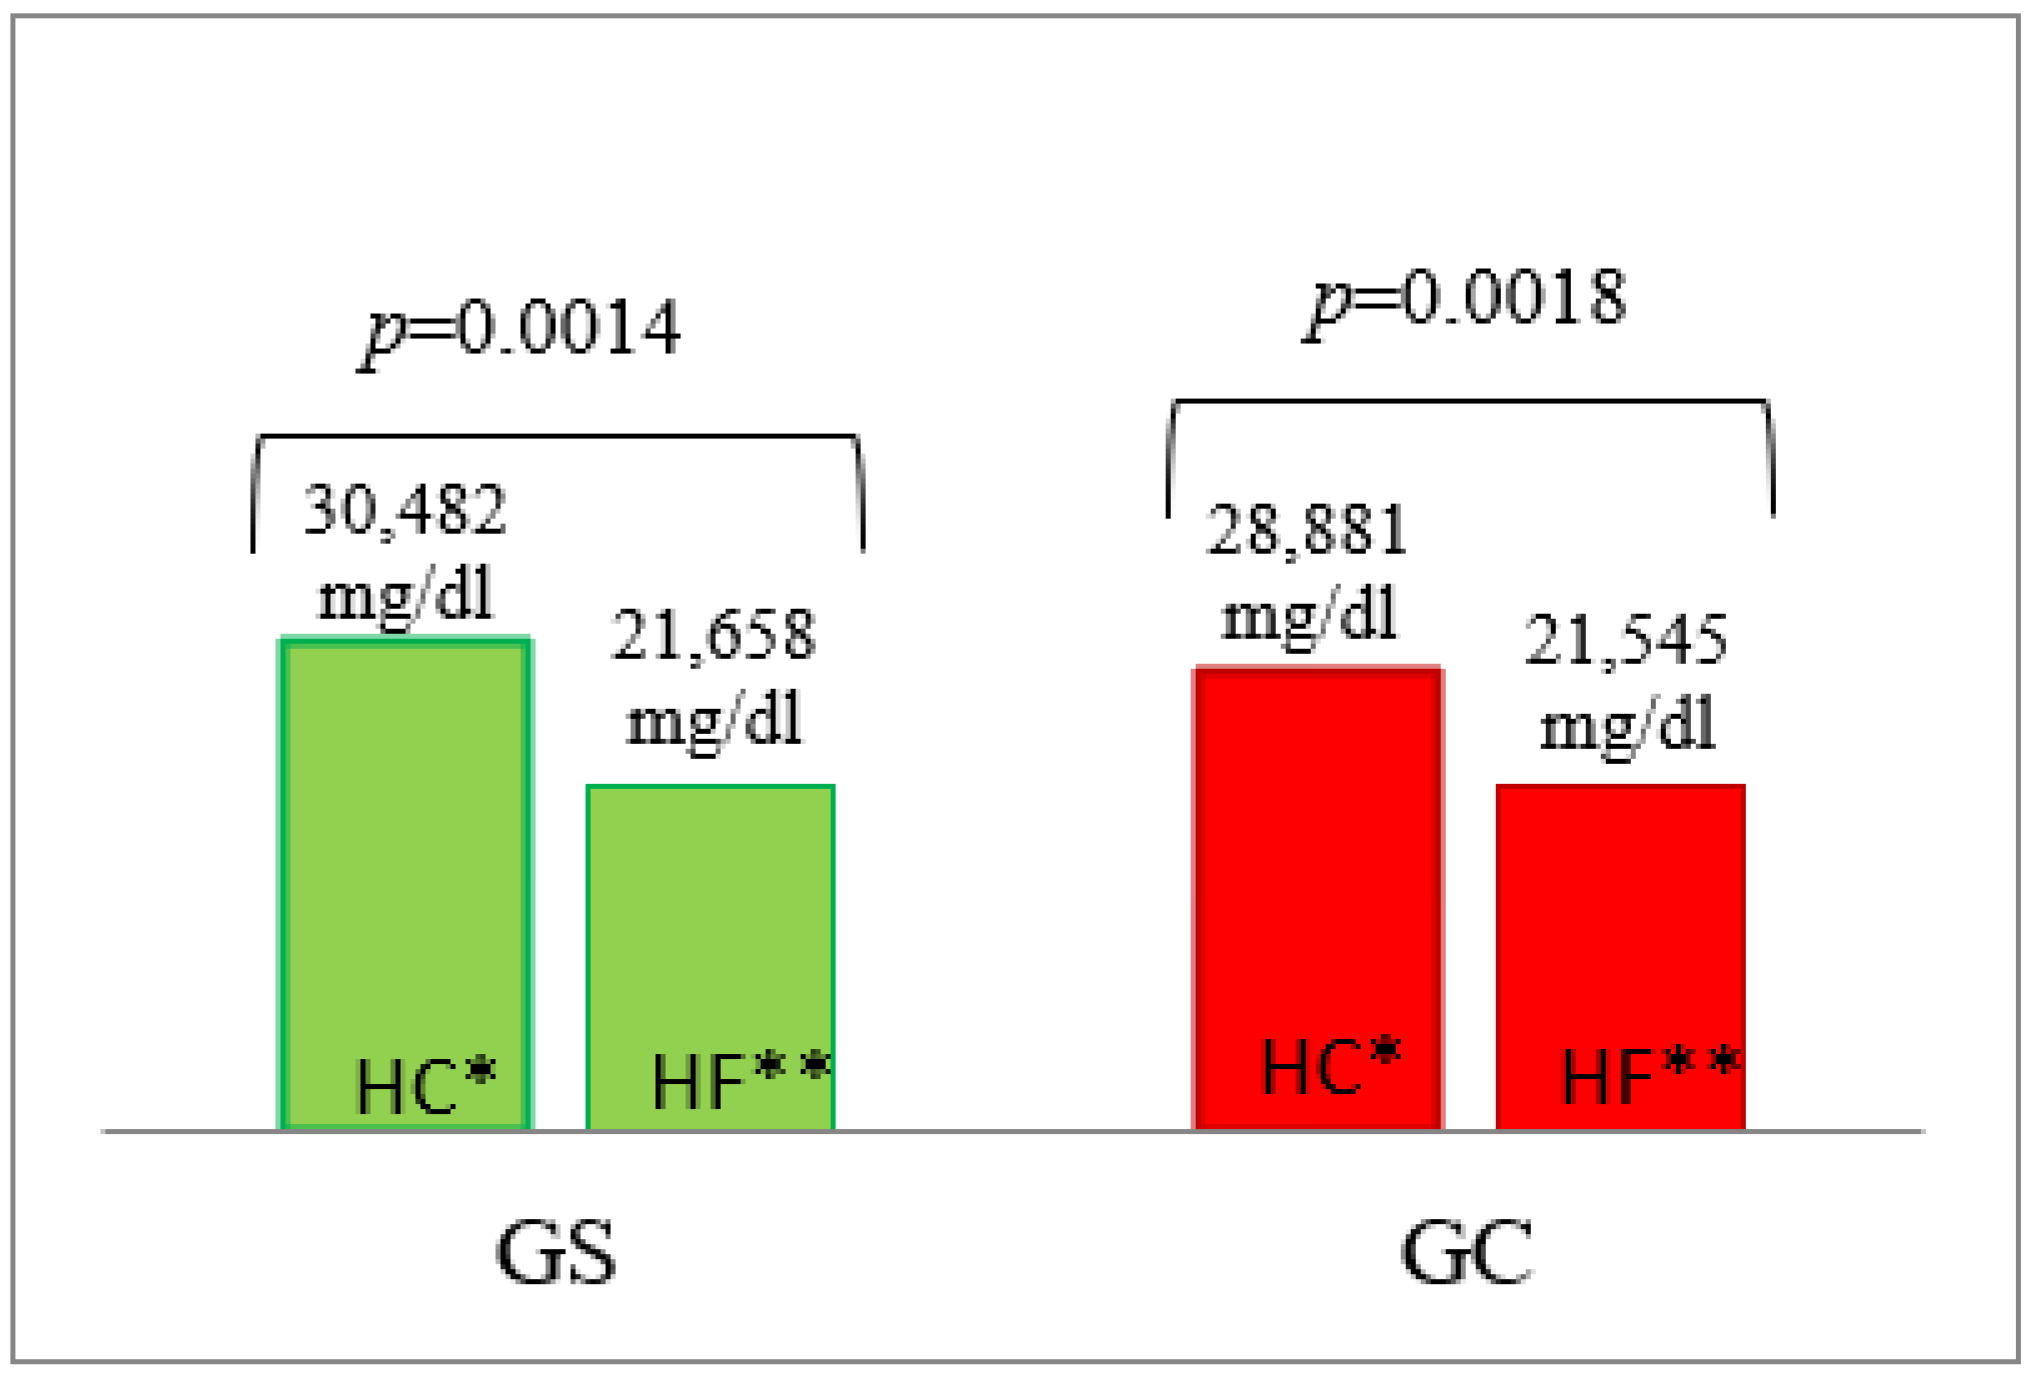
| AUC | 30,482 ± 1426 | 28,882 ± 1322 | 0.5726 | 27,907 ± 9545 | 16,396 ± 1784 | 0.8979 | 25,995 ± 3046 | 16,502 ± 2772 | 0.0274 | 4323 ± 511 | 3090 ± 141 | 0.0138 |
| High-Fat Meal (HF) | |||||||||
| Energy Expenditure (kcal/min) | Glucose Oxidation (mg/min) | Fat Oxidation (mg/min) | |||||||
| Time | GS | GC | p | GS | GC | p | GS | GC | p |
| 0′ | 1.332 ± 0.25 | 1.267 ± 0.24 | 0.3970 | 41.3 ± 47.76 | 34.0 ± 43.71 | 0.5552 | 71.4 ± 36.46 | 56.4 ± 33.22 | 0.2811 |
| 60′ | 1.333 ± 0.27 | 1.263 ± 0.19 | 0.6628 | 61.4 ± 66.25 | 34.4 ± 45.07 | 0.2084 | 82.4 ± 48.55 | 87.3 ± 31.98 | 0.8979 |
| 120′ | 1.335 ± 0.23 | 1.269 ± 0.22 | 0.2181 | 43.9 ± 48.04 | 34.3 ± 40.93 | 0.6628 | 91.5 ± 40.76 | 90.1 ± 29.02 | 0.9590 |
| 180′ | 1.336 ± 0.26 | 1.217 ± 0.10 | 0.1237 | 24.9 ± 19.29 | 27.6 ± 41.69 | 0.5724 | 103.0 ± 32.43 | 92.0 ± 27.96 | 0.3426 |
| 240′ | 1.339 ± 0.24 | 1.327 ± 0.20 | 0.2928 | 23.5 ± 9.66 | 31.9 ± 45.45 | 0.5046 | 105.5 ± 32.80 | 94.4 ± 30.18 | 0.4263 |
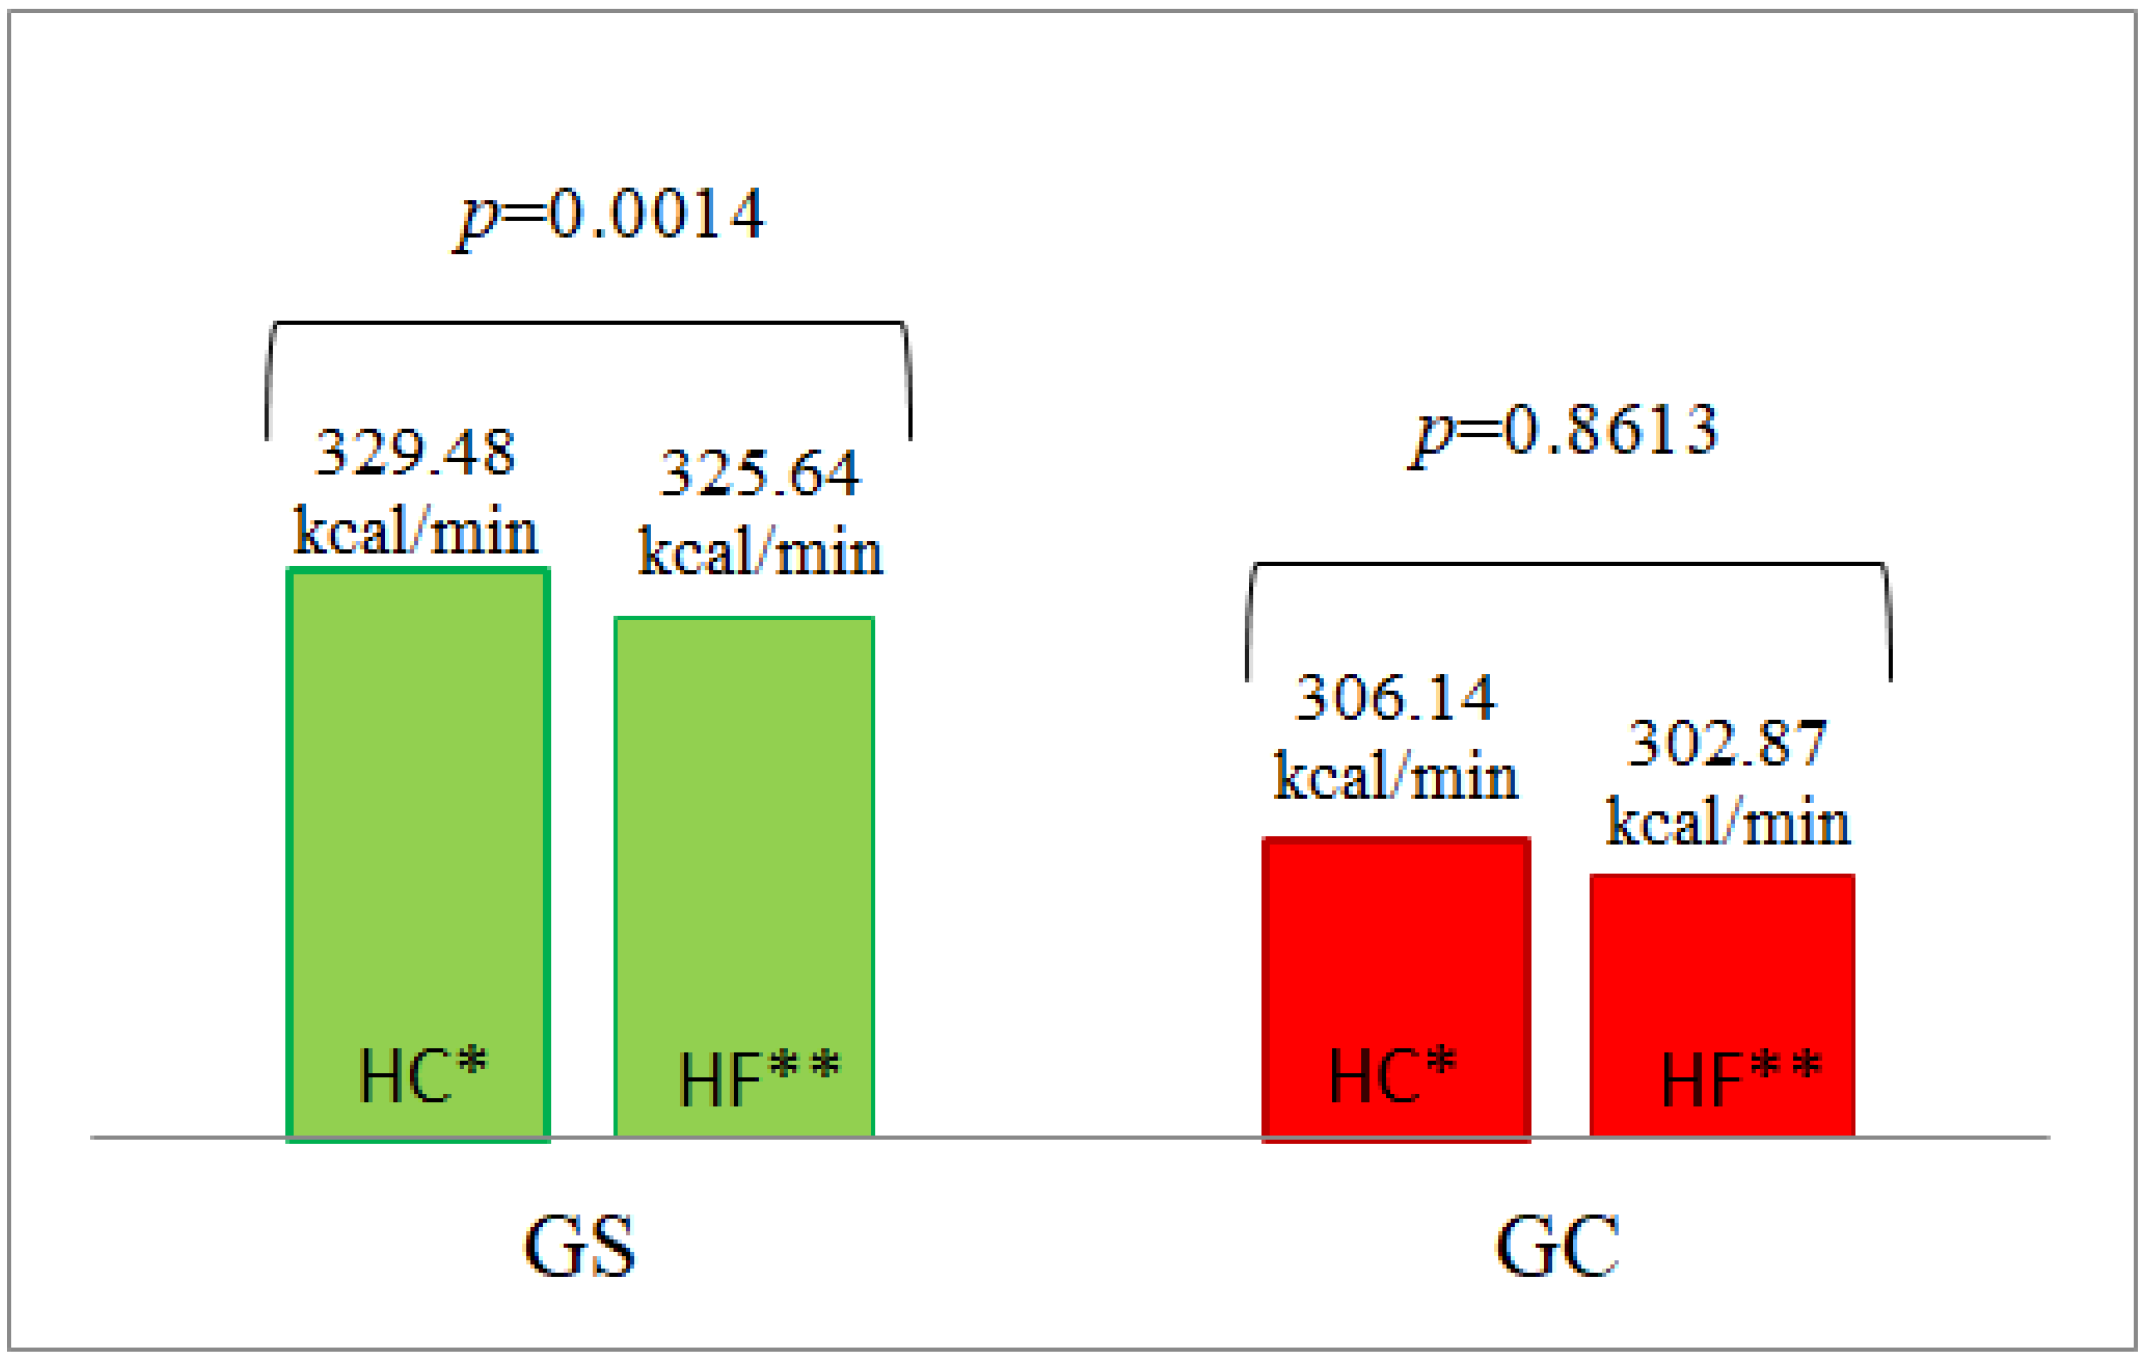
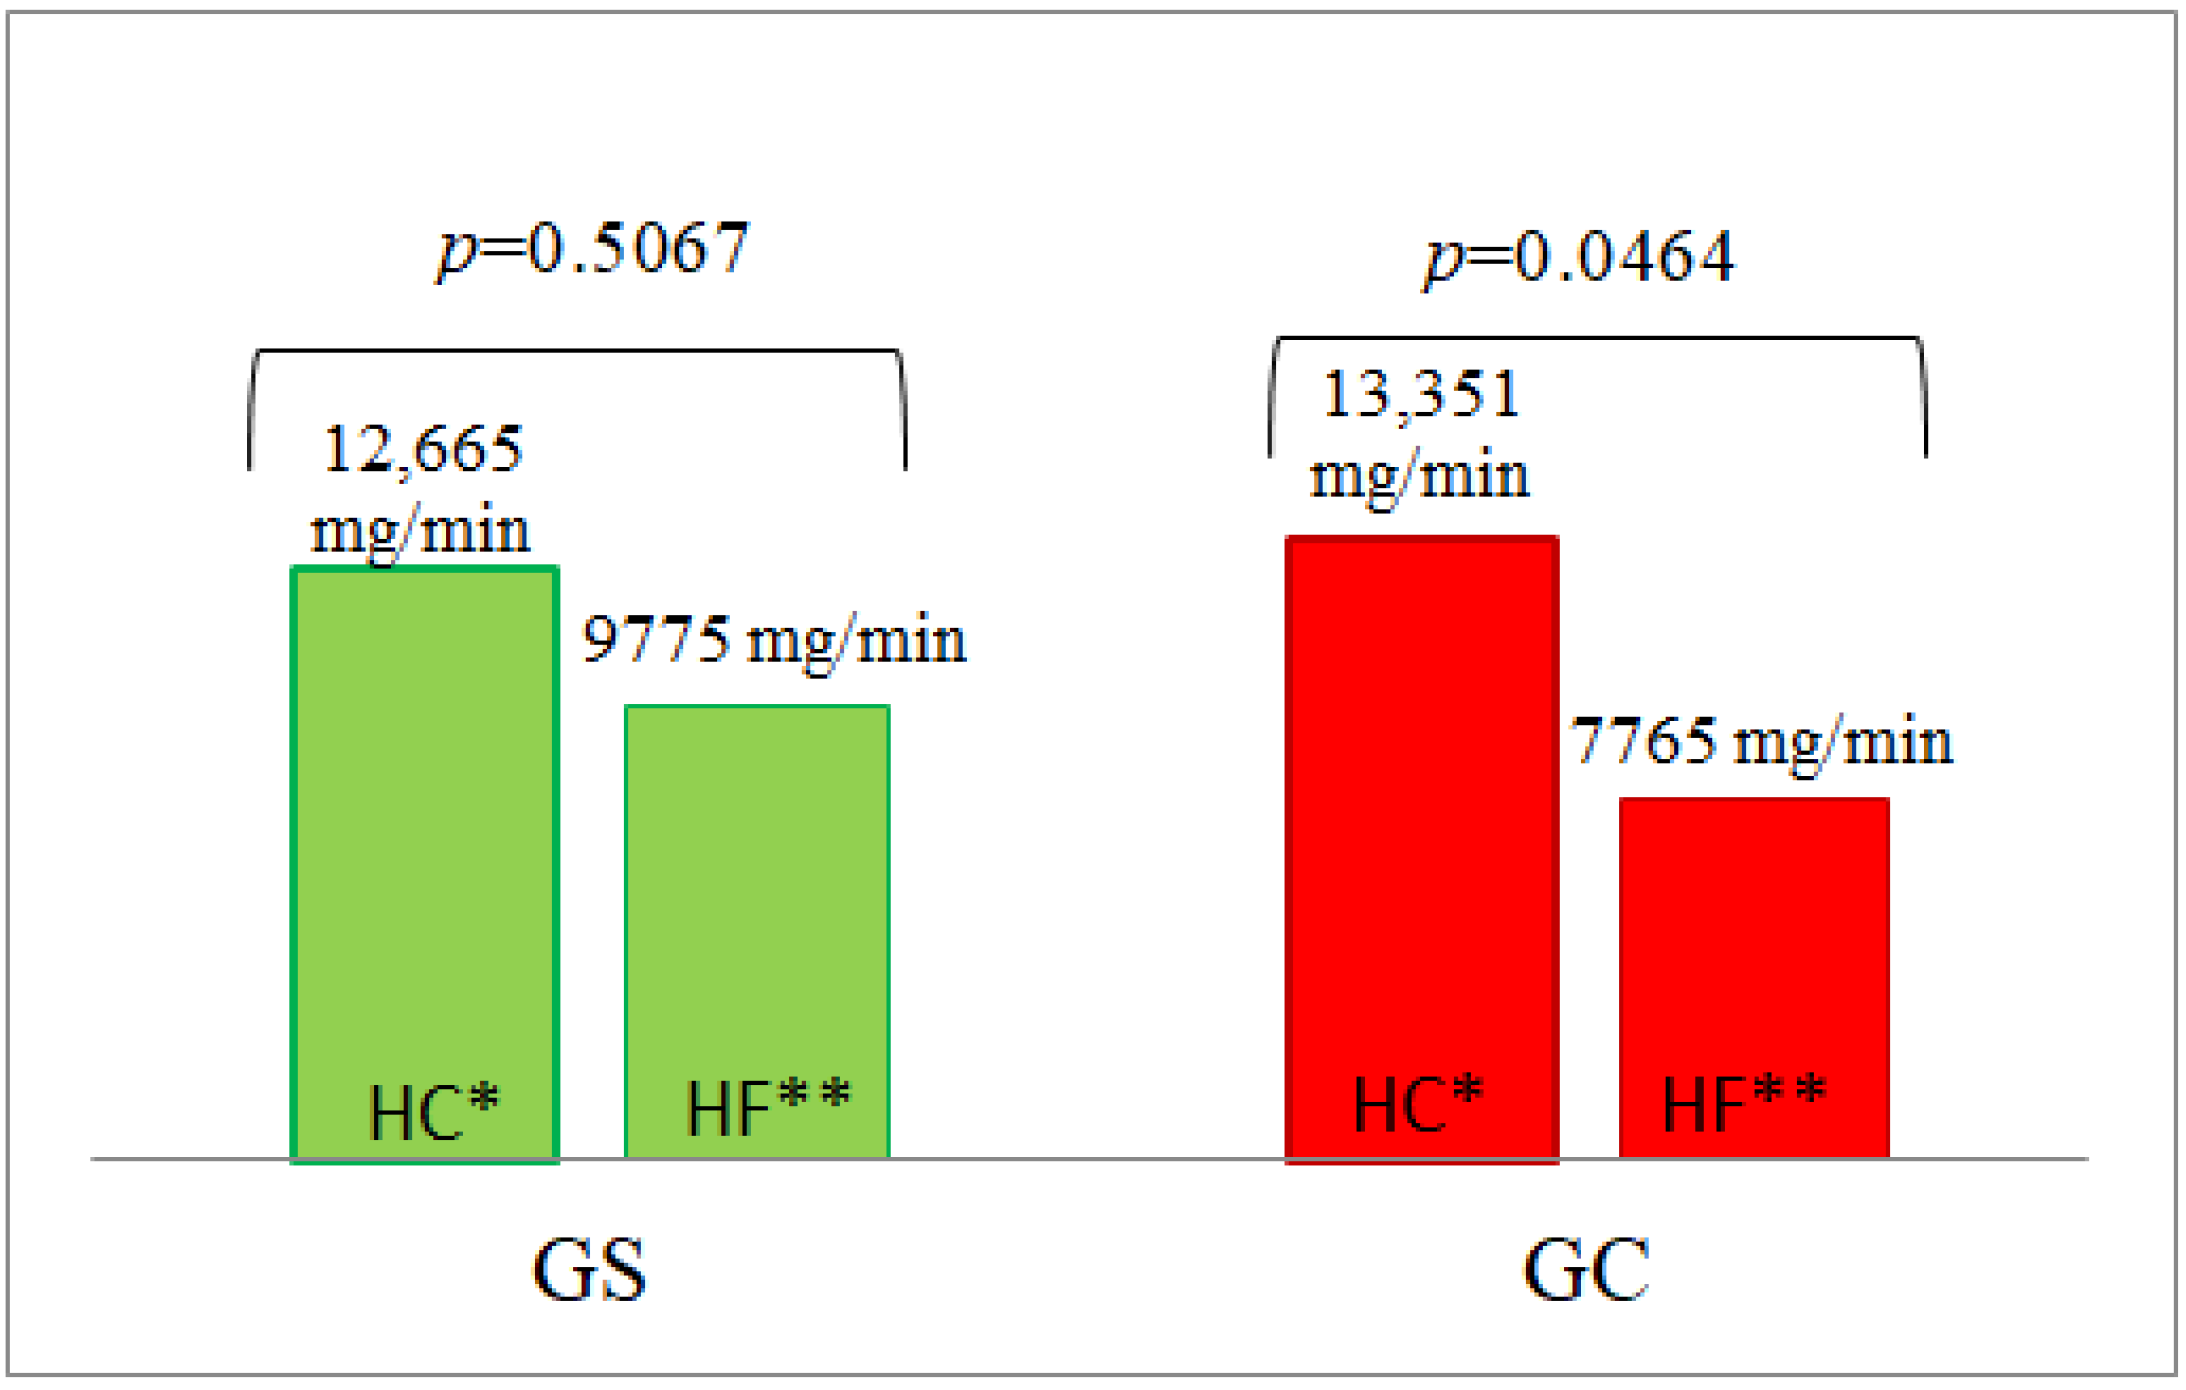
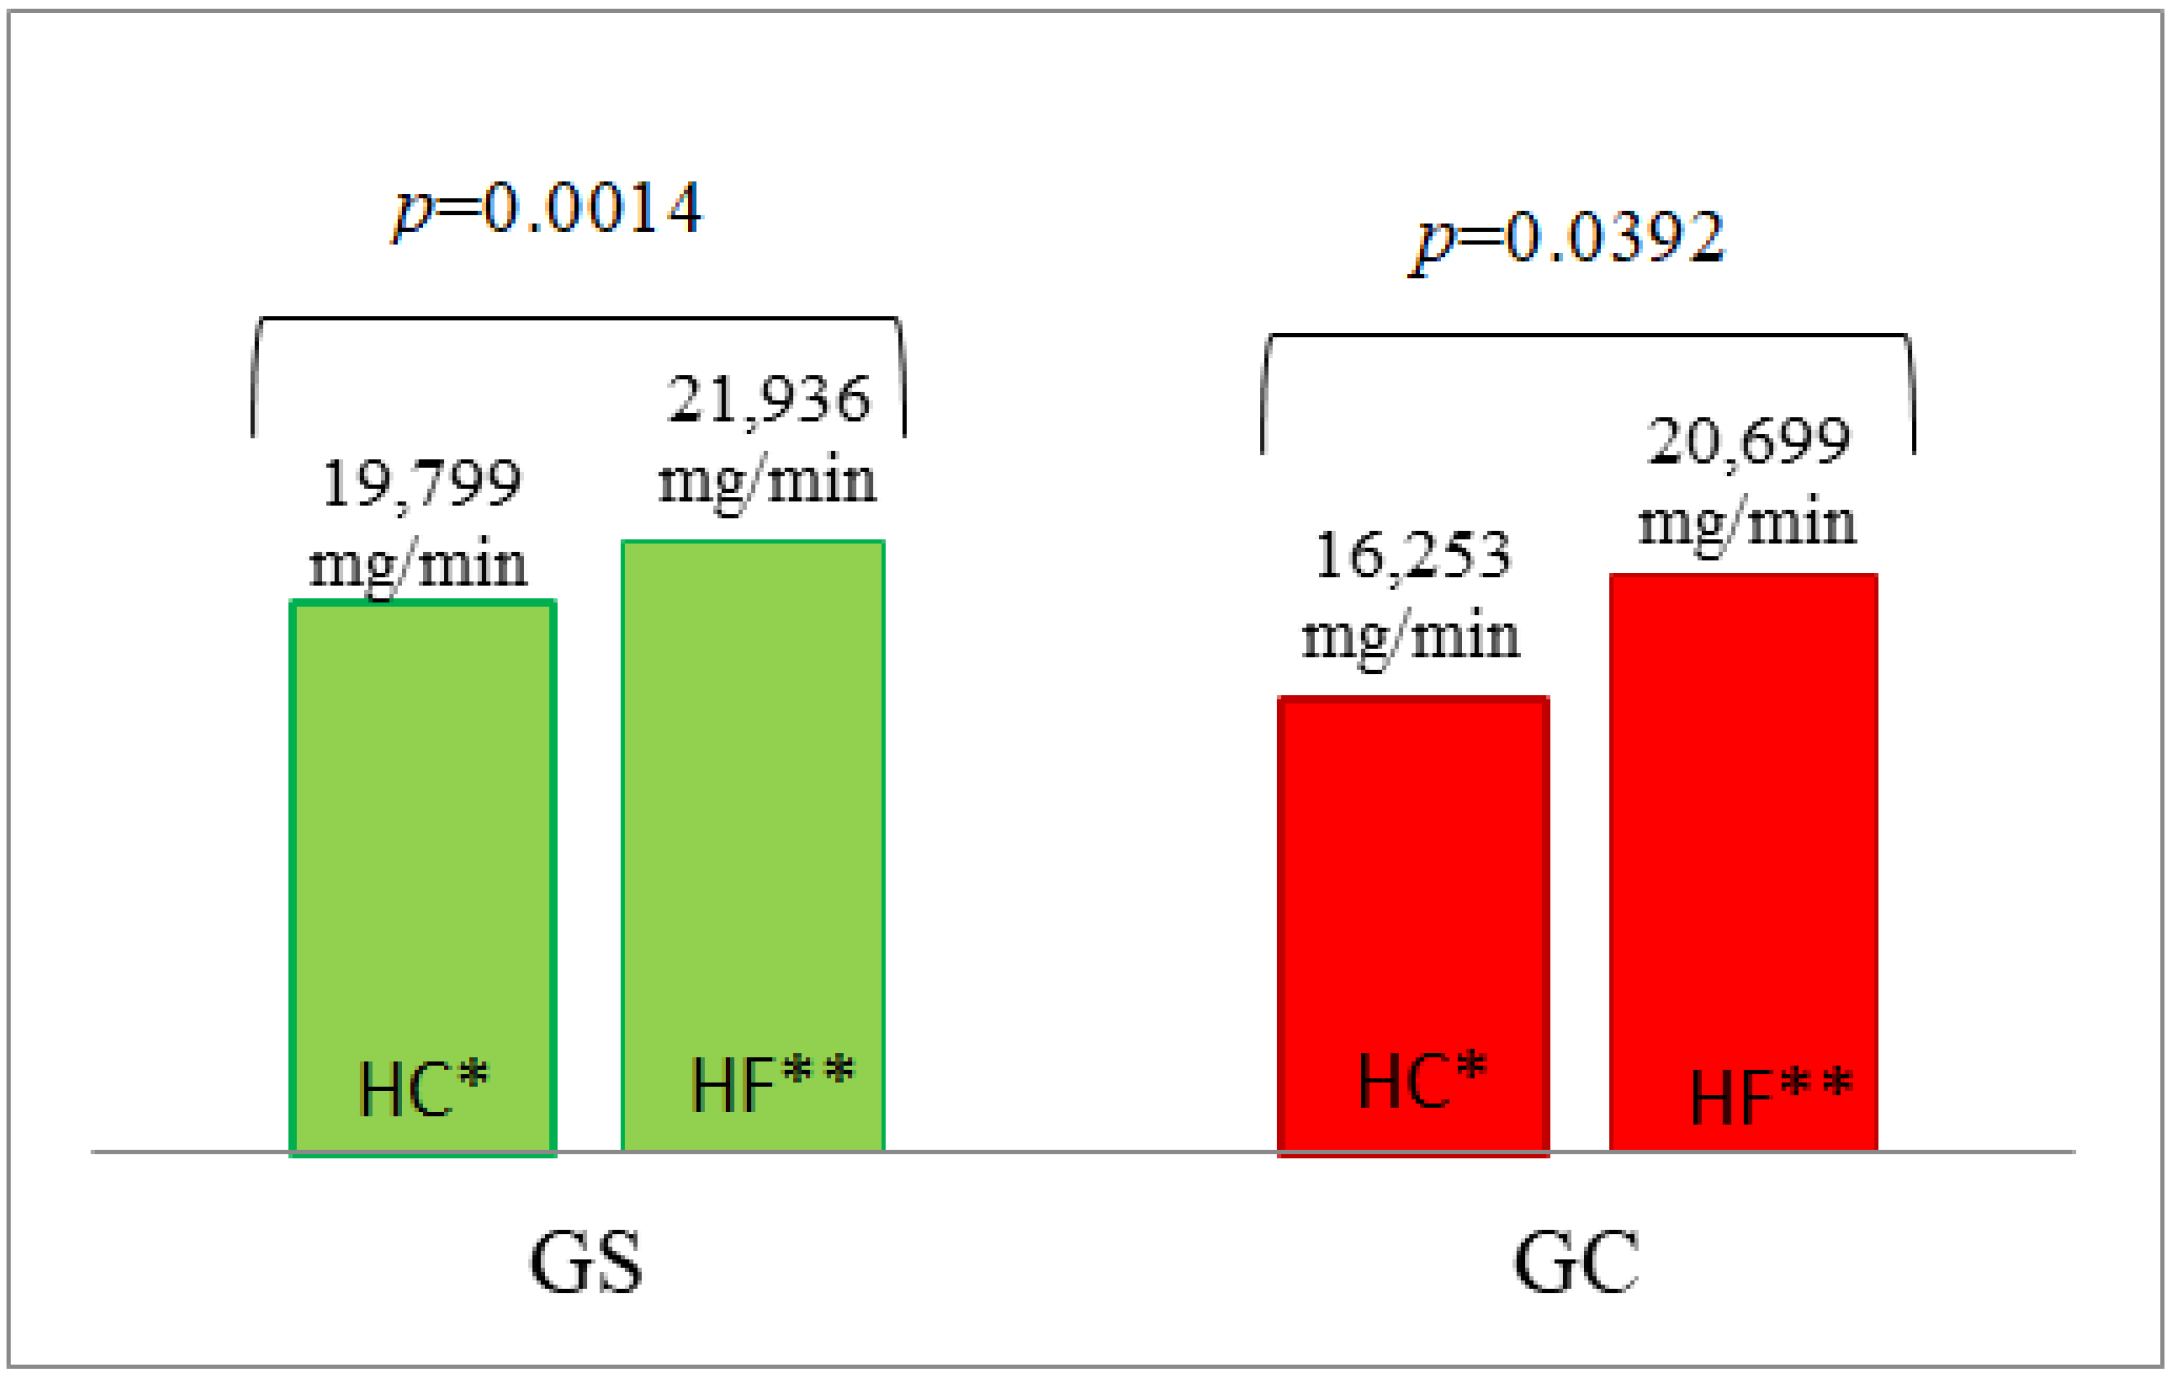
| AUC | 325.64 ± 16.478 | 302.87 ± 9.526 | 0.3693 | 9775 ± 1987 | 7765 ± 2738 | 0.2088 | 21,936 ± 2305 | 20,699 ± 1937 | 1.0000 |
| High-Carbohydrate Meal (HC) | |||||||||
| Energy Expenditure (kcal/min) | Glucose Oxidation (mg/min) | Fat Oxidation (mg/min) | |||||||
| Time | GS | GC | p | GS | GC | p | GS | GC | p |
| 0′ | 1.329 ± 0.22 | 1.222 ± 0.15 | 0.1369 | 23.9 ± 22.60 | 28.6 ± 22.5 | 0.4265 | 87.7 ± 28.40 | 66.2 ± 26.50 | 0.1061 |
| 60′ | 1.447 ± 0.30 | 1.338 ± 0.09 | 0.5381 | 46.0 ± 55.44 | 46.7 ± 56.01 | 0.9386 | 93.4 ± 34.56 | 77.7 ± 23.98 | 0.1822 |
| 120′ | 1.395 ± 0.29 | 1.311 ± 0.10 | 0.7583 | 68.7 ± 60.23 | 76.2 ± 49.84 | 0.3692 | 78.5 ± 28.98 | 63.6 ± 22.98 | 0.1689 |
| 180′ | 1.325 ± 0.26 | 1.220 ± 0.14 | 0.6816 | 62.9 ± 63.27 | 67.6 ± 53.88 | 0.3972 | 71.7 ± 26.32 | 57.5 ± 24.06 | 0.1689 |
| 240′ | 1.316 ± 0.29 | 1.240 ± 0.12 | 0.7583 | 42.5 ± 30.08 | 35.0 ± 46.29 | 0.0479 | 84.7 ± 36.40 | 77.6 ± 22.67 | 0.6138 |
| AUC | 329.48 ± 18.328 | 306.14 ± 7.191 | 0.6444 | 12,665 ± 3013 | 13,351 ± 2689 | 0.3558 | 19,799 ± 1901 | 16,253 ± 1322 | 0.1909 |
Publisher’s Note: MDPI stays neutral with regard to jurisdictional claims in published maps and institutional affiliations. |
© 2022 by the authors. Licensee MDPI, Basel, Switzerland. This article is an open access article distributed under the terms and conditions of the Creative Commons Attribution (CC BY) license (https://creativecommons.org/licenses/by/4.0/).
Share and Cite
Ostrowska, L.; Smarkusz-Zarzecka, J.; Muszyńska, A.; Adamska-Patruno, E.; Górska, M.; Krętowski, A. High-Fat or High-Carbohydrate Meal—Does It Affect the Metabolism of Men with Excess Body Weight? Nutrients 2022, 14, 2876. https://doi.org/10.3390/nu14142876
Ostrowska L, Smarkusz-Zarzecka J, Muszyńska A, Adamska-Patruno E, Górska M, Krętowski A. High-Fat or High-Carbohydrate Meal—Does It Affect the Metabolism of Men with Excess Body Weight? Nutrients. 2022; 14(14):2876. https://doi.org/10.3390/nu14142876
Chicago/Turabian StyleOstrowska, Lucyna, Joanna Smarkusz-Zarzecka, Anna Muszyńska, Edyta Adamska-Patruno, Maria Górska, and Adam Krętowski. 2022. "High-Fat or High-Carbohydrate Meal—Does It Affect the Metabolism of Men with Excess Body Weight?" Nutrients 14, no. 14: 2876. https://doi.org/10.3390/nu14142876
APA StyleOstrowska, L., Smarkusz-Zarzecka, J., Muszyńska, A., Adamska-Patruno, E., Górska, M., & Krętowski, A. (2022). High-Fat or High-Carbohydrate Meal—Does It Affect the Metabolism of Men with Excess Body Weight? Nutrients, 14(14), 2876. https://doi.org/10.3390/nu14142876