
The Relationship of Physical Activity and Dietary Quality with Android Fat Composition and Distribution in US Adults


Abstract
:1. Introduction
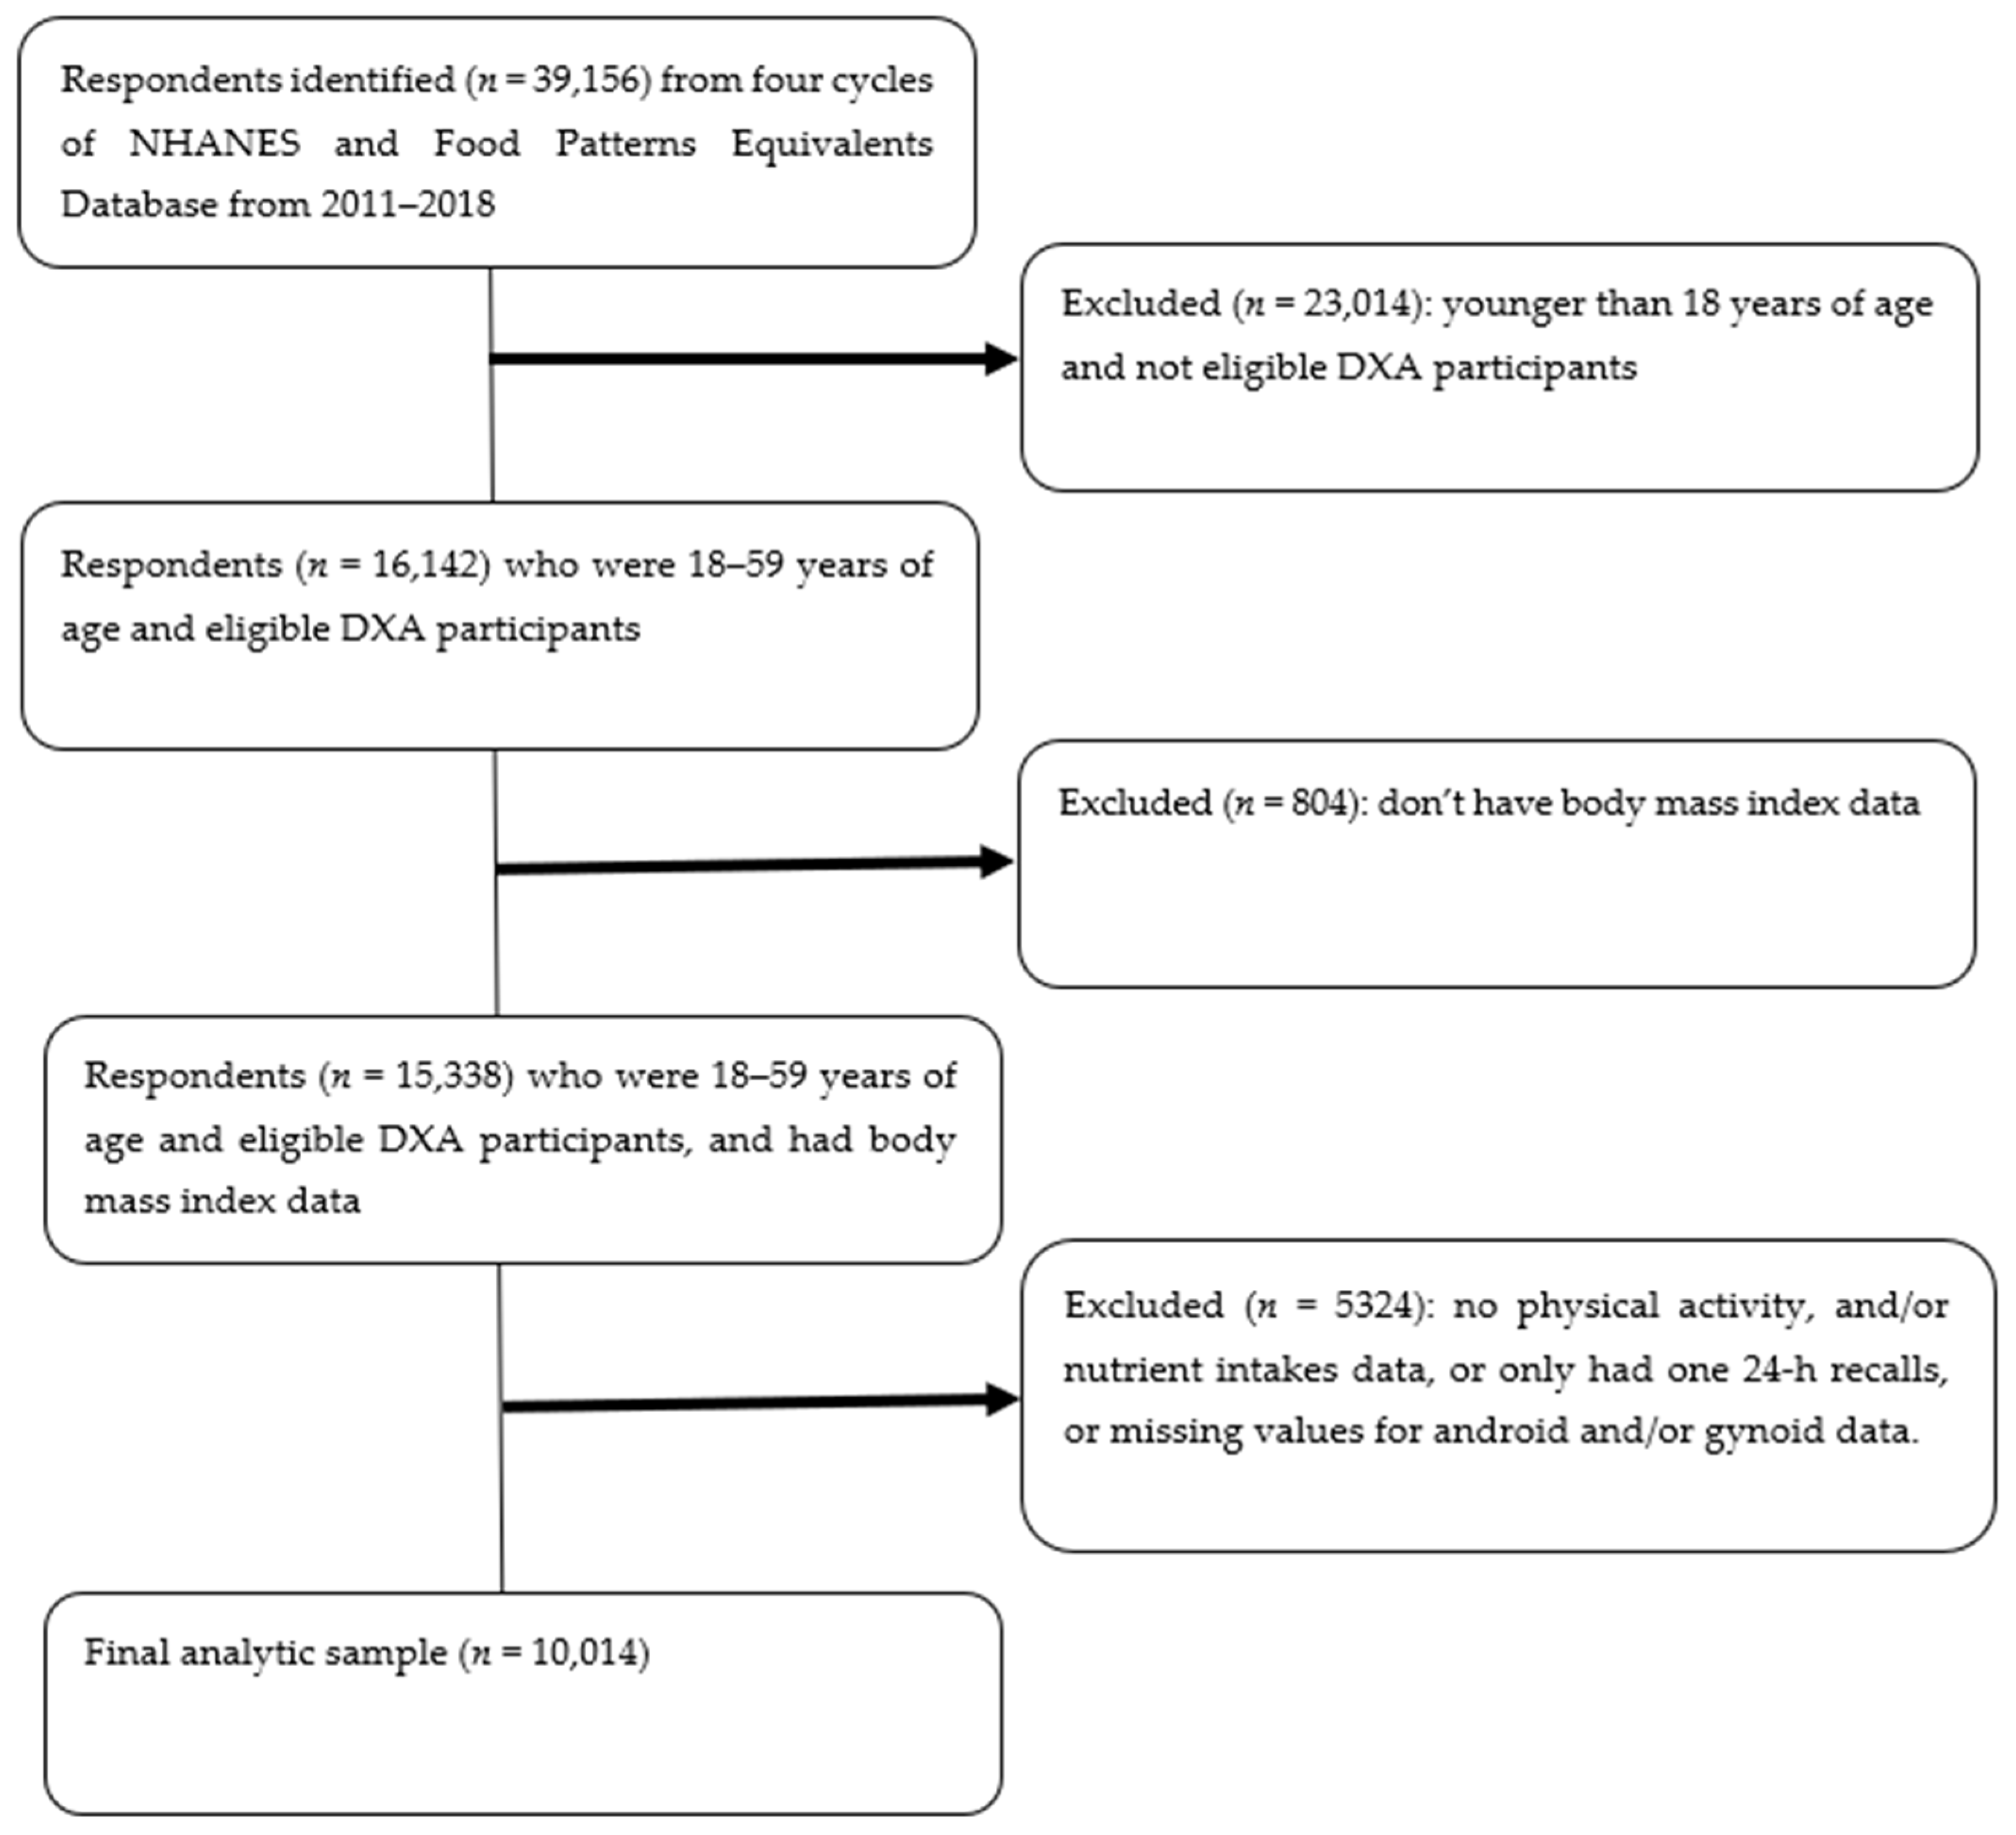
2. Methods
2.1. Android Fat Composition and Distribution
2.2. Physical Activity
2.3. Dietary Quality
2.4. Lifestyle Groups
2.5. Confounding Variables
2.6. Data Analysis
3. Results
4. Discussion
5. Limitations and Strength
6. Conclusions
Author Contributions
Funding
Institutional Review Board Statement
Informed Consent Statement
Data Availability Statement
Conflicts of Interest
References
- Fryar, C.D.; Carroll, M.D.; Afful, J. Prevalence of Overweight, Obesity, and Severe Obesity Among Adults Aged 20 and Over: United States, 1960–1962 Through 2017–2018; NCHS Health: Hyattsville, MD, USA, 2020.
- Managing Overweight and Obesity in Adults: Systematic Evidence Reviews from the Obesity Expert Panel; Agency for Healthcare Research and Quality: Rockville, MD, USA, 2013. Available online: https://www.ahrq.gov/evidencenow/heart-health/overall/obesity.html (accessed on 22 August 2018).
- Knight, J.A. Diseases and disorders associated with excess body weight. Ann. Clin. Lab. Sci. 2011, 41, 107–121. [Google Scholar] [PubMed]
- Kotronen, A.; Yki-Järvinen, H.; Sevastianova, K.; Bergholm, R.; Hakkarainen, A.; Pietiläinen, K.H.; Juurinen, L.; Lundbom, N.; Sørensen, T.I. Comparison of the relative contributions of intra-abdominal and liver fat to components of the metabolic syndrome. Obesity 2011, 19, 23–28. [Google Scholar] [CrossRef] [PubMed]
- Kang, S.M.; Yoon, J.W.; Ahn, H.Y.; Kim, S.Y.; Lee, K.H.; Shin, H.; Choi, S.H.; Park, K.S.; Jang, H.C.; Lim, S. Android fat depot is more closely associated with metabolic syndrome than abdominal visceral fat in elderly people. PLoS ONE 2011, 6, e27694. [Google Scholar] [CrossRef] [PubMed]
- Min, K.B.; Min, J.Y. Android and gynoid fat percentages and serum lipid levels in United States adults. Clin. Endocrinol. 2015, 82, 377–387. [Google Scholar] [CrossRef]
- Wang, Y.; Rimm, E.B.; Stampfer, M.J.; Willett, W.C.; Hu, F.B. Comparison of abdominal adiposity and overall obesity in predicting risk of type 2 diabetes among men. Am. J. Clin. Nutr. 2005, 81, 555–563. [Google Scholar] [CrossRef] [Green Version]
- Sari, C.I.; Eikelis, N.; Head, G.A.; Schlaich, M.; Meikle, P.; Lambert, G.; Lambert, E. Android fat deposition and its association with cardiovascular risk factors in overweight young males. Front. Physiol. 2019, 10, 1162. [Google Scholar] [CrossRef]
- Toss, F.; Wiklund, P.; Franks, P.W.; Eriksson, M.; Gustafson, Y.; Hallmans, G.; Nordström, P.; Nordström, A. Abdominal and gynoid adiposity and the risk of stroke. Int. J. Obes. 2011, 35, 1427–1432. [Google Scholar] [CrossRef] [Green Version]
- Kay, S.J.; Fiatarone Singh, M.A. The influence of physical activity on abdominal fat: A systematic review of the literature. Obes. Rev. 2006, 7, 183–200. [Google Scholar] [CrossRef]
- Bann, D.; Kuh, D.; Wills, A.; Adams, J.; Brage, S.; Cooper, R. Physical activity across adulthood in relation to fat and lean body mass in early old age: Findings from the Medical Research Council National Survey of Health and Development, 1946–2010. Am. J. Epidemiol. 2014, 179, 197–1207. [Google Scholar] [CrossRef] [Green Version]
- Bann, D.; Kuh, D.; Wills, A.; Adams, J.; Brage, S.; Cooper, R. Physical activity and abdominal fat distribution in Greenland. Med. Sci. Sports Exerc. 2017, 9, 2064–2070. [Google Scholar]
- Dahl-Petersen, I.K.; Bjerregaard, P.; Brage, S.; Jorgensen, M.E. Physical activity energy expenditure is associated with 2-h insulin independently of obesity among Inuit in Greenland. Diabetes Res. Clin. Pract. 2013, 102, 242–249. [Google Scholar] [CrossRef] [PubMed]
- Irving, B.A.; Davis, C.K.; Brock, D.W.; Weltman, J.Y.; Swift, D.; Barrett, E.J.; Gaesser, G.A.; Weltman, A. Effect of exercise training intensity on abdominal visceral fat and body composition. Med. Sci. Sports Exerc. 2008, 40, 1863–1872. [Google Scholar] [CrossRef] [PubMed] [Green Version]
- Wirt, A.; Collins, C.E. Diet quality—What is it and does it matter? Public Health Nutr. 2009, 12, 2473–2492. [Google Scholar] [CrossRef] [PubMed] [Green Version]
- Hennein, R.; Liu, C.; McKeown, N.M.; Hoffmann, U.; Long, M.T.; Levy, D.; Ma, J. Increased Diet Quality is Associated with Long-Term Reduction of Abdominal and Pericardial Fat. Obesity 2019, 27, 670–677. [Google Scholar] [CrossRef]
- Wolongevicz, D.M.; Zhu, L.; Pencina, M.J.; Kimokoti, R.W.; Newby, P.K.; D’Agostino, R.B.; Millen, B.E. An obesity dietary quality index predicts abdominal obesity in women: Potential opportunity for new prevention and treatment paradigms. J. Obes. 2010, 2010, 945987. [Google Scholar] [CrossRef] [Green Version]
- Smee, D.; Pumpa, K.; Falchi, M.; Lithander, F.E. The Relationship between Diet Quality and Falls Risk, Physical Function and Body Composition in Older Adults. J. Nutr. Health Aging 2015, 19, 1037–1042. [Google Scholar] [CrossRef]
- Panizza, C.E.; Wong, M.C.; Kelly, N.; Liu, Y.E.; Shvetsov, Y.B.; Lowe, D.A.; Weiss, E.J.; Heymsfield, S.B.; Kennedy, S.; Boushey, C.J.; et al. Diet quality and visceral adiposity among a multiethnic population of young, middle and older aged adults. Curr. Dev. Nutr. 2020, 4, nzaa090. [Google Scholar] [CrossRef]
- Funtikova, A.N.; Benítez-Arciniega, A.A.; Gomez, S.F.; Fitó, M.; Elosua, R.; Schröder, H. Mediterranean diet impact on changes in abdominal fat and 10-year incidence of abdominal obesity in a Spanish population. Br. J. Nutr. 2014, 111, 1481–1487. [Google Scholar] [CrossRef] [Green Version]
- George, M.G.; Tong, X.; Kuklina, E.V.; Labarthe, D.R. Trends in stroke hospitalizations and associated risk factors among children and young adults, 1995–2008. Ann. Neurol. 2011, 70, 713–721. [Google Scholar] [CrossRef]
- Whitsel, E.A.; Nguyen, Q.C.; Suchindran, C.M.; Tabor, J.W.; Cuthbertson, C.C.; Wener, M.H.; Potter, A.J.; Killeya-Jones, L.; Hussey, J.M.; Halpern, C.T.; et al. Dried capillary whole blood spot-based hemoglobin A1c, fasting glucose, and diabetes prevalence in a nationally representative population of young U.S. adults: Add Health, wave IV. Circulation 2012, 125, AP010. [Google Scholar] [CrossRef]
- Pollack, L.M.; Wang, M.; Leung, M.Y.M.; Colditz, G.; Herrick, C.; Chang, S.-H. Obesity-related multimorbidity and risk of cardiovascular disease in the middle-aged population in the United States. Prev. Med. 2020, 139, 106225. [Google Scholar] [CrossRef] [PubMed]
- Akune, T.; Muraki, S.; Oka, H.; Tanaka, S.; Kawaguchi, H.; Nakamura, K.; Yoshimura, N. Exercise habits during middle age are associated with lower prevalence of sarcopenia: The ROAD study. Osteoporos. Int. 2014, 25, 1081–1088. [Google Scholar] [CrossRef] [PubMed]
- Centers for Disease Control and Prevention. National Health and Nutrition Examination Survey. Available online: https://wwwn.cdc.gov/nchs/nhanes (accessed on 12 October 2021).
- United States Department of Agriculture. Food Patterns Equivalents Database. Available online: https://www.ars.usda.gov/northeast-area/beltsville-md-bhnrc/beltsville-human-nutrition-research-center/food-surveys-research-group/docs/fped-databases/ (accessed on 12 October 2021).
- National Center for Health Statistics. Centers for Disease Control and Prevention National Health and Nutrition Examination Survey (NHANES) Questionnaire and Exam Protocol. Available online: http://www.cdc.gov/nchs/about/major/nhanes/questexam.htm (accessed on 11 October 2021).
- Shepherd, J.A.; Fan, B.; Lu, Y.; Wu, X.P.; Wacker, W.K.; Ergun, D.L.; Levine, M.A. A multinational study to develop universal standardization of whole-body bone density composition using GE healthcare lunar and Hologic DXA systems. J. Bone Miner. Res. 2012, 27, 2208–2216. [Google Scholar] [CrossRef] [PubMed]
- World Health Organization. Global Physical Activity Questionnaire (GPAQ) Analysis Guide. Available online: https://www.who.int/ncds/surveillance/steps/resources/GPAQ_Analysis_Guide.pdf (accessed on 11 October 2021).
- US Department of Health and Human Services. Physical Activity Guidelines for Americans, 2nd ed.; U.S. Department of Health and Human Services: Washington, DC, USA, 2018.
- National Cancer Institute—Division of Cancer Control & Population Sciences. The Healthy Eating Index. Available online: https://epi.grants.cancer.gov/hei/sas-code.html (accessed on 11 October 2021).
- Hu, F.B. Dietary pattern analysis: A new direction in nutritional epidemiology. Curr. Opin. Lipidol. 2002, 13, 3–9. [Google Scholar] [CrossRef]
- Comee, L.; Taylor, C.A.; Nahikian-Nelms, M.; Ganesan, L.P.; Krok-Schoen, J.L. Dietary patterns and nutrient intake of individuals with rheumatoid arthritis and osteoarthritis in the United States. Nutrition 2019, 67, 110533. [Google Scholar] [CrossRef] [Green Version]
- Xu, F.; Cohen, S.A.; Lofgren, I.E.; Greene, G.W.; Delmonico, M.J.; Greaney, M.L. Relationship between Diet Quality, Physical Activity and Health-Related Quality of Life in Older Adults: Findings from 2007–2014 National Health and Nutrition Examination Survey. J. Nutr. Health Aging 2018, 22, 1072–1079. [Google Scholar] [CrossRef] [Green Version]
- Centers for Disease Control and Prevention. About Adult BMI. Available online: https://www.cdc.gov/healthyweight/assessing/bmi/adult_bmi/index.html (accessed on 12 October 2021).
- Mogensen, C.S.; Færch, K.; Bruhn, L.; Amadid, H.; Tetens, I.; Quist, J.S.; Clemmensen, K.K.B. Timing and Frequency of Daily Energy Intake in Adults with Prediabetes and Overweight or Obesity and Their Associations with Body Fat. Nutrients 2020, 12, 3484. [Google Scholar] [CrossRef]
- National Center for Health Statistics. NHANES Survey Methods and Analytic Guidelines. Available online: https://wwwn.cdc.gov/nchs/nhanes/analyticguidelines.aspx (accessed on 12 October 2021).
- Belsley, D.A. A Guide to using the collinearity diagnostics. Comput. Sci. Econ. Manag. 1991, 4, 33–50. [Google Scholar]
- Ainsworth, B.E.; Haskell, W.L.; Herrmann, S.D.; Meckes, N.; Bassett, D.R.; Tudor-Locke, C.; Greer, J.L.; Vezina, J.; Whitt-Glover, M.C.; Leon, A.S. Compendium of Physical Activities: A second update of codes and MET values. Med. Sci. Sports Exerc. 2011, 43, 1575–1581. [Google Scholar] [CrossRef] [Green Version]
- Krebs-Smith, S.M.; Pannucci, T.E.; Subar, A.F.; Kirkpatrick, S.I.; Lerman, J.L.; Tooze, J.A.; Wilson, M.M.; Reedy, J. Update of the Healthy Eating Index: HEI-2015. J. Acad. Nutr. Diet. 2018, 118, 1591–1602. [Google Scholar] [CrossRef] [Green Version]


| Variables | Total | Male | Female | p Value |
|---|---|---|---|---|
| n = 10,014 | n = 4962 (51.3%) | n = 5052 (48.7%) | ||
| Age, n (weighted %) | ||||
| 18–39 yrs | 5326 (52.1) | 2730 (54.3) | 2596 (49.8) | 0.002 * |
| 40–59 yrs | 4688 (47.9) | 2232 (45.7) | 2456 (50.2) | 0.002 * |
| Race/ethnicity, n (weighted %) | ||||
| White | 3552 (60.7) | 1786 (60.7) | 1766 (60.6) | 0.921 |
| Black | 2286 (12.0) | 1089 (11.5) | 1197 (12.6) | 0.007 * |
| Hispanic | 2425 (17.4) | 1150 (17.7) | 1275 (17.1) | 0.363 |
| Others | 1751 (9.9) | 937 (10.1) | 814 (9.7) | 0.491 |
| Education, n (weighted %) | ||||
| High school or less | 3457 (32.9) | 1876 (36.0) | 1581 (29.7) | <0.001 * |
| Some college or more | 5758 (67.1) | 2687 (64.0) | 3071 (70.3) | <0.001 * |
| Ratio of family income to poverty, n (weighted %) | ||||
| <1.0 | 2086 (15.9) | 945 (14.4) | 1141 (17.5) | <0.001 * |
| ≥1.0 | 7166 (84.1) | 3623 (85.6) | 3543 (82.5) | <0.001 * |
| Body Mass Index (kg/m2) | 28.91 ± 0.15 | 28.72 ± 0.17 | 29.11 ± 0.20 | 0.079 |
| Weight status, n (weighted %) | ||||
| Underweight | 196 (1.6) | 86 (1.1) | 110 (2.0) | 0.008 * |
| Normal | 2927 (29.1) | 1373 (26.2) | 1554 (32.1) | <0.001 * |
| Overweight | 3026 (31.5) | 1734 (36.0) | 1292 (26.7) | <0.001 * |
| Obese | 3812 (37.3) | 1743 (36.2) | 2069 (38.4) | 0.17 |
| Daily energy intake (kcal/d) | 2158.07 ± 13.80 | 2478.55 ± 18.05 | 1820.78 ± 16.94 | <0.001 * |
| Android percent fat | 34.91 ± 0.19 | 31.58 ± 0.22 | 38.41 ± 0.28 | <0.001 * |
| Gynoid percent fat | 35.38 ± 0.15 | 28.82 ± 0.14 | 42.29 ± 0.15 | <0.001 * |
| Android to Gynoid ratio | 1.00 ± 0.00 | 1.09 ± 0.01 | 0.90 ± 0.00 | <0.001 * |
| Dietary quality (HEI-2015) | ||||
| Total dietary quality score | 52.67 ± 0.33 | 51.30 ± 0.35 | 54.11 ± 0.43 | <0.001 * |
| 1st tertile (10 ≤ HEI ≤ 45.8), n (weighted %) | 3337 (32.8) | 1796 (36.2) | 1541 (29.3) | <0.001 * |
| 2nd tertile (45.8 < HEI ≤ 58.1), n (weighted %) | 3338 (33.2) | 1670 (33.5) | 1668 (32.9) | 0.67 |
| 3rd tertile (58.1 < HEI ≤ 95.8), n (weighted %) | 3339 (34.0) | 1496 (30.3) | 1843 (37.8) | <0.001 * |
| Physical Activity (MET-minutes/week) | ||||
| Total Physical Activity | 3777.41 ± 106.59 | 4917.00 ± 178.13 | 2578.03 ± 88.64 | <0.001 * |
| Insufficiently active (<600) | 3387 (31.0) | 1288 (24.7) | 2099 (37.6) | <0.001 * |
| Active (600–1200) | 1356 (13.3) | 577 (11.0) | 779 (15.6) | <0.001 * |
| Highly active (>1200) | 5271 (55.8) | 3097 (64.3) | 2174 (46.8) | <0.001 * |
| Met PA recommendation (active +highly active), n (weighted %) | 6627 (69.0) | 3674 (75.3) | 2953 (62.4) | <0.001 * |
| PA + Diet, n (weighted %) | ||||
| Did not meet PA recommendation + lower dietary quality | 2354 (22.0) | 917 (17.4) | 1437 (26.9) | <0.001 * |
| Did not meet PA recommendation + higher dietary quality | 1033 (9.0) | 371 (7.3) | 662 (10.7) | <0.001 * |
| Met PA recommendation + lower dietary quality | 4321 (44.0) | 2549 (52.3) | 1772 (35.3) | <0.001 * |
| Met PA recommendation + higher dietary quality | 2306 (25.0) | 1125 (23.0) | 1181 (27.1) | 0.002 * |
| Variable | Android Percent Fat | Android to Gynoid Ratio |
|---|---|---|
| Weighted Mean ± SE | Weighted Mean ± SE | |
| Total | 34.91 ± 0.19 | 1.00 ± 0.00 |
| Physical activity | ||
| Insufficiently active | 37.91 ± 0.28 | 1.01 ± 0.01 |
| Active | 35.48 ± 0.41 | 0.99 ± 0.01 |
| Highly active | 33.11 ± 0.23 | 1.00 ± 0.01 |
| Dietary quality (HEI-2015) | ||
| 1st tertile | 35.48 ± 0.25 | 1.02 ± 0.01 |
| 2nd tertile | 35.24 ± 0.26 | 1.01 ± 0.00 |
| 3rd tertile | 34.03 ± 0.28 | 0.97 ± 0.01 |
| PA + Diet | ||
| Did not meet PA recommendation + lower dietary quality | 38.35 ± 0.30 | 1.01 ± 0.01 |
| Did not meet PA recommendation + higher dietary quality | 36.83 ± 0.58 | 1.00 ± 0.01 |
| Met PA recommendation + lower dietary quality | 33.87 ± 0.22 | 1.01 ± 0.00 |
| Met PA recommendation + higher dietary quality | 33.02 ± 0.29 | 0.96 ± 0.01 |
| Male | 31.58 ± 0.22 | 1.09 ± 0.01 |
| Physical activity | ||
| Insufficiently active | 33.77 ± 0.37 | 1.12 ± 0.01 |
| Active | 32.44 ± 0.60 | 1.11 ± 0.02 |
| Highly active | 30.60 ± 0.26 | 1.08 ± 0.01 |
| Dietary quality (HEI-2015) | ||
| 1st tertile | 32.09 ± 0.29 | 1.09 ± 0.01 |
| 2nd tertile | 31.44 ± 0.35 | 1.09 ± 0.01 |
| 3rd tertile | 31.13 ± 0.41 | 1.09 ± 0.01 |
| PA + Diet | ||
| Did not meet PA recommendation + lower dietary quality | 34.05 ± 0.35 | 1.11 ± 0.01 |
| Did not meet PA recommendation + higher dietary quality | 33.09 ± 0.94 | 1.13 ± 0.02 |
| Met PA recommendation + lower dietary quality | 31.03 ± 0.28 | 1.08 ± 0.01 |
| Met PA recommendation + higher dietary quality | 30.50 ± 0.40 | 1.08 ± 0.01 |
| Female | 38.41 ± 0.28 | 0.90 ± 0.00 |
| Physical activity | ||
| Insufficiently active | 40.77 ± 0.30 | 0.93 ± 0.01 |
| Active | 37.74 ± 0.44 | 0.90 ± 0.01 |
| Highly active | 36.74 ± 0.39 | 0.88 ± 0.01 |
| Dietary quality (HEI-2015) | ||
| 1st tertile | 39.89 ± 0.40 | 0.93 ± 0.01 |
| 2nd tertile | 39.32 ± 0.38 | 0.92 ± 0.01 |
| 3rd tertile | 36.48 ± 0.35 | 0.87 ± 0.01 |
| PA + Diet | ||
| Did not meet PA recommendation + lower dietary quality | 41.27 ± 0.36 | 0.94 ± 0.01 |
| Did not meet PA recommendation + higher dietary quality | 39.51 ± 0.58 | 0.91 ± 0.01 |
| Met PA recommendation + lower dietary quality | 38.30 ± 0.39 | 0.91 ± 0.01 |
| Met PA recommendation + higher dietary quality | 35.28 ± 0.35 | 0.86 ± 0.01 |
| Variable | Android Percent Fat | Android to Gynoid Ratio | ||||
|---|---|---|---|---|---|---|
| Adj. β (95% CI) | p-Value | R-Square | Adj. β (95% CI) | p-Value | R-Square | |
| PA total-per 100-point increase | −0.0103 (−0.0140, −0.0066) | <0.001 * | 0.638 | −0.0001 (−0.0002, 0.0000) | 0.086 | 0.498 |
| Insufficiently active | Ref | - | 0.652 | Ref | - | 0.502 |
| Active | −0.38 (−0.85, 0.10) | 0.12 | 0.01 (−0.00, 0.03) | 0.06 | ||
| Highly active | −1.64 (−2.05, −1.23) | <0.001 * | −0.01 (−0.02, 0.01) | 0.349 | ||
| HEI total-per 10-point increase | −0.34 (−0.49, −0.19) | <0.001 * | 0.637 | −0.01 (−0.01, −0.00) | 0.014 * | 0.498 |
| 1st tertile | Ref | - | 0.648 | Ref | - | 0.501 |
| 2nd tertile | −0.19 (−0.53, 0.15) | 0.257 | −0.01 (−0.01, 0.01) | 0.917 | ||
| 3rd tertile | −1.02 (−1.50, −0.54) | <0.001 * | −0.01 (−0.02, 0.00) | 0.068 | ||
| PA + Diet | ||||||
| Did not meet PA recommendation + lower dietary quality | Ref | - | 0.652 | Ref | - | 0.502 |
| Did not meet PA recommendation + higher dietary quality | −0.67 (−1.58, 0.24) | 0.145 | −0.01 (−0.02, 0.02) | 0.868 | ||
| Met PA recommendation + lower dietary quality | −1.25 (−1.64, −0.85) | <0.001 * | 0.01 (−0.01, 0.01) | 0.532 | ||
| Met PA recommendation + higher dietary quality | −2.12 (−2.57, −1.68) | <0.001 * | −0.01 (−0.02, 0.00) | 0.117 | ||
| Variable | Android Percent Fat | Android to Gynoid Ratio | ||||
|---|---|---|---|---|---|---|
| Adj. β (95% CI) | p-Value | R-Square | Adj. β (95% CI) | p-Value | R-Square | |
| Male | ||||||
| PA total-per 100-point increase | −0.0097 (−0.0138, −0.0056) | <0.001 * | 0.588 | −0.0001 (−0.0002, 0.0000) | 0.081 | 0.326 |
| Insufficiently active | Ref | 0.614 | Ref | 0.334 | ||
| Active | −0.24 (−0.95, 0.46) | 0.49 | 0.02 (−0.01, 0.05) | 0.164 | ||
| Highly active | −1.68 (−2.26, −1.09) | <0.001 * | −0.01 (−0.02, 0.01) | 0.425 | ||
| HEI total-per 10-point increase | −0.29 (−0.52, −0.06) | 0.013 * | 0.584 | −0.01 (−0.01, 0.00) | 0.161 | 0.325 |
| 1st tertile | Ref | 0.607 | Ref | 0.332 | ||
| 2nd tertile | −0.83 (−1.35, −0.31) | 0.002 * | −0.01 (−0.03, 0.01) | 0.433 | ||
| 3rd tertile | −0.96 (−1.73, −0.19) | 0.015 * | −0.01 (−0.03, 0.01) | 0.363 | ||
| PA + Diet | ||||||
| Did not meet PA recommendation + lower dietary quality | Ref | 0.612 | Ref | 0.332 | ||
| Did not meet PA recommendation + higher dietary quality | −0.68 (−2.18, 0.82) | 0.371 | 0.01 (−0.03, 0.05) | 0.669 | ||
| Met PA recommendation + lower dietary quality | −1.51 (−1.99, −1.03) | <0.001 * | 0.01 (−0.02, 0.02) | 0.788 | ||
| Met PA recommendation + higher dietary quality | −1.98 (−2.74, −1.22) | <0.001 * | −0.01 (−0.03, 0.02) | 0.554 | ||
| Female | ||||||
| PA total-per 100-point increase | −0.0115 (−0.0169, −0.0060) | <0.001 * | 0.59 | −0.0001 (−0.0001, 0.0001) | 0.91 | 0.398 |
| Insufficiently active | Ref | 0.599 | Ref | 0.401 | ||
| Active | −0.57 (−1.29, 0.16) | 0.123 | 0.01 (−0.01, 0.02) | 0.55 | ||
| Highly active | −1.60 (−2.08, −1.13) | <0.001 * | −0.01 (−0.02, 0.01) | 0.579 | ||
| HEI total-per 10-point increase | −0.41 (−0.58, −0.25) | <0.001 * | 0.591 | −0.01 (−0.01, −0.00) | 0.003 * | 0.4 |
| 1st tertile | Ref | - | 0.598 | Ref | - | 0.404 |
| 2nd tertile | 0.49 (−0.08, 1.07) | 0.093 | 0.01 (−0.01, 0.02) | 0.458 | ||
| 3rd tertile | −1.08 (−1.61, −0.56) | <0.001 * | −0.02 (−0.03, 0.00) | 0.026 * | ||
| PA + Diet | ||||||
| Did not meet PA recommendation + lower dietary quality | Ref | 0.602 | Ref | 0.404 | ||
| Did not meet PA recommendation + higher dietary quality | −0.76 (−1.60, 0.07) | 0.073 | −0.01 (−0.03, 0.01) | 0.209 | ||
| Met PA recommendation + lower dietary quality | −0.96 (−1.53, −0.38) | 0.002 * | 0.01 (−0.01, 0.02) | 0.371 | ||
| Met PA recommendation + higher dietary quality | −2.39 (−2.91, −1.87) | <0.001 * | −0.02 (−0.03, −0.00) | 0.022 * | ||
| Interaction term (sex × independent variable) | ||||||
| PA total-per 100-point increase | −0.0013 (−0.0071, 0.0046) | 0.659 | - | −0.0002 (−0.0004, −0.0001) | 0.003 * | - |
| Insufficiently active | Ref | - | Ref | - | ||
| Active | 0.19 (−0.90, 1.27) | 0.733 | 0.01 (−0.03, 0.04) | 0.651 | ||
| Highly active | −0.35 (−1.01, 0.30) | 0.284 | −0.02 (−0.04, 0.00) | 0.114 | ||
| HEI total-per 10-point increase | 0.15 (−0.10, 0.39) | 0.231 | - | 0.01 (−0.00, 0.01) | 0.073 | - |
| 1st tertile | Ref | - | - | Ref | - | - |
| 2nd tertile | −1.26 (−2.17, −0.35) | 0.008 * | −0.01 (−0.03, 0.02) | 0.603 | ||
| 3rd tertile | 0.26 (−0.61, 1.12) | 0.557 | 0.02 (−0.00, 0.04) | 0.106 | ||
| PA + Diet | ||||||
| Did not meet PA recommendation + lower dietary quality | Ref | - | Ref | - | ||
| Did not meet PA recommendation + higher dietary quality | 0.10 (−1.48, 1.69) | 0.899 | 0.03 (−0.01, 0.07) | 0.172 | ||
| Met PA recommendation + lower dietary quality | −0.86 (−1.58, −0.15) | 0.019 * | −0.02 (−0.04, 0.01) | 0.18 | ||
| Met PA recommendation + higher dietary quality | 0.21 (−0.68, 1.09) | 0.642 | 0.01 (−0.02, 0.03) | 0.592 | ||
Publisher’s Note: MDPI stays neutral with regard to jurisdictional claims in published maps and institutional affiliations. |
© 2022 by the authors. Licensee MDPI, Basel, Switzerland. This article is an open access article distributed under the terms and conditions of the Creative Commons Attribution (CC BY) license (https://creativecommons.org/licenses/by/4.0/).
Share and Cite
Xu, F.; Earp, J.E.; LoBuono, D.L.; Greene, G.W. The Relationship of Physical Activity and Dietary Quality with Android Fat Composition and Distribution in US Adults. Nutrients 2022, 14, 2804. https://doi.org/10.3390/nu14142804
Xu F, Earp JE, LoBuono DL, Greene GW. The Relationship of Physical Activity and Dietary Quality with Android Fat Composition and Distribution in US Adults. Nutrients. 2022; 14(14):2804. https://doi.org/10.3390/nu14142804
Chicago/Turabian StyleXu, Furong, Jacob E. Earp, Dara L. LoBuono, and Geoffrey W. Greene. 2022. "The Relationship of Physical Activity and Dietary Quality with Android Fat Composition and Distribution in US Adults" Nutrients 14, no. 14: 2804. https://doi.org/10.3390/nu14142804
APA StyleXu, F., Earp, J. E., LoBuono, D. L., & Greene, G. W. (2022). The Relationship of Physical Activity and Dietary Quality with Android Fat Composition and Distribution in US Adults. Nutrients, 14(14), 2804. https://doi.org/10.3390/nu14142804