

The Effects of Graded Protein Intake in Conjunction with Progressive Resistance Training on Skeletal Muscle Outcomes in Older Adults: A Preliminary Trial


Abstract
:1. Introduction
2. Materials and Methods
2.1. Participants
2.2. Study Design
2.2.1. Resistance Training Protocol
2.2.2. Nutrition Protocol
2.3. Measures
2.3.1. Height, Weight, and Body Mass Index
2.3.2. Lean/Soft Tissue Mass
2.3.3. Muscle Tissue Thickness
2.3.4. Peak Torque
2.3.5. Skeletal Muscle Quality and Skeletal Muscle Index
2.4. Analytic Plan
3. Results
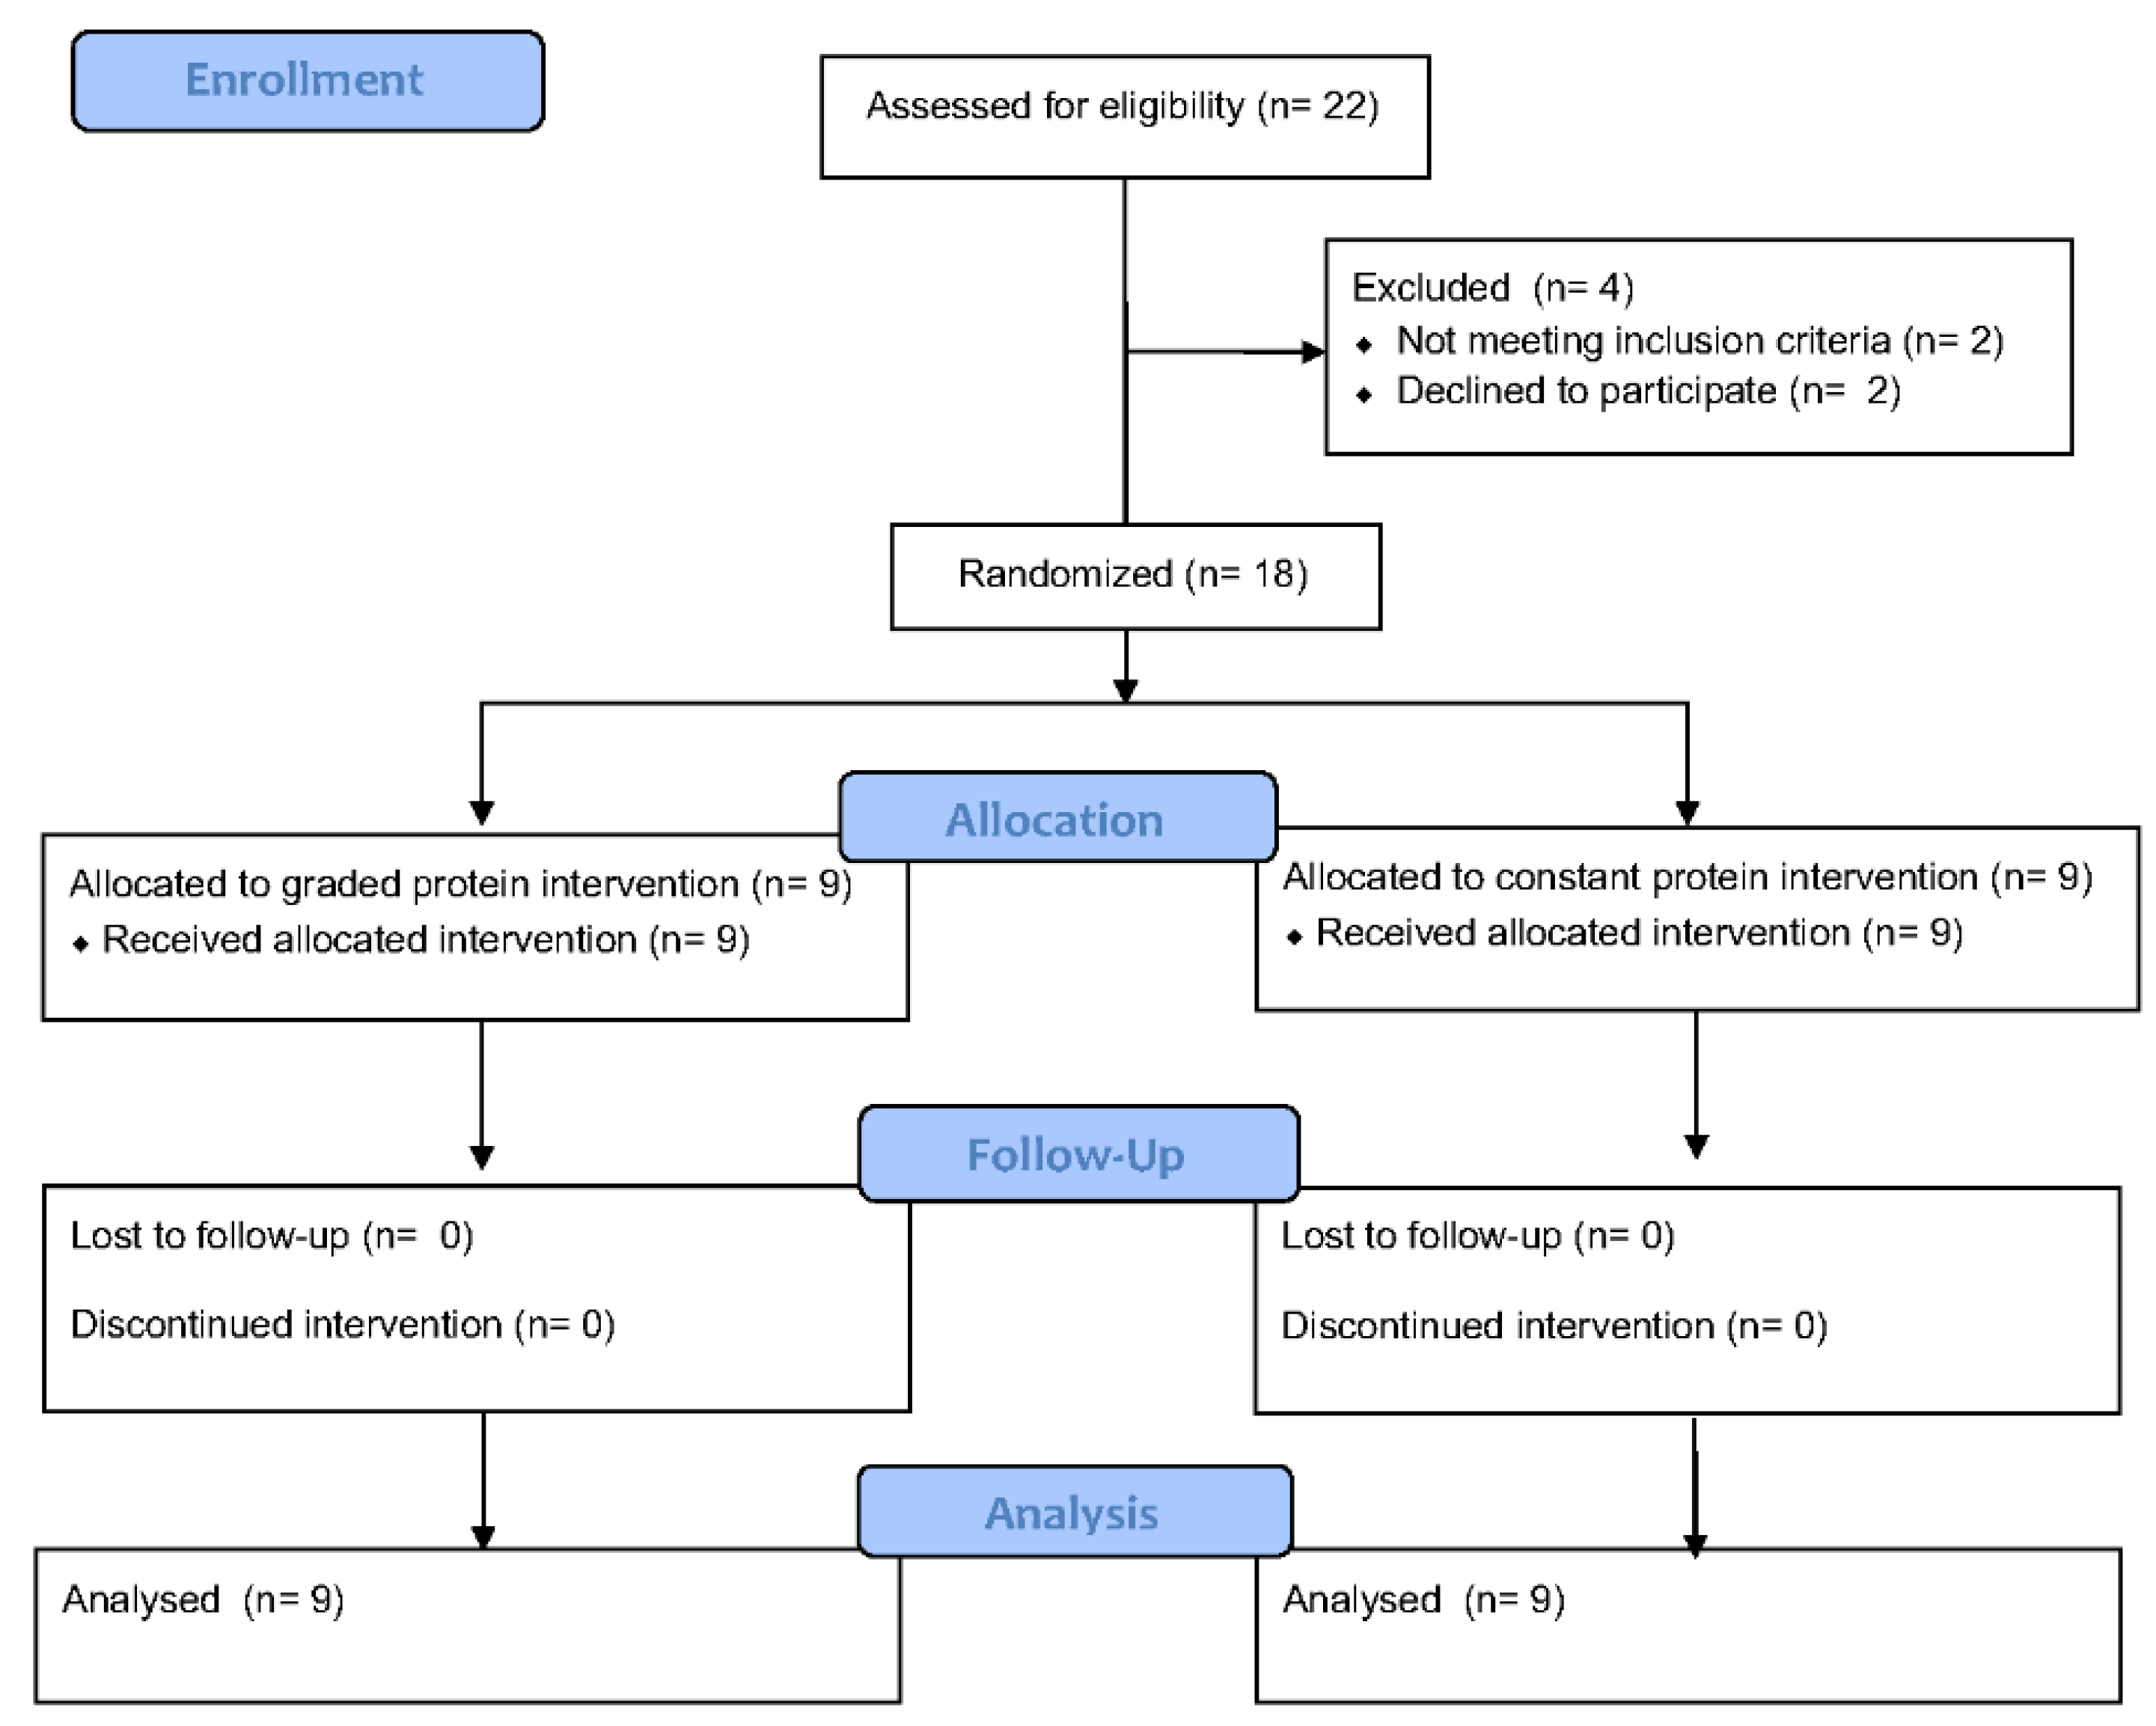
3.1. Participants
3.2. Self-Reported Dietary Intake
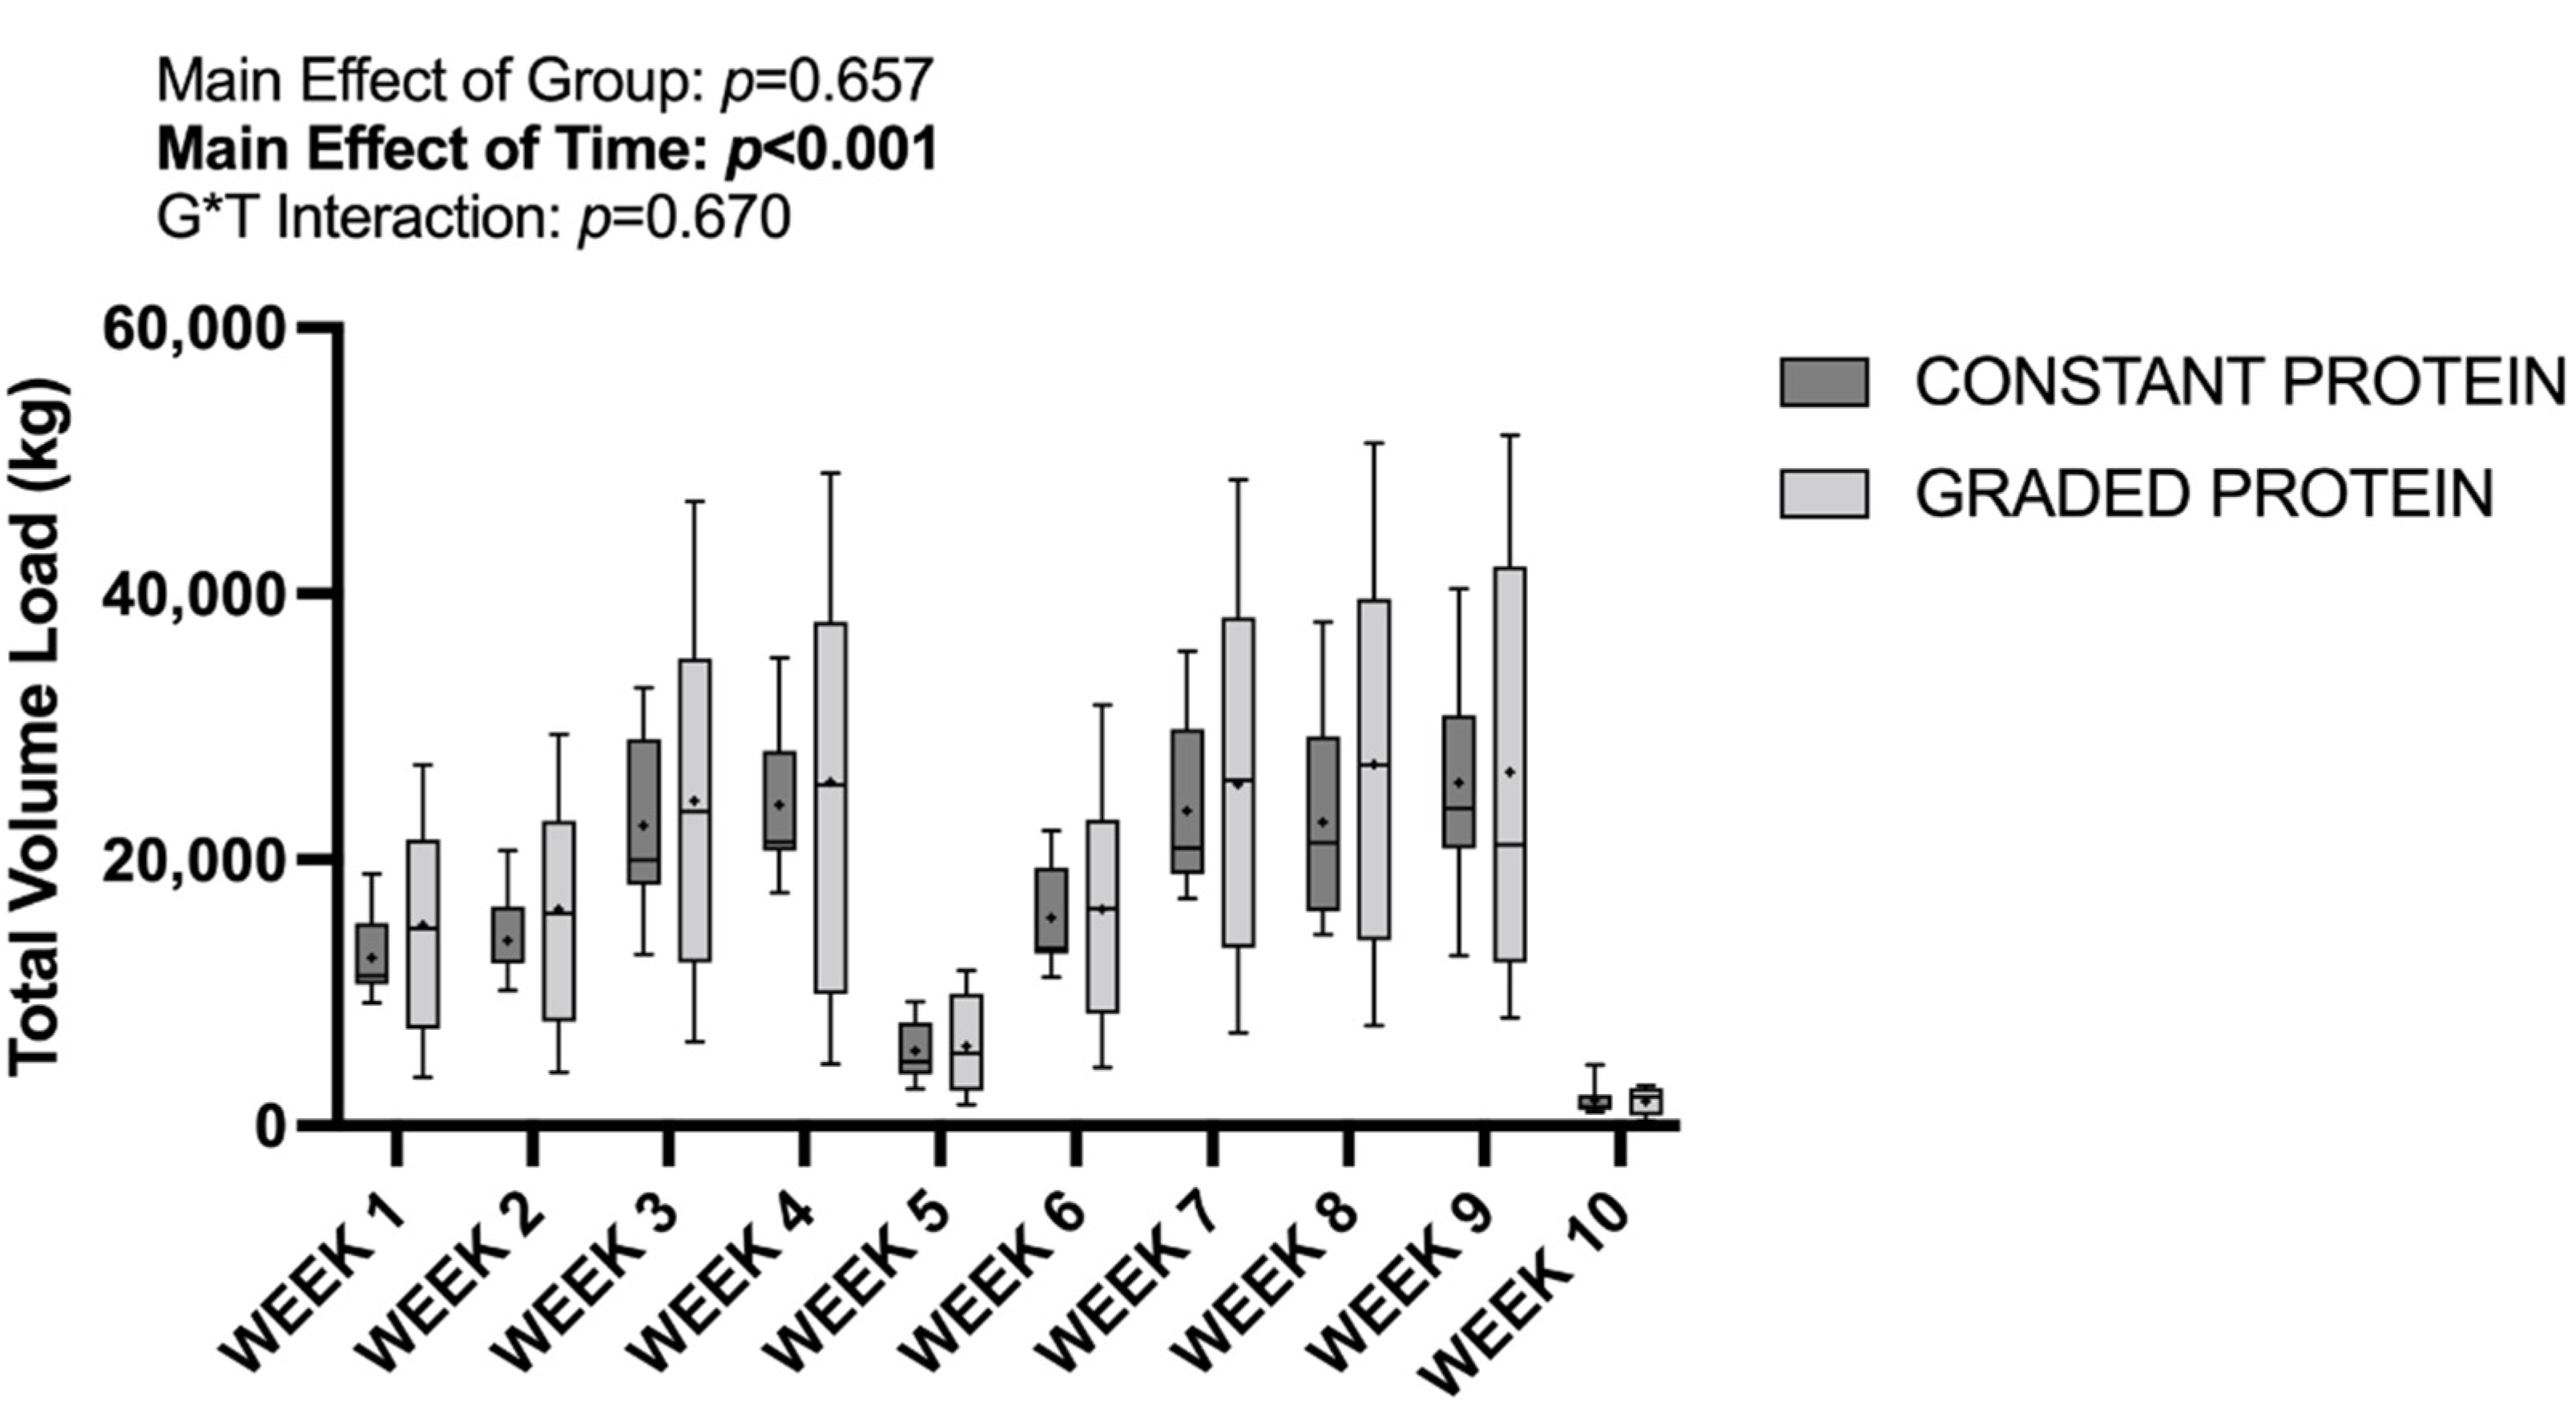
3.3. Training Volume and Attendance
3.4. Lean/Soft Tissue Mass and Lean/Soft Tissue Mass Index
3.5. Vastus Lateralis Thickness
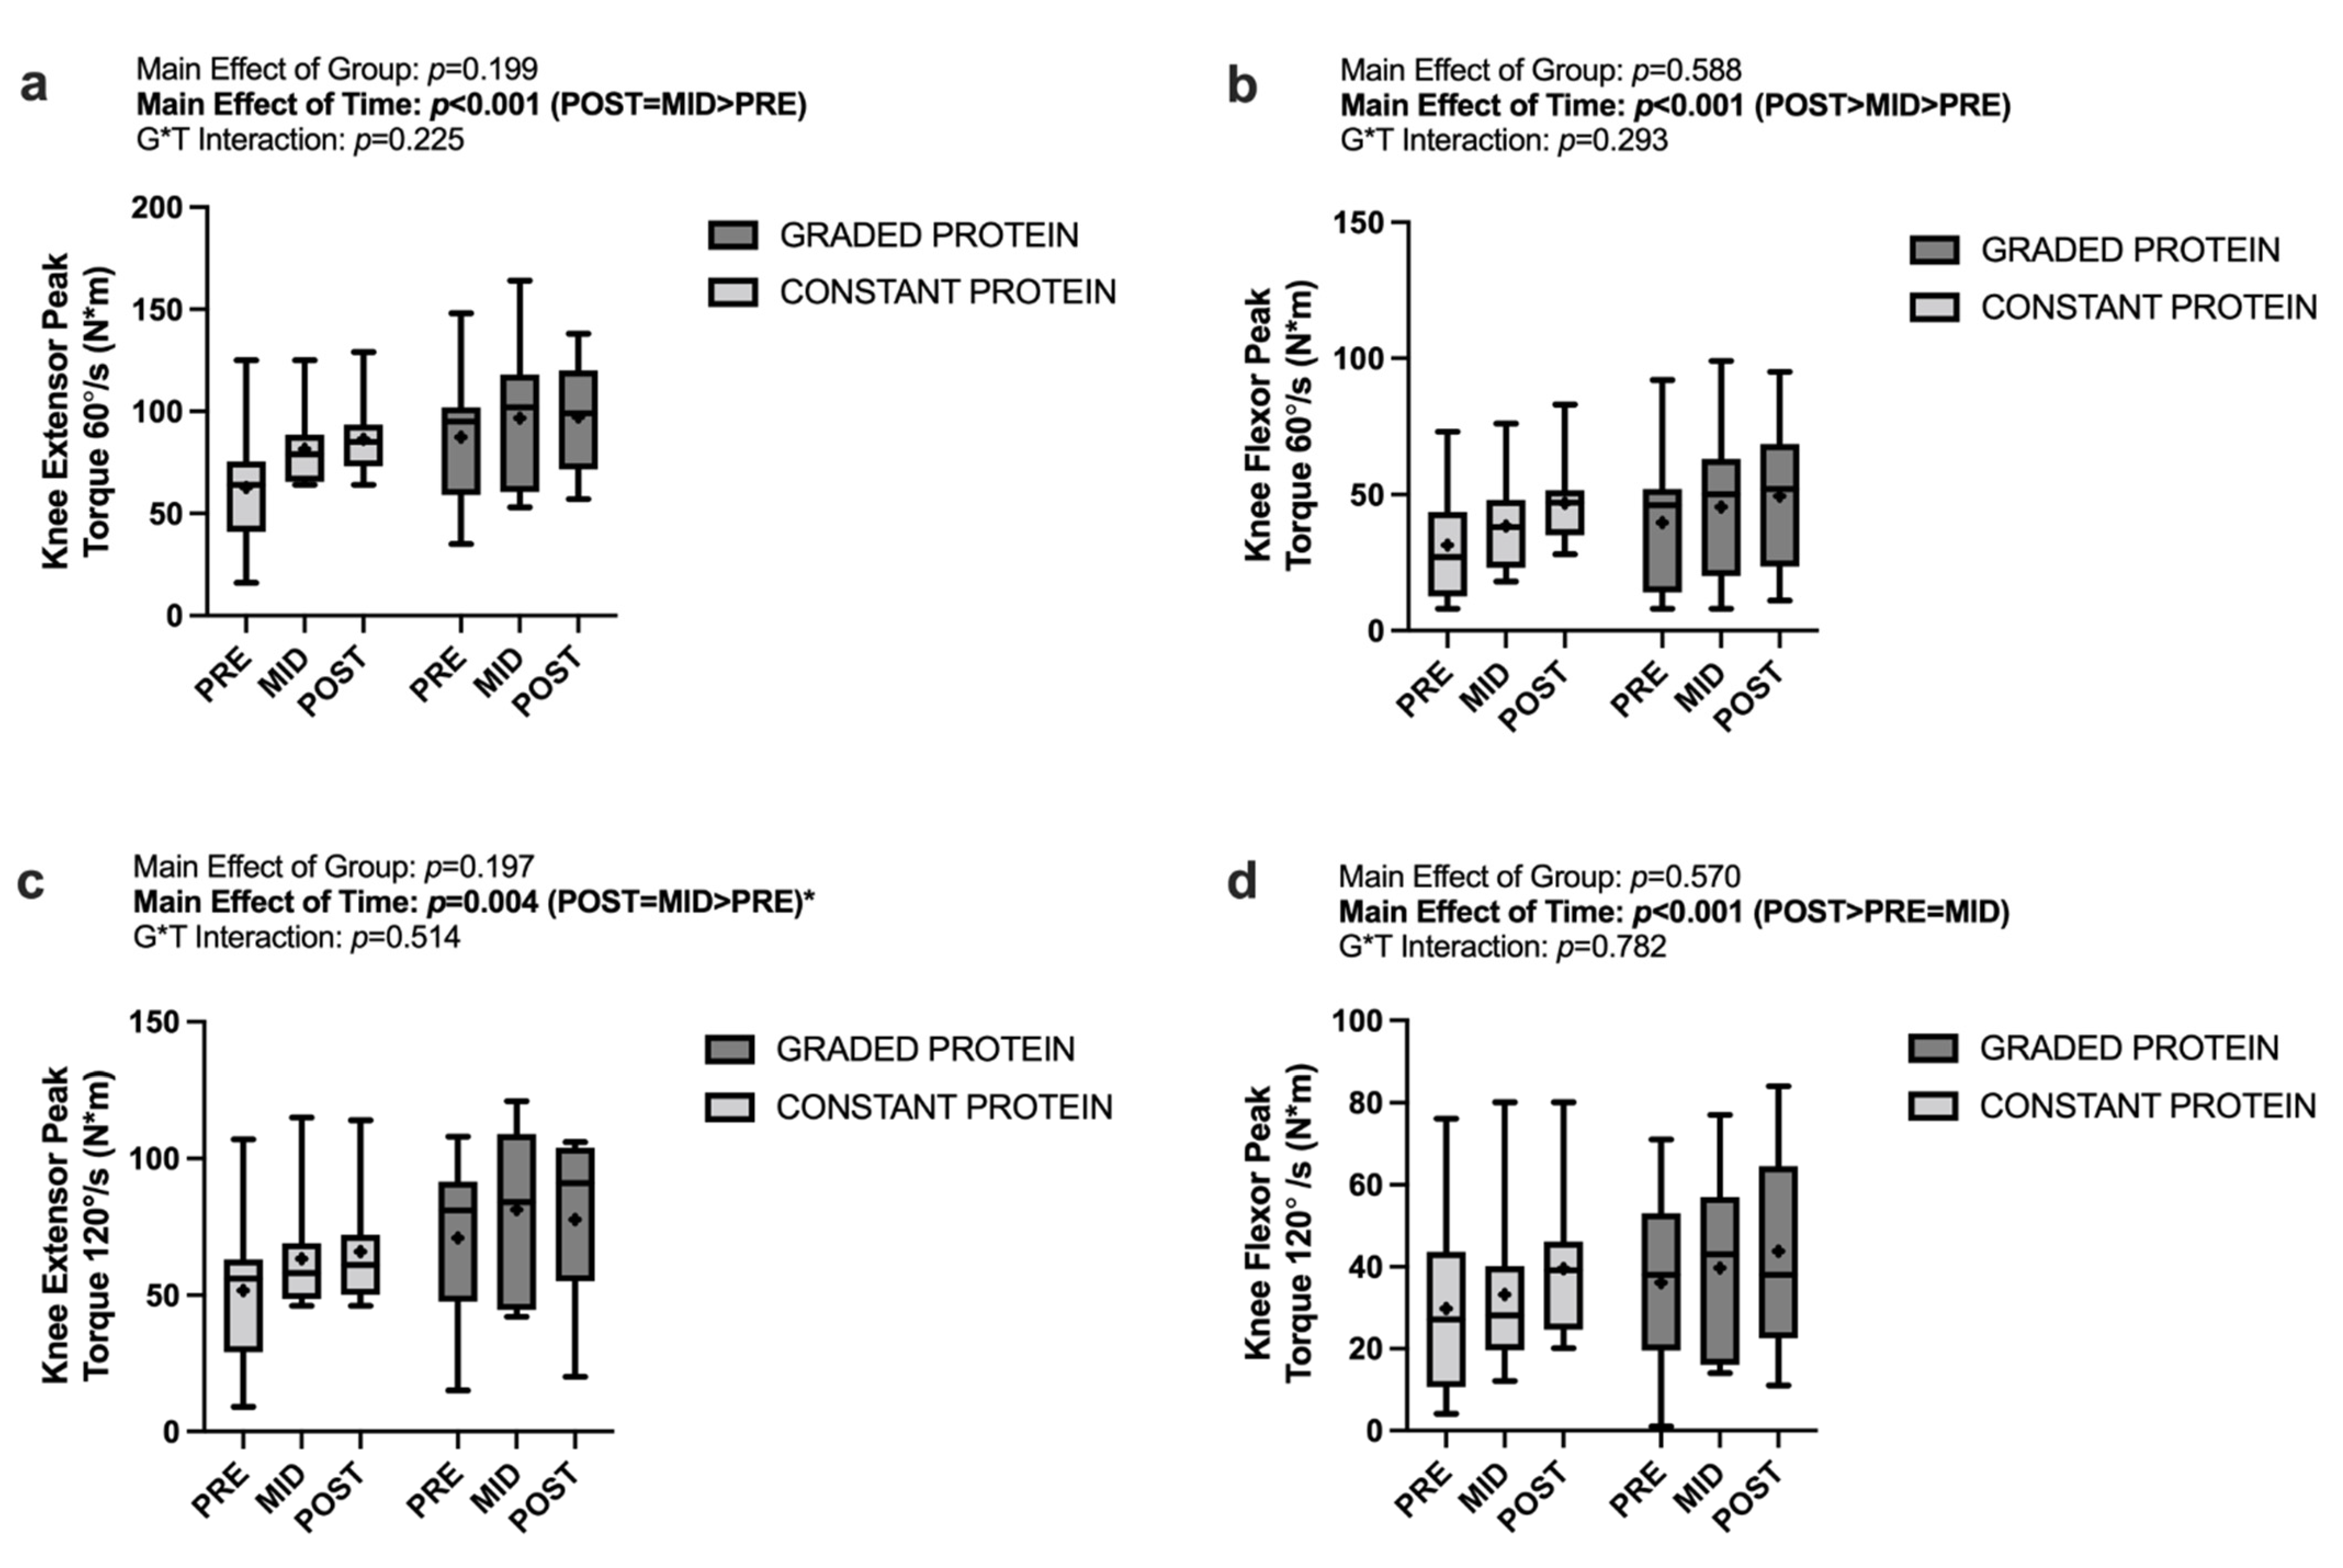
3.6. Peak Torque
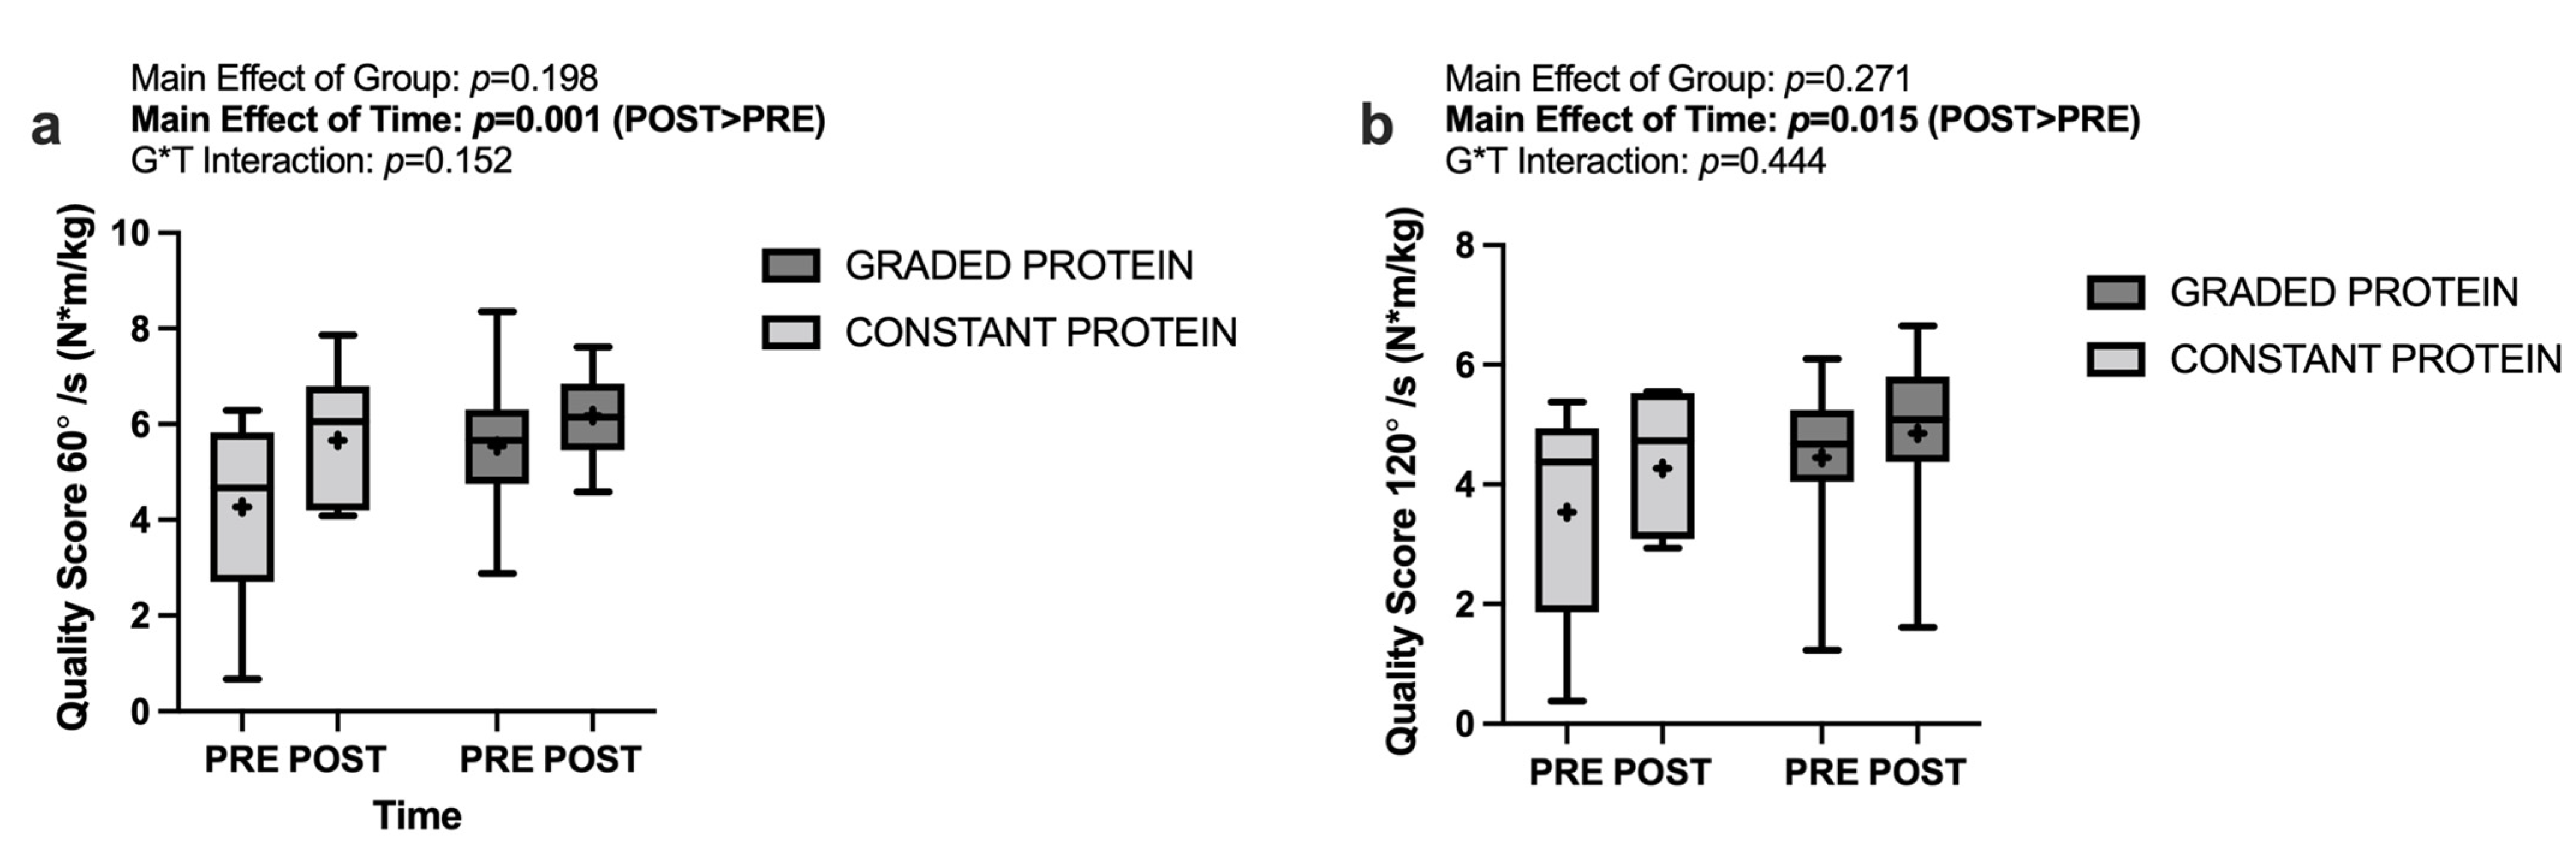
3.7. Muscle Quality Score
3.8. Analysis of Effects
4. Discussion
4.1. Nutrition and Resistance Training Intervention
4.2. Lean/Soft Tissue Mass and Vastus Lateralis Thickness
4.3. Isokinetic Dynamometry and Muscle Quality Score
4.4. Experimental Considerations
5. Conclusions
Author Contributions
Funding
Institutional Review Board Statement
Informed Consent Statement
Data Availability Statement
Acknowledgments
Conflicts of Interest
References
- Hayflick, L. How and why we age. Exp. Gerontol. 1998, 33, 639–653. [Google Scholar] [CrossRef]
- Goodpaster, B.H.; Park, S.W.; Harris, T.B.; Kritchevsky, S.B.; Nevitt, M.; Schwartz, A.V.; Simonsick, E.M.; Tylavsky, F.A.; Visser, M.; Newman, A.B.; et al. The Loss of Skeletal Muscle Strength, Mass, and Quality in Older Adults: The Health, Aging and Body Composition Study. J. Gerontol. A Biol. Sci. Med. Sci. 2006, 61, 1059–1064. [Google Scholar] [CrossRef]
- Jones, T.E.; Stephenson, K.W.; King, J.G.; Knight, K.R.; Marshall, T.L.; Scott, W.B. Sarcopenia-Mechanisms and Treatments. J. Geriatr. Phys. Ther. 2009, 32. Available online: https://journals.lww.com/jgpt/Fulltext/2009/32020/Sarcopenia___Mechanisms_and_Treatments.8.aspx (accessed on 7 August 2021). [CrossRef]
- Wolfe, R.R. The underappreciated role of muscle in health and disease1Ϫ3. Am. J. Clin. Nutr. 2006, 84, 475–482. [Google Scholar] [CrossRef]
- Anker, S.D.; Morley, J.E.; Von Haehling, S. Welcome to the ICD-10 code for sarcopenia. J. Cachex-Sarcopenia Muscle 2016, 7, 512–514. [Google Scholar] [CrossRef]
- Kadar, L.; Albertsson, M.; Areberg, J.; Landberg, T.; Mattsson, S. The prognostic value of body protein in patients with lung cancer. Ann. N. Y. Acad. Sci. 2006, 904, 584–591. [Google Scholar] [CrossRef]
- Fulop, T.; Larbi, A.; Witkowski, J.M.; McElhaney, J.; Loeb, M.; Mitnitski, A.; Pawelec, G. Aging, frailty and age-related diseases. Biogerontology 2010, 11, 547–563. [Google Scholar] [CrossRef]
- Paddon-Jones, D.; Rasmussen, B. Dietary protein recommendations and the prevention of sarcopenia. Curr. Opin. Clin. Nutr. Metab. Care 2009, 12, 86–90. [Google Scholar] [CrossRef] [Green Version]
- Janssen, I.; Heymsfield, S.B.; Ross, R. Low Relative Skeletal Muscle Mass (Sarcopenia) in Older Persons Is Associated with Functional Impairment and Physical Disability. J. Am. Geriatr. Soc. 2002, 50, 889–896. [Google Scholar] [CrossRef] [Green Version]
- Peterson, M.D.; Sen, A.; Gordon, P.M. Influence of Resistance Exercise on Lean Body Mass in Aging Adults: A Meta-Analysis. Med. Sci. Sports Exerc. 2011, 43, 249–258. [Google Scholar] [CrossRef] [Green Version]
- Peterson, M.D.; Rhea, M.R.; Sen, A.; Gordon, P.M. Resistance exercise for muscular strength in older adults: A meta-analysis. Ageing Res. Rev. 2010, 9, 226–237. [Google Scholar] [CrossRef] [PubMed] [Green Version]
- Lozano-Montoya, I.; Correa-Pérez, A.; Abraha, I.; Soiza, R.L.; Cherubini, A.; O’Mahony, D.; Cruz-Jentoft, A.J. Nonpharmacological interventions to treat physical frailty and sarcopenia in older patients: A systematic overview—The SENATOR Project ONTOP Series. Clin. Interv. Aging 2017, 12, 721–740. [Google Scholar] [CrossRef] [PubMed] [Green Version]
- Vlietstra, L.; Hendrickx, W.; Waters, D.L. Exercise interventions in healthy older adults with sarcopenia: A systematic review and meta-analysis. Australas. J. Ageing 2018, 37, 169–183. [Google Scholar] [CrossRef] [PubMed]
- Arnarson, A.; Geirsdottir, O.G.; Ramel, A.; Briem, K.; Jonsson, P.V.; Thorsdottir, I. Effects of whey proteins and carbohydrates on the efficacy of resistance training in elderly people: Double blind, randomised controlled trial. Eur. J. Clin. Nutr. 2013, 67, 821–826. [Google Scholar] [CrossRef] [PubMed]
- Kryger, A.I.; Andersen, J.L. Resistance training in the oldest old: Consequences for muscle strength, fiber types, fiber size, and MHC isoforms. Scand. J. Med. Sci. Sports 2007, 17, 422–430. [Google Scholar] [CrossRef]
- Borde, R.; Hortobágyi, T.; Granacher, U. Dose–Response Relationships of Resistance Training in Healthy Old Adults: A Systematic Review and Meta-Analysis. Sports Med. 2015, 45, 1693–1720. [Google Scholar] [CrossRef] [Green Version]
- Bemben, M.; Witten, M.; Carter, J.; Eliot, K.; Knehans, A.; Bemben, D. The effects of supplementation with creatine and protein on muscle strength following a traditional resistance training program in middle-aged and older men. J. Nutr. Health Aging 2010, 14, 155–159. [Google Scholar] [CrossRef]
- Syed-Abdul, M.M.; Ball, S.D. Muscle Activation in Older Females after a Community-Based Resistance Training Program: A Pilot Study. Reports 2021, 4, 38. [Google Scholar] [CrossRef]
- Moro, T.; Brightwell, C.R.; Deer, R.R.; Graber, T.G.; Galvan, E.; Fry, C.S.; Volpi, E.; Rasmussen, B.B. Muscle Protein Anabolic Resistance to Essential Amino Acids Does Not Occur in Healthy Older Adults Before or After Resistance Exercise Training. J. Nutr. 2018, 148, 900–909. [Google Scholar] [CrossRef] [Green Version]
- Kosek, D.J.; Kim, J.-S.; Petrella, J.K.; Cross, J.M.; Bamman, M.M. Efficacy of 3 days/wk resistance training on myofiber hypertrophy and myogenic mechanisms in young vs. older adults. J. Appl. Physiol. 2006, 101, 531–544. [Google Scholar] [CrossRef]
- Leenders, M.; Verdijk, L.; VAN DER Hoeven, L.; VAN Kranenburg, J.; Nilwik, R.; Wodzig, W.K.W.H.; Senden, J.M.G.; Keizer, H.A.; van Loon, L.J. Protein Supplementation during Resistance-Type Exercise Training in the Elderly. Med. Sci. Sports Exerc. 2013, 45, 542–552. Available online: https://journals.lww.com/acsm-msse/Fulltext/2013/03000/Protein_Supplementation_during_Resistance_Type.20.aspx (accessed on 23 July 2021). [CrossRef] [PubMed]
- Englund, D.A.; Price, L.L.; Grosicki, G.J.; Iwai, M.; Kashiwa, M.; Liu, C.; Reid, K.F.; Fielding, R.A. Progressive Resistance Training Improves Torque Capacity and Strength in Mobility-Limited Older Adults. J. Gerontol. Ser. A 2018, 74, 1316–1321. [Google Scholar] [CrossRef] [PubMed]
- Cintineo, H.P.; Arent, M.A.; Antonio, J.; Arent, S.M. Effects of Protein Supplementation on Performance and Recovery in Resistance and Endurance Training. Front. Nutr. 2018, 5, 83. [Google Scholar] [CrossRef] [PubMed]
- Churchward-Venne, T.A.; Holwerda, A.; Phillips, S.M.; Van Loon, L.J.C. What is the Optimal Amount of Protein to Support Post-Exercise Skeletal Muscle Reconditioning in the Older Adult? Sports Med. 2016, 46, 1205–1212. [Google Scholar] [CrossRef] [PubMed]
- Murphy, C.H.; Churchward-Venne, T.A.; Mitchell, C.J.; Kolar, N.M.; Kassis, A.; Karagounis, L.G.; Burke, L.M.; Hawley, J.A.; Phillips, S.M. Hypoenergetic diet-induced reductions in myofibrillar protein synthesis are restored with resistance training and balanced daily protein ingestion in older men. Am. J. Physiol. Metab. 2015, 308, E734–E743. [Google Scholar] [CrossRef] [Green Version]
- Yang, Y.; Breen, L.; Burd, N.A.; Hector, A.J.; Churchward-Venne, T.A.; Josse, A.R.; Tarnopolsky, M.A.; Phillips, S.M. Resistance exercise enhances myofibrillar protein synthesis with graded intakes of whey protein in older men. Br. J. Nutr. 2012, 108, 1780–1788. [Google Scholar] [CrossRef] [Green Version]
- Morton, R.W.; Murphy, K.T.; McKellar, S.R.; Schoenfeld, B.J.; Henselmans, M.; Helms, E.; Aragon, A.A.; Devries, M.C.; Banfield, L.; Krieger, J.W.; et al. A systematic review, meta-analysis and meta-regression of the effect of protein supplementation on resistance training-induced gains in muscle mass and strength in healthy adults. Br. J. Sports Med. 2018, 52, 376–384. [Google Scholar] [CrossRef] [Green Version]
- Antonio, J.; Ellerbroek, A.; Silver, T.; Vargas, L.; Tamayo, A.; Buehn, R.; Peacock, C.A. A High Protein Diet Has No Harmful Effects: A One-Year Crossover Study in Resistance-Trained Males. J. Nutr. Metab. 2016, 2016, 9104792. [Google Scholar] [CrossRef] [Green Version]
- Cermak, N.M.; Res, P.T.; de Groot, L.C.; Saris, W.H.; van Loon, L.J. Protein supplementation augments the adaptive response of skeletal muscle to resistance-type exercise training: A meta-analysis. Am. J. Clin. Nutr. 2012, 96, 1454–1464. [Google Scholar] [CrossRef] [Green Version]
- Liao, C.-D.; Tsauo, J.-Y.; Wu, Y.-T.; Cheng, C.-P.; Chen, H.-C.; Huang, Y.-C.; Chen, H.-C.; Liou, T.-H. Effects of protein supplementation combined with resistance exercise on body composition and physical function in older adults: A systematic review and meta-analysis. Am. J. Clin. Nutr. 2017, 106, 1078–1091. [Google Scholar] [CrossRef] [Green Version]
- Amasene, M.; Besga, A.; Echeverria, I.; Urquiza, M.; Ruiz, J.R.; Rodriguez-Larrad, A.; Aldamiz, M.; Anaut, P.; Irazusta, J.; Labayen, I. Effects of Leucine-Enriched Whey Protein Supplementation on Physical Function in Post-Hospitalized Older Adults Participating in 12-Weeks of Resistance Training Program: A Randomized Controlled Trial. Nutrients 2019, 11, 2337. [Google Scholar] [CrossRef] [PubMed] [Green Version]
- Eliot, K.A.; Knehans, A.W.; Bemben, D.A.; Witten, M.S.; Carter, J.; Bemben, M.G. The effects of creatine and whey protein supplementation on body composition in men aged 48 to 72 years during resistance training. J. Nutr. Health Aging 2008, 12, 208–212. [Google Scholar] [CrossRef] [PubMed]
- Lamb, D.A.; Moore, J.H.; Smith, M.A.; Vann, C.G.; Osburn, S.C.; Ruple, B.A.; Fox, C.D.; Smith, K.S.; Altonji, O.M.; Power, Z.M.; et al. The effects of resistance training with or without peanut protein supplementation on skeletal muscle and strength adaptations in older individuals. J. Int. Soc. Sports Nutr. 2020, 17, 66. [Google Scholar] [CrossRef] [PubMed]
- Ottestad, I.; Løvstad, A.T.; Gjevestad, G.O.; Hamarsland, H.; Benth, J.; Andersen, L.F.; Bye, A.; Biong, A.S.; Retterstøl, K.; Iversen, P.O.; et al. Intake of a protein-enriched milk and effects on muscle mass and strength. A 12-week randomized placebo controlled trial among community-dwelling older adults. J. Nutr. Health Aging 2017, 21, 1160–1169. [Google Scholar] [CrossRef] [PubMed]
- Finger, D.; Goltz, F.R.; Umpierre, D.; Meyer, E.; Rosa, L.H.T.; Schneider, C.D. Effects of Protein Supplementation in Older Adults Undergoing Resistance Training: A Systematic Review and Meta-Analysis. Sports Med. 2014, 45, 245–255. [Google Scholar] [CrossRef]
- Katsanos, C.S.; Kobayashi, H.; Sheffield-Moore, M.; Aarsland, A.; Wolfe, R.R. A high proportion of leucine is required for optimal stimulation of the rate of muscle protein synthesis by essential amino acids in the elderly. Am. J. Physiol. Metab. 2006, 291, E381–E387. [Google Scholar] [CrossRef] [Green Version]
- Breen, L.; Churchward-Venne, T.A. Leucine: A nutrient ‘trigger’ for muscle anabolism, but what more? J. Physiol. 2012, 590, 2065–2066. [Google Scholar] [CrossRef]
- Atherton, P.J.; Smith, K.; Etheridge, T.; Rankin, D.; Rennie, M.J. Distinct anabolic signalling responses to amino acids in C2C12 skeletal muscle cells. Amino Acids 2010, 38, 1533–1539. [Google Scholar] [CrossRef]
- Haff, G.; Triplett, N.T. Essentials of Strength Training and Conditioning, 4th ed.; Human Kinetics: Champaign, IL, USA, 2016. [Google Scholar]
- Ratamess, N.A.; Alvar, B.A.; Evetoch, T.E.; Housh, T.J.; Ben Kibler, W.; Kraemer, W.J.; Triplett, N.T. Progression models in resistance training for healthy adults. Med. Sci. Sports Exerc. 2009, 41, 687–708. [Google Scholar] [CrossRef]
- Dickerson, R.N.; Patel, J.J.; McClain, C.J. Protein and Calorie Requirements Associated With the Presence of Obesity. Nutr. Clin. Pr. 2017, 32, 86S–93S. [Google Scholar] [CrossRef] [Green Version]
- Dickerson, R.N.; Medling, T.L.; Smith, A.C.; Maish, G.O.; Croce, M.A.; Minard, G.; Brown, R.O. Hypocaloric, High-Protein Nutrition Therapy in Older vs Younger Critically Ill Patients With Obesity. J. Parenter. Enter. Nutr. 2013, 37, 342–351. [Google Scholar] [CrossRef] [PubMed]
- Boirie, Y.; Dangin, M.; Gachon, P.; Vasson, M.-P.; Maubois, J.-L.; Beaufrère, B. Slow and fast dietary proteins differently modulate postprandial protein accretion. Proc. Natl. Acad. Sci. USA 1997, 94, 14930–14935. [Google Scholar] [CrossRef] [PubMed] [Green Version]
- Gorissen, S.H.M.; Crombag, J.J.R.; Senden, J.M.G.; Waterval, W.A.H.; Bierau, J.; Verdijk, L.B.; van Loon, L.J.C. Protein content and amino acid composition of commercially available plant-based protein isolates. Amino Acids 2018, 50, 1685–1695. [Google Scholar] [CrossRef] [PubMed] [Green Version]
- Slater, G.J.; Dieter, B.P.; Marsh, D.J.; Helms, E.R.; Shaw, G.; Iraki, J. Is an Energy Surplus Required to Maximize Skeletal Muscle Hypertrophy Associated With Resistance Training. Front. Nutr. 2019, 6, 131. [Google Scholar] [CrossRef]
- Slater, G.; Phillips, S.M. Nutrition guidelines for strength sports: Sprinting, weightlifting, throwing events, and bodybuilding. J. Sports Sci. 2011, 29, S67–S77. [Google Scholar] [CrossRef] [Green Version]
- Teixeira, V.; Voci, S.M.; Mendes-Netto, R.S.; da Silva, D.G. The relative validity of a food record using the smartphone application MyFitnessPal. Nutr. Diet. 2017, 75, 219–225. [Google Scholar] [CrossRef]
- Hsu, K.-J.; Chien, K.-Y.; Tsai, S.-C.; Tsai, Y.-S.; Liao, Y.-H.; Chen, J.-J.; Chen, Y.-R.; Chen, C.-N. Effects of Exercise Alone or in Combination with High-Protein Diet on Muscle Function, Aerobic Capacity, and Physical Function in Middle-Aged Obese Adults: A Randomized Controlled Trial. J. Nutr. Health Aging 2021, 25, 727–734. [Google Scholar] [CrossRef]
- Lockwood, C.M.; Roberts, M.D.; Dalbo, V.J.; Smith-Ryan, A.E.; Kendall, K.L.; Moon, J.R.; Stout, J.R. Effects of Hydrolyzed Whey versus Other Whey Protein Supplements on the Physiological Response to 8 Weeks of Resistance Exercise in College-Aged Males. J. Am. Coll. Nutr. 2017, 36, 16–27. [Google Scholar] [CrossRef]
- Lohman, M.; Tallroth, K.; Kettunen, J.A.; Marttinen, M.T. Reproducibility of dual-energy X-ray absorptiometry total and regional body composition measurements using different scanning positions and definitions of regions. Metabolism 2009, 58, 1663–1668. [Google Scholar] [CrossRef]
- Robinson, M.M.; Dasari, S.; Konopka, A.R.; Johnson, M.L.; Manjunatha, S.; Esponda, R.R.; Carter, R.E.; Lanza, I.R.; Nair, K.S. Enhanced protein translation underlies improved metabolic and physical adaptations to different exercise training modes in young and old humans. Cell Metab. 2017, 25, 581–592. [Google Scholar] [CrossRef] [Green Version]
- Archer, E.; Pavela, G.; Lavie, C.J. The Inadmissibility of What We Eat in America and NHANES Dietary Data in Nutrition and Obesity Research and the Scientific Formulation of National Dietary Guidelines. Mayo Clin. Proc. 2015, 90, 911–926. [Google Scholar] [CrossRef] [PubMed] [Green Version]
- Archer, E.; Hand, G.A.; Blair, S.N. Validity of U.S. Nutritional Surveillance: National Health and Nutrition Examination Survey Caloric Energy Intake Data, 1971–2010. PLoS ONE 2013, 8, e76632. [Google Scholar] [CrossRef]
- Dhurandhar, N.V.; Schoeller, D.; Brown, A.W.; Heymsfield, S.B.; Thomas, D.; Sørensen, T.I.A.; Speakman, J.R.; Jeansonne, M.; Allison, D.B.; Energy Balance Measurement Working Group. Energy balance measurement: When something is not better than nothing. Int. J. Obes. 2015, 39, 1109–1113. [Google Scholar] [CrossRef] [PubMed] [Green Version]
- Alemán-Mateo, H.; Carreón, V.R.; Macías, L.; Astiazaran-García, H.; Gallegos-Aguilar, A.C.; Enríquez, J.R.R. Nutrient-rich dairy proteins improve appendicular skeletal muscle mass and physical performance, and attenuate the loss of muscle strength in older men and women subjects: A single-blind randomized clinical trial. Clin. Interv. Aging 2014, 9, 1517–1525. [Google Scholar] [CrossRef] [PubMed] [Green Version]
- Kirwan, R.P.; Mazidi, M.; García, C.R.; Lane, K.E.; Jafari, A.; Butler, T.; de Heredia, F.P.; Davies, I.G. Protein interventions augment the effect of resistance exercise on appendicular lean mass and handgrip strength in older adults: A systematic review and meta-analysis of randomized controlled trials. Am. J. Clin. Nutr. 2021, 115, 897–913. [Google Scholar] [CrossRef] [PubMed]
- Nascimento, M.A.D.; Gerage, A.M.; Silva, D.; Ribeiro, A.S.; Machado, D.; Pina, F.L.C.; Tomeleri, C.M.; Venturini, D.; Barbosa, D.S.; Mayhew, J.L.; et al. Effect of resistance training with different frequencies and subsequent detraining on muscle mass and appendicular lean soft tissue, IGF-1, and testosterone in older women. Eur. J. Sport Sci. 2018, 19, 199–207. [Google Scholar] [CrossRef]
- Haun, C.T.; Vann, C.G.; Mobley, C.B.; Roberson, P.A.; Osburn, S.C.; Holmes, H.M.; Mumford, P.; Romero, M.A.; Young, K.C.; Moon, J.R.; et al. Effects of Graded Whey Supplementation During Extreme-Volume Resistance Training. Front. Nutr. 2018, 5, 84. [Google Scholar] [CrossRef]
- Hassan, E.B.; Phu, S.; Vogrin, S.; Duque, G. Appendicular and mid-thigh lean mass are associated with muscle strength, physical performance, and dynamic balance in older persons at high risk of falls. Gait Posture 2022, 93, 90–95. [Google Scholar] [CrossRef]
- Brown, J.C.; Harhay, M. Appendicular lean mass and mortality among prefrail and frail older adults. J. Nutr. Health Aging 2017, 21, 342–345. [Google Scholar] [CrossRef]
- Avila, J.J.; Gutierres, J.A.; Sheehy, M.E.; Lofgren, I.E.; Delmonico, M.J. Effect of moderate intensity resistance training during weight loss on body composition and physical performance in overweight older adults. Eur. J. Appl. Physiol. 2010, 109, 517–525. [Google Scholar] [CrossRef]
- Fragala, M.S.; Fukuda, D.; Stout, J.R.; Townsend, J.; Emerson, N.S.; Boone, C.H.; Beyer, K.S.; Oliveira, L.P.; Hoffman, J. Muscle quality index improves with resistance exercise training in older adults. Exp. Gerontol. 2014, 53, 1–6. [Google Scholar] [CrossRef] [PubMed]
- Reid, K.F.; Callahan, D.M.; Carabello, R.J.; Phillips, E.M.; Frontera, W.R.; Fielding, R.A. Lower extremity power training in elderly subjects with mobility limitations: A randomized controlled trial. Aging Clin. Exp. Res. 2008, 20, 337–343. [Google Scholar] [CrossRef]
- Mesquita, P.H.; Lamb, D.A.; Parry, H.A.; Moore, J.H.; Smith, M.A.; Vann, C.G.; Osburn, S.C.; Fox, C.D.; Ruple, B.A.; Huggins, K.W.; et al. Acute and chronic effects of resistance training on skeletal muscle markers of mitochondrial remodeling in older adults. Physiol. Rep. 2020, 8, e14526. [Google Scholar] [CrossRef] [PubMed]
- Nicklas, B.J.; Chmelo, E.; Delbono, O.; Carr, J.; Lyles, M.F.; Marsh, A.P. Effects of resistance training with and without caloric restriction on physical function and mobility in overweight and obese older adults: A randomized controlled trial. Am. J. Clin. Nutr. 2015, 101, 991–999. [Google Scholar] [CrossRef] [PubMed]
- Murphy, C.; Koehler, K. Energy deficiency impairs resistance training gains in lean mass but not strength: A meta-analysis and meta-regression. Scand. J. Med. Sci. Sports 2021, 32, 125–137. [Google Scholar] [CrossRef] [PubMed]
- ten Haaf, D.S.M.; Nuijten, M.A.H.; Maessen, M.F.H.; Horstman, A.M.H.; Eijsvogels, T.M.H.; Hopman, M.T.E. Effects of protein supplementation on lean body mass, muscle strength, and physical performance in nonfrail community-dwelling older adults: A systematic review and meta-analysis. Am. J. Clin. Nutr. 2018, 108, 1043–1059. [Google Scholar] [CrossRef] [Green Version]
- Maltais, M.L.; Ladouceur, J.P.; Dionne, I.J. The Effect of Resistance Training and Different Sources of Postexercise Protein Supplementation on Muscle Mass and Physical Capacity in Sarcopenic Elderly Men. J. Strength Cond. Res. 2016, 30, 1680–1687. Available online: https://journals.lww.com/nsca-jscr/Fulltext/2016/06000/The_Effect_of_Resistance_Training_and_Different.25.aspx (accessed on 23 July 2021). [CrossRef]
- Mertz, K.H.; Reitelseder, S.; Bechshoeft, R.; Bulow, J.; Højfeldt, G.; Jensen, M.; Schacht, S.R.; Lind, M.V.; Rasmussen, M.A.; Mikkelsen, U.R.; et al. The effect of daily protein supplementation, with or without resistance training for 1 year, on muscle size, strength, and function in healthy older adults: A randomized controlled trial. Am. J. Clin. Nutr. 2021, 113, 790–800. [Google Scholar] [CrossRef]
- Rossato, L.T.; Nahas, P.C.; De Branco, F.M.S.; Martins, F.M.; Souza, A.P.; Carneiro, M.A.S.; Orsatti, F.; De Oliveira, E.P. Higher Protein Intake Does Not Improve Lean Mass Gain When Compared with RDA Recommendation in Postmenopausal Women Following Resistance Exercise Protocol: A Randomized Clinical Trial. Nutrients 2017, 9, 1007. [Google Scholar] [CrossRef] [Green Version]
- Huschtscha, Z.; Parr, A.; Porter, J.; Costa, R.J.S. The Effects of a High-Protein Dairy Milk Beverage With or Without Progressive Resistance Training on Fat-Free Mass, Skeletal Muscle Strength and Power, and Functional Performance in Healthy Active Older Adults: A 12-Week Randomized Controlled Trial. Front. Nutr. 2021, 8, 644865. [Google Scholar] [CrossRef]
- Hidayat, K.; Chen, G.-C.; Wang, Y.; Zhang, Z.; Dai, X.; Szeto, I.M.Y.; Qin, L.-Q. Effects of milk proteins supplementation in older adults undergoing resistance training: A meta-analysis of randomized control trials. J. Nutr. Health Aging 2017, 22, 237–245. [Google Scholar] [CrossRef] [PubMed]
- Hou, L.; Lei, Y.; Li, X.; Huo, C.; Jia, X.; Yang, J.; Xu, R.; Wang, X.-M. Effect of Protein Supplementation Combined With Resistance Training on Muscle Mass, Strength and Function in the Elderly: A Systematic Review and Meta-Analysis. J. Nutr. Health Aging 2019, 23, 451–458. [Google Scholar] [CrossRef] [PubMed]
- Aas, S.N.; Seynnes, O.; Benestad, H.B.; Raastad, T. Strength training and protein supplementation improve muscle mass, strength, and function in mobility-limited older adults: A randomized controlled trial. Aging 2019, 32, 605–616. [Google Scholar] [CrossRef] [PubMed]
- Scanlon, T.C.; Fragala, M.S.; Stout, J.R.; Emerson, N.S.; Beyer, K.S.; Oliveira, L.; Hoffman, J. Muscle architecture and strength: Adaptations to short-term resistance training in older adults. Muscle Nerve 2014, 49, 584–592. [Google Scholar] [CrossRef]
- Radaelli, R.; Taaffe, D.R.; Newton, R.U.; Galvão, D.A.; Lopez, P. Exercise effects on muscle quality in older adults: A systematic review and meta-analysis. Sci. Rep. 2021, 11, 21085. [Google Scholar] [CrossRef]
- Brooks, N.; Layne, J.E.; Gordon, P.L.; Roubenoff, R.; Nelson, M.E.; Castaneda-Sceppa, C. Strength training improves muscle quality and insulin sensitivity in Hispanic older adults with type 2 diabetes. Int. J. Med Sci. 2007, 4, 19–27. [Google Scholar] [CrossRef] [Green Version]
- Tracy, B.L.; Ivey, F.M.; Hurlbut, D.; Martel, G.F.; Lemmer, J.T.; Siegel, E.L.; Metter, E.J.; Fozard, J.L.; Fleg, J.L.; Hurley, B.F. Muscle quality. II. Effects of strength training in 65- to 75-yr-old men and women. J. Appl. Physiol. 1999, 86, 195–201. [Google Scholar] [CrossRef] [PubMed]
- Lemieux, F.C.; Filion, M.-E.; Barbat-Artigas, S.; Karelis, A.D.; Aubertin-Leheudre, M. Relationship between different protein intake recommendations with muscle mass and muscle strength. Climacteric 2013, 17, 294–300. [Google Scholar] [CrossRef]
- Khanal, P.; He, L.; Degens, H.; Stebbings, G.K.; Onambele-Pearson, G.L.; Williams, A.G.; Thomis, M.; Morse, C.I. Dietary Protein Requirement Threshold and Micronutrients Profile in Healthy Older Women Based on Relative Skeletal Muscle Mass. Nutrients 2021, 13, 3076. [Google Scholar] [CrossRef]
- Hofmann, M.; Schober-Halper, B.; Oesen, S.; Franzke, B.; Tschan, H.; Bachl, N.; Strasser, E.-M.; Quittan, M.; Wagner, K.-H.; Wessner, B. Effects of elastic band resistance training and nutritional supplementation on muscle quality and circulating muscle growth and degradation factors of institutionalized elderly women: The Vienna Active Ageing Study (VAAS). Graefe’s Arch. Clin. Exp. Ophthalmol. 2016, 116, 885–897. [Google Scholar] [CrossRef] [Green Version]
- Skelton, D.A.; Greig, C.; Davies, J.M.; Young, A. Strength, Power and Related Functional Ability of Healthy People Aged 65–89 Years. Age Ageing 1994, 23, 371–377. [Google Scholar] [CrossRef] [PubMed] [Green Version]
- Leong, B.; Kamen, G.; Patten, C.; Burke, J.R. Maximal motor unit discharge rates in the quadriceps muscles of older weight lifters. Med. Sci. Sports Exerc. 1999, 31, 1638–1644. Available online: https://journals.lww.com/acsm-msse/Fulltext/1999/11000/Maximal_motor_unit_discharge_rates_in_the.22.aspx (accessed on 21 April 2022). [CrossRef] [PubMed]
- James, E.; Nichols, S.; Goodall, S.; Hicks, K.M.; O’Doherty, A.F. The influence of resistance training on neuromuscular function in middle-aged and older adults: A systematic review and meta-analysis of randomised controlled trials. Exp. Gerontol. 2021, 149, 111320. [Google Scholar] [CrossRef] [PubMed]
- Drummond, M.J.; Dreyer, H.C.; Pennings, B.; Fry, C.S.; Dhanani, S.; Dillon, E.L.; Sheffield-Moore, M.; Volpi, E.; Rasmussen, B. Skeletal muscle protein anabolic response to resistance exercise and essential amino acids is delayed with aging. J. Appl. Physiol. 2008, 104, 1452–1461. [Google Scholar] [CrossRef]
- Voss, F.; Schueler, M.; Lauterbach, M.; Bauer, A.; Katus, H.A.; Becker, R. Safety of symptom-limited exercise testing in a big cohort of a modern ICD population. Clin. Res. Cardiol. 2015, 105, 53–58. [Google Scholar] [CrossRef]


| PRE | Wk 0 | Wk 1 | Wk 2 | Wk 3 | Wk 4 | Wk 5 | MID | Wk 6 | Wk 7 | Wk 8 | Wk 9 | Wk 10 | POST | |
|---|---|---|---|---|---|---|---|---|---|---|---|---|---|---|
| DXA Scan | X | X | X | |||||||||||
| Ultrasound | X | X | ||||||||||||
| Dynamometry | X | X | X | |||||||||||
| Acclimation | X | |||||||||||||
| Training | X | X | X | X | X | X | X | X | ||||||
| Deload | X | X | ||||||||||||
| Nutrition Protocol | X | X | X | X | X | X | X | X | X | X | ||||
| 3 RM Testing | X | |||||||||||||
| Training Intensity (% 1 RM) | - | - | 60 | 65 | 70 | 75 | 50 | - | 70 | 75 | 80 | 85 | 30 | - |
| Sets/Exercise | - | - | 2 | 2 | 3 | 3 | 2 | - | 2 | 3 | 3 | 3 | 1 | - |
| Repetitions/Set | - | - | 8–12 | 8–12 | 8–12 | 8–12 | 8–12 | - | 8–12 | 8–12 | 8–12 | 8–12 | 8–12 | - |
| GP Target Protein Intake (g/kg/day) | - | - | 0.8 | 1.0 | 1.2 | 1.4 | 1.4 | - | 1.6 | 1.8 | 2.0 | 2.2 | 2.2 | - |
| CP Target Protein Intake (g/kg/day) | - | - | 0.8–1.0 | 0.8–1.0 | 0.8–1.0 | 0.8–1.0 | 0.8–1.0 | - | 0.8–1.0 | 0.8–1.0 | 0.8–1.0 | 0.8–1.0 | 0.8–1.0 | - |
| GP Protein Supplement Prescribed (g) | - | - | 25 | 25 | 25 | 25 | 25 | - | 50 | 50 or 75 * | 50 or 75 * | 50 or 75 * | 50 or 75 * | - |
| Variable | Constant Protein | Graded Protein | Total | p-Value |
|---|---|---|---|---|
| Participant Number | 9 | 9 | 18 | - |
| Age (Years) | 72.11 ± 7.17 | 67.33 ± 8.93 | 69.72 ± 8.23 | 0.229 |
| Sex (Number of males) | 3 | 4 | 7 | 0.653 |
| Height (cm) | 168.44 ± 8.22 | 169.06 ± 10.17 | 168.75 ± 8.98 | 0.890 |
| Weight (kg) | 77.87 ± 19.31 | 69.47 ± 12.72 | 73.67 ± 16.44 | 0.292 |
| Body Mass Index (kg/m2) | 27.27 ± 5.45 | 24.31 ± 4.34 | 25.79 ± 5.02 | 0.221 |
| Total Lean/Soft Tissue Mass (kg) | 45.32 ± 11.24 | 46.40 ± 8.96 | 45.86 ± 9.88 | 0.825 |
| Leg Press Estimated 1 RM (KG) | 118.17 ± 32.37 | 128.05 ± 73.87 | 123.11 ± 55.56 | 0.718 |
| Leg Extension Estimated 1 RM (KG) | 56.92 ± 15.60 | 66.04 ± 32.06 | 61.48 ± 24.90 | 0.458 |
| Week | Constant Protein | Graded Protein | |||||||
|---|---|---|---|---|---|---|---|---|---|
| Absolute (kcals/d) | SD | Relative (kcals/kg/d) | SD | Absolute (kcals/d) | SD | Relative (kcals/kg/d) | SD | ||
| Energy (kcal/d or kcal/kg/d) | 1 | 1717 | 359 | 22.58 | 4.11 | 1594 | 458 | 23.16 | 5.35 |
| 2 | 1698 | 220 | 22.66 | 4.54 | 1601 | 436 | 23.05 | 4.05 | |
| 3 | 1508 | 242 | 20.17 | 4.89 | 1665 | 439 | 23.95 | 4.17 | |
| 4 | 1474 | 292 | 20.12 | 6.38 | 1864 # | 431 | 27.17 # | 5.42 | |
| 5 | 1555 | 309 | 20.44 | 3.63 | 1887 # | 275 | 27.47 # | 2.68 | |
| 6 | 1655 | 238 | 22.05 | 4.52 | 1822 | 428 | 26.43 | 4.74 | |
| 7 | 1580 | 187 | 21.15 | 4.32 | 1939 | 590 | 28.21 # | 7.46 | |
| 8 | 1573 | 155 | 21.17 | 4.73 | 2013 | 667 | 29.21# | 8.18 | |
| 9 | 1484 | 342 | 19.57 | 4.26 | 2259 *# | 578 | 32.86 *# | 7.04 | |
| 10 | 1623 | 297 | 21.22 | 2.20 | 2240 *# | 700 | 32.32 *# | 7.53 | |
| Week | Constant Protein | Graded Protein | |||||||
|---|---|---|---|---|---|---|---|---|---|
| Absolute (g/d) | SD | Relative (g/kg/d) | SD | Absolute (g/d) | SD | Relative (g/kg/d) | SD | ||
| Protein (g/d or g/kg/d) | 1 | 73 | 16 | 0.96 | 0.11 | 80 | 22 | 1.18 | 0.33 |
| 2 | 77 | 16 | 1.00 | 0.15 | 81 | 23 | 1.16 | 0.24 | |
| 3 | 72 | 15 | 0.94 | 0.13 | 86 | 15 | 1.25 # | 0.16 | |
| 4 | 69 | 15 | 0.91 | 0.15 | 98 # | 17 | 1.41 # | 0.08 | |
| 5 | 72 | 16 | 0.94 | 0.07 | 99 # | 18 | 1.42 # | 0.05 | |
| 6 | 79 | 21 | 1.01 | 0.08 | 116 *# | 18 | 1.69 *# | 0.15 | |
| 7 | 72 | 15 | 0.93 | 0.09 | 125 *# | 21 | 1.81 *# | 0.13 | |
| 8 | 71 | 16 | 0.94 | 0.21 | 134 *# | 26 | 1.93 *# | 0.13 | |
| 9 | 74 | 17 | 0.96 | 0.07 | 152 *# | 27 | 2.20 *# | 0.08 | |
| 10 | 75 | 19 | 0.97 | 0.18 | 150 *# | 26 | 2.17 *# | 0.16 | |
| Week | 1 | 2 | 3 | 4 | 5 | 6 | 7 | 8 | 9 | 10 |
|---|---|---|---|---|---|---|---|---|---|---|
| Target Protein Intake (g/day) | 0.8 | 1.0 | 1.2 | 1.4 | 1.4 | 1.6 | 1.8 | 2.0 | 2.2 | 2.2 |
| Actual Protein Intake (g/day) | 1.17 | 1.16 | 1.25 | 1.41 | 1.42 | 1.69 | 1.81 | 1.93 | 2.20 | 2.17 |
| % Difference | 37.92 | 15.10 | 4.43 | 0.40 | 1.42 | 5.41 | 0.55 | −3.45 | −0.10 | −1.58 |
| Outcome | Main Effect/Interaction | p-Value | F-Value | ηp2 | Observed Power (%) * | Estimated Sample Size * |
|---|---|---|---|---|---|---|
| Total Lean/Soft Tissue Mass | Time | 0.245 | 1.457 | 0.083 | 66.9 | 24 |
| Group | 0.867 | 0.029 | 0.002 | 5.5 | 2940 | |
| G * T | 0.209 | 1.714 | 0.097 | 74.3 | 22 | |
| Appendicular Lean/Soft Tissue Mass | Time | 0.028 | 5.819 | 0.267 | 99.7 | 8 |
| Group | 0.974 | 0.001 | <0.001 | - | - | |
| G * T | 0.634 | 0.236 | 0.015 | 16.6 | 132 | |
| Lean/Soft Tissue Mass Index | Time | 0.281 | 1.244 | 0.072 | 60.3 | 28 |
| Group | 0.838 | 0.043 | 0.003 | 5.7 | 1960 | |
| G * T | 0.207 | 1.729 | 0.098 | 74.7 | 22 | |
| Vastus Lateralis Thickness | Time | 0.455 | 0.586 | 0.035 | 33.0 | 58 |
| Group | 0.040 | 5.003 | 0.238 | 72.9 | 22 | |
| G * T | 0.384 | 0.802 | 0.048 | 43.3 | 42 | |
| Knee Extensor Peak Torque 60°/s | Time | <0.001 | 10.218 | 0.390 | 99.9 | 6 |
| Group | 0.199 | 1.797 | 0.101 | 33.9 | 56 | |
| G * T | 0.225 | 1.564 | 0.089 | 70.2 | 24 | |
| Knee Flexor Peak Torque 60°/s | Time | <0.001 | 23.623 | 0.596 | 99.9 | 6 |
| Group | 0.588 | 0.305 | 0.019 | 9.8 | 306 | |
| G * T | 0.293 | 1.277 | 0.074 | 61.5 | 28 | |
| Knee Extensor Peak Torque 120°/s | Time | 0.004 | 6.608 | 0.292 | 99.9 | 8 |
| Group | 0.197 | 1.814 | 0.102 | 34.2 | 54 | |
| G * T | 0.514 | 0.679 | 0.041 | 37.8 | 48 | |
| Knee Flexor Peak Torque 120°/s | Time | <0.001 | 12.155 | 0.432 | 99.9 | 6 |
| Group | 0.570 | 0.336 | 0.021 | 10.4 | 278 | |
| G * T | 0.782 | 0.247 | 0.015 | 16.6 | 132 | |
| Muscle Quality Score 60°/s | Time | 0.001 | 16.052 | 0.501 | 100.00 | 6 |
| Group | 0.198 | 1.802 | 0.101 | 33.9 | 56 | |
| G * T | 0.152 | 2.263 | 0.124 | 85.0 | 18 | |
| Muscle Quality Score 120°/s | Time | 0.015 | 7.408 | 0.316 | 99.9 | 8 |
| Group | 0.271 | 1.298 | 0.075 | 25.9 | 76 | |
| G * T | 0.444 | 0.616 | 0.037 | 34.6 | 54 |
Publisher’s Note: MDPI stays neutral with regard to jurisdictional claims in published maps and institutional affiliations. |
© 2022 by the authors. Licensee MDPI, Basel, Switzerland. This article is an open access article distributed under the terms and conditions of the Creative Commons Attribution (CC BY) license (https://creativecommons.org/licenses/by/4.0/).
Share and Cite
Michel, J.M.; Lievense, K.K.; Norton, S.C.; Costa, J.V.; Alphin, K.H.; Bailey, L.A.; Miller, G.D. The Effects of Graded Protein Intake in Conjunction with Progressive Resistance Training on Skeletal Muscle Outcomes in Older Adults: A Preliminary Trial. Nutrients 2022, 14, 2739. https://doi.org/10.3390/nu14132739
Michel JM, Lievense KK, Norton SC, Costa JV, Alphin KH, Bailey LA, Miller GD. The Effects of Graded Protein Intake in Conjunction with Progressive Resistance Training on Skeletal Muscle Outcomes in Older Adults: A Preliminary Trial. Nutrients. 2022; 14(13):2739. https://doi.org/10.3390/nu14132739
Chicago/Turabian StyleMichel, J. Max, Kristy K. Lievense, Sam C. Norton, Juliana V. Costa, Kathryn H. Alphin, Lydia A. Bailey, and Gary D. Miller. 2022. "The Effects of Graded Protein Intake in Conjunction with Progressive Resistance Training on Skeletal Muscle Outcomes in Older Adults: A Preliminary Trial" Nutrients 14, no. 13: 2739. https://doi.org/10.3390/nu14132739
APA StyleMichel, J. M., Lievense, K. K., Norton, S. C., Costa, J. V., Alphin, K. H., Bailey, L. A., & Miller, G. D. (2022). The Effects of Graded Protein Intake in Conjunction with Progressive Resistance Training on Skeletal Muscle Outcomes in Older Adults: A Preliminary Trial. Nutrients, 14(13), 2739. https://doi.org/10.3390/nu14132739