Article

Impact of a Farm-to-School Nutrition and Gardening Intervention for Native American Families from the FRESH Study: A Randomized Wait-List Controlled Trial

1
Center for Indigenous Health Research and Policy, Oklahoma State University Center for Health Sciences, Tulsa, OK 74135, USA
2
Department of Epidemiology and Biostatistics, University of California San Francisco, San Francisco, CA 94143, USA
3
Department of Rural Health, Oklahoma State University Center for Health Sciences, Tulsa, OK 74135, USA
4
Osage Nation, Harvest Land, Pawhuska, OK 74056, USA
*
Author to whom correspondence should be addressed.
Nutrients 2022, 14(13), 2601; https://doi.org/10.3390/nu14132601
Submission received: 31 May 2022 / Revised: 21 June 2022 / Accepted: 21 June 2022 / Published: 23 June 2022
(This article belongs to the Special Issue Nutritional Status among Vulnerable Populations)

Abstract

:
Establishing healthy eating habits during childhood is critical to prevent chronic diseases that develop in adulthood. Tribally owned Early Childhood and Education (ECE) programs signify fundamental influence in childhood obesity disparities. A strategy to improve diet is the use of school gardens; however, few studies have used rigorous methods to assess diet and health outcomes. The purpose of this manuscript is to describe results from the six-month Food Resource Equity for Sustainable Health (FRESH) study among Native American families. We aimed to recruit 176 families of children attending Osage Nation ECE programs in four communities. Two communities received the intervention and two served as wait-list controls. Outcomes included change in dietary intake, body mass index, health status, systolic blood pressure (adults only), and food insecurity in children and parents. There were 193 children (n = 106 intervention; n = 87 control) and 170 adults (n = 93 intervention; n = 77 control) enrolled. Vegetable intake significantly increased in intervention children compared to controls for squash (p = 0.0007) and beans (p = 0.0002). Willingness to try scores increased for beans in intervention children (p = 0.049) and tomatoes in both groups (p = 0.01). FRESH is the first study to implement a farm-to-school intervention in rural, tribally owned ECEs. Future interventions that target healthy dietary intake among children should incorporate a comprehensive parent component in order to support healthy eating for all household members.

1. Introduction

In the United States, Native Americans (NAs) experience a dramatically higher burden of diet-related chronic disease across the lifespan compared to the all-race population [1]. Approximately 38% of NA adults are obese [2], and research from 2016 reports that preschool-aged NA and Alaska Native (AN) children had the highest obesity rates compared to all racial groups combined (36.7% vs. 29.1%, respectively) [3]. During childhood, establishing healthy eating habits is vital for physical growth and cognitive development [4]. Moreover, research has shown that a diet rich in vegetables during childhood can help protect against chronic diseases, such as obesity, heart disease, and diabetes, that develop during adulthood [5,6]. Though data on diet quality of NA populations are limited, prior studies that included NAs found that diet quality is insufficient and is lower than in other populations [7,8,9].
Preschool-aged children consume almost half of their daily calories at school, which is an important setting for food environment interventions [10]. Childcare-based interventions are effective in improving nutrition behaviors among children [11] and are recognized as a vital influence on learned eating behaviors [12]. However, most of these nutrition programs have been implemented in urban schools [11,13], and little is known about school-based interventions among rural NA communities. Tribally owned and operated Early Childhood and Education (ECE) programs offer preschool-aged children around two snacks and two meals per day and signify a vital organizational influence on childhood obesity disparities [14]. Therefore, ECEs can serve as an essential location to provide healthy eating interventions for NA children [14].
School gardens are a common strategy to increase fruit and vegetable intake in all grades [15], including ECE programs [16]; however, limited studies have used rigorous methodological designs to assess their impact on diet quality and health outcomes [14]. A systematic review on garden-based interventions among preschoolers found that only four studies assessed fruit and vegetable intake [17], and only one has been conducted among NA youth. Results from this study found that increases in preferences for vegetables were significant, but intake was not [18]. To our knowledge, there are no studies that address vegetable intake and health outcomes among NA children in ECE programs using a multi-level method, targeting the individual, family, and community.
Using a community-based participatory research (CBPR) approach [19], we partnered with the Osage Nation to implement the Food Resource Equity and Sustainability for Health (FRESH) study, a culturally based farm-to-school intervention to increase vegetable intake among NA children and their families. The intervention was implemented within Osage Nation ECEs. The aim of this manuscript is to describe the FRESH intervention results, including changes in dietary intake (primary aim), body mass index (BMI), systolic blood pressure (adults only), health status, and food insecurity (secondary aims) among Osage Nation families.

2. Materials and Methods
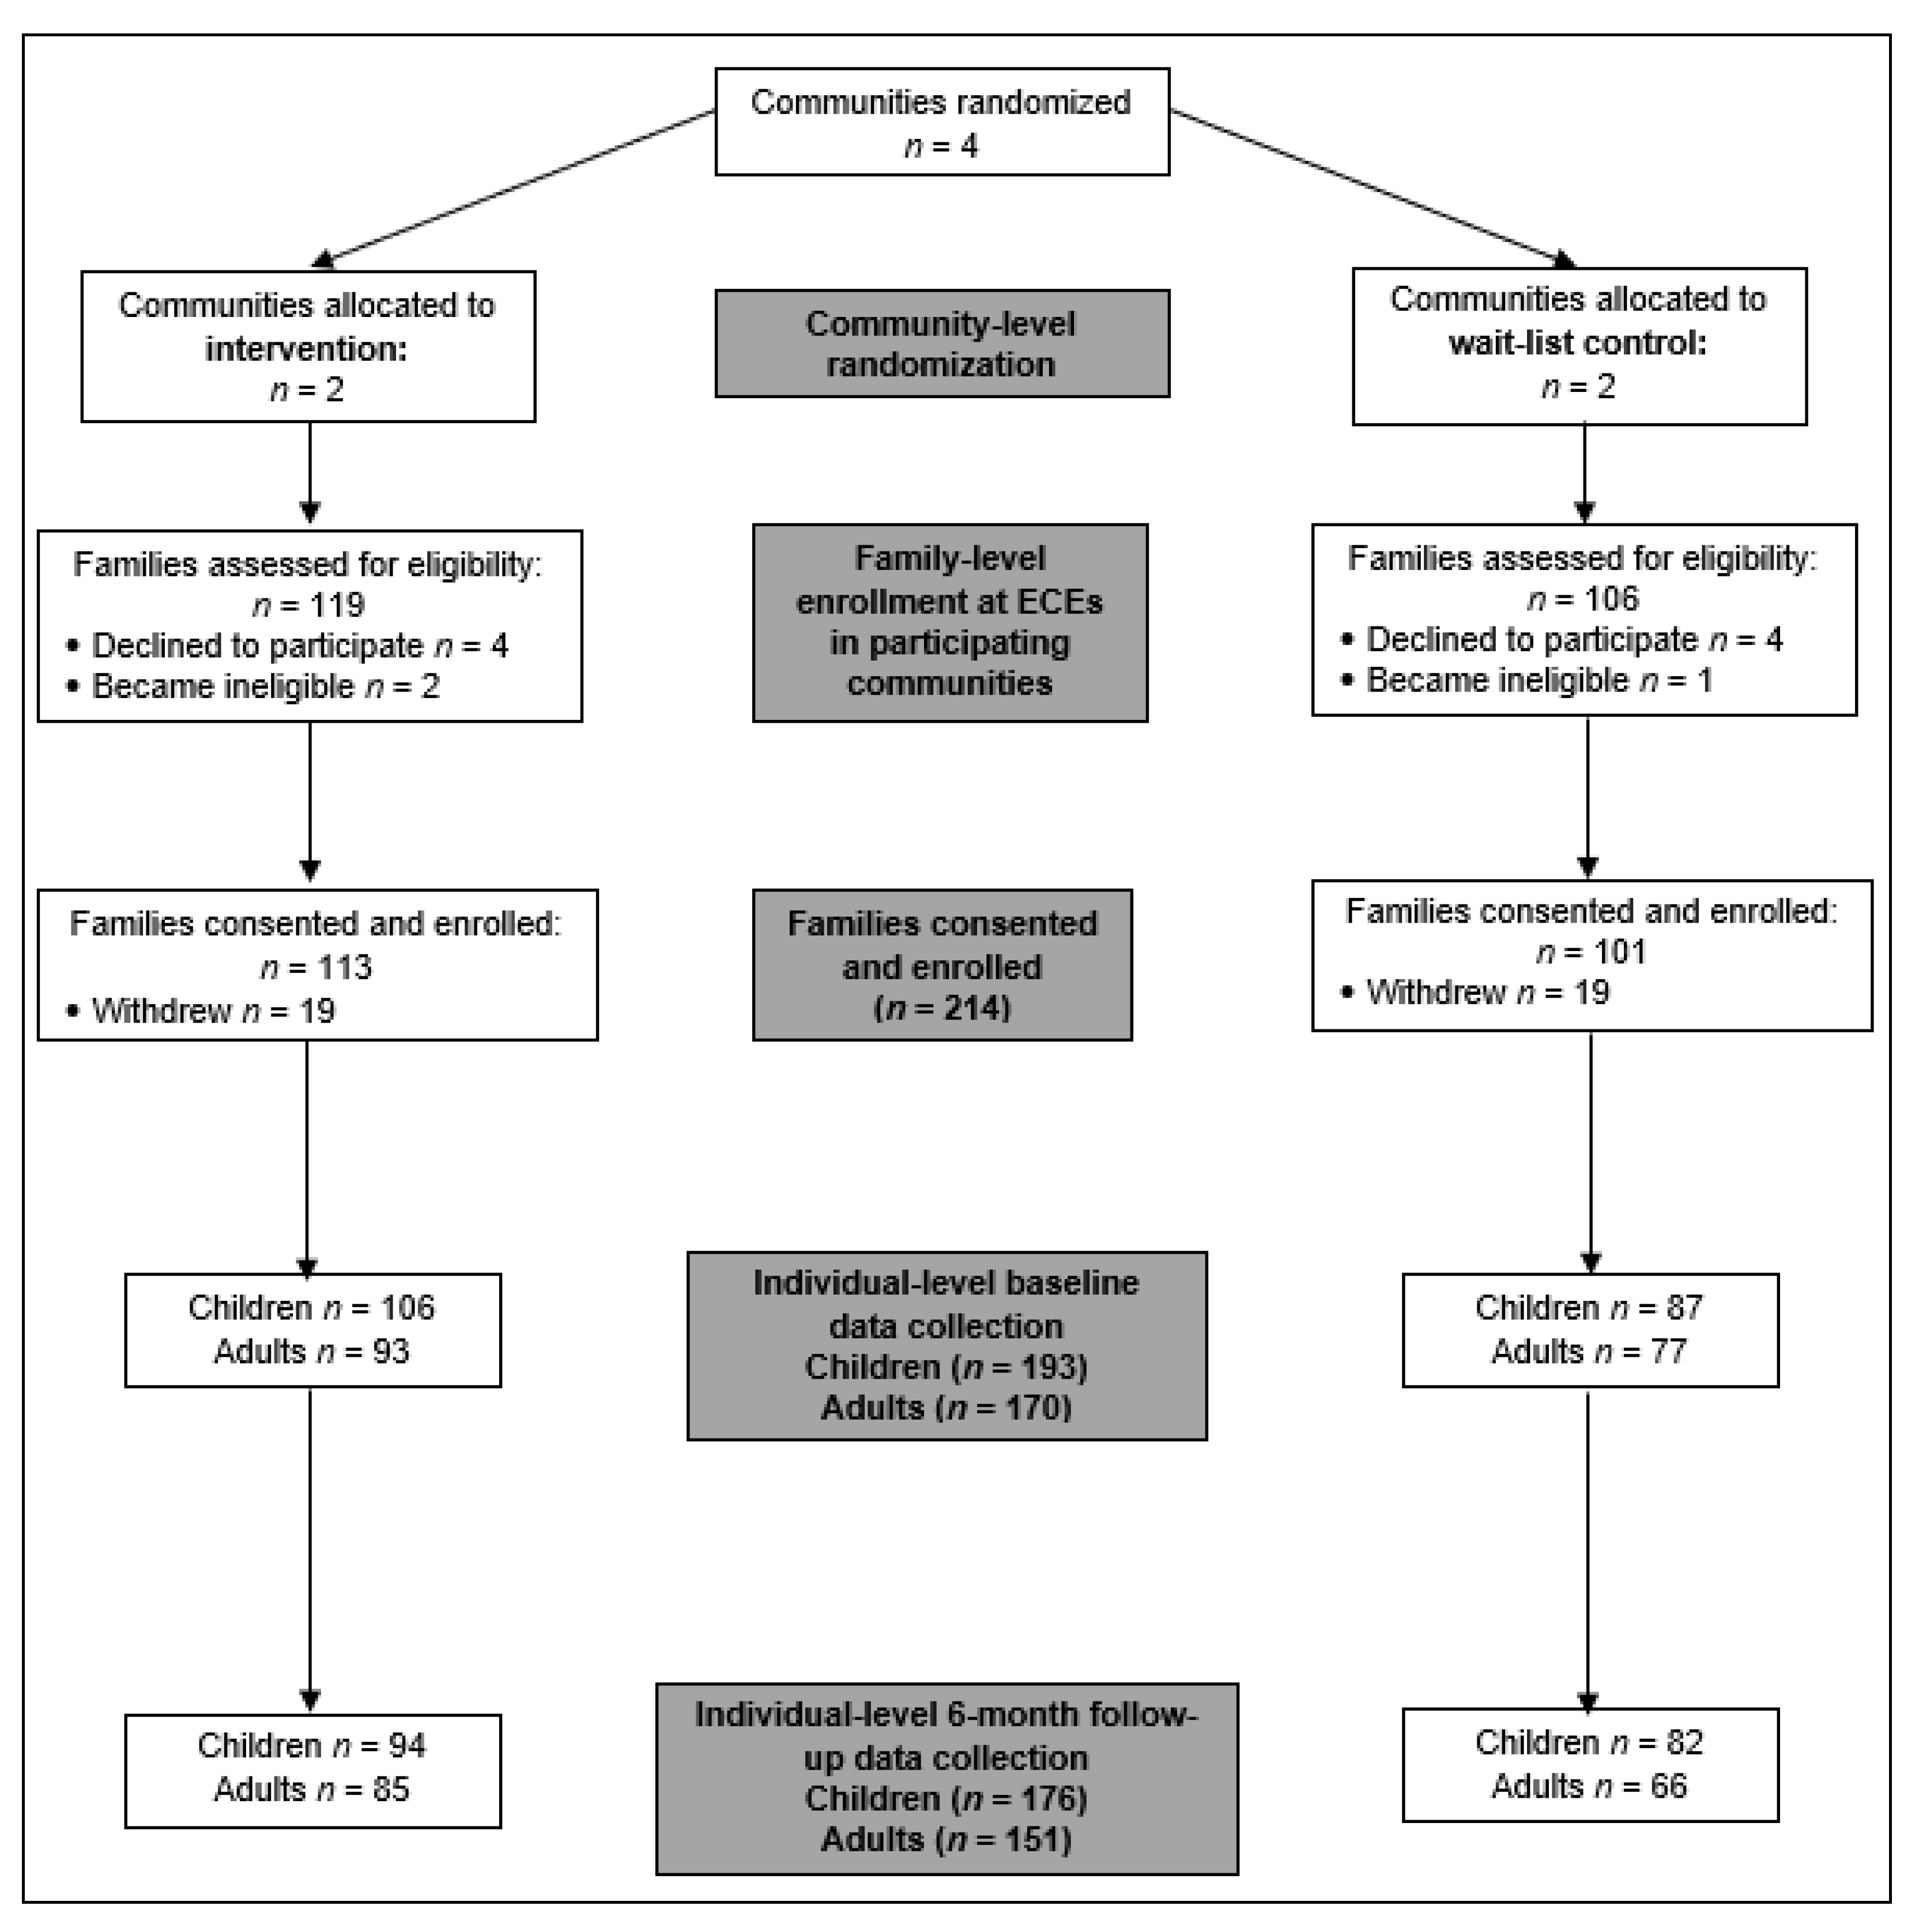
2.1. Trial Design

The six-month FRESH study employed a randomized wait-list controlled trial design with treatment condition assigned at the community level (Figure 1). The design and methods of the FRESH study have been published in detail elsewhere [14]. In summary, our tribal-university partnership recruited NA families of children attending Osage Nation ECE programs in four communities to assess individual-level changes on children and adults. Two communities (n = 5 ECEs) received the intervention and two communities (n = 4 ECEs) served as wait-list controls. We randomized by community instead of ECE program to avoid crossover due to geographical proximity to members of the other study group.

2.2. Participant Recruitment

The FRESH Leadership Committee included four university researchers and 13 Osage Nation employees from the health, education, language, agriculture, and government divisions and led all aspects of the study. University researchers set up tables in ECE programs during school orientation, back-to-school nights, and during child drop-off/pick-up to notify parents about the study and invite them to participate [14]. ECE staff also contacted parents to notify them about the study. FRESH study flyers that promoted the study were shared through children’s backpacks and parent mailings. Flyers were also posted in classrooms around the schools.
Adults at least 18 years old who met the following inclusion criteria were eligible to participate in the study: (1) one or more family member(s) in the household identified as NA; (2) one or more child(ren) between the ages of three and six years enrolled at an Osage Nation ECE program; (3) planned to reside in Osage Nation for nine months or more; and (4) one or more adult family member(s) willing to engage in monthly family nights at the school. Children were eligible if they were between the ages of three and six years old, enrolled in a participating ECE program, and were a household family member of an eligible adult. Adults that were interested in the study were screened and enrolled in the study if all inclusion criteria were met. Baseline data collection was then scheduled for adults and children. After baseline data collection, study parents were informed which treatment group they were in.
Written informed consent was obtained for all adults and adults gave written assent for their child(ren). All study materials were co-developed, reviewed, and approved by the Osage Nation Congress and the Oklahoma State University Center for Health Sciences Institutional Review Board.

2.3. FRESH Intervention Description

Three main components encompass this multi-level, randomized controlled trial: (1) a farm-to-school nutrition and garden curriculum (primary intervention); (2) an online and in-person hybrid parent curriculum (passive component); and (3) farm-to-school menu modifications at the participating ECEs.

2.3.1. Farm-to-School Nutrition and Gardening Curriculum

This intervention component sought to increase vegetable intake among children in the ECE programs. We collaborated with the Leadership Committee and Osage Nation ECE program site managers, teachers, cooks, and staff at the tribal farm (Harvest Land) to determine which produce was of interest and available for the study. Since the climate in Oklahoma is unpredictable during the intervention months, ranging from cold, icy winters to a warm, wet spring, we utilized the farm and supplemented any produce they were unable to grow from a local supermarket. More details regarding the tribal farm are described elsewhere [14].
The farm-to-school nutrition and gardening curriculum was adapted for NA children from two curricula: (1) Early Sprouts [20]; and (2) Watch Me Grow [21]. More details regarding how we adapted the curriculum are described elsewhere [12]. The FRESH farm-to-school nutrition and gardening curriculum included knowledge, reading, gardening, and indoor and outdoor sensory activities, comprised of three themes that were taught for five weeks each: (1) Harvest (weeks 1–5); (2) Explore (weeks 6–10); and (3) Sprout (weeks 11–15). The focus of the curriculum was on six target vegetables: tomatoes, bell peppers, spinach, squash, butter beans, and carrots. The weekly curriculum for each theme included a reading activity (e.g., circle time or reading a book; Theme 1 only), indoor and outdoor sensory activity, and cooking activity, which included a take-home recipe kit. The intended duration for each activity varied: 5–30 min for reading activities, up to 60 min for indoor and outdoor sensory activities, and up to 75 min for cooking activities. All weekly lessons were assembled in a handbook and distributed to intervention teachers for implementation. Garden beds for the outdoor sensory activities and cooking activities were built and maintained by the Harvest Land farm staff at Osage Nation. All intervention children also took home a family recipe kit, including ingredients and a recipe to repeat the cooking activity with their family to increase exposure to the vegetables.

2.3.2. Parent Curriculum

Although the FRESH study did not directly intervene upon dietary intake of parents, we did include a passive online and in-person hybrid parent curriculum, adapted from the Choose Health LA’s Healthy Parenting Workshops [22], with components from the First Nations Development Institute’s Food Sovereignty Assessment Tool [23] and the Grassroots International’s Food for Thought and Action curriculum [24]. The online curriculum comprised of 12 short video modules focused on providing parents with strategies to support their children in eating healthier foods and included healthy lifestyle education and healthy parenting practices [25]. The in-person component included three in-person family night workshops that focused on food sovereignty in the community and community capacity building for health. More details regarding the adaptation of the parent curriculum are described elsewhere [25].

2.3.3. Menu Modifications

The last component included menu modifications at the ECE programs. Further description of the menu modifications from the FRESH study can be found elsewhere [26,27,28]. In short, fresh vegetables from Osage Nation’s Harvest Land farm were harvested and delivered to the ECEs to be incorporated into the ECE menus. The menus were modified to achieve best practices established by the Child and Adult Care Food Program (CACFP), which included more vegetables and fruits as snacks, replacing whole grains for refined grains, reducing fried foods, and removing sugar-sweetened beverages. The menus included the six target vegetables from the farm-to-school curriculum provided from the Osage Nation farm two times weekly and provided to the children in meals or offered as snacks within each menu cycle.

2.4. Trainings

Teachers in both intervention and control ECE programs received two trainings before the FRESH intervention. The first was a responsive feeding training, focusing on using “best practices” around stimulating children to try vegetables and fruits. The second training was an orientation to the FRESH farm-to-school nutrition and gardening curriculum. More information regarding teacher trainings is described in other publications [14,26,27,28].

2.5. Process Evaluations

We administered weekly process evaluations to assess adherence to the FRESH farm-to-school nutrition and gardening curriculum. The web-based survey was emailed weekly to teachers in the intervention ECE programs. We based the questions on the three themes and three activities (reading, sensory, and cooking) from the curriculum, which included a range of 8–10 quantitative and qualitative questions [12]. Questions included activity completion (yes or no), duration of activity (in minutes), objectives met for each activity, and a section for any comments or feedback about the weekly lesson. Teachers also indicated whether the children enjoyed, were neutral, or disliked the recipe of the week in the cooking activity section.
Fidelity was assessed by calculating the percentage of classrooms that completed each activity and was based on previous process evaluations; low fidelity (0–49%), moderate fidelity (50–74%), and high fidelity (75–100%) [29,30]. Results from the FRESH process evaluations showed high fidelity for each activity: 100% for the reading activities, 84.6–100% for the sensory activities, and 76.9–100% for the cooking activities [12].

2.6. Data Collection and Measures

Baseline assessments were conducted for individual-level measures on children and adults before the intervention. The intervention lasted during the spring school semester of 2018. Follow-up measures of individual-level outcomes were assessed immediately after the intervention. The primary aim was to improve dietary intake among NA children and parents. As a secondary aim, we assessed BMI, systolic blood pressure (adults only), health status, and household food insecurity among children and parents.

2.6.1. Demographics

Children and adult’s age, gender, and racial/ethnic background (participants could select more than one) were assessed. In adults, we also assessed marital status, annual household income, educational attainment, employment, use of public assistance programs (e.g., Temporary Assistance for Needy Families, Supplemental Nutrition Assistance Program (SNAP), and Supplemental Security Income), number of children under the age of 18 years that live in the same household, and relationship to enrolled child(ren).

2.6.2. Dietary Intake

Dietary intake for children was assessed by measuring the consumption of the six target vegetables in the FRESH farm-to-school curriculum using the weighed plate waste method [31] to assess objective levels of vegetable consumption. During the plate waste administration, we also assessed preference, or willingness to try, target vegetables. Trained researchers rated each child’s interaction with each target vegetable using a five-point checklist to measure observed willingness to try [32]. The rating options were: (0) Did not remove vegetable from box, (1) removed food, but did not bring to nose/mouth, (2) removed food and brought to nose/mouth, but did not put food in mouth, (3) put food in mouth, but did not swallow food (including taking a bite and spitting it out or licking an item), (4) put food in mouth and swallowed [32]. More information regarding the child food consumption methods is provided elsewhere [33].
Dietary intake for adults was evaluated using the National Cancer Institute’s Automated Self-Administered 24 h Recall [34]. Recalls were obtained either in-person or via phone by trained university staff. Recall data were used to estimate mean intake of total energy (kcals), total sugar (grams), total fats (grams), total fruits (cup equivalents), and total vegetables (cup equivalents) between intervention and control groups. We also used the 7-item Fruit and Vegetables (F/V) Behavior Checklist [35,36] to assess combined fruit and vegetable intake in cups per day.

2.6.3. Biometrics and Health Status

BMI was assessed for both children and adults using measured height and weight. Weight was measured without shoes and in light clothing. Children’s height and weight were converted to BMI percentiles using the Center for Disease Control and Prevention parameters [37]. Adult height and weight were used to calculate BMI by dividing weight in kilograms by height in meters squared. Adult participants were categorized according to CDC guidelines: (1) underweight (BMI < 18.5), (2) healthy weight (BMI = 18.5–24.9), (3) overweight (BMI = 25.0–29.9), and (4) obese (BMI ≥ 30.0).
Blood pressure was measured on adults only. We used a blood pressure protocol that required adults to first empty their bladder and sit quietly for five minutes with both feet flat on the ground before blood pressure measurements. Measurements were taken three times and an average was calculated using the last two measurements. Mean systolic blood pressure is reported at baseline and after completion of the intervention.
Self-reported health status was assessed in both adults and children (by adult proxy) with five response options ranging from “excellent” to “poor”.

2.6.4. Food Insecurity

To assess household food insecurity, we used the United States Department of Agriculture (USDA) 18-item Household Food Security Survey Module [38]. This survey instrument consists of 18 questions that assess quantitative and qualitative dimensions of the food supply in the household, such as behavioral and psychological responses. To calculate levels of food security, the number of confirmatory responses to the questions were totaled, counting “yes”, “often”, “sometimes”, “almost every month”, and “some months” as affirmative (score of 1). Answers consisting of “no”, “never true”, or “only 1 or 2 months” were given a score of 0. Consistent with USDA guidelines, a score of 0–1 indicates high food security, 2–3 indicates marginal food security, 3–7 indicates low food security, and 8–18 indicates very low food security.

2.7. Statistical Analyses

The primary outcome (dietary intake) was used to calculate the sample size. On the basis of power calculations, to detect a 15–30 g (SD = 34) difference in target vegetable consumption, the target sample size of children was 19–73 per treatment group (38–146 total). For adults, a target sample size of 168 per group (336 total) was estimated to detect a mean difference of 0.3 servings (SD = 1.2) of fruits and vegetables per day. For both calculations, 80% power and an alpha of 0.05 was set.
To compare baseline demographic variables between intervention and control arms, a chi-square test and Fisher’s Exact test for categorical variables and an independent t-test for continuous variables were used. To compare difference in post-intervention outcomes between intervention and control arms, adjusted for baseline values, an analysis of covariance for continuous variables and Cochran–Mantel–Haenszel chi-squared test for categorical variables were used. All statistical analyses were performed using SAS version 9.4 [39].

3. Results

3.1. Demographics

There was a total of 193 children (n = 106 intervention; n = 87 control) in the FRESH study (Figure 1). Most (50.3%) were 4 years old; however, there was a slightly higher percentage of 3-year-olds and 5-year-olds in the control group compared to the intervention group (p = 0.001; Table 1). About 54.9% were female and most identified as NA/AN or white, with more intervention group children identifying as NA/AN compared to control group children (80.2% vs. 63.2%; p = 0.01) and more children in the control group compared to the intervention group identifying as white (59.8% vs. 27.4%; p < 0.001).
There was a total of 170 adults (n = 93 intervention; n = 77 control) in the study (Figure 1). The mean age was 33.2 years, the majority were female (91.8%), and over 50% reported identified as NA/AN or white, with more intervention group adults identifying as NA/AN compared to the controls (66.7% vs. 44.2%; p = 0.005) and more adults in the control group identifying as white compared to the intervention group (67.5% vs. 38.7%; p < 0.001). Almost 70% reported being married/living with a partner, 35.3% received public assistance, and the mean number of children (<18 years old) living in the household was almost three. Annual household income differed significantly between groups (p < 0.001), with 40.9% of intervention group participants reporting household income of more than USD 50,000 and 53.5% of control group participants reporting household income of between USD 20,000 and 50,000. Education also differed significantly between the groups (p = 0.02), with 32.3% of adults in the intervention group receiving a college degree or higher and 51.9% of control participants having a high school degree or less/GED. More participants in the intervention group reported working full-time compared to the control group (64.6% vs. 48.2%, respectively). Most adults reported being a parent or step-parent of the child(ren) enrolled in the study (92.4%).

3.2. Child Outcomes

3.2.1. Dietary Intake

Of the 193 children with baseline data, we were able to obtain follow-up data for 176 (n = 94 intervention; n = 82 control). Loss to follow-up was 8.8% among children. At baseline, plate waste results were similar between the two groups for all six vegetables. There were significant increases in vegetable intake in the intervention group compared to the controls from baseline to follow-up for squash (−0.09 to 1.3 vs. 0.3 to −0.8, respectively; p = 0.0007) and beans (1.4 to 3.2 vs. 1.2 to 0.7; p = 0.0002, respectively; Table 2). From baseline to follow-up, there were no significant differences in the intervention group compared to the control group for intake of tomatoes (5.6 to 6.7 vs. 4.4 to 5.4; p = 0.94), carrots (13.4 to 11.5 vs. 11.5 to 10.2; p = 0.76), or spinach (1.4 to 1.9 vs. 1.4 to 1.9; p = 0.91). The intake of peppers increased in both intervention and control groups, although the difference in intake between the groups was not significant (2.4 to 4.9 vs. 1.3 to 2.6; p = 0.28).
Willingness to try results were not significantly different between the two groups at baseline for all six vegetables. There were significant increases in scores for tomatoes in both intervention and control groups (2.7 to 2.8 and 2.1 to 2.3, respectively; p = 0.01; Table 2) and for beans in the intervention group (2.4 to 2.7; p = 0.049). From the two time points, there were no significant differences in the intervention group compared to the control group for carrots (4.0 to 3.7 vs. 4.0 to 3.7; p = 0.5), spinach (3.3 to 3.4 vs. 2.3 to 3.1; p = 0.94), squash (2.0 to 2.0 vs. 1.9 to 1.9; p = 0.94), or peppers (2.5 to 3.1 vs. 2.0 to 2.3; p = 0.91). More in-depth results regarding plate weight and willingness to try data are reported elsewhere [33].

3.2.2. Health Outcomes

The baseline prevalence of underweight (1.1% vs. 0%), healthy weight (67.0% vs. 65.4%), overweight (19.1% vs. 12.8%), and obese (12.8% vs. 21.8%) were not significantly different between the intervention and control groups (Table 2). Post-intervention prevalence of underweight (0.0% vs. 2.6%), healthy weight (61.8% vs. 56.4%), overweight (22.5% vs. 16.7%), and obese (15.7% vs. 24.4%) were similar in the intervention and control groups, respectively (Table 2). There were no significant changes in health status among children in either group, with most adults reporting their child had “excellent” or “very good” health at both time points.

3.3. Adult Outcomes

3.3.1. Dietary Intake

Of the 170 adults with baseline data, we were able to obtain follow-up data for 151 (n = 85 intervention; n = 66 control). Loss to follow-up was 11.2% among adults. Fruit and vegetable intake at baseline using the F/V Behavior Checklist was similar in the intervention and control groups. Combined fruit and vegetable intake from baseline to follow-up increased slightly in the intervention group, but not in the control group (2.2 to 2.6 vs. 2.3 to 2.3, respectively), however results were not significant (p = 0.07; Table 3). At baseline, results from the dietary recall show there were no significant differences between the intervention and control groups for total energy, total fat, total added sugar, total fruits, or total vegetables. Results from the dietary recall show that from baseline to follow-up, the mean dietary intake of total energy and total sugar significantly improved in the intervention group (1699.9 to 1480.1; 99.0 to 75.2, respectively). Total sugar also significantly improved from baseline to follow-up among the controls (131.0 to 91.1). Total fat, total fruits, and total vegetables were not significantly different in the intervention group (68.5 to 61.2; 0.5 to 0.4; 1.3 to 1.3, respectively) or the control group (68.5 to 66.2; 0.4 to 0.5; 1.2 to 1.3, respectively) (Table 3) from baseline to follow-up.

3.3.2. Health Outcomes

BMI at post-intervention was not significantly different between the intervention and control groups when adjusted for baseline values; however, most participants in both intervention and control groups were categorized as obese at baseline (54.4% and 53.0%, respectively) and post-intervention (51.4% and 53.8%, respectively). Systolic blood pressure slightly decreased in the intervention group, although not significantly different compared to the control group, from baseline to follow-up (126.5 to 120.7) (Table 3). There were no changes in health status from baseline to follow-up in either group (Table 3).

3.3.3. Food Insecurity

The baseline prevalence of high food security (49.5% vs. 46.8%), marginal food security (20.4% vs. 15.6%), low food security (24.7% vs. 35.1%), and very low food security (6.5% vs. 6.5%) were not significantly different between the intervention and control groups (Table 3). After the intervention, the prevalence of high food security (58.1% vs. 62.3%), marginal food security (22.6% vs. 15.6%,), low food security (18.3% vs. 23.4%), and very low food security (2.2% vs. 2.6%) were also not significantly different between the intervention and control groups. Although more participants reported high food security in both intervention and control groups at follow-up, differences were not significant.

4. Discussion

The aims of the FRESH study were to improve dietary intake (primary outcome), BMI, systolic blood pressure (adults only), health status, and food insecurity (secondary outcomes) among NA families. FRESH is one of the first comprehensive multi-component, multi-level CBPR studies to use a farm-to-school and parent curricula to build community capacity and reduce obesity risk among NA families attending ECE programs [14].
Although the FRESH study did not improve BMI or other secondary outcomes among children, there were significant increases in vegetable intake. Previous studies looking at vegetable intake and BMI improvement among children showed varied results [40,41,42]. Some randomized controlled trials found that nutrition interventions that resulted in significant increase of vegetable intake also found a decrease in BMI [43], whereas others found no change among BMI [42]; the latter finding is consistent with our study. One nutrition and gardening intervention that implemented a randomized controlled trial at school found that BMI significantly improved in the intervention group compared to the controls; however, this study involved older children and a longer intervention period [44]. At follow-up, regarding the willingness to try scale, we found significant increases in scores for tomatoes for both treatment groups and increases in scores for beans in the intervention group. Our findings are similar to the Nutrition Matters! curriculum, which found a significant increase in willingness to try scores in three fruits and vegetables among the nutrition and gardening group [32], and is consistent with a previous study that found that repeated exposures to vegetables led to an increase in children’s willingness to try target vegetables [45].
Among the adults, the FRESH study did not improve vegetable intake, BMI, blood pressure, or food security. However, in the intervention group, there was a trend toward increased fruit and vegetable intake from baseline to post-intervention. At follow-up, total sugar intake and total energy significantly improved among the intervention group compared to the controls. Our results differ from a previous online nutritional intervention among NA participants that found an increase in vegetable intake [46]. However, as the FRESH intervention focused primarily on children with a secondary (passive) component including the parents, significant results were not expected [14].
Our study had several strengths. This study used a randomized controlled design, able to compare intervention and control groups. Although the study was underpowered, we still found a trend towards increased vegetable intake (p = 0.07) in intervention adults. In addition, we used objective measures of vegetable consumption in children rather than a dietary recall, providing a more comprehensive dietary intake. This was noted as a suggestion among authors in a systematic review on garden-based interventions among preschoolers [17]. Another strength of our study is providing children with repeat taste exposure of vegetables, which past research has shown to be effective in increasing intake [47,48,49,50,51,52,53,54,55]. Furthermore, our study focused on providing the ECE menus with local fresh vegetables, addressing the need for studies that intervene in the social determinants of health. The Osage Nation is a reservation that has limited access to healthy and fresh foods, and this study built upon and strengthened local resources by facilitating the process for supplying the ECEs with the local produce.
The limitations of this study include the challenge of implementing some of the dietary measures among children. For example, there were negative values on plate waste vegetables, which were determined to likely be the result of water condensation. In addition, we did not directly intervene with parents, which contributed to low participation rates in the study’s online component of the parent curriculum. Only 56% of parents attended the first week of the online curriculum and 12% attended the final week [25]. However, in contrast, participation in the in-person component of the parent/family intervention (e.g., family nights) was nearly twice as high as the online participation, although it also decreased as the intervention continued [25].
Since the original implementation of the FRESH study, the Osage Nation Harvest Land farm built upon the lessons from the study process and findings to expand its produce to a greater number of tribal programs and services. The Harvest Land farm now features commercial-grade aquaponics systems and eight new state-of-the-art greenhouses, which are able to grow various vegetables year-round. The farm is now in the process of developing a tribally specific community-supported agriculture program, which aims to increase access and intake of fresh produce.

5. Conclusions

The FRESH study is one of the first farm-to-school interventions, guided by a CBPR orientation, implemented in rural NA ECE programs to assess diet and health outcomes. This study adds to the limited information available with regards to vegetable intake among NA children [56]. Future interventions to encourage healthy dietary intake among young children should include a comprehensive parent component that supports healthy eating for all members of the family and household, while at the same time continuing to focus on the social determinants of health to build community capacity and systemic resilience. When intervening within NA communities, programs should incorporate use of NA languages, traditional food origin and cultural stories, and the transmission of knowledge from elders as a potential strategy for better inclusion of a family/household approach. Repeating the FRESH intervention in other NA ECE programs, with adaptations specifically tailored to their communities, will aid in testing the feasibility in diverse communities.

Author Contributions

T.T. contributed as first author on this paper, contributed to all sections of the paper, and conducted literature reviews. A.H. contributed to the introduction, methods, and discussion sections. A.H. and W.S. performed data analysis and prepared data tables and contributed to the methods and results narrative. M.S. and J.H. reviewed the manuscript in its entirety and added content. V.B.B.J. designed and directed the FRESH study, oversaw all aspects of its implementation, and assisted in the review and editing. All authors have read and agreed to the published version of the manuscript.

Funding

This study was funded by the National Institute on Minority Health and Health Disparities (R01MD011266). The funding agency did not participate in the study design, data collection, analysis, decision to publish, or preparation of the manuscript.

Institutional Review Board Statement

The study was conducted according to the guidelines of the Declaration of Helsinki, and approved by the Institutional Review Boards of the University of Oklahoma Health Sciences Center (IRB #6531 approved in 2016), OSU-CHS (IRB #2019012 approved in November 2019), and the Osage Nation Congress.

Informed Consent Statement

This study is a randomized controlled trial (NCT03251950). Informed consent was attained from all subjects involved in the FRESH study.

Data Availability Statement

The data presented are accessible upon reasonable request from the corresponding author and can only be released following permission from the senior author and Osage Nation. The data are not publicly available to protect privacy of tribal citizen human subject participants.

Acknowledgments

We thank the Osage Nation leaders, ECE teachers, cooks, and program managers, and citizens for their involvement in and support of the FRESH study. We also thank the Osage Nation Leadership Committee who served as the guiding body throughout the duration of the FRESH study and their commitment to address diet-related chronic disease in their communities through participation in the committee and numerous other actions. We thank all research study staff who contributed to the data collection efforts throughout the project. This manuscript has been reviewed by the Osage Nation and approved to publish.

Conflicts of Interest

The authors declare no conflict of interest.

References

  1. Jacobs-Wingo, J.L.; Espey, D.K.; Groom, A.V.; Phillips, L.E.; Haverkamp, D.S.; Sandte, L. Causes and disparities in death rates among urban American Indian and Alaska Native populations, 1999–2009. Am. J. Public Health 2016, 106, 906–914. [Google Scholar] [CrossRef]
  2. Blackwell, D.; Villarroal, M. Tables of Summary Health Statistics for U.S. Adults: 2016 National Health Interview Survey; National Center for Health Statistics: Hyattsville, MD, USA, 2018. [Google Scholar]
  3. Pan, L.; Freedman, D.S.; Park, S.; Galuska, D.A.; Potter, A.; Blanck, H.M. Changes in obesity among US children aged 2 through 4 years enrolled in WIC during 2010–2016. JAMA 2019, 321, 2364–2366. [Google Scholar] [CrossRef]
  4. Sanlier, N.; Ulusoy, H.G.; Kocabaş, S.; Çelik, B.; Göbel, P.; Yilmaz, S. Mediterranean Diet Adherence among Preschoolers and its Association with Parents’ Beliefs, Attitudes, and Practices. Ecol. Food Nutr. 2021, 60, 225–243. [Google Scholar] [CrossRef]
  5. Scaglioni, S.; De Cosmi, V.; Ciappolino, V.; Parazzini, F.; Brambilla, P.; Agostoni, C. Factors influencing children’s eating behaviours. Nutrients 2018, 10, 706. [Google Scholar] [CrossRef] [Green Version]
  6. Liu, J.; Rehm, C.D.; Onopa, J.; Mozaffarian, D. Trends in diet quality among youth in the United States, 1999–2016. JAMA 2020, 323, 1161–1174. [Google Scholar] [CrossRef]
  7. Watts, V.; Rockett, H.; Baer, H.; Leppert, J.; Colditz, G. Assessing diet quality in a population of low-income pregnant women: A comparison between Native Americans and whites. Matern. Child Health J. 2007, 11, 127–136. [Google Scholar] [CrossRef]
  8. Ferranti, E.P.; Hartman, T.J.; Elliott, A.J.; Mitchell, D.C.; Angal, J.; Nickleach, D.; Bellissimo, M.; Breslow, R. Peer Reviewed: Diet Quality of Pregnant American Indian Women in the Northern Plains. Prev. Chron. Dis. 2019, 16, E53. [Google Scholar]
  9. Byker Shanks, C.; Ahmed, S.; Dupuis, V.; Tryon, M.; Running Crane, M.; Houghtaling, B.; Garvin, T. Dietary quality varies among adults on the Flathead nation of the confederated Salish and Kootenai tribes in Montana. J. Community Health 2020, 45, 388–399. [Google Scholar] [CrossRef]
  10. Cullen, K.W.; Chen, T.-A. The contribution of the USDA school breakfast and lunch program meals to student daily dietary intake. Prev. Med. Rep. 2017, 5, 82–85. [Google Scholar] [CrossRef]
  11. Matwiejczyk, L.; Mehta, K.; Scott, J.; Tonkin, E.; Coveney, J. Characteristics of effective interventions promoting healthy eating for pre-schoolers in childcare settings: An umbrella review. Nutrients 2018, 10, 293. [Google Scholar] [CrossRef] [Green Version]
  12. Wetherill, M.S.; Bourque, E.E.; Taniguchi, T.; Love, C.V.; Sisk, M.; Jernigan, V.B.B. Development of a Tribally-led Gardening Curriculum for Indigenous Preschool Children: The FRESH Study. J. Nutr. Educ. Behav. 2021, 53, 991–995. [Google Scholar] [CrossRef] [PubMed]
  13. Natale, R.A.; Messiah, S.E.; Asfour, L.S.; Uhlhorn, S.B.; Englebert, N.E.; Arheart, K.L. Obesity prevention program in childcare centers: Two-year follow-up. Am. J. Health Promot. 2017, 31, 502–510. [Google Scholar] [CrossRef] [PubMed]
  14. Jernigan, V.B.B.; Taniguchi, T.; Haslam, A.; Williams, M.B.; Maudrie, T.L.; Nikolaus, C.J.; Wetherill, M.S.; Jacob, T.; Love, C.V.; Sisson, S. Design and Methods of a Participatory Healthy Eating Intervention for Indigenous Children: The FRESH Study. Front. Public Health 2022, 10, 790008. [Google Scholar] [CrossRef] [PubMed]
  15. Langellotto, G.A.; Gupta, A. Gardening increases vegetable consumption in school-aged children: A meta-analytical synthesis. HortTechnology 2012, 22, 430–445. [Google Scholar] [CrossRef] [Green Version]
  16. Kos, M.; Jerman, J. Preschool children learning about the origin of food, on local farms and in the preschool garden. Nutr. Food Sci. 2012, 42, 324–331. [Google Scholar] [CrossRef]
  17. Savoie-Roskos, M.R.; Wengreen, H.; Durward, C. Increasing fruit and vegetable intake among children and youth through gardening-based interventions: A systematic review. J. Acad. Nutr. Diet. 2017, 117, 240–250. [Google Scholar] [CrossRef] [Green Version]
  18. Triador, L.; Farmer, A.; Maximova, K.; Willows, N.; Kootenay, J. A school gardening and healthy snack program increased Aboriginal First Nations children’s preferences toward vegetables and fruit. J. Nutr. Educ. Behav. 2015, 47, 176–180. [Google Scholar] [CrossRef]
  19. Wallerstein, N.B.; Duran, B. Using community-based participatory research to address health disparities. Health Promot. Pract. 2006, 7, 312–323. [Google Scholar] [CrossRef]
  20. Kalich, K.; Bauer, D.; McPartlin, D. Early Sprouts: Cultivating Healthy Food Choices in Young Children; Redleaf Press: St. Paul, MN, USA, 2009. [Google Scholar]
  21. Namenek Brouwer, R.J.; Benjamin Neelon, S.E. Watch Me Grow: A garden-based pilot intervention to increase vegetable and fruit intake in preschoolers. BMC Public Health 2013, 13, 363. [Google Scholar] [CrossRef] [Green Version]
  22. Los Angeles County Department of Public Health. Healthy Parenting Workshops. 2015. Available online: http://www.choosehealthla.com/wp-content/uploads/2016/09/PDF-6-Healthy-Parenting-Workshops-2nd-Edition-English-Toolkit.pdf (accessed on 15 January 2016).
  23. Bell-Sheeter, A. Institute of First Nations Development: Food Sovereignty Assessment Tool, 2nd ed.; First Nations Development Institute: Longmont, CO, USA, 2014. [Google Scholar]
  24. Grassroots International. Food for thought and Action 2008. Available online: https://grassrootsonline.org/what-we-do/publications-and-resources/educational-resources/food-thought-action/ (accessed on 1 May 2018).
  25. Haslam, A.; Love, C.; Taniguchi, T.; Williams, M.B.; Wetherill, M.S.; Sisson, S.; Weedn, A.E.; Jacob, T.; Jernigan, V.B.B. Development and Implementation of a Hybrid Online and In-Person Food Sovereignty and Nutrition Education Curriculum for Native American Parents: The FRESH Study. Health Educ. Behav. 2022. [Google Scholar] [CrossRef]
  26. Sisson, S.B.; Sleet, K.; Rickman, R.; Love, C.; Williams, M.; Jernigan, V.B.B. Impact of the 2017 Child and Adult Care Food Program Meal Pattern Requirement Change on Menu Quality in Tribal Early Care Environments: The Food Resource Equity and Sustainability for Health Study. Curr. Dev. Nutr. 2019, 4, 12–22. [Google Scholar] [CrossRef] [PubMed]
  27. Sisson, S.B.; Sleet, K.; Rickman, R.; Love, C.; Williams, M.; Jernigan, V.B.B. The development of child and adult care food program best-practice menu and training for Native American Head Start programs: The FRESH study. Prev. Med. Rep. 2019, 14, 100880. [Google Scholar] [CrossRef] [PubMed]
  28. Sleet, K.; Sisson, S.B.; Dev, D.A.; Love, C.; Williams, M.B.; Hoffman, L.A.; Jernigan, V.B.B. The impact of responsive feeding practice training on teacher feeding behaviors in tribal early care and education: The food resource equity and sustainability for health (FRESH) study. Curr. Dev. Nutr. 2020, 4, 23–32. [Google Scholar] [CrossRef]
  29. Taniguchi, T.E.; Salvatore, A.L.; Williams, M.B.; Love, C.V.; Noonan, C.J.; Cannady, T.K.; Standridge, J.; Fox, J.; Spiegel, J.; Owens, J.; et al. Process Evaluation Tool Development and Fidelity of Healthy Retail Interventions in American Indian Tribally Owned Convenience Stores: The Tribal Health Resilience in Vulnerable Environments (THRIVE) Study. Curr. Dev. Nutr. 2020, 4, 33–41. [Google Scholar] [CrossRef] [PubMed]
  30. Gittelsohn, J.; Suratkar, H.J.; Sacher, S.; Rajan, R.; Rasooly, I.R.; Bednarek, E.; Sharma, S.; Anliker, J.A.A. Process evaluation of Baltimore Healthy Stores: A pilot health intervention program with supermarkets and corner stores in Baltimore City. Health Promot. Pract. 2010, 11, 723–732. [Google Scholar] [CrossRef] [PubMed]
  31. Bollella, M.; Boccia, L.; Nicklas, T.; Lefkowitz, K.; Pittman, B.; Zang, E.; Williams, C. Assessing dietary intake in preschool children: The healthy start project-New York. Nutr. Res. 1999, 19, 37–48. [Google Scholar] [CrossRef]
  32. Farfan-Ramirez, L.; Diemoz, L.; Gong, E.J.; Lagura, M.A. Curriculum intervention in preschool children: Nutrition Matters! J. Nutr. Educ. Behav. 2011, 43, S162–S165. [Google Scholar] [CrossRef]
  33. Wetherill, M.S.; Williams, M.B.; Reese, J.; Taniguchi, T.; Sisson, S.B.; Malek-Lasater, A.D.; Love, C.V.; Jernigan, V.B.B. Methods for Assessing Willingness to Try and Vegetable Consumption among Children in Indigenous Early Childcare Settings: The FRESH Study. Nutrients 2022, 14, 58. [Google Scholar] [CrossRef]
  34. Automated Self-Administered 24-Hour (ASA24) Dietary Assessment Tool Version 2016. Available online: https://asa24.nci.nih.gov/ (accessed on 15 February 2020).
  35. Murphy, S.P.; Kaiser, L.L.; Townsend, M.S.; Allen, L.H. Evaluation of validity of items for a food behavior checklist. J. Am. Diet. Assoc. 2001, 101, 751–761. [Google Scholar] [CrossRef]
  36. Townsend, M.S.; Kaiser, L.L.; Allen, L.H.; Joy, A.B.; Murphy, S.P. Selecting items for a food behavior checklist for a limited-resource audience. J. Nutr. Educ. Behav. 2003, 35, 69–82. [Google Scholar] [CrossRef]
  37. Poskitt, E. Defining childhood obesity: The relative body mass index (BMI). Acta Paediatr. 1995, 84, 961–963. [Google Scholar] [CrossRef] [PubMed]
  38. Agriculture UDo: US Adult Food Security Survey Module: Three-Stage Design, with Screeners; US Department of Agriculture, Economic Research Service: Washington, DC, USA, 2012.
  39. SAS Institute Inc. SAS 9.4 Statements: Reference; SAS Institute Inc.: Cary, NC, USA, 2013. [Google Scholar]
  40. Davis, J.N.; Pérez, A.; Asigbee, F.M.; Landry, M.J.; Vandyousefi, S.; Ghaddar, R.; Hoover, A.; Jeans, M.; Nikah, K.; Fischer, B. School-based gardening, cooking and nutrition intervention increased vegetable intake but did not reduce BMI: Texas sprouts-a cluster randomized controlled trial. Int. J. Behav. Nutr. Phys. Act. 2021, 18, 1–14. [Google Scholar] [CrossRef] [PubMed]
  41. Bacardi-Gascon, M.; Perez-Morales, M.E.; Jimenez-Cruz, A. A six month randomized school intervention and an 18-month follow-up intervention to prevent childhood obesity in Mexican elementary schools. Nutr. Hosp. 2012, 27, 755–762. [Google Scholar] [PubMed]
  42. Epstein, L.H.; Gordy, C.C.; Raynor, H.A.; Beddome, M.; Kilanowski, C.K.; Paluch, R. Increasing fruit and vegetable intake and decreasing fat and sugar intake in families at risk for childhood obesity. Obes Res. 2001, 9, 171–178. [Google Scholar] [CrossRef]
  43. Hart, C.N.; Jelalian, E.; Raynor, H.A.; Mehlenbeck, R.; Lloyd-Richardson, E.E.; Kaplan, J.; Flynn-O’Brien, K.; Wing, R.R. Early patterns of food intake in an adolescent weight loss trial as predictors of BMI change. Eat Behav. 2010, 11, 217–222. [Google Scholar] [CrossRef] [Green Version]
  44. Scherr, R.E.; Linnell, J.D.; Dharmar, M.; Beccarelli, L.M.; Bergman, J.J.; Briggs, M.; Brian, K.M.; Feenstra, G.; Hillhouse, J.C.; Keen, C.L.; et al. A Multicomponent, School-Based Intervention, the Shaping Healthy Choices Program, Improves Nutrition-Related Outcomes. J. Nutr. Educ. Behav. 2017, 49, 368–379. [Google Scholar] [CrossRef]
  45. Izumi, B.T.; Eckhardt, C.L.; Hallman, J.A.; Herro, K.; Barberis, D.A. Harvest for healthy kids pilot study: Associations between exposure to a farm-to-preschool intervention and willingness to try and liking of target fruits and vegetables among low-income children in head start. J. Acad. Nutr. Diet. 2015, 115, 2003–2201. [Google Scholar] [CrossRef]
  46. Buller, D.B.; Woodall, W.G.; Zimmerman, D.E.; Slater, M.D.; Heimendinger, J.; Waters, E.; Hines, J.M.; Starling, R.; Hau, B.; Burris-Woodall, P.; et al. Randomized Trial on the 5 a Day, the Rio Grande Way Website, A Web-based Program to Improve Fruit and Vegetable Consumption in Rural Communities. J. Health Commun. 2008, 13, 230–249. [Google Scholar] [CrossRef] [Green Version]
  47. Caton, S.J.; Ahern, S.M.; Remy, E.; Nicklaus, S.; Blundell, P.; Hetherington, M.M. Repetition counts: Repeated exposure increases intake of a novel vegetable in UK pre-school children compared to flavour-flavour and flavour-nutrient learning. Br. J. Nutr. 2013, 109, 2089–2097. [Google Scholar] [CrossRef] [Green Version]
  48. Anzman-Frasca, S.; Savage, J.S.; Marini, M.E.; Fisher, J.O.; Birch, L.L. Repeated exposure and associative conditioning promote preschool children’s liking of vegetables. Appetite 2012, 58, 543–553. [Google Scholar] [CrossRef]
  49. Remy, E.; Issanchou, S.; Chabanet, C.; Nicklaus, S. Repeated Exposure of Infants at Complementary Feeding to a Vegetable Purée Increases Acceptance as Effectively as Flavor-Flavor Learning and More Effectively Than Flavor-Nutrient Learning. J. Nutr. 2013, 143, 1194–1200. [Google Scholar] [CrossRef] [PubMed] [Green Version]
  50. de Wild, V.W.; de Graaf, C.; Jager, G. Effectiveness of flavour nutrient learning and mere exposure as mechanisms to increase toddler’s intake and preference for green vegetables. Appetite 2013, 64, 89–96. [Google Scholar] [CrossRef] [PubMed]
  51. Fildes, A.; van Jaarsveld, C.H.M.; Wardle, J.; Cooke, L. Parent-Administered Exposure to Increase Children’s Vegetable Acceptance: A Randomized Controlled Trial. J. Acad. Nutr. Diet. 2014, 114, 881–888. [Google Scholar] [CrossRef] [PubMed] [Green Version]
  52. Hausner, H.; Olsen, A.; Møller, P. Mere exposure and flavour–flavour learning increase 2–3 year-old children’s acceptance of a novel vegetable. Appetite 2012, 58, 1152–1159. [Google Scholar] [CrossRef] [PubMed]
  53. Lakkakula, A.; Geaghan, J.; Zanovec, M.; Pierce, S.; Tuuri, G. Repeated taste exposure increases liking for vegetables by low-income elementary school children. Appetite 2010, 55, 226–231. [Google Scholar] [CrossRef]
  54. Maier, A.; Chabanet, C.; Schaal, B.; Issanchou, S.; Leathwood, P. Effects of repeated exposure on acceptance of initially disliked vegetables in 7-month old infants. Food Qual. Prefer. 2007, 18, 1023–1032. [Google Scholar] [CrossRef]
  55. Wardle, J.; Cooke, L.J.; Gibson, E.L.; Sapochnik, M.; Sheiham, A.; Lawson, M. Increasing children’s acceptance of vegetables; a randomized trial of parent-led exposure. Appetite 2003, 40, 155–162. [Google Scholar] [CrossRef]
  56. Sinley, R.C.; Albrecht, J.A. Application of the IMB Model to the reported intake of fruits and vegetables of Native American Children. J. Health Disparities Res. Pract. 2018, 11, 2. [Google Scholar]
Figure 1. FRESH study community randomization, recruitment, and data collection in Osage Nation of Oklahoma.
Nutrients 14 02601 g001
Table 1. Baseline characteristics for children and adults participating in the FRESH study.
Child Demographics
Overall
n = 193
Intervention
n = 106
Control
n = 87
p-Value 3
Age, n (%) 0.001
  342 (21.8)18 (17.0)24 (27.6)
  497 (50.3)54 (50.9)43 (49.4)
  541 (21.2)21 (19.8)20 (23.0)
  6 or older13 (6.7)13 (12.3)0 (0.0)
Gender, n (%) 0.38
  Male87 (45.1)51 (48.1)36 (41.4)
  Female106 (54.9)55 (51.9)51 (58.6)
Race/ethnicity 1, n (%)
  Native American or Alaska Native140 (72.5)85 (80.2)55 (63.2)0.01
  White/Caucasian81 (42.0)29 (27.4)52 (59.8)<0.001
  Asian or Pacific Islander3 (1.6)2 (1.9)1 (1.1)1.0
  Black or African American6 (3.1)2 (1.9)4 (4.6)0.41
  Hispanic/Latino14 (7.3)9 (8.5)5 (5.7)0.58
Adult Demographics
Overall
n = 170
Intervention
n = 93
Control
n = 77
p-Value 4
Age, mean (SD)33.2 (7.1)34.0 (7.3)32.2 (6.8)0.11
Gender, n (%) 0.64
  Male14 (8.2)9 (9.7)5 (6.5)
  Female156 (91.8)84 (90.3)72 (93.5)
Race/ethnicity 1, n (%)
  Native American or Alaska Native96 (56.5)62 (66.7)34 (44.2)0.005
  White/Caucasian88 (51.8)36 (38.7)52 (67.5)<0.001
  Asian or Pacific Islander2 (1.2)1 (1.1)1 (1.3)1.00
  Black or African American3 (1.8)1 (1.1)2 (2.6)0.87
  Hispanic/Latino6 (3.5)3 (3.2)3 (3.9)1.00
Married or living with partner, n (%)118 (69.4)65 (69.9)53 (68.8)1.00
Receive public assistance 2, n (%)60 (35.3)27 (29.0)33 (42.9)0.09
Children < 18 years living in household, n (%)2.8 (1.4)2.8 (1.4)2.7 (1.4)0.65
Annual household income, n (%) <0.001
  Less than $20,00050 (29.8)24 (25.8)26 (34.7)
  $20,000–$50,00071 (42.3)31 (33.3)40 (53.3)
  More than $50,00047 (28.0)38 (40.9)9 (12.0)
  Education, n (%) 0.02
  High school degree or less/GED77 (45.3)37 (39.8)40 (51.9)
  Some college or technical school52 (30.6)26 (28.0)26 (33.8)
  College degree or higher41 (24.1)30 (32.3)11 (14.3)
Work full-time, n (%)90 (56.2)60 (64.6)37 (48.2)0.04
Relationship to child participant, n (%) 0.25
  Parent or step-parent157 (92.4)83 (88.3)75 (94.9)
  Grandparent10 (5.9)8 (8.5)3 (3.8)
  Aunt or Uncle1 (0.6)0 (0.0)1 (1.3)
  Other2 (1.2)2 (2.1)0 (0.0)
1 Participants responded to multiple race categories. 2 Includes tribal government, federal government, state government (excluding casino or “oil payments”), or the state or local welfare office. 3 Chi-square using Fisher’s Exact test to compare characteristics between intervention and control group. 4 Chi-square or t-test to compare characteristics between intervention and control group. Bold denotes significant p-value < 0.05.
Table 2. Differences in baseline and follow-up measurements of outcomes for children in the FRESH study.
VariableIntervention
n = 94
Control
n = 82
p-Value 2
BaselineFollow-UpBaselineFollow-Up
Dietary Intake
Plate Waste, mean ± SD
  Tomatoes5.6 ± 8.46.7 ± 8.94.4 ± 7.55.4 ± 9.60.94
  Carrots13.4 ± 12.811.5 ± 11.811.5 ± 12.810.2 ± 12.00.76
  Spinach1.4 ±1.81.9 ± 2.41.4 ± 2.01.9 ± 2.60.91
  Squash−0.09 ± 3.21.3 ± 4.80.3 ± 3.8−0.8 ± 2.40.0007
  Beans1.4 ± 2.73.2 ± 5.31.2 ± 3.20.7 ± 2.00.0002
  Peppers2.4 ± 5.04.9 ± 8.01.3 ± 3.82.6 ± 6.90.28
Willingness to Try
  Tomatoes2.7 ± 1.82.8 ± 1.92.1 ± 1.72.3 ± 1.80.01
  Carrots4.0 ± 1.64.0 ± 1.63.7 ± 1.83.7 ± 1.80.50
  Spinach3.3 ± 1.93.4 ± 1.92.3 ± 1.83.1 ± 2.00.94
  Squash2.0 ± 1.62.0 ± 1.51.9 ± 1.41.9 ± 1.40.94
  Beans2.4 ± 1.82.7 ± 1.92.0 ± 1.51.9 ± 1.50.049
  Peppers2.5 ± 1.83.1 ± 1.82.0 ± 1.42.3 ± 1.80.91
Health Outcomes
BMI (kg/m2), n (%) 0.31 3
  Underweight1 (1.1)0 (0.0)0 (0.0)2 (2.6)
  Healthy weight63 (67.0)55 (61.8)51 (65.4)44 (56.4)
  Overweight18 (19.1)20 (22.5)10 (12.8)13 (16.7)
  Obese12 (12.8)14 (15.7)17 (21.8)19 (24.4)
Health status 1, n (%) 0.35 3
  Excellent35 (39.8)39 (47.0)36 (49.3)40 (56.3)
  Very good38 (43.2)33 (39.8)31 (42.5)24 (33.8)
  Good13 (14.8)10 (12.0)5 (6.8)6 (8.5)
  Fair2 (2.3)1 (1.2)1 (1.4)1 (1.4)
  Poor0 (0.0)0 (0.0)0 (0.0)0 (0.0)
1 Answered by parent proxy. 2 Analysis of covariance evaluating differences in post-intervention values between intervention and control groups, controlling for pre-intervention values for respective outcome variable (unadjusted for other covariates). 3 Cochran–Mantel–Haenszel chi-squared test p-value for difference between intervention arm, adjusted for intervention group and baseline values. Bold denotes significant p-value < 0.05.
Table 3. Differences in baseline and follow-up measurements of outcomes for parents in the FRESH study.
VariableIntervention
n = 93
Control
n = 77
p-Value 1
BaselineFollow-UpBaselineFollow-Up
Dietary Intake
F/V Behavior Checklist, mean ± SD (n = 152)
  Fruit and vegetable intake (cups per day)2.2 ± 0.992.6 ± 1.102.3 ± 1.122.3 ± 1.110.07
Dietary recall, mean ± SD (n = 167)
  Total energy (kcal)1699.9 ± 764.31480.1 ± 708.7 31839.4 ± 767.21676.9 ± 732.10.14
  Total fat (g)68.5 ± 35.461.2 ± 37.3 68.5 ± 37.966.2 ± 31.60.38
  Total added sugar (g)17.5 ± 16.813.5 ± 13.4 325.0 ± 20.015.5 ± 14.2 30.79
  Total fruits (cup eq.)0.5 ± 1.00.4 ± 0.60.4 ± 0.80.5 ± 0.80.14
  Total vegetables (cup eq.)1.3 ± 1.01.3 ± 1.21.2 ± 1.01.3 ± 0.90.88
Health Outcomes
BMI (kg/m2), n (%) 0.90
  Underweight1 (1.1)1 (1.3)0 (0.0)0 (0.0)
  Healthy weight20 (21.7)18 (24.3)20 (23.5)16 (24.6)
  Overweight21 (22.8)17 (23.0)20 (23.5)14 (21.5)
  Obese50 (54.4)38 (51.4)45 (53.0)35 (53.8)
Systolic blood pressure, mean ± SD (n = 152)126.5 ± 16.6123.6 ± 18.6120.7 ± 14.4122.3 ± 14.60.14
Health status, n (%) 0.69
  Excellent4 (4.5)3 (3.6)5 (6.8)6 (8.5)
  Very good30 (34.1)24 (28.9)24 (32.9)21 (29.6)
  Good40 (45.5)43 (51.8)32 (43.8)31 (43.7)
  Fair12 (13.6)11 (13.3)11 (15.1)10 (14.1)
  Poor2 (2.3)2 (2.3)1 (1.4)1 (1.4)
Food Insecurity
Household food security, n (%) 0.63 2
  High46 (49.5)54 (58.1)36 (46.8)48 (62.3)
  Marginal19 (20.4)21 (22.6)12 (15.6)12 (15.6)
  Low23 (24.7)17 (18.3)27 (35.1)18 (23.4)
  Very low6 (6.5)2 (2.2)5 (6.5)2 (2.6)
1 Analysis of covariance (continuous variables) or Cochran–Mantel–Haenszel chi-squared test (categorical variables) evaluating differences in post-intervention values between intervention and control groups, controlling for pre-intervention values for respective outcome variable (unadjusted for other covariates). 2 Comparison between follow-up groups was significant; baseline values were not significantly different.
Publisher’s Note: MDPI stays neutral with regard to jurisdictional claims in published maps and institutional affiliations.

