Dietary Glycemic Load and Plasma Amyloid-β Biomarkers of Alzheimer’s Disease

 , ,
, ,  ,
,  , and
, and
Abstract
:1. Introduction
2. Materials and Methods
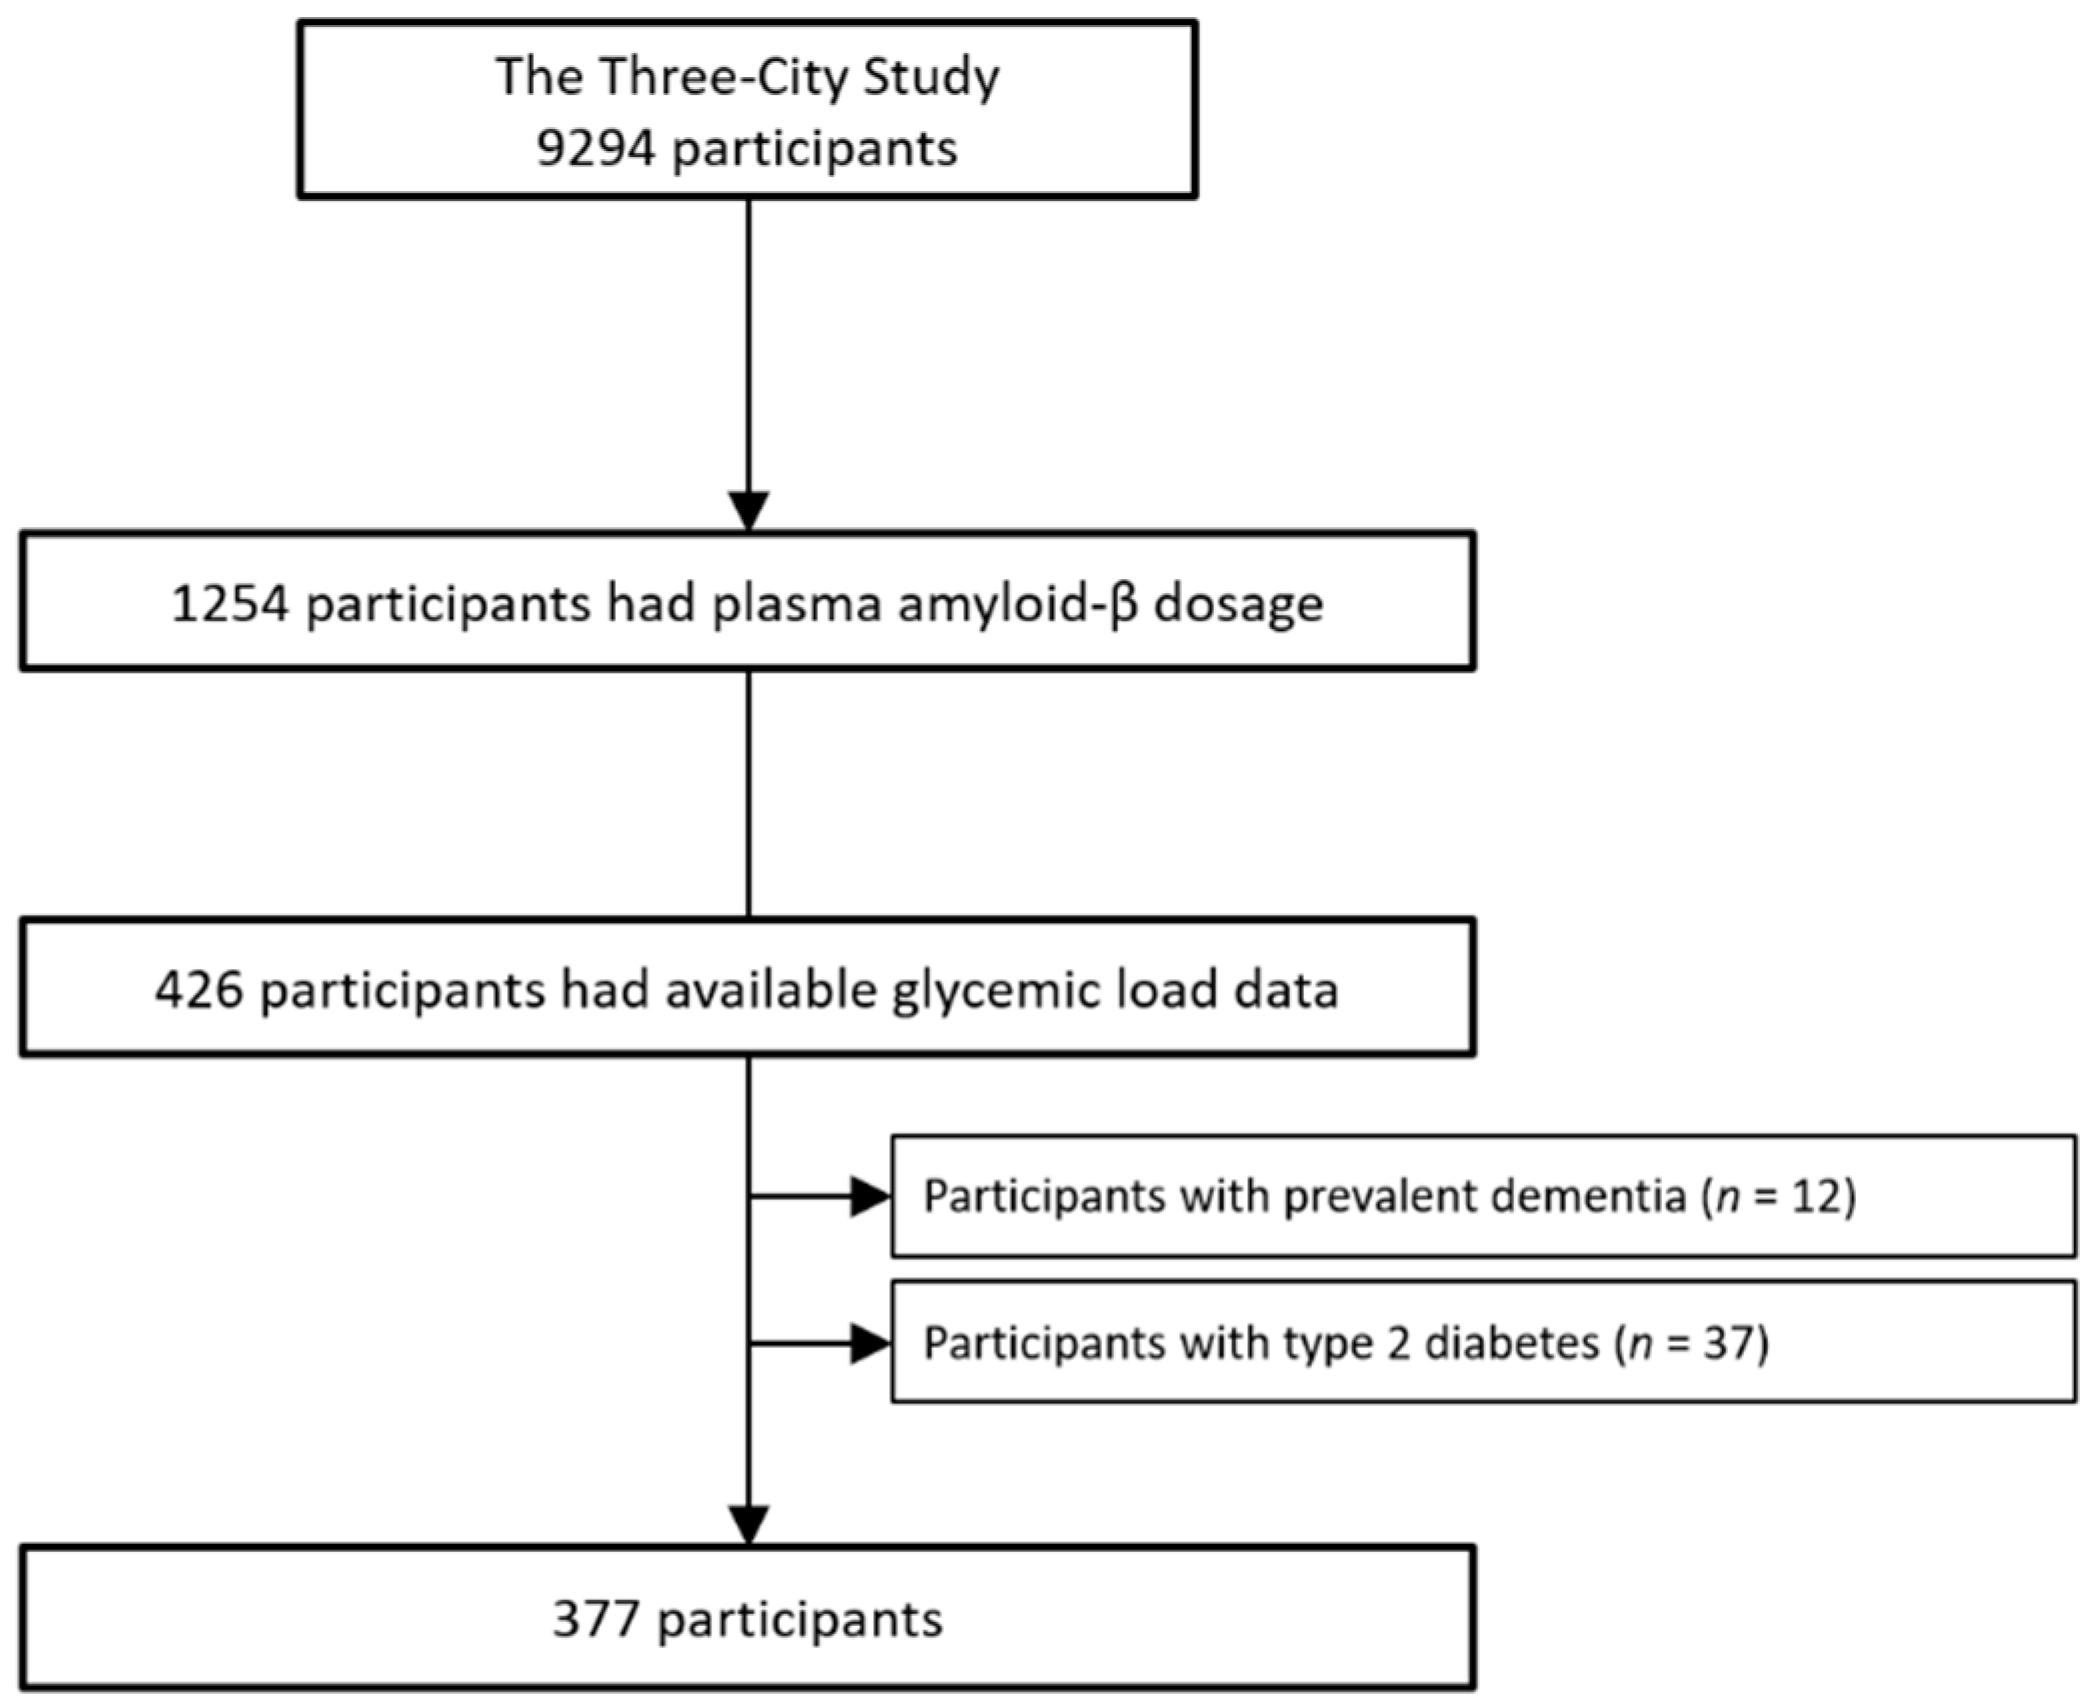
2.1. Study Sample
2.2. Dietary Data
2.3. Plasma Amyloid-β Peptide Assessment
2.4. Incident Dementia Diagnosis
2.5. Other Covariates
2.6. Statistical Analyses
3. Results
4. Discussion
5. Conclusions
Supplementary Materials
Author Contributions
Funding
Institutional Review Board Statement
Informed Consent Statement
Data Availability Statement
Acknowledgments
Conflicts of Interest
References
- World Health Organization Dementia. Available online: https://www.who.int/news-room/fact-sheets/detail/dementia (accessed on 11 June 2019).
- Livingston, G.; Sommerlad, A.; Orgeta, V.; Costafreda, S.G.; Huntley, J.; Ames, D.; Ballard, C.; Banerjee, S.; Burns, A.; Cohen-Mansfield, J.; et al. Dementia Prevention, Intervention, and Care. Lancet 2017, 390, 2673–2734. [Google Scholar] [CrossRef] [Green Version]
- Scarmeas, N.; Anastasiou, C.A.; Yannakoulia, M. Nutrition and Prevention of Cognitive Impairment. Lancet Neurol. 2018, 17, 1006–1015. [Google Scholar] [CrossRef]
- Carvalho, C.; Cardoso, S.; Correia, S.C.; Santos, R.X.; Santos, M.S.; Baldeiras, I.; Oliveira, C.R.; Moreira, P.I. Metabolic Alterations Induced by Sucrose Intake and Alzheimer’s Disease Promote Similar Brain Mitochondrial Abnormalities. Diabetes 2012, 61, 1234–1242. [Google Scholar] [CrossRef] [PubMed] [Green Version]
- Yeh, S.H.-H.; Shie, F.-S.; Liu, H.-K.; Yao, H.-H.; Kao, P.-C.; Lee, Y.-H.; Chen, L.-M.; Hsu, S.-M.; Chao, L.-J.; Wu, K.-W.; et al. A High-Sucrose Diet Aggravates Alzheimer’s Disease Pathology, Attenuates Hypothalamic Leptin Signaling, and Impairs Food-Anticipatory Activity in APPswe/PS1dE9 Mice. Neurobiol. Aging 2020, 90, 60–74. [Google Scholar] [CrossRef]
- Hanson, A.J.; Bayer, J.L.; Baker, L.D.; Cholerton, B.; VanFossen, B.; Trittschuh, E.; Rissman, R.A.; Donohue, M.C.; Moghadam, S.H.; Plymate, S.R.; et al. Differential Effects of Meal Challenges on Cognition, Metabolism, and Biomarkers for Apolipoprotein E Ɛ4 Carriers and Adults with Mild Cognitive Impairment. J. Alzheimers Dis. 2015, 48, 205–218. [Google Scholar] [CrossRef]
- DeMattos, R.B.; Bales, K.R.; Cummins, D.J.; Paul, S.M.; Holtzman, D.M. Brain to Plasma Amyloid-Beta Efflux: A Measure of Brain Amyloid Burden in a Mouse Model of Alzheimer’s Disease. Science 2002, 295, 2264–2267. [Google Scholar] [CrossRef]
- van Oijen, M.; Hofman, A.; Soares, H.D.; Koudstaal, P.J.; Breteler, M.M.B. Plasma Aβ1-40 and Aβ1-42 and the Risk of Dementia: A Prospective Case-Cohort Study. Lancet Neurol. 2006, 5, 655–660. [Google Scholar] [CrossRef]
- Lambert, J.-C.; Schraen-Maschke, S.; Richard, F.; Fievet, N.; Rouaud, O.; Berr, C.; Dartigues, J.-F.; Tzourio, C.; Alpérovitch, A.; Buée, L.; et al. Association of Plasma Amyloid Beta with Risk of Dementia: The Prospective Three-City Study. Neurology 2009, 73, 847–853. [Google Scholar] [CrossRef]
- Gentreau, M.; Chuy, V.; Féart, C.; Samieri, C.; Ritchie, K.; Raymond, M.; Berticat, C.; Artero, S. Refined Carbohydrate-Rich Diet Is Associated with Long-Term Risk of Dementia and Alzheimer’s Disease in Apolipoprotein E Ε4 Allele Carriers. Alzheimers Dement. 2020, 16, 1043–1053. [Google Scholar] [CrossRef]
- Hanson, A.J.; Bayer-Carter, J.L.; Green, P.S.; Montine, T.J.; Wilkinson, C.W.; Baker, L.D.; Watson, G.S.; Bonner, L.M.; Callaghan, M.; Leverenz, J.B.; et al. Effect of Apolipoprotein E Genotype and Diet on Apolipoprotein E Lipidation and Amyloid Peptides. JAMA Neurol. 2013, 70, 972–980. [Google Scholar] [CrossRef] [Green Version]
- Bellisle, F.; Dalix, A.M.; Mennen, L.; Galan, P.; Hercberg, S.; de Castro, J.M.; Gausseres, N. Contribution of Snacks and Meals in the Diet of French Adults: A Diet-Diary Study. Physiol. Behav. 2003, 79, 183–189. [Google Scholar] [CrossRef]
- 3C Study Group Vascular Factors and Risk of Dementia: Design of the Three-City Study and Baseline Characteristics of the Study Population. Neuroepidemiology 2003, 22, 316–325. [CrossRef] [PubMed]
- Salmerón, J.; Manson, J.E.; Stampfer, M.J.; Colditz, G.A.; Wing, A.L.; Willett, W.C. Dietary Fiber, Glycemic Load, and Risk of Non-Insulin-Dependent Diabetes Mellitus in Women. JAMA 1997, 277, 472–477. [Google Scholar] [CrossRef] [PubMed]
- Monro, J.A.; Shaw, M. Glycemic Impact, Glycemic Glucose Equivalents, Glycemic Index, and Glycemic Load: Definitions, Distinctions, and Implications. Am. J. Clin. Nutr. 2008, 87, 237S–243S. [Google Scholar] [CrossRef] [Green Version]
- Atkinson, F.S.; Foster-Powell, K.; Brand-Miller, J.C. International Tables of Glycemic Index and Glycemic Load Values: 2008. Diabetes Care 2008, 31, 2281–2283. [Google Scholar] [CrossRef] [Green Version]
- Carneiro, L.; Leloup, C. Mens Sana in Corpore Sano: Does the Glycemic Index Have a Role to Play? Nutrients 2020, 12, 2989. [Google Scholar] [CrossRef]
- Berticat, C.; Durand, V.; Raymond, M. Refined Carbohydrate Consumption and Facial Attractiveness. Evol. Psychol. 2020, 18, 1474704920960440. [Google Scholar] [CrossRef]
- Wagner, M.; Dartigues, J.-F.; Samieri, C.; Proust-Lima, C. Modeling Risk-Factor Trajectories When Measurement Tools Change Sequentially During Follow-up in Cohort Studies: Application to Dietary Habits in Prodromal Dementia. Am. J. Epidemiol. 2018, 187, 845–854. [Google Scholar] [CrossRef]
- Hill, E.; Goodwill, A.M.; Gorelik, A.; Szoeke, C. Diet and Biomarkers of Alzheimer’s Disease: A Systematic Review and Meta-Analysis. Neurobiol. Aging 2019, 76, 45–52. [Google Scholar] [CrossRef]
- Post, R.E.; Mainous, A.G.; King, D.E.; Simpson, K.N. Dietary Fiber for the Treatment of Type 2 Diabetes Mellitus: A Meta-Analysis. J. Am. Board Fam. Med. 2012, 25, 16–23. [Google Scholar] [CrossRef] [Green Version]
- Hätönen, K.A.; Virtamo, J.; Eriksson, J.G.; Sinkko, H.K.; Sundvall, J.E.; Valsta, L.M. Protein and Fat Modify the Glycaemic and Insulinaemic Responses to a Mashed Potato-Based Meal. Br. J. Nutr. 2011, 106, 248–253. [Google Scholar] [CrossRef] [PubMed] [Green Version]
- American Psychiatric Association. Diagnostic and Statistical Manual of Mental Disorders, 4th ed.; Text Revision (DSM-IV-TR); American Psychiatric Association: Washington, DC, USA, 2000; ISBN 978-0-89042-062-1. [Google Scholar]
- Dufouil, C.; Richard, F.; Fiévet, N.; Dartigues, J.F.; Ritchie, K.; Tzourio, C.; Amouyel, P.; Alpérovitch, A. APOE Genotype, Cholesterol Level, Lipid-Lowering Treatment, and Dementia: The Three-City Study. Neurology 2005, 64, 1531–1538. [Google Scholar] [CrossRef] [PubMed]
- Stengel, B.; Metzger, M.; Froissart, M.; Rainfray, M.; Berr, C.; Tzourio, C.; Helmer, C. Epidemiology and Prognostic Significance of Chronic Kidney Disease in the Elderly—The Three-City Prospective Cohort Study. Nephrol. Dial. Transplant 2011, 26, 3286–3295. [Google Scholar] [CrossRef] [PubMed] [Green Version]
- Toledo, J.B.; Vanderstichele, H.; Figurski, M.; Aisen, P.S.; Petersen, R.C.; Weiner, M.W.; Jack, C.R.; Jagust, W.; Decarli, C.; Toga, A.W.; et al. Factors Affecting Aβ Plasma Levels and Their Utility as Biomarkers in ADNI. Acta Neuropathol. 2011, 122, 401–413. [Google Scholar] [CrossRef] [Green Version]
- Wang, C.; Shou, Y.; Pan, J.; Du, Y.; Liu, C.; Wang, H. The Relationship between Cholesterol Level and Alzheimer’s Disease-Associated APP Proteolysis/Aβ Metabolism. Nutr. Neurosci. 2019, 22, 453–463. [Google Scholar] [CrossRef] [PubMed]
- Montgomery, D.C.; Peck, E.A.; Vining, G.G. Introduction to Linear Regression Analysis; John Wiley & Sons: Hoboken, NJ, USA, 2012; ISBN 978-0-470-54281-1. [Google Scholar]
- Willett, W.C.; Howe, G.R.; Kushi, L.H. Adjustment for Total Energy Intake in Epidemiologic Studies. Am. J. Clin. Nutr. 1997, 65, 1220S–1228S. [Google Scholar] [CrossRef] [PubMed]
- Fox, J. Applied Regression Analysis and Generalized Linear Models, 3rd ed.; SAGE: Singapore, 2016; ISBN 978-1-4833-1088-6. [Google Scholar]
- Bayer-Carter, J.L.; Green, P.S.; Montine, T.J.; VanFossen, B.; Baker, L.D.; Watson, G.S.; Bonner, L.M.; Callaghan, M.; Leverenz, J.B.; Walter, B.K.; et al. Diet Intervention and Cerebrospinal Fluid Biomarkers in Amnestic Mild Cognitive Impairment. Arch. Neurol. 2011, 68, 743–752. [Google Scholar] [CrossRef] [Green Version]
- Taylor, M.K.; Sullivan, D.K.; Swerdlow, R.H.; Vidoni, E.D.; Morris, J.K.; Mahnken, J.D.; Burns, J.M. A High-Glycemic Diet Is Associated with Cerebral Amyloid Burden in Cognitively Normal Older Adults. Am. J. Clin. Nutr. 2017, 106, 1463–1470. [Google Scholar] [CrossRef]
- Siri-Tarino, P.W.; Sun, Q.; Hu, F.B.; Krauss, R.M. Saturated Fat, Carbohydrate, and Cardiovascular Disease. Am. J. Clin. Nutr. 2010, 91, 502–509. [Google Scholar] [CrossRef] [Green Version]
- Clifton, P. Metabolic Syndrome—Role of Dietary Fat Type and Quantity. Nutrients 2019, 11, 1438. [Google Scholar] [CrossRef] [Green Version]
- Seidelmann, S.B.; Claggett, B.; Cheng, S.; Henglin, M.; Shah, A.; Steffen, L.M.; Folsom, A.R.; Rimm, E.B.; Willett, W.C.; Solomon, S.D. Dietary Carbohydrate Intake and Mortality: A Prospective Cohort Study and Meta-Analysis. Lancet Public Health 2018, 3, e419–e428. [Google Scholar] [CrossRef] [Green Version]
- Butterfield, D.A.; Di Domenico, F.; Barone, E. Elevated Risk of Type 2 Diabetes for Development of Alzheimer Disease: A Key Role for Oxidative Stress in Brain. Biochim. Biophys. Acta 2014, 1842, 1693–1706. [Google Scholar] [CrossRef] [PubMed] [Green Version]
- Nolan, C.J.; Ruderman, N.B.; Kahn, S.E.; Pedersen, O.; Prentki, M. Insulin Resistance as a Physiological Defense against Metabolic Stress: Implications for the Management of Subsets of Type 2 Diabetes. Diabetes 2015, 64, 673–686. [Google Scholar] [CrossRef] [PubMed] [Green Version]
- Rhea, E.M.; Banks, W.A. Role of the Blood-Brain Barrier in Central Nervous System Insulin Resistance. Front. Neurosci. 2019, 13, 521. [Google Scholar] [CrossRef] [Green Version]
- Farris, W.; Mansourian, S.; Chang, Y.; Lindsley, L.; Eckman, E.A.; Frosch, M.P.; Eckman, C.B.; Tanzi, R.E.; Selkoe, D.J.; Guenette, S. Insulin-Degrading Enzyme Regulates the Levels of Insulin, Amyloid Beta-Protein, and the Beta-Amyloid Precursor Protein Intracellular Domain in Vivo. Proc. Natl. Acad. Sci. USA 2003, 100, 4162–4167. [Google Scholar] [CrossRef] [Green Version]
- Kulstad, J.J.; Green, P.S.; Cook, D.G.; Watson, G.S.; Reger, M.A.; Baker, L.D.; Plymate, S.R.; Asthana, S.; Rhoads, K.; Mehta, P.D.; et al. Differential Modulation of Plasma β-Amyloid by Insulin in Patients with Alzheimer Disease. Neurology 2006, 66, 1506–1510. [Google Scholar] [CrossRef]
- Karczewska-Kupczewska, M.; Lelental, N.; Adamska, A.; Nikołajuk, A.; Kowalska, I.; Górska, M.; Zimmermann, R.; Kornhuber, J.; Strączkowski, M.; Lewczuk, P. The Influence of Insulin Infusion on the Metabolism of Amyloid β Peptides in Plasma. Alzheimers Dement. 2013, 9, 400–405. [Google Scholar] [CrossRef]
- Williamson, G.; Sheedy, K. Effects of Polyphenols on Insulin Resistance. Nutrients 2020, 12, 3135. [Google Scholar] [CrossRef]
- Schenk, S.; Saberi, M.; Olefsky, J.M. Insulin Sensitivity: Modulation by Nutrients and Inflammation. J. Clin. Investig. 2008, 118, 2992–3002. [Google Scholar] [CrossRef] [Green Version]
- Dorey, E.; Chang, N.; Liu, Q.Y.; Yang, Z.; Zhang, W. Apolipoprotein E, Amyloid-Beta, and Neuroinflammation in Alzheimer’s Disease. Neurosci. Bull. 2014, 30, 317–330. [Google Scholar] [CrossRef] [Green Version]
- Kok, E.; Haikonen, S.; Luoto, T.; Huhtala, H.; Goebeler, S.; Haapasalo, H.; Karhunen, P.J. Apolipoprotein E-Dependent Accumulation of Alzheimer Disease-Related Lesions Begins in Middle Age. Ann. Neurol. 2009, 65, 650–657. [Google Scholar] [CrossRef]
- Montagne, A.; Nation, D.A.; Sagare, A.P.; Barisano, G.; Sweeney, M.D.; Chakhoyan, A.; Pachicano, M.; Joe, E.; Nelson, A.R.; D’Orazio, L.M.; et al. APOE4 Leads to Blood-Brain Barrier Dysfunction Predicting Cognitive Decline. Nature 2020, 581, 71–76. [Google Scholar] [CrossRef] [PubMed]
- Nakamura, A.; Kaneko, N.; Villemagne, V.L.; Kato, T.; Doecke, J.; Doré, V.; Fowler, C.; Li, Q.-X.; Martins, R.; Rowe, C.; et al. High Performance Plasma Amyloid-β Biomarkers for Alzheimer’s Disease. Nature 2018, 554, 249–254. [Google Scholar] [CrossRef] [PubMed]
- Schindler, S.E.; Bollinger, J.G.; Ovod, V.; Mawuenyega, K.G.; Li, Y.; Gordon, B.A.; Holtzman, D.M.; Morris, J.C.; Benzinger, T.L.S.; Xiong, C.; et al. High-Precision Plasma β-Amyloid 42/40 Predicts Current and Future Brain Amyloidosis. Neurology 2019, 93, e1647–e1659. [Google Scholar] [CrossRef] [PubMed]
- García-Viñuales, S.; Sciacca, M.F.M.; Lanza, V.; Santoro, A.M.; Grasso, G.; Tundo, G.R.; Sbardella, D.; Coletta, M.; Grasso, G.; La Rosa, C.; et al. The Interplay between Lipid and Aβ Amyloid Homeostasis in Alzheimer’s Disease: Risk Factors and Therapeutic Opportunities. Chem. Phys. Lipids 2021, 236, 105072. [Google Scholar] [CrossRef] [PubMed]


| Characteristics | All Sample | Low (<−5.8) | Middle (−5.8 to 5.2) | High (≥5.2) |
|---|---|---|---|---|
| Sample size, n | 377 | 126 | 125 | 126 |
| Montpellier center, n (%) | 204 (54.1) | 71 (56.3) | 70 (56.0) | 63 (50.0) |
| Age, mean (SD), years | 76.1 (5.2) | 76.7 (5.7) | 75.5 (4.7) | 76.2 (5.0) |
| Women, n (%) | 227 (60.2) | 85 (67.5) | 73 (58.4) | 69 (54.8) |
| Education level, n (%) 1 | ||||
| No school | 104 (27.6) | 32 (25.4) | 35 (28.0) | 37 (29.7) |
| Primary school | 101 (26.8) | 37 (29.4) | 38 (30.4) | 26 (20.6) |
| High school | 88 (23.3) | 30 (23.8) | 25 (20.0) | 33 (26.2) |
| Graduated | 83 (22.0) | 27 (21.4) | 27 (21.6) | 29 (23.0) |
| APOE4 carriers, n (%) | 68 (18.0) | 22 (17.5) | 26 (20.8) | 20 (15.9) |
| Creatinine, mean (SD), mmol/L | 82.0 (18.7) | 79.7 (19.1) | 82.9 (17.6) | 83.5 (19.3) |
| Total cholesterol, mean (SD), mmol/L | 5.92 (1.0) | 5.88 (0.90) | 5.95 (0.97) | 5.91 (1.13) |
| Mediterranean-like diet, n. (%) 1 | ||||
| 0–3 | 64 (17.0) | 31 (24.6) | 18 (14.9) | 15 (11.5) |
| 4–5 | 141 (37.4) | 51 (40.5) | 51 (40.8) | 41 (31.5) |
| 6–9 | 142 (37.7) | 34 (27.0) | 47 (38.8) | 61 (46.9) |
| Missing values | 30 (7.96) | 10 (7.94) | 9 (7.20) | 11 (8.73) |
| Energy intake, mean (SD), kcal/day | 1193 (378) | 1210 (444) | 1196 (368) | 1173 (312) |
| Plasma Aβ40, mean (SD), pg/mL | 231 (81.1) | 227 (45.6) | 222 (55.0) | 245 (120) |
| Plasma Aβ42, mean (SD), pg/mL | 39.5 (13.5) | 39.1 (10.2) | 38.0 (9.92) | 41.2 (18.6) |
| Plasma Aβ42/Aβ40 ratio, mean (SD) | 0.176 (0.046) | 0.176 (0.043) | 0.178 (0.055) | 0.174 (0.04) |
| Glycemic Load Residuals | Aβ40 n = 372 | Aβ42 n = 373 | Aβ42/Aβ40 n = 374 | |||
|---|---|---|---|---|---|---|
| β (CI) | p Value | β (CI) | p Value | β (CI) | p Value | |
| Model 1 | ||||||
| Daily | 1.72 (−2.24, 5.68) | 0.394 | 0.04 (−0.73, 0.81) | 0.9222 | −0.0014 (−0.0044, 0.0016) | 0.3607 |
| Breakfast | 6.77 (−1.08, 14.6) | 0.0906 | 0.76 (−0.77, 2.29) | 0.3298 | −0.0011 (−0.0072, 0.005) | 0.72 |
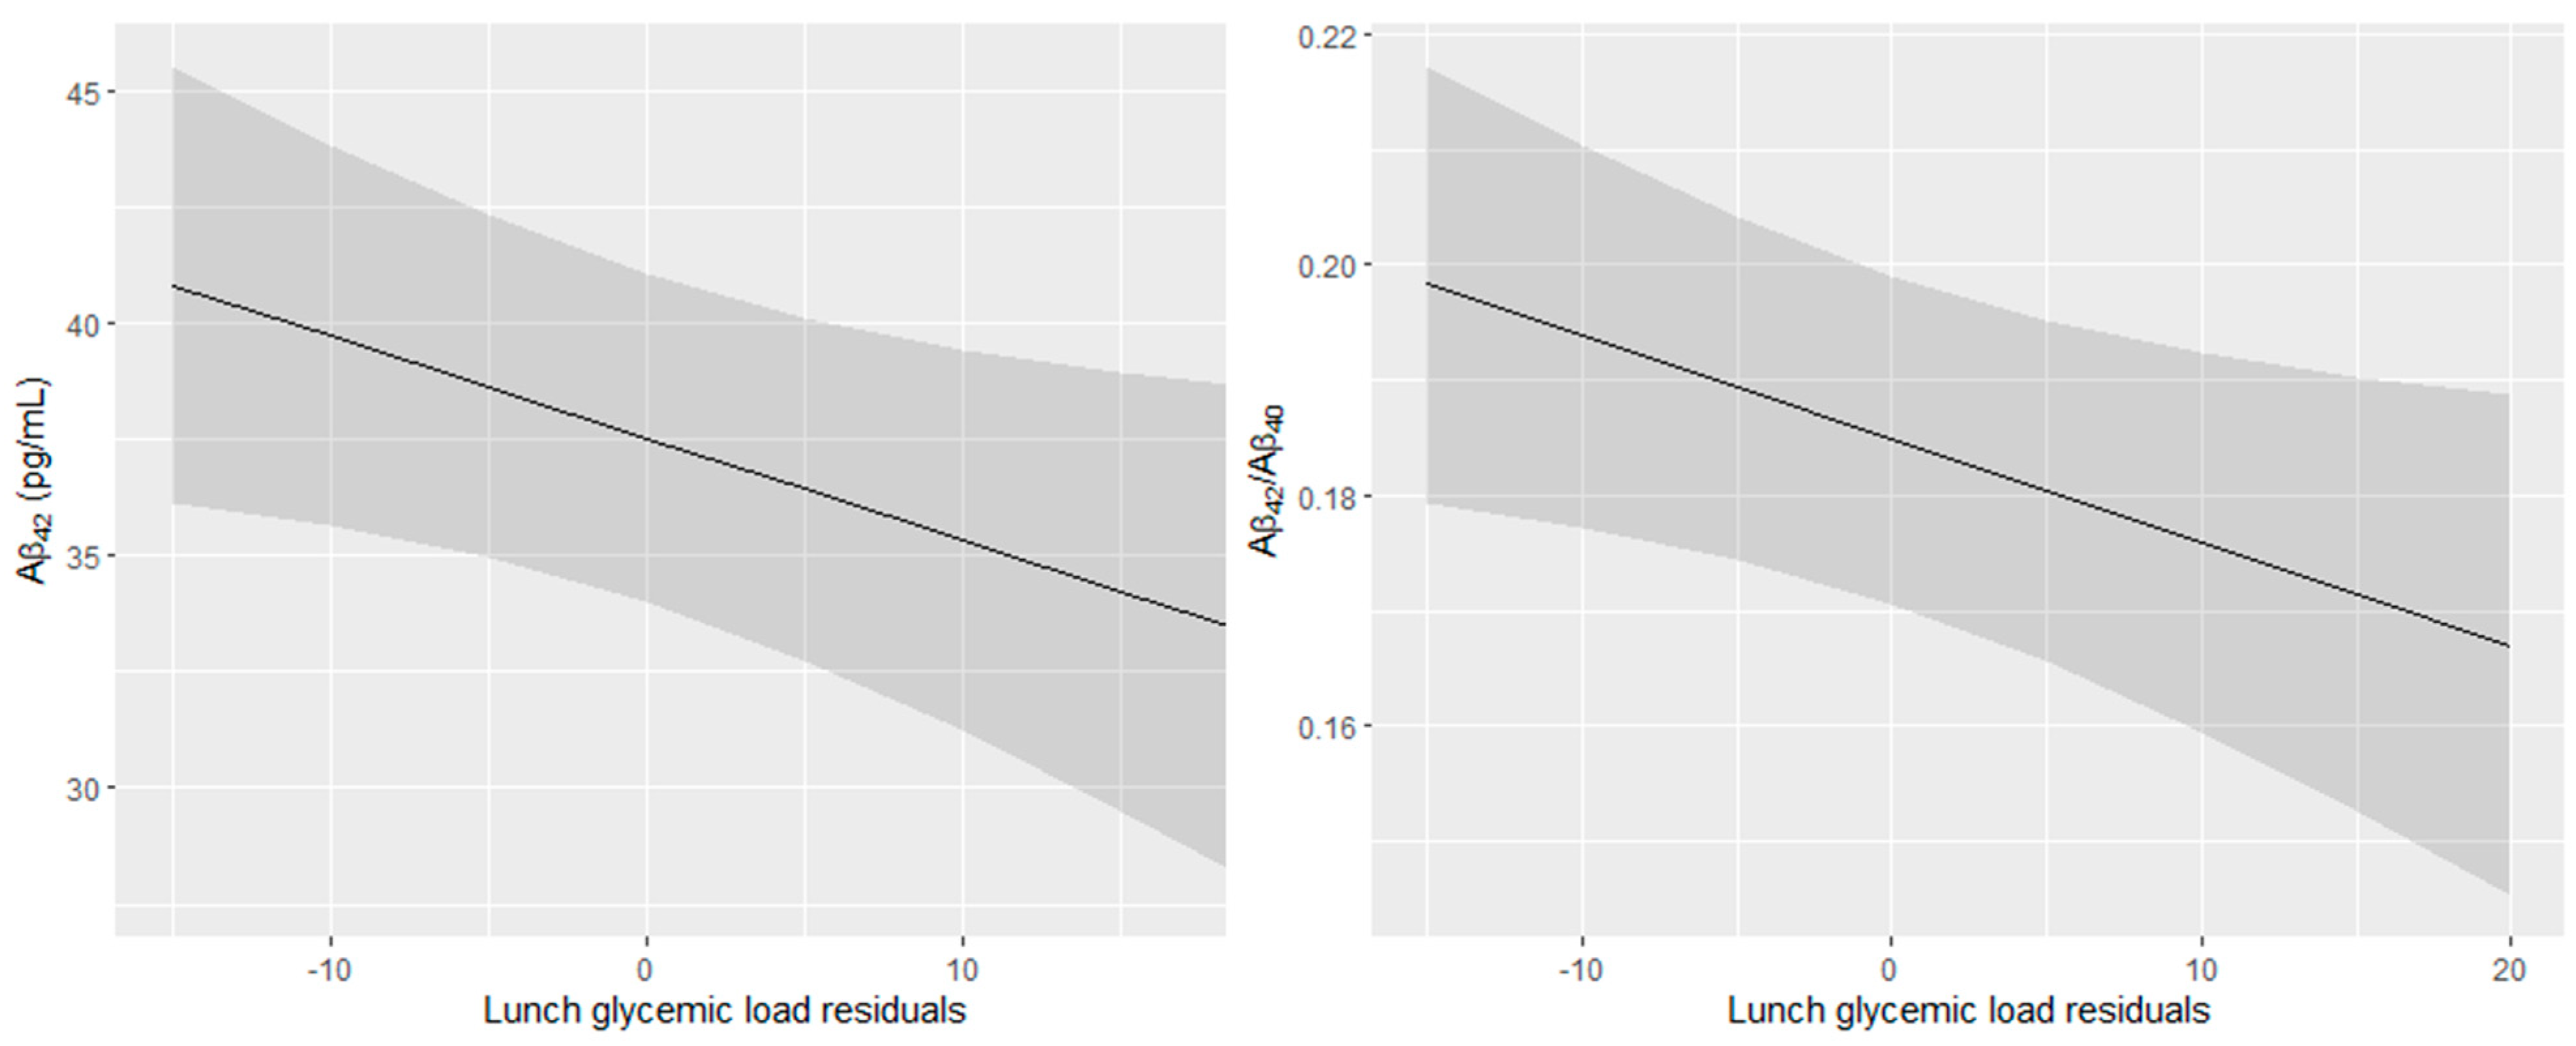
| Lunch | 2.82 (−7.89, 13.5) | 0.6047 | −1.97 (−4.04, 0.11) | 0.0631 | −0.0094 (−0.0176, −0.0012) | 0.024 |
| Afternoon snack | 3.83 (−9.83, 17.5) | 0.5815 | 0.17 (−2.5, 2.84) | 0.8993 | −0.0031 (−0.0137, 0.0076) | 0.574 |
| Dinner | 0.27 (−9.42, 9.96) | 0.9566 | 0.05 (−1.83, 1.94) | 0.9561 | −0.0025 (−0.01, 0.005) | 0.5094 |
| Model 2 | ||||||
| Daily | 0.61 (−3.39, 4.62) | 0.7632 | −0.02 (−0.80, 0.76) | 0.9648 | −0.0011 (−0.0042, 0.002) | 0.5037 |
| Breakfast | 4.79 (−3.22, 12.8) | 0.2403 | 0.7 (−0.86, 2.27) | 0.3792 | −0.0004 (−0.0067, 0.0059) | 0.9012 |
| Lunch | 0.66 (−10.0, 11.3) | 0.9026 | −2.2 (−4.27, −0.12) | 0.0378 | −0.0089 (−0.0172, −0.0007) | 0.0344 |
| Afternoon snack | 1.08 (−12.5, 14.7) | 0.8761 | −0.26 (−2.92, 2.41) | 0.8504 | −0.003 (−0.0138, 0.0078) | 0.5851 |
| Dinner | −0.53 (−10.1, 9.07) | 0.9131 | 0 (−1.87, 1.88) | 0.9971 | −0.0022 (−0.0097, 0.0053) | 0.5628 |
Publisher’s Note: MDPI stays neutral with regard to jurisdictional claims in published maps and institutional affiliations. |
© 2022 by the authors. Licensee MDPI, Basel, Switzerland. This article is an open access article distributed under the terms and conditions of the Creative Commons Attribution (CC BY) license (https://creativecommons.org/licenses/by/4.0/).
Share and Cite
Gentreau, M.; Raymond, M.; Samieri, C.; Chuy, V.; Féart, C.; Berticat, C.; Artero, S. Dietary Glycemic Load and Plasma Amyloid-β Biomarkers of Alzheimer’s Disease. Nutrients 2022, 14, 2485. https://doi.org/10.3390/nu14122485
Gentreau M, Raymond M, Samieri C, Chuy V, Féart C, Berticat C, Artero S. Dietary Glycemic Load and Plasma Amyloid-β Biomarkers of Alzheimer’s Disease. Nutrients. 2022; 14(12):2485. https://doi.org/10.3390/nu14122485
Chicago/Turabian StyleGentreau, Mélissa, Michel Raymond, Cécilia Samieri, Virginie Chuy, Catherine Féart, Claire Berticat, and Sylvaine Artero. 2022. "Dietary Glycemic Load and Plasma Amyloid-β Biomarkers of Alzheimer’s Disease" Nutrients 14, no. 12: 2485. https://doi.org/10.3390/nu14122485
APA StyleGentreau, M., Raymond, M., Samieri, C., Chuy, V., Féart, C., Berticat, C., & Artero, S. (2022). Dietary Glycemic Load and Plasma Amyloid-β Biomarkers of Alzheimer’s Disease. Nutrients, 14(12), 2485. https://doi.org/10.3390/nu14122485