
Hesperidin Bioavailability Is Increased by the Presence of 2S-Diastereoisomer and Micronization—A Randomized, Crossover and Double-Blind Clinical Trial

 , , , , , , , , ,
  ,
,
Abstract
:1. Introduction
2. Materials and Methods
2.1. Hesperidin Supplements
2.2. Participants
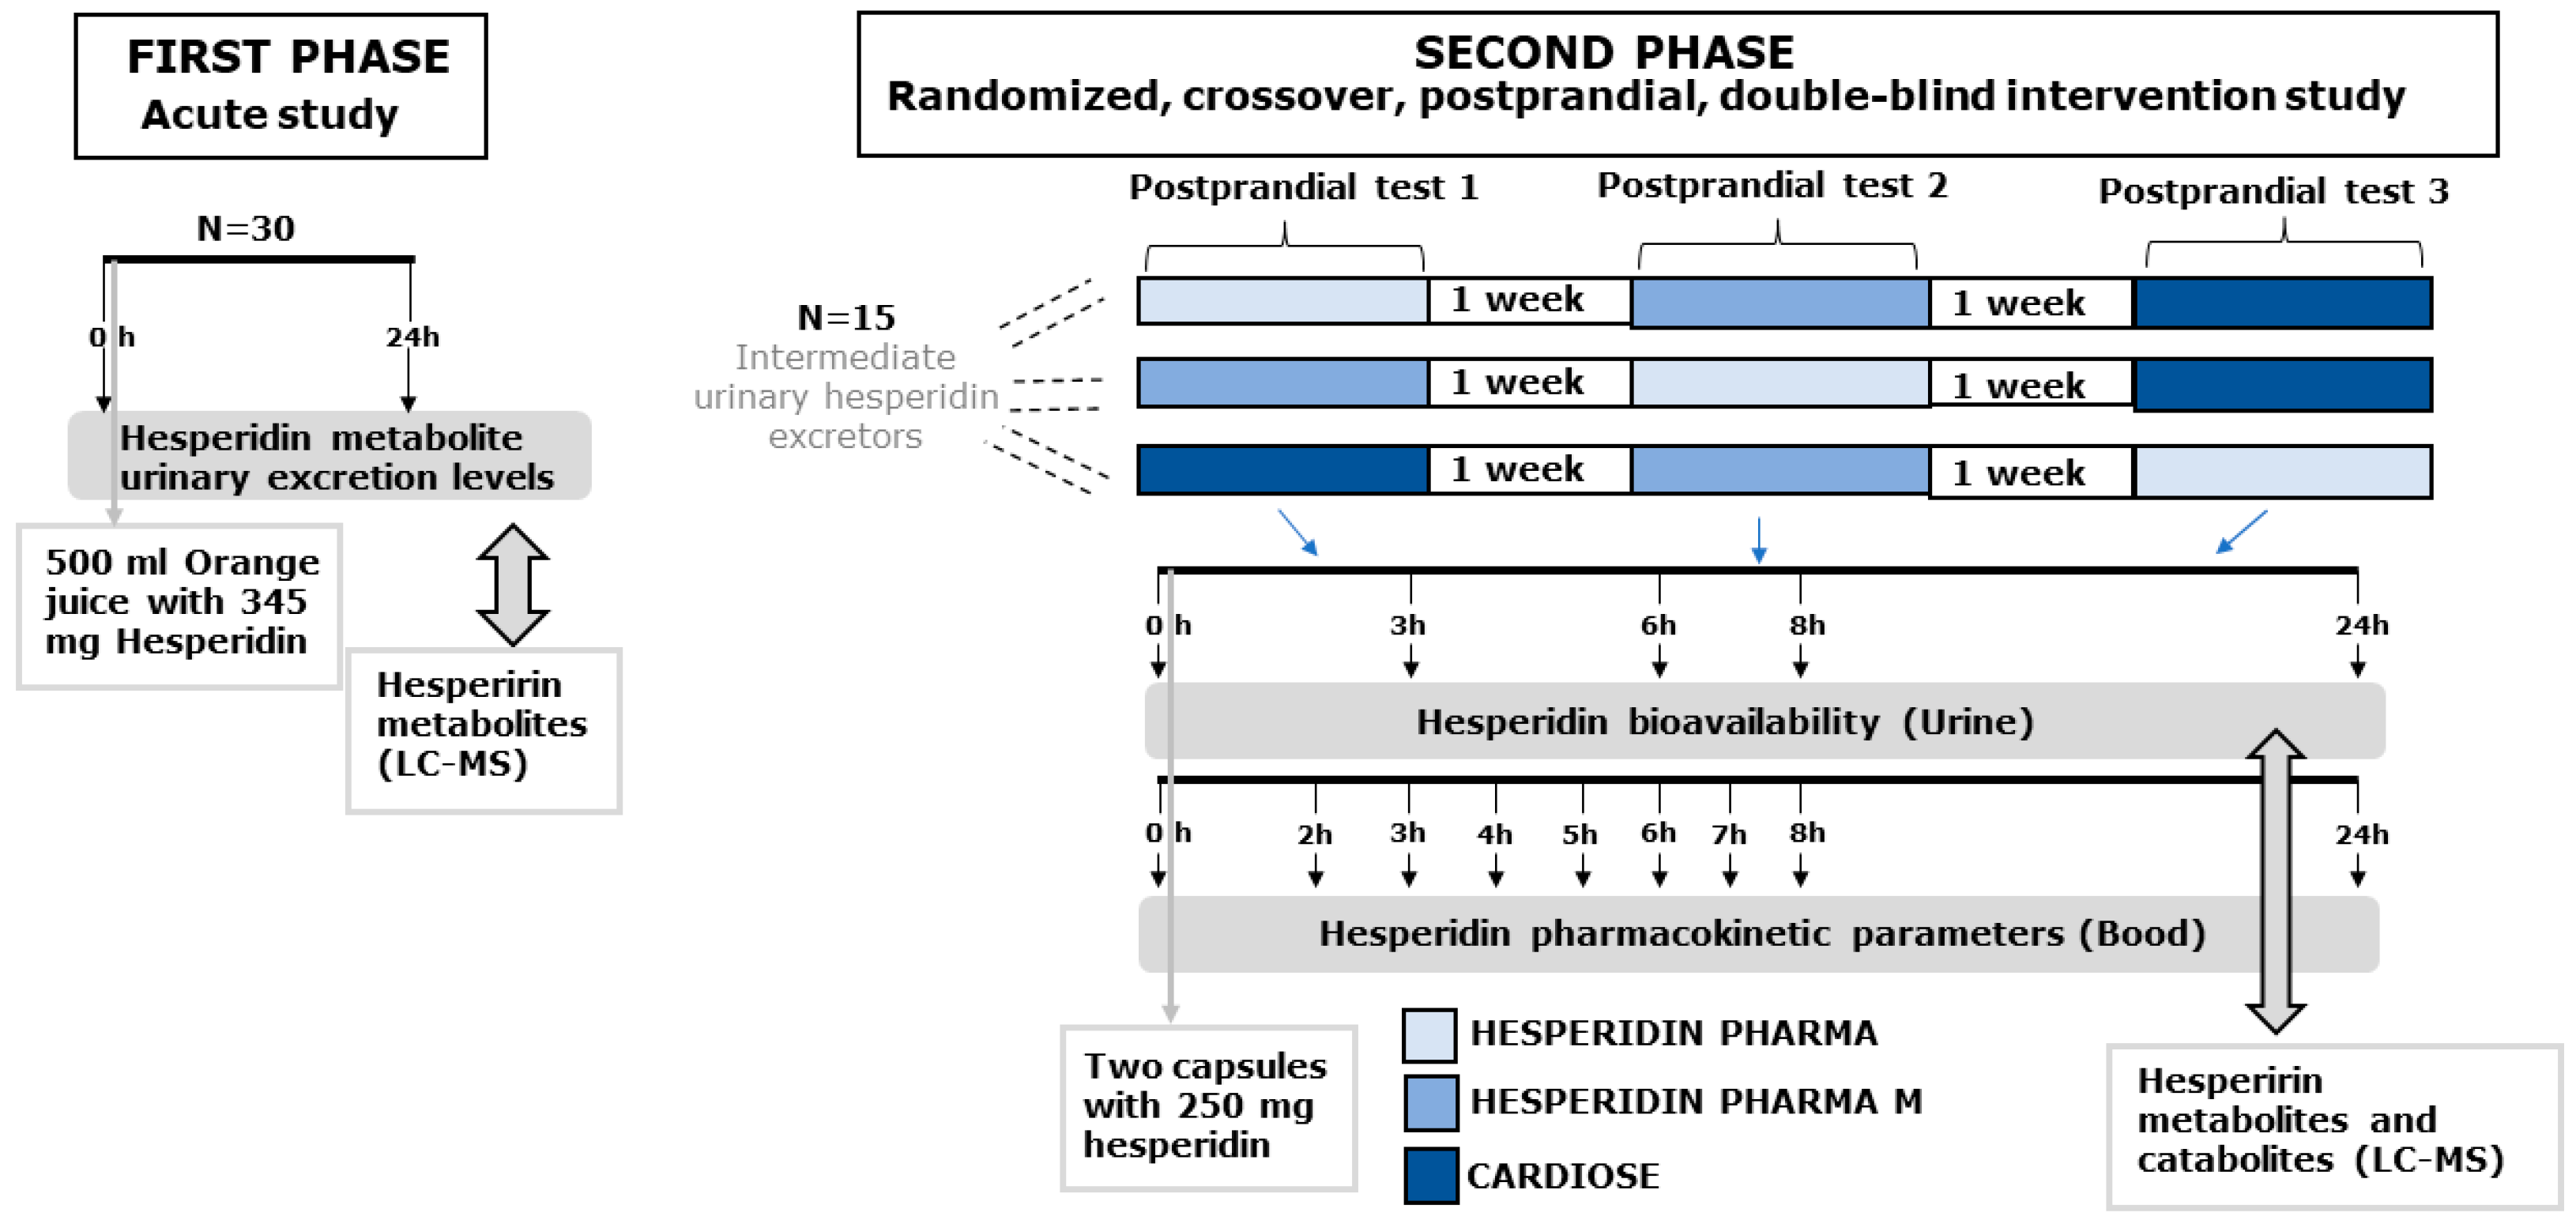
2.3. Study Design
2.4. Outcomes
2.5. Determination of Hesperidin Metabolites and Catabolites in Urine and Serum Samples
2.6. Sample Size
2.7. Statistical Analysis
3. Results
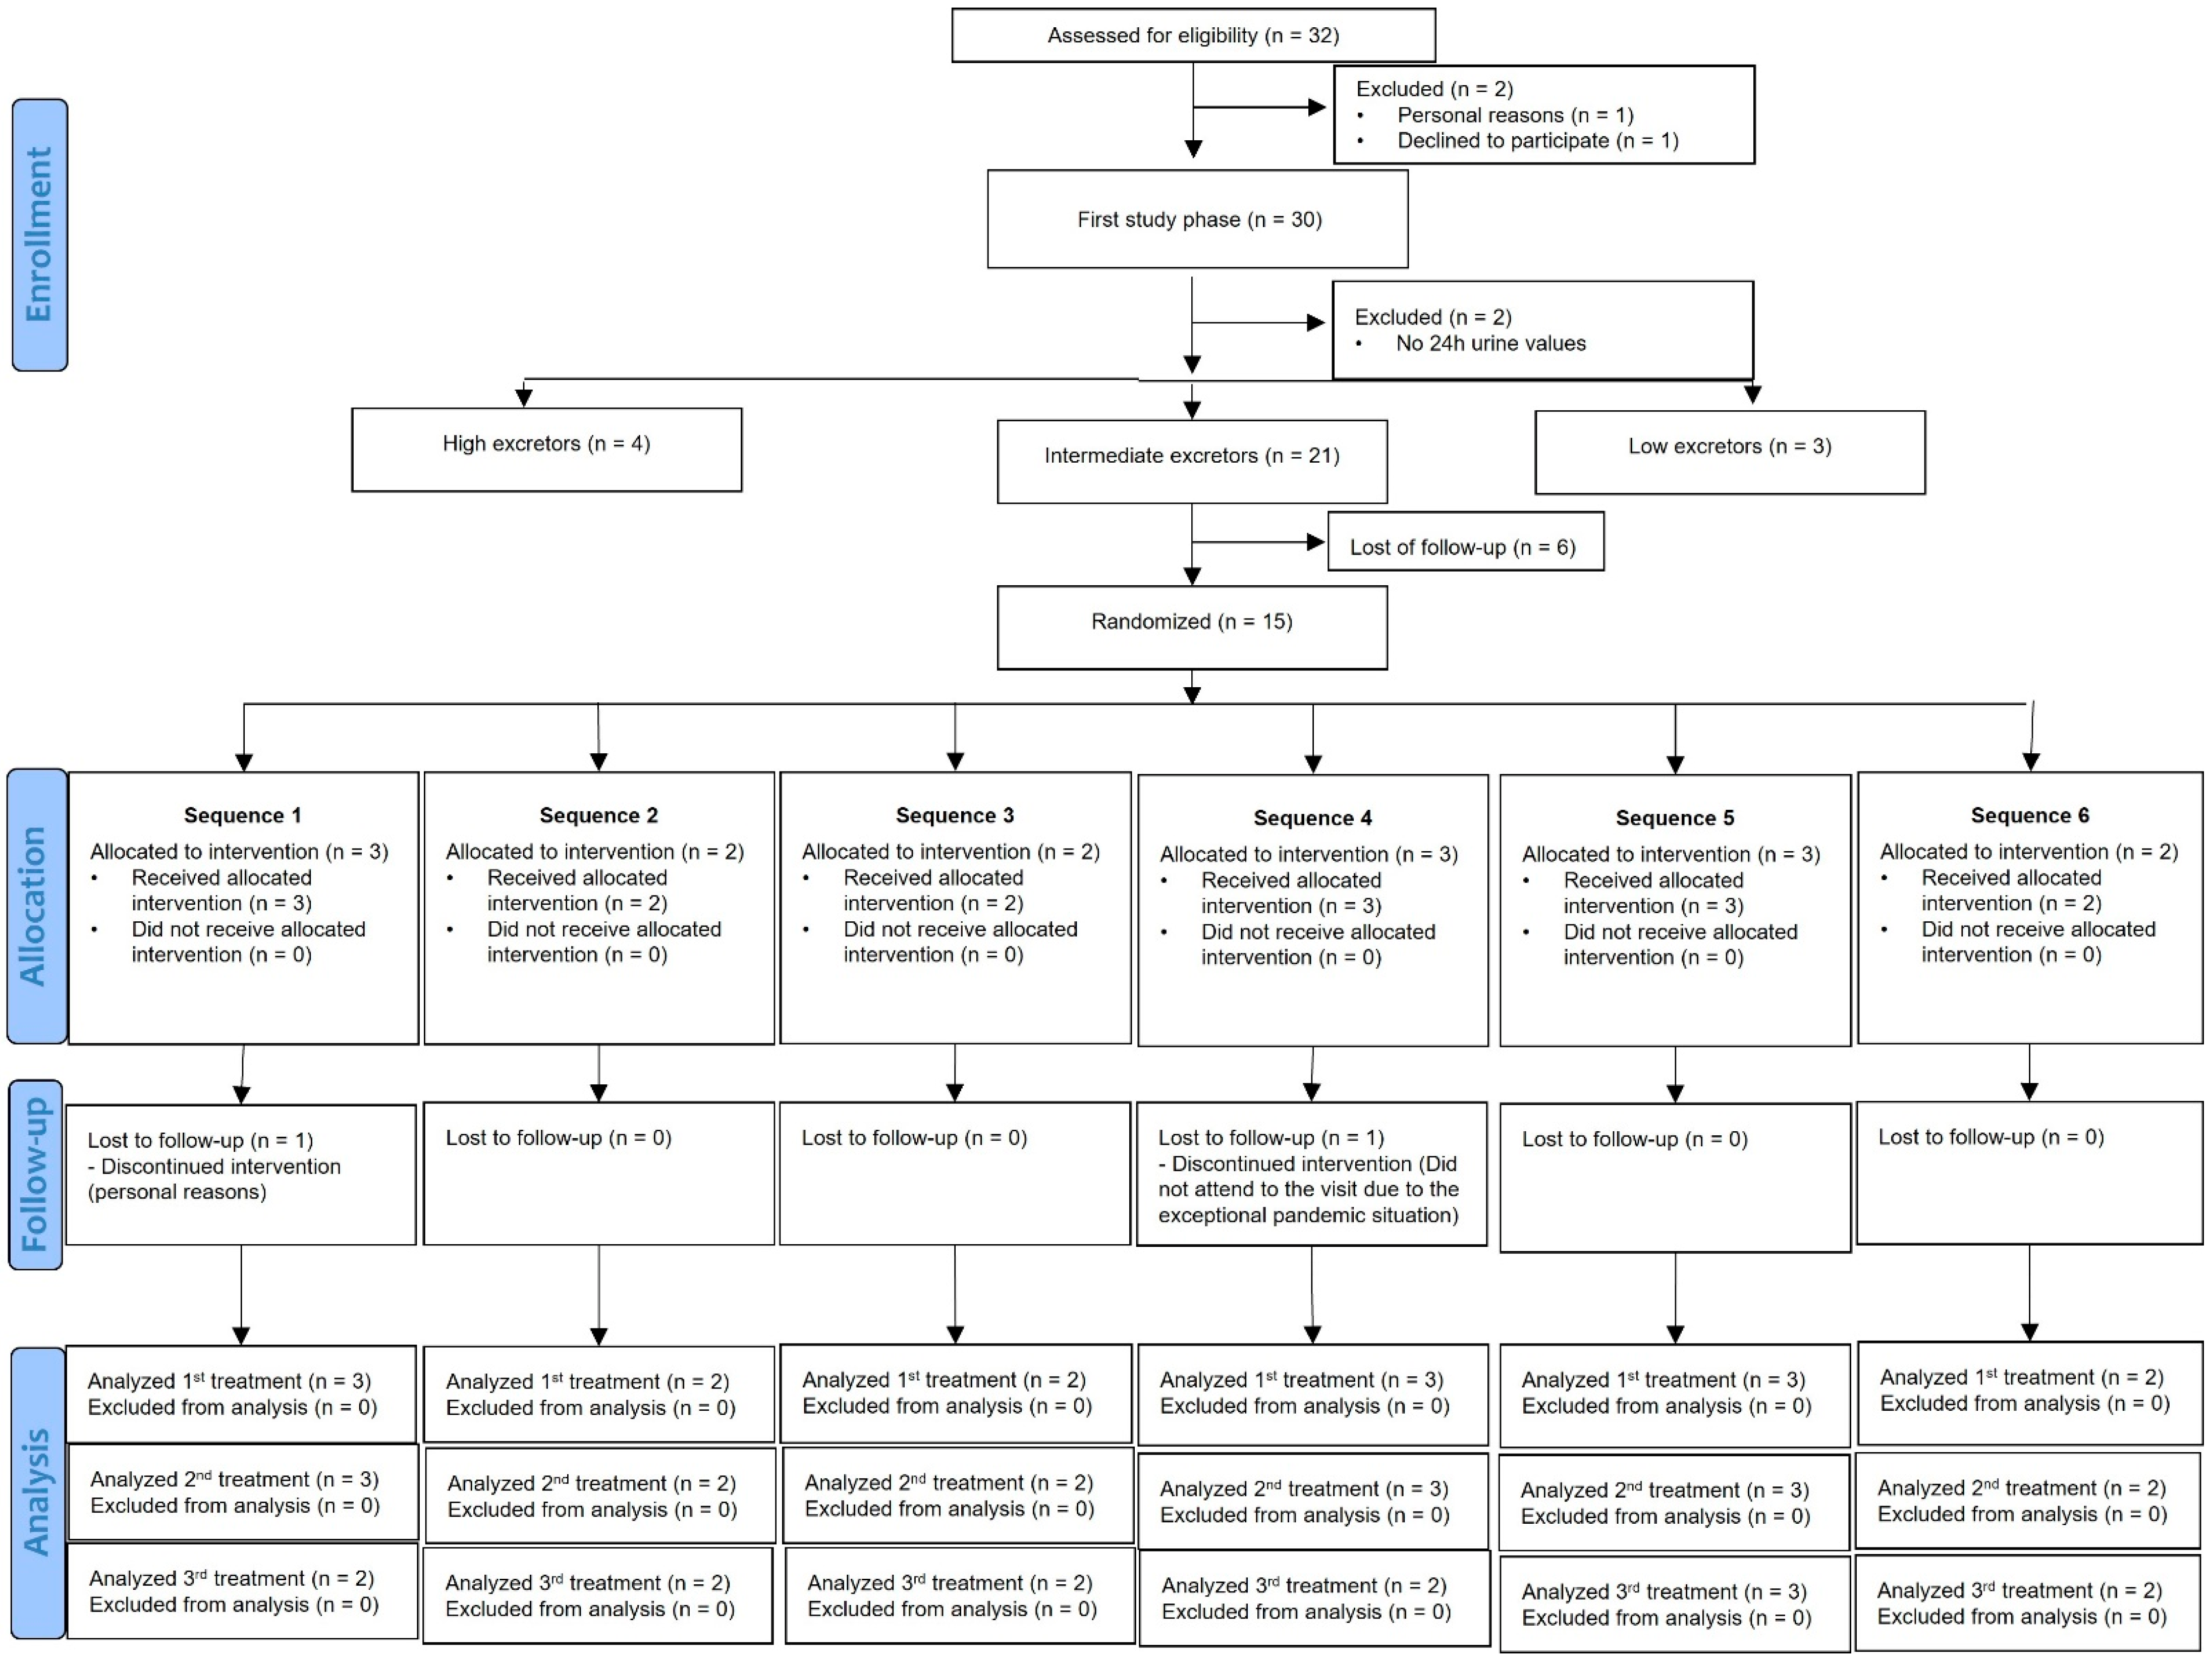
3.1. Study Population
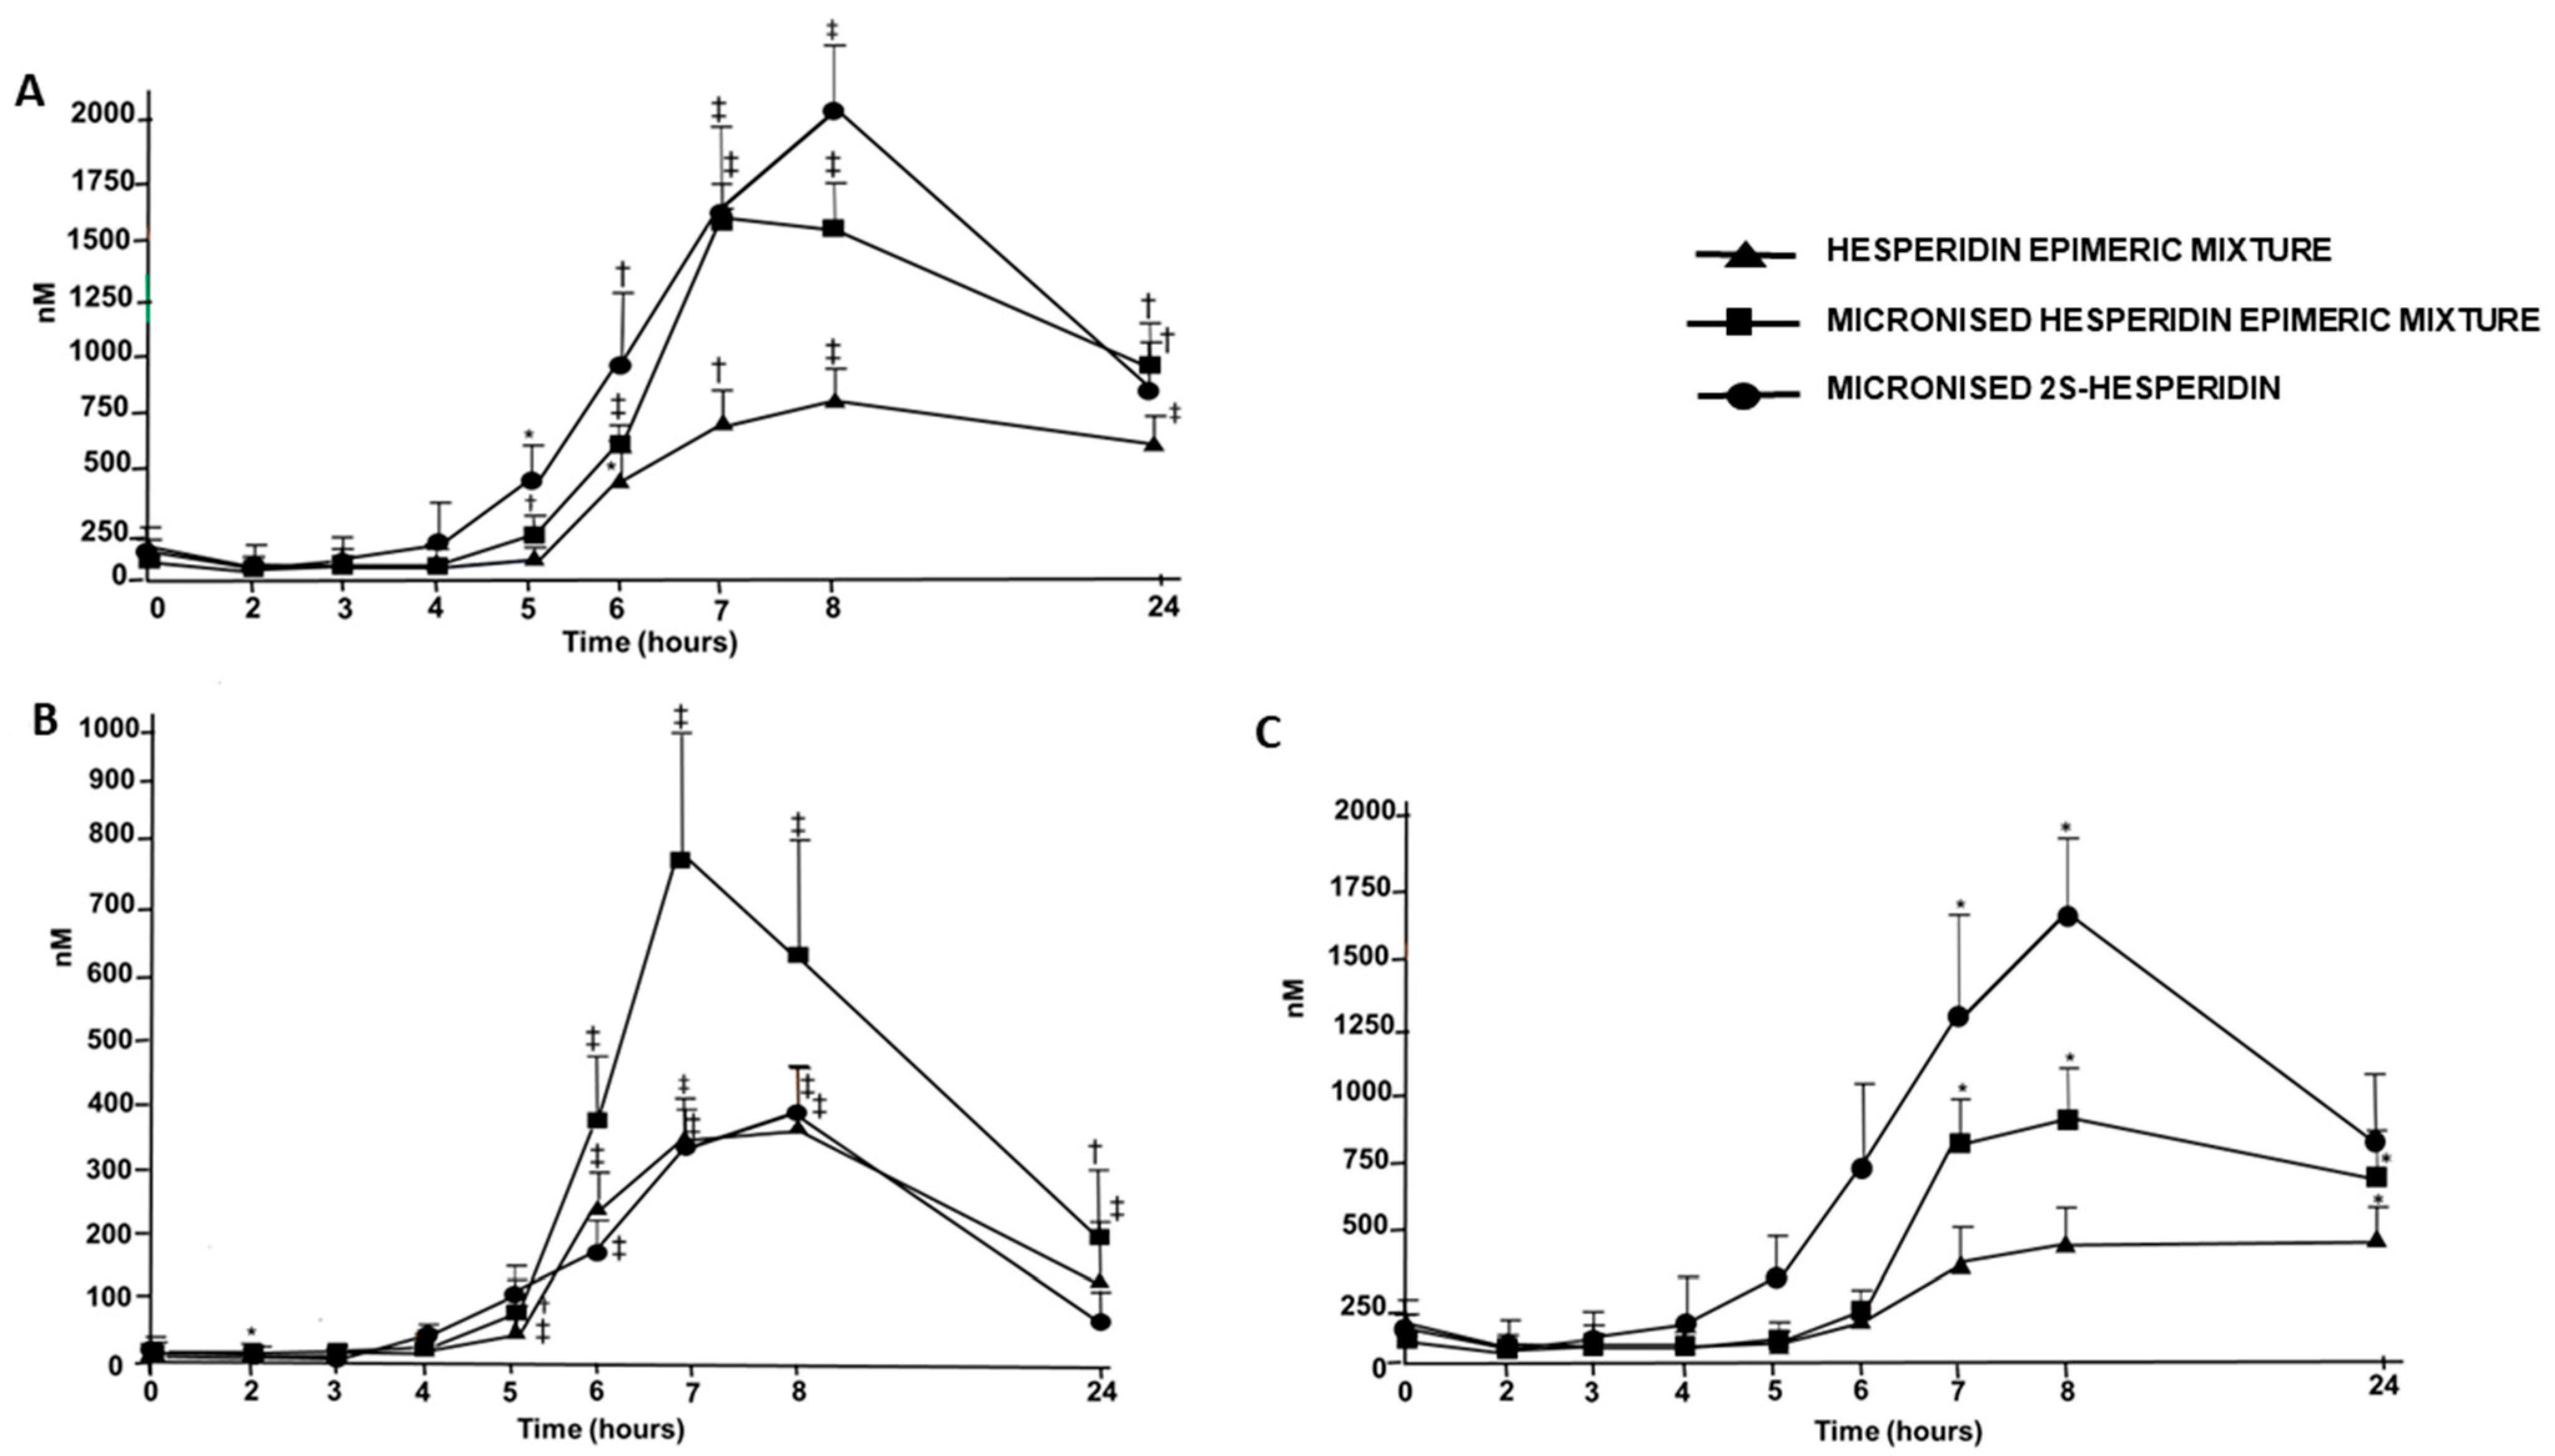
3.2. Hesperidin Bioavailability: Relative Urinary Hesperidin Excretion
3.3. AUC and Pharmacokinetic Parameters
4. Discussion
5. Conclusions
Supplementary Materials
Author Contributions
Funding
Institutional Review Board Statement
Informed Consent Statement
Data Availability Statement
Acknowledgments
Conflicts of Interest
References
- Clifford, M.N.; Toma, F.A. Flavanones, chalcones and dihydrochalcones—Nature, occurrence and dietary burden. J. Sci. Food Agric. 2000, 1080, 1073–1080. [Google Scholar]
- Li, C.; Schluesener, H. Health-promoting effects of the citrus flavanone hesperidin. Crit. Rev. Food Sci. Nutri. 2017, 57, 613–631. [Google Scholar] [CrossRef] [PubMed]
- Mayneris-Perxachs, J.; Alcaide-Hidalgo, J.M.; de la Hera, E.; del Bas, J.M.; Arola, L.; Caimari, A. Supplementation with biscuits enriched with hesperidin and naringenin is associated with an improvement of the Metabolic Syndrome induced by a cafeteria diet in rats. J. Funct. Foods 2019, 61, 103504. [Google Scholar] [CrossRef]
- Rizza, S.; Muniyappa, R.; Iantorno, M.; Kim, J.A.; Chen, H.; Pullikotil, P.; Senese, N.; Tesauro, M.; Lauro, D.; Cardillo, C.; et al. Citrus polyphenol hesperidin stimulates production of nitric oxide in endothelial cells while improving endothelial function and reducing inflammatory markers in patients with metabolic syndrome. J. Clin. Endocrinol. Metab. 2011, 96, 782–792. [Google Scholar] [CrossRef]
- Guirro, M.; Gual-Grau, A.; Gibert-Ramos, A.; Alcaide-Hidalgo, J.M.; Canela, N.; Arola, L.; Mayneris-Perxachs, J. Metabolomics elucidates dose-dependent molecular beneficial effects of hesperidin supplementation in rats fed an obesogenic diet. Antioxidants 2020, 9, 79. [Google Scholar] [CrossRef] [Green Version]
- Mas-Capdevila, A.; Teichenne, J.; Domenech-Coca, C.; Caimari, A.; Bas, J.M.D.; Escoté, X.; Crescenti, A. Effect of hesperidin on cardiovascular disease risk factors: The role of intestinal microbiota on hesperidin bioavailability. Nutrients 2020, 12, 1488. [Google Scholar] [CrossRef]
- Homayouni, F.; Haidari, F.; Hedayati, M.; Zakerkish, M.; Ahmadi, K. Blood pressure lowering and anti-inflammatory effects of hesperidin in type 2 diabetes; a randomized double-blind controlled clinical trial. Phytother. Res. 2018, 32, 1073–1079. [Google Scholar] [CrossRef]
- Morand, C.; Dubray, C.; Milenkovic, D.; Lioger, D.; Martin, J.F.; Scalbert, A.; Mazur, A. Hesperidin contributes to the vascular protective effects of orange juice: A randomized crossover study in healthy volunteers. Am. J. Clin. Nutr. 2011, 93, 73–80. [Google Scholar] [CrossRef]
- Valls, R.M.; Pedret, A.; Calderón-Pérez, L.; Llauradó, E.; Pla-Pagà, L.; Companys, J.; Moragas, A.; Martín-Luján, F.; Ortega, Y.; Giralt, M.; et al. Effects of hesperidin in orange juice on blood and pulse pressures in mildly hypertensive individuals: A randomized controlled trial (Citrus study). Eur. J. Nutr. 2021, 60, 1277–1288. [Google Scholar] [CrossRef]
- Lévèques, A.; Actis-Goretta, L.; Rein, M.J.; Williamson, G.; Dionisi, F.; Giuffrida, F. UPLC-MS/MS quantification of total hesperetin and hesperetin enantiomers in biological matrices. J. Pharm. Biomed. Anal. 2012, 57, 1–6. [Google Scholar] [CrossRef]
- Brand, W.; Shao, J.; Hoek-van den Hil, E.F.; van Elk, K.N.; Spenkelink, B.; Haan LH, J.; Rein, M.J.; Dionisi, F.; Williamson, G.; Bladeren, P.; et al. Stereoselective Conjugation, Transport and Bioactivity of S- and R-Hesperetin Enantiomers In Vitro. J. Agric. Food Chem. 2010, 58, 6119–6125. [Google Scholar] [CrossRef] [PubMed]
- Yáñez, J.A.; Remsberg, C.M.; Miranda, N.D.; Vega-Villa, K.R.; Andrews, P.K.; Davies, N.M. Pharmacokinetics of Selected Chiral Flavonoids: Hesperetin, Naringenin and Eriodictyol in Rats and their Content in Fruit Juices. Biopharm. Drug Dispos. 2008, 82, 63–82. [Google Scholar] [CrossRef] [PubMed]
- Yáñez, J.A.; Teng, X.W.; Roupe, K.A.; Davies, N.M. Stereospecific high-performance liquid chromatographic analysis of hesperetin in biological matrices. J. Pharm. Biomed. Anal. 2005, 37, 591–595. [Google Scholar] [CrossRef] [PubMed]
- Nielsen, I.L.F.; Chee, W.S.S.; Poulsen, L.; Offord-cavin, E.; Rasmussen, S.E.; Frederiksen, H.; Enslen, M.; Barron, D.; Horcajada, M.; Williamson, G. Bioavailability is improved by enzymatic modification of the citrus flavonoid hesperidin in humans: A randomized, double-blind, crossover trial. J. Nutr. 2018, 136, 404–408. [Google Scholar] [CrossRef] [Green Version]
- Borges, G.; Lean ME, J.; Roberts, S.A.; Crozier, A. Bioavailability of dietary (poly)phenols: A study with ileostomists to discriminate between absorption in small and large intestine. Food Funct. 2013, 4, 754–762. [Google Scholar] [CrossRef]
- Pereira-Caro, G.; Ludwig, I.A.; Polyviou, T.; Malkova, D.; García, A.; Moreno-Rojas, M.; Crozier, A. Identification of plasma and urinary metabolites and catabolites derived from orange juice (poly)phenols: Analysis by high performance liquid chromatopgraphy-high resolution-mass spectrometry. J. Agric. Food Chem. 2016, 64, 5724–5735. [Google Scholar] [CrossRef] [Green Version]
- Pereira, G.; Begoña, C.; Quirós, F.; Ludwig, I.A.; Pradas, I.; Crozier, A.; Manuel, J.; Rojas, M. Catabolism of citrus flavanones by the probiotics Bifidobacterium longum and Lactobacillus rhamnosus. Eur. J. Nutr. 2018, 57, 231–242. [Google Scholar] [CrossRef]
- Aschoff, J.K.; Riedl KE, N.M.; Cooperstone, J.L.; Högel, J.; Bosy-westphal, A.; Schwartz, S.J.; Carle, R.; Schweiggert, R.M. Urinary excretion of Citrus flavanones and their major catabolites after consumption of fresh oranges and pasteurized orange juice—A randomized cross-over study. Mol. Nutr. Food Res. 2016, 60, 2602–2610. [Google Scholar] [CrossRef]
- Manach, C.; Morand, C.; Gil-Izquierdo, A.; Bouteloup-Demange, C.; Rémésy, C. Bioavailability in humans of the flavanones hesperidin and narirutin after the ingestion of two doses of orange juice. Eur. J. Clin. Nutr. 2003, 57, 235–242. [Google Scholar] [CrossRef] [Green Version]
- Silveira, J.Q.; Cesar, T.B.; Manthey, J.A.; Baldwin, E.A.; Bai, J.; Raithore, S. Pharmacokinetics of flavanone glycosides after ingestion of single doses of fresh-squeezed orange juice versus commercially processed orange juice in healthy humans. J. Agric. Food Chem. 2014, 62, 12576–12584. [Google Scholar] [CrossRef]
- Vallejo, F.; Borrego, F.; Tomas-Barberán, F.A. Encapsulation and Micronization Effectively Improve Orange Beverage Flavanone Bioavailability in Humans. J. Agric. Food Chem. 2014, 62, 9458–9462. [Google Scholar]
- Moreno-rojas, M.; Garcia, A.L.; Pereira-caro, G.; Polyviou, T.; Ludwig, I.A.; Nastase, A.; Malkova, D.; Crozier, A. Bioavailability of orange juice (poly) phenols: The impact of short-term cessation of training by male endurance athletes. Am. J. Clin. Nutr. 2018, 106, 791–800. [Google Scholar]
- Tomás-Navarro, M.; Vallejo, F.; Sentandreu, E.; Navarro, J.L.; Tomás-Barberán, F.A. Volunteer stratification is more relevant than technological treatment in orange juice flavanone bioavailability. J. Agric. Food Chem. 2014, 62, 24–27. [Google Scholar] [CrossRef] [PubMed]
- Brett, G.M.; Hollands, W.; Needs, P.W.; Teucher, B.; Dainty, J.R.; Davis, B.D.; Brodbelt, J.S.; Kroon, P.A. Short Communication Absorption, metabolism and excretion of flavanones from single portions of orange fruit and juice and effects of anthropometric variables and contraceptive pill use on flavanone excretion. Br. J. Nutr. 2009, 101, 664–675. [Google Scholar] [CrossRef] [PubMed] [Green Version]
- Vallejo, F.; Larrosa, M.; Escudero, E.; Zafrilla, M.P.; Cerdá, B.; Boza, J.; García-Conesa, M.T.; Espís, J.C.; Tomás-Barberán, F.A. Concentration and Solubility of Flavanones in Orange Beverages Affect Their Bioavailability in Humans. J. Agric. Food Chem. 2010, 58, 6516–6524. [Google Scholar] [CrossRef] [PubMed]
- Actis-goretta, L.; Dew, T.P.; Lévèques, A.; Pereira-Caro, G.; Rein, M.; Teml, A.; Schäfer, C.; Hofmann, U.; Schwab, M.; Eichelbaum, M.; et al. Gastrointestinal absorption and metabolism of hesperetin-7-O-rutinoside and hesperetin-7-O-glucoside. Mol. Nutr. Food Res. 2015, 50, 1651–1662. [Google Scholar] [CrossRef]
- Pereira-caro, G.; Borges, G.; Van Der Hooft, J.; Clifford, M.N.; Del Rio, D.; Lean, M.E.J.; Roberts, S.A.; Kellerhals, M.B.; Crozier, A. Orange juice (poly) phenols are highly bioavailable in humans. Am. J. Clin. Nutr. 2014, 100, 1378–1384. [Google Scholar] [CrossRef]
- Ma, Q.; Sun, H.; Che, E.; Zheng, X.; Jiang, T.; Sun, C.; Wang, S. Uniform nano-sized valsartan for dissolution and bioavailability enhancement: Influence of particle size and crystalline state. Int. J. Pharm. 2013, 441, 75–81. [Google Scholar] [CrossRef]
- Erlund, I.; Meririnne, E.; Alfthan, G.; Aro, A. Plasma Kinetics and Urinary Excretion of the Flavanones Naringenin and Hesperetin in Humans after Ingestion of Orange Juice and Grapefruit Juice. J. Nutr. 2001, 131, 235–241. [Google Scholar] [CrossRef]
- Valls, R.M.; Llauradó, E.; Fernández-Castillejo, S.; Puiggrós, F.; Solà, R.; Arola, L.; Pedret, A. Effects of low molecular weight procyanidin rich extract from french maritime pine bark on cardiovascular disease risk factors in stage-1 hypertensive subjects: Randomized, double-blind, crossover, placebo-controlled intervention trial. Phytomedicine 2016, 23, 1451–1461. [Google Scholar] [CrossRef]
- Mullen, W.; Archeveque, M.A.; Edwards, C.A.; Matsumoto, H.; Crozier, A. Bioavailability and Metabolism of Orange Juice Flavanones in Humans: Impact of a Full-Fat Yogurt. J. Agric. Food Chem. 2008, 56, 11157–11164. [Google Scholar] [CrossRef] [PubMed]
- Kanaze, F.I.; Bounartzi, M.I.; Georgarakis, M.; Niopas, I. Pharmacokinetics of the citrus flavanone aglycones hesperetin and naringenin after single oral administration in human subjects. Eur. J. Clin. Nutr. 2007, 61, 472–477. [Google Scholar] [CrossRef] [PubMed] [Green Version]
- Ávila-gálvez, M.Á.; Giménez-bastida, J.A.; González-sarrías, A.; Espín, J.C. New insights into the metabolism of the flavanones eriocitrin and hesperidin: A comparative human pharmacokinetic study. Antioxidants 2021, 10, 33. [Google Scholar] [CrossRef] [PubMed]
- Moriwaki, M.; Kito, K.; Nakagawa, R.; Kapoor, M.P.; Matsumiya, Y.; Fukuhara, T.; Kamiya, U. Bioavailability comparison between a compound comprising hesperetin-7-glucoside with β-cyclodextrin and a mixture of hesperidin and dextrin in healthy adult human males. Biosc. Biotechnol. Biochem. 2021, 85, 2195–2199. [Google Scholar] [CrossRef]
- Ozdal, T.; Sela, D.A.; Xiao, J.; Boyacioglu, D.; Chen, F.; Capanoglu, E. The reciprocal interactions between polyphenols and gut microbiota and effects on bioaccessibility. Nutrients 2016, 8, 78. [Google Scholar] [CrossRef]
- Kawabata, K.; Yoshioka, Y.; Terao, J. Role of intestinal microbiota in the bioavailability and physiological functions of dietary polyphenols. Molecules 2019, 24, 370. [Google Scholar] [CrossRef] [Green Version]
- Murota, K.; Nakamura, Y.; Uehara, M. Flavonoid metabolism: The interaction of metabolites and gut microbiota. Biosci. Biotechnol. Biochem. 2018, 82, 600–610. [Google Scholar] [CrossRef] [Green Version]
- Del Rio, D.; Rodriguez-Mateos, A.; Spencer JP, E.; Tognolini, M.; Borges, G.; Crozier, A. Dietary (poly)phenolics in human health: Structures, bioavailability, and evidence of protective effects against chronic diseases. Antioxid. Redox Signal. 2013, 18, 1818–1892. [Google Scholar] [CrossRef] [Green Version]
- Amaretti, A.; Raimondi, S.; Leonardi, A.; Quartieri, A.; Rossi, M. Hydrolysis of the Rutinose-Conjugates Flavonoids Rutin and Hesperidin by the Gut Microbiota and Bifidobacteria. Nutrients 2015, 7, 2788–2800. [Google Scholar] [CrossRef] [Green Version]
- Dobroslawa, B.; Kasimsetty, S.G.; Khan, S.I.; Daneel, F. Urolithins, intestinal microbial metabolites of pomegranate ellagitannins, exhibit potent antioxidant activity in a cell-based assay. J. Agric. Food Chem. 2009, 57, 10181–10186. [Google Scholar]
- González-Sarrías, A.; Larrosa, M.; Toms-Barberán, F.A.; Dolara, P.; Espín, J.C. NF-κB-dependent anti-inflammatory activity of urolithins, gut microbiota ellagic acid-derived metabolites, in human colonic fibroblasts. Br. J. Nutr. 2010, 104, 503–512. [Google Scholar] [CrossRef] [PubMed] [Green Version]
- Surapaneni, K.M.; Priya, V.V.; Mallika, J. Pioglitazone, quercetin and hydroxy citric acid effect on cytochrome P450 2E1 (CYP2E1) enzyme levels in experimentally induced non alcoholic steatohepatitis (NASH). Eur. Rev. Med. Pharmacol. Sci. 2014, 18, 2736–2741. [Google Scholar] [PubMed]
- Martínez-Noguera, F.J.; Marín-Pagán, C.; Carlos-Vivas, J.; Alcaraz, P.E. Effects of 8 weeks of 2S-Hesperidin supplementation on performance in amateur cyclists. Nutrients 2020, 12, 3911. [Google Scholar] [CrossRef] [PubMed]
- Martínez Noguera, F.J.; Alcaraz, P.E.; Carlos Vivas, J.; Chung, L.H.; Marín Cascales, E.; Marín Pagán, C. 8 weeks of 2: S -Hesperidin supplementation improves muscle mass and reduces fat in amateur competitive cyclists: Randomized controlled trial. Food Funct. 2021, 12, 3872–3882. [Google Scholar] [CrossRef] [PubMed]
- Garner, R.C.; Garner, J.V.; Gregory, S.; Whattam, M.; Calam, A.; Leong, D. Comparison of the absorption of micronized (daflon 500 mg) and nonmicronized 14C-diosmin tablets after oral administration to healthy volunteers by accelerator mass spectrometry and liquid scintillation counting. J. Pharm. Sci. 2002, 91, 32–40. [Google Scholar] [CrossRef] [PubMed]
- Gil-Izquierdo, A.; Gil, M.I.; Tomás-Barberán, F.A.; Ferreres, F. Influence of industrial processing on orange juice flavanone solubility and transformation to chalcones under gastrointestinal conditions. J. Agric. Food Chem. 2003, 51, 3024–3028. [Google Scholar] [CrossRef]
- Schiborr, C.; Kocher, A.; Behnam, D.; Jandasek, J.; Toelstede, S.; Frank, J. The oral bioavailability of curcumin from micronized powder and liquid micelles is significantly increased in healthy humans and differs between sexes. Mol. Nutr. Food Res. 2014, 58, 516–527. [Google Scholar] [CrossRef]


| Product | Amount (mg) | -S/-R (%) | Particle ˂ 10 µm (%) | Hesperidin (%) | Water (%) | Hesperidin (mg) |
|---|---|---|---|---|---|---|
| HEM | 500 | 56/44 | 10 | 94.4 | 2.10 | 462.1 |
| MHEM | 500 | 55/45 | 90 | 94.10 | 1.80 | 462.0 |
| M2SH | 500 | 93/7 | 90 | 92.60 | 2.50 | 451.4 |
| Change from Baseline | ||||||||
|---|---|---|---|---|---|---|---|---|
| Variable /Intervention | Baseline (0 h) | 0–3 h | 3–6 h | 6–8 h | 8–24 h | p for Linear Trend | Total Change a (0 h Post-24 h) | Total Relative to Intake (%) |
| Total metabolites b, µmol | ||||||||
| HEM (n = 13) | 0.035 (0.01) | 0.080 (0.005) * | 0.613 (0.22)† | 7.04 (2.43)† | 31.35 (5.15)† | ˂0.001 | 39.1 (6.1) | 5.2 (0.81) |
| MHEM (n = 14) | 0.022 (0.003) | 0.111 (0.01)† | 0.691 (0.23)† | 17.05 (5.13)† | 49.84 (9.75)† | ˂0.001 | 68.5 (13)‡ | 9.2 (1.6)‡ |
| M2SH (n = 14) | 0.077 (0.05) | 0.130 (0.03) * | 1.03 (0.34)† | 5.08 (1.36)† | 20.25 (6.16)† | 0.005 | 24.9 (7.8)‡ ≠ | 3.6 (1.0)§ ≠ |
| Total specific catabolites c, µmol | ||||||||
| HEM (n = 13) | 23 (8.6) | 31 (15) | 8.6(2.8) * | 29 (17) | 205 (33)† | ˂0.001 | 284 (61) | 37 (8.0) |
| MHEM (n = 14) | 25 (16) | 40 (27) * | 37 (28) | 39 (15) * | 230 (47)† | ˂0.001 | 346 (114) | 46 (15) |
| M2SH (n = 14) | 27 (18) | 37 (19) * | 36 (21) | 67 (29)† | 339 (43)† | ˂0.001 | 488 (107)¥ ≠ | 66 (14)¥ ≠ |
| Total metabolites plus specific catabolites, µmol | ||||||||
| HEM (n = 13) | 23 (8.6) | 31 (15) | 9.2 (2.9) * | 36 (19) | 237 (32)† | ˂0.001 | 326 (60) | 43 (8.0) |
| MHEM (n = 14) | 25(16) | 40 (27) * | 37 (28) | 56 (17) * | 280 (47)† | ˂0.001 | 414 (113) | 55 (15) |
| M2SH (n = 14) | 27 (18) | 38 (19) * | 37 (21) | 72 (29)† | 360 (42)† | ˂0.001 | 515 (106)‡ | 70 (14)‡ ≠ |
| Parameter | Treatment | p for Treatments | % of Change * | ||||||
|---|---|---|---|---|---|---|---|---|---|
| HEM (n = 13) | MHEM (n = 13) | M2SH (n = 13) | MHEM vs. HEM | M2SH vs. HEM | M2SH vs. MHEM | MHEM vs. HEM | M2SH vs. HEM | M2SH vs. MHEM | |
| Dose, mg | 462.1 | 462 | 451.4 | ||||||
| AUC0–24 (nmol.h−1) | 13,510 ± 4638 a 13,680 (11,294; 17,294) | 23,114 ± 11,579 a 25,288 (10,497; 34,502) | 28,096 ± 13,344 a 21,775 (19,653; 39,712) | 0.012† | <0.001† | 0.084 | 74 ± 83 a 58 (2.5; 138) | 118 ± 99 a 77 (43; 244) | 40 ± 67 a 24 (−13; 80) |
| Cmax, nmol | 1022 ± 366 a 971 (751; 1288) | 2296 ± 1190 a 2478 (949; 3433) | 2497 ± 1373 a 2181 (891;3412) | 0.001† | <0.001† | 0.489 | 139 ± 118 a 133 (48; 198) | 163 ± 119 a 140 (66; 252) | 37 ± 95 a −3.6 (−32; 102) |
| Tmax, h | 15.0 ± 8.7 a 8.0 (7.0; 24) | 12.7 ± 7.8 a 8.0 (7.5; 24) | 10.4 ± 6.0 a 8.0 (8; 8) | 0.233 | 0.079 | 0.231 | −8.7 ± 28 a 0.00 (0.00; 0.00) | −17.5 ± 37 a 0.00 (−67; 14) | −8.0 ± 26 a 0.00 (0.00; 0.00) |
| t ½ (h) b | 14.5 ± 5.3 a 14.6 (9.8; 19) | NC | NC | _ | _ | _ | _ | _ | |
| Parameter | Treatment | p for Treatments | % of Change * | ||||||
|---|---|---|---|---|---|---|---|---|---|
| HEM (n = 14) | MHEM (n = 14) | M2SH (n = 14) | MHEM vs. HEM | M2SH vs. HEM | M2SH vs. MHEM | MHEM vs. HEM | M2SH vs. HEM | M2SH vs. MHEM | |
| Dose, mg | 462.1 | 462 | 451.4 | ||||||
| AUC0–24 (nmol.h−1) | 4730 ± 3333 a 3993 (2547; 5602) | 8264 ± 5722 a 7462 (3773; 13,509) | 4550 ± 3941 a 3137 (2192; 5494) | 0.024 | 0.644 | 0.013 | 87 ± 139 a 80 (−23; 141) | −9.5 ± 83 a −24 (−56; 72) | −41 ± 281 a −33 (−73; 29) |
| Cmax, nmol | 406 ± 229 a 392 (229; 562) | 971 ± 722 a 911 (323; 1529) | 458 ± 325 a 358 (237; 527) | 0.006† | 0.775 | 0.007† | 146 ± 174 a 146 (−5.2; 186) | 28.8 ± 106 a −13.7 (−45; 87) | −22.6 ± 61 a −54 (−74; 36) |
| Tmax, h | 10.8 ± 7.1 a 7.5 (7; 12) | 9.7 ± 6.1 a 8.0 (7; 8.0) | 8.6 ± 4.5 a 8.0 (7; 8.0) | 1.00 | 0.347 | 0.349 | 10.7 ± 60.1 a 0.00 (−7; 14) | −4.6 ± 23.2 a 0.00 (−6; 0.00) | −3.9 ± 22.7 a 0.00 (−12; 14) |
| t ½ (h) b | 4.85 ± 3.7 a 3.3 (2.7; 5.5) | 6.02 ± 5.6 a 3.7 (2.4; 12) | 4.62 ± 5.5 a 2.4 (2.2; 5.9) | 0.465 | 0.345 | 0.655 | 2.67 ± 15.8 b 2.53 (−12; 18) | −18.1 ± 27.9 b −22.2 (−39; 5) | −0.16 ± 16.0 b −0.16 (−11; 11) |
| Parameter | Treatment | p for Treatments | % of Change * | ||||||
|---|---|---|---|---|---|---|---|---|---|
| HEM (n = 13) | MHEM (n = 13) | M2SH (n = 13) | MHEM vs. HEM | M2SH vs. HEM | M2SH vs. MHEM | MHEM vs. HEM | M2SH vs. HEM | M2SH vs. MHEM | |
| Dose, mg | 462.1 | 462 | 451.4 | ||||||
| AUC0–24 (nmol.h−1) | 8438 ± 3583 a 8511 (6171; 10,010) | 14,596 ± 9445 a 15,095 (7522; 22,322) | 23,674 ± 4332 a 18,104 (11,404; 36,270) | 0.117 † | <0.001† | 0.004† | 82 ± 97 a 94 (5.8; 172) | 183 ± 139 a 144 (60; 288) | 103 ± 126 a 45 (20; 154) |
| Cmax, nmol | 674 ± 270 a 670 (500; 843) | 1364 ± 846 a 1240 (818; 1982) | 2085 ± 1344 a 1840 (891; 3111) | 0.007 | 0.002 | 0.075 | 113 ± 103 a 94 (39; 196) | 220 ± 171 a 196 (78; 337) | 136 ± 319 a 29 (−4; 133) |
| Tmax, h | 15.1 ± 8.6 a 8.0 (7.0; 24) | 12.3 ± 7.7 a 8.0 (7.7; 24) | 12.8 ± 4.5 a 8.0 (8; 24) | 0.111 | 0.665 | 0.581 | −15.1 ± 31 a 0.00 (−46; 0.00) | 3.6 ± 70 a 0.00 (−50; 14) | 13.9 ± 60 a 0.00 (0.00; 7.1) |
| t ½ (h) b | 47 ± 34 a 39 (17; 86) | NC | NC | _ | _ | _ | _ | _ | _ |
Publisher’s Note: MDPI stays neutral with regard to jurisdictional claims in published maps and institutional affiliations. |
© 2022 by the authors. Licensee MDPI, Basel, Switzerland. This article is an open access article distributed under the terms and conditions of the Creative Commons Attribution (CC BY) license (https://creativecommons.org/licenses/by/4.0/).
Share and Cite
Crescenti, A.; Caimari, A.; Alcaide-Hidalgo, J.M.; Mariné-Casadó, R.; Valls, R.M.; Companys, J.; Salamanca, P.; Calderón-Pérez, L.; Pla-Pagà, L.; Pedret, A.; et al. Hesperidin Bioavailability Is Increased by the Presence of 2S-Diastereoisomer and Micronization—A Randomized, Crossover and Double-Blind Clinical Trial. Nutrients 2022, 14, 2481. https://doi.org/10.3390/nu14122481
Crescenti A, Caimari A, Alcaide-Hidalgo JM, Mariné-Casadó R, Valls RM, Companys J, Salamanca P, Calderón-Pérez L, Pla-Pagà L, Pedret A, et al. Hesperidin Bioavailability Is Increased by the Presence of 2S-Diastereoisomer and Micronization—A Randomized, Crossover and Double-Blind Clinical Trial. Nutrients. 2022; 14(12):2481. https://doi.org/10.3390/nu14122481
Chicago/Turabian StyleCrescenti, Anna, Antoni Caimari, Juan María Alcaide-Hidalgo, Roger Mariné-Casadó, Rosa M. Valls, Judit Companys, Patricia Salamanca, Lorena Calderón-Pérez, Laura Pla-Pagà, Anna Pedret, and et al. 2022. "Hesperidin Bioavailability Is Increased by the Presence of 2S-Diastereoisomer and Micronization—A Randomized, Crossover and Double-Blind Clinical Trial" Nutrients 14, no. 12: 2481. https://doi.org/10.3390/nu14122481
APA StyleCrescenti, A., Caimari, A., Alcaide-Hidalgo, J. M., Mariné-Casadó, R., Valls, R. M., Companys, J., Salamanca, P., Calderón-Pérez, L., Pla-Pagà, L., Pedret, A., Delpino-Rius, A., Herrero, P., Samarra, I., Arola, L., Solà, R., & Del Bas, J. M. (2022). Hesperidin Bioavailability Is Increased by the Presence of 2S-Diastereoisomer and Micronization—A Randomized, Crossover and Double-Blind Clinical Trial. Nutrients, 14(12), 2481. https://doi.org/10.3390/nu14122481