Abstract
BACKGROUND: Frailty is associated with adverse health outcomes, and vitamin D (VD) deficiency may be a risk factor. We aimed to identify frailty trajectories and examine the mediating effect of physical activity (PA) on the association between VD deficiency and frailty trajectories. METHODS: We included 2997 participants aged 60 to 85 years from ELSA. VD was measured using serum 25-hydroxyvitamin D [25(OH)D] (sufficient: >50; insufficient: 30–50; deficient: <30 nmol/L). Frailty was assessed by a 60-item frailty index, and PA was measured on the basis of total energy expenditure. Frailty trajectories were identified using group-based trajectory modeling, and the mediation effect of PA was tested using causal mediation analysis. RESULTS: Three distinct frailty trajectories emerged: “Non-frail” (66.48%), “Pre-frail to frail” (25.67%) and “Frail to severely frail” (7.85%). VD deficiency was associated with the “Pre-frail to frail” (OR = 1.51, 95% CI: 1.14, 1.98) and “Frail to severely frail” trajectories (OR = 2.29, 95% CI: 1.45, 3.62). PA only mediated 48.4% (95% CI: 17.1%–270.8%) of the association between VD deficiency and the “Pre-frail to frail” trajectory. CONCLUSIONS: Vitamin D deficiency is associated with the onset and worsening of frailty in older adults, and reduced PA may mediate its impact on the transition from pre-frailty to frailty.
1. Introduction
Frailty is a clinical state characterized by reduced physiological function and reduced stress resistance in older adults, leading to adverse events including hospitalization, falls and death [1]. A recent systematic review of 240 studies from 62 countries suggested that the prevalence of pre-frailty and frailty measured by FI were 24% and 49% among individuals aged ≥50 years, respectively [2]. Multiple risk factors are associated with frailty, including older age, female sex, lower socioeconomic status, lower physical activity (PA) and poorer diet [3]. Of these, vitamin D (VD) is a potentially reversible risk factor because of its benefits to bone health and muscle strength. 25-Hydroxyvitamin D [25(OH)D] is the biologically active form of VD and a biomarker of VD status. 25(OH)D regulates calcium and phosphorus metabolism and maintains the balance of blood calcium and phosphorus [4]. VD deficiency [25(OH)D < 30 nmol/L] can increase the incidence of injuries and chronic diseases (e.g., cardiovascular disease) [5]. The prevalence of VD deficiency is high in older adults, with a quarter of adults aged 60 years and above having VD deficiency in the UK [6].
Previous studies on VD deficiency and frailty have predominantly focused on the binary frailty status. For instance, a cross-sectional study among individuals aged ≥65 years showed that those with 25(OH)D < 50 nmol/L had a 130% increased risk of frailty [7]. As a complex condition, frailty can be measured by nearly 70 instruments, of which the frailty phenotype (FP) and the frailty index (FI) are the most widely used [8]. FP comprises five domains: shrinking, weakness, poor endurance and energy, slowness and low physical activity level [9]; FI is based on accumulative health deficits, including restricted activity, disability, cognitive impairments, etc. [10]. Although the binary frailty status provides a convenient interpretation, it is not suitable for understanding the impact of VD deficiency on the gradual change in frailty status, as measured by the continuous FI score. Furthermore, frailty is a dynamically changing status, yet few have examined the type of developmental trajectories of frailty with age. Furthermore, the exact mechanisms underlying the association between VD deficiency and frailty remain unclear. Previous research suggested that VD deficiency may be correlated with physical inactivity, both of which may compromise the preservation of skeletal muscle and physical functioning and contribute to the development of frailty [11,12]. However, no study has prospectively evaluated whether PA mediates the association between VD deficiency and the development of frailty.
Utilizing data collected from the English Longitudinal Study of Ageing (ELSA), the current study aimed to (1) identify distinct frailty trajectories over 8 years among adults aged from 60 to 85 years in the UK, (2) examine the association between VD deficiency and frailty trajectories and (3) test the hypothesis that VD deficiency bears an indirect effect on frailty trajectories through low physical activity.
2. Methods
2.1. Data Source
This analysis used data from the English Longitudinal Study of Ageing (ELSA). ELSA is a nationally representative longitudinal survey of people aged 50 and over in England. The first survey was conducted in 2002 with participants from the Health Survey for England (HSE) samples in 1998, 1999 and 2001. Participants in ELSA were followed up every two years with a computer-assisted personal interview plus a self-administered questionnaire. The detailed study design of ELSA has been reported elsewhere [13]. We used longitudinal data from wave 6 (2012–2013) to wave 9 (2018–2020), because wave 6 was the earliest wave in which 25(OH)D data were available. A total of 10,601 participants enrolled in wave 6 of ELSA. We included participants who were 60 years and 85 years of age at the time of wave 6. Additionally, we excluded participants who had complete data for less than 60% of the 60 component variables of the frailty index and excluded those with missing baseline 25(OH)D concentration data. Ultimately, we included 2997 participants (Supporting Information Figure S1). The ELSA study was approved by the London Multicentre Research Ethics Committee, and all participants provided written informed consent.
2.2. Measures
2.2.1. Serum 25(OH)D Concentration
The serum 25(OH)D levels were determined by the DiaSorin Liaison immunoassay performed on a fasting blood sample taken at the Royal Victoria Infirmary (Newcastle upon Tyne, United Kingdom) in wave 6′s nurse visits. In this study, 25(OH)D concentration was classified into three categories with reference to the Institute of Medicine (IOM) criteria: sufficient (50 nmol/L), insufficient (30 and <50 nmol/L) and deficient (<30 nmol/L) [14].
2.2.2. Physical Activity (PA)
PA was measured by asking participants how often they engaged in vigorous, moderate and light activities. Each question had four options: never, one to three times a month, once a week and more than once a week. Participants were given specific examples of different PAs; for example, home repairs and laundry fell under vigorous PA, car washing and dancing fell under moderate PA, and cycling and swimming fell under light PA [15]. We estimated the total energy spent on PA by multiplying the duration and intensity of each type of PA. We used the following metabolic equivalent of task (MET) value to estimate the energy expenditure: light activities = 2 METs, moderate activities = 4 METs, and vigorous activities = 6 METs [16,17]. One MET is equivalent to the amount of energy produced relative to body mass in the resting state [18].
2.2.3. Frailty Index (FI)
We used the frailty index to quantify the level of frailty. Based on the methodology of Searle et al. [10], we used 60 indicator variables representing six domains of health, including mobility difficulties, disability (ADL and IADL), chronic conditions, psychological problems and cognitive impairment (Supporting Information Table S1) [19]. The FI was calculated for all participants with at least 60% complete data for the 60 component variables. Each variable was scored between 0 and 1. For example, a binary variable (e.g., walk 100 yards) was assigned a value of 1 if the participant had difficulty and 0 if otherwise. For a five-category variable (e.g., self-reported general health), a response of “poor” was coded as 1, “fair” was coded as 0.75, “good” was coded as 0.5, “very good” was coded as 0.25 and “excellent” was coded as 0. For continuous variables such as immediate or delayed word recall, we recoded their upper quintile as 0, fourth quintile as 0.25, third quintile as 0.5, second quintile as 0.75 and lower quintile as 1. The FI was calculated by first summing all components and dividing by the number of non-missing variables. The FI also ranged between 0 and 1, where a higher FI means greater frailty. In previous analyses, an FI < 0.20 was considered non-frail, 0.20 ≤ FI < 0.35 was pre-frail, 0.35 ≤ FI < 0.43 was frail and FI ≥ 0.43 was severely frail [20,21].
2.2.4. Covariates
Socio-demographic, anthropometric and health behavior factors from wave 6 were included as potential confounders. Socio-demographic variables included sex, education (higher education with degree, higher education below degree level, higher secondary school, lower secondary school or no education), marital status (married, single or never married, divorced or separated, or widowed), employment (employed or unemployed) and annual income (in quintiles). Health behaviors included smoking (never smoker, past smoker or current smoker), alcohol intake (less than once/week, times/week or daily) and BMI (normal: 18.5 kg/m2 ≤ BMI < 25 kg/m2; overweight: 25 kg/m2 ≤ BMI < 30 kg/m2; obese: BMI ≥ 30 kg/m2). Since the blood 25(OH)D level is subject to seasonal influences, we further adjusted for season [22]. VD supplement use was determined based on a question asking whether participants took calcium pills or vitamin D. A response of “Yes” was considered as the use of VD supplements.
2.3. Statistical Analyses
We used group-based trajectory modeling (GBTM) to identify distinct frailty trajectories with age. GBTM clusters individuals with similar trajectories into latent trajectory groups [23]. In this analysis, we fitted and compared GBTM with 2–6 trajectory groups and different shapes (linear, quadratic and cubic). The optimal model was determined based on (1) the minimum Akaike’s information criterion (AIC) and Bayesian information criteria (BIC) values; (2) the average posterior probability that each individual belonged to a certain trajectory group should be greater than 70%; and (3) each trajectory group should have 5% or higher membership [22]. We fitted the GBTM using the PROC TRAJ package in SAS and accounted for dropout or death using the DROPOUT option [24].
We conducted multinomial logistic regression to examine the association among different 25(OH)D levels, PA in wave 8 and frailty trajectories. For each association analysis, 4 models were fitted consecutively: Model 1 was the unadjusted model; Model 2 adjusted for basic demographic factors, including sex, education, marital status, employment, wealth, smoking, alcohol intake and BMI; Model 3 further adjusted for VD supplement use and season; and Model 4 further adjusted for PA in wave 6.
Causal mediation analysis was used to quantify the contribution of PA to the association between different 25(OH)D levels and frailty trajectories (Figure 1). Causal mediation analysis is an extension of the potential outcome framework [25], which is a non-parametric approach for evaluating the mediating effects of an individual mediator based on the assumption of sequential ignorability that the mediator could be independent of all potential outcomes conditional on the assigned treatment [26,27]. In the current study, let denote the th participant. The mediation model was specified as follows [26]:
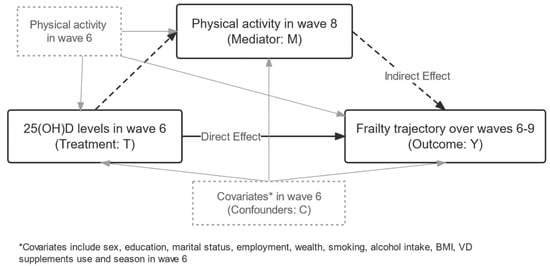
Figure 1.
Directed acyclic graph of the current analysis. The exposure variable was 25(OH)D level in wave 6, the outcome variable was the latent frailty trajectory over waves 6–9, and the mediator variable was physical activity level in wave 8. The analysis adjusted for physical activity level in wave 6 and other potential confounders. The solid black lines represent a direct effect of 25(OH)D on frailty trajectories, and the dashed lines represent an indirect effect.
denotes the value of the total energy spent on PA when individual is observed to have a 25(OH)D concentration of , which has two potential values of 0 and 1. denotes the potential frailty trajectory that would result if individual has a 25(OH)D concentration of and a PA value of . Therefore, represents the average causal mediation effect (ACME), meaning the effect of 25(OH)D concentration on frailty trajectories through PA. represents the average direct effect (ADE) of 25(OH)D concentration on frailty trajectories while controlling for the PA value. represents the total effect (TE), which is the sum of ACME and ADE. We defined participants with sufficient VD as the control group and those with insufficient and deficient VD as the treatment groups. The causal mediation analyses adjusted for sex, education, marital status, employment, wealth, smoking, alcohol intake, BMI, VD supplement use, season and PA in wave 6. We also conducted subgroup analysis to evaluate the mediation effect of PA in different populations at high risk of frailty, including participants with falls, depression, loneliness, living alone, hypertension, diabetes, arthritis, obesity, smoking and social isolation.
Data cleaning and analysis were conducted in R version 4.0.4 (R Core Team, Vienna, Austria). GBTM was performed in SAS (version 9.4, SAS Institute, Cary, NC, USA) using PROC TRAJ. Mediation analysis was performed using the R package “mediation”, and p <0.05 was regarded as statistically significant.
3. Results
3.1. Sample Characteristics
The sample included 2997 individuals with an average age of 68.6 years. Most participants were female (55.5%), were married (68.9%), were unemployed (79.5%), had no formal education (37.5%), were never smokers (89.5%), were overweight (45.1%), drank a few times per week (45.2%) and engaged in moderate PA (49.5%). The prevalence of VD insufficiency and deficiency was 32.1% and 19.6%, respectively (Table 1).

Table 1.
Baseline characteristics by frailty trajectory.
3.2. Frailty Trajectories
We identified three latent frailty trajectories for individuals who were 60 to 85 years of age (Figure 2). The first group (n = 2837, 66.48%) maintained an average FI below 0.20 and thus was labeled “Non-frail.” The average FI for the second group (n = 1067, 25.67%) increased rapidly from 0.19 to 0.42 (FI > 0.35), and therefore, the group was labeled “Pre-frail to frail”. The third group (n = 333, 7.85%) showed an increasing FI from 0.44 to 0.58, meaning that the participants transitioned from being frail to severely frail and were thus labeled “Frail to severely frail”. Participants in the “Frail to severely frail” group were more likely to have VD deficiency, be female, married and unemployed, have a lower level of education and wealth, have never smoked, be obese, drink less than once a week, not use VD supplements and report no PA, compared to those in the “Non-frail” group (Table 1).
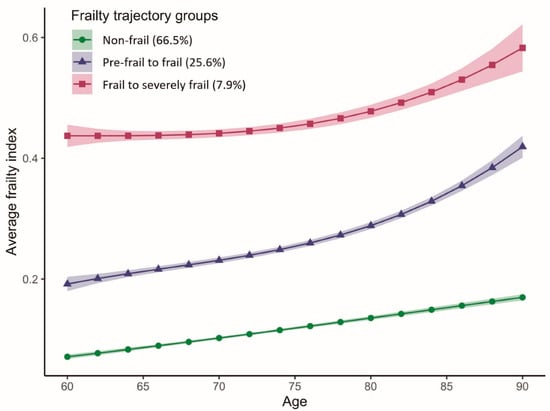
Figure 2.
Average frailty index with age according to frailty trajectories among older adults in the ELSA study. The solid lines represent the means, and the ribbons represent the 95% confidence intervals of the mean.
3.3. Association between 25(OH)D Levels and Frailty Trajectories
In unadjusted multivariable logistic regression, participants with insufficient serum VD levels were more likely to follow the “Pre-frail to frail” trajectory and the “Frail to severely frail” trajectory (OR = 1.32, 95% CI: 1.09–1.61; OR = 1.55, 95% CI: 1.09–2.20, respectively, Table 2) compared to those with sufficient VD. However, this association disappeared when adjusting for confounders. Older adults with deficient VD were more likely to be in the “Pre-frail to frail” trajectory and “Frail to severely frail” trajectory (OR = 1.51, 95% CI: 1.14–1.98; OR = 2.29, 95% CI: 1.45–3.62, respectively) compared to those with sufficient VD. VD deficiency was significantly associated with the “Frail to severely frail” trajectory, even after controlling for all confounders (OR = 1.79, 95% CI: 1.11–2.88).
Table 2.
Association between serum 25(OH)D level and frailty trajectories in all participants and in subgroups with specific risk factors.
3.4. Causal Mediation Analysis of the Mediating Effect of Physical Activity
In the causal mediation analysis of the risk of being in the “Pre-frail to frail” trajectory group versus the “Non-frail” group, PA showed a significant ACME on VD deficiency (OR = 1.024, 95% CI: 1.014–1.036), which mediated 48.4% (95% CI: 17.1%–270.8%; p = 0.040) of the association. However, we did not observe any significant ACME on the association between VD insufficiency and the “Pre-frail to frail” trajectory. In the causal mediation analysis of the risk of being in the “Frail to severely frail” trajectory group versus the “Non-frail” group, PA did not show a significant ACME.
In the subgroup analysis, PA showed a significant mediation effect on the association between VD deficiency and the “Pre-frail to frail” trajectory among older adults who smoked (ACME = 1.063, 95% CI: 1.02–1.12, proportion mediated = 31.5%). In addition, PA showed a significant mediation effect on the association of VD deficiency with the “Frail to severely frail” trajectory among older adults who lived alone (ACME = 1.02, 95% CI: 1.004–1.05, proportion mediated = 23.9%), had hypertension (ACME = 1.02, 95% CI: 1.004–1.03, proportion mediated = 16.8%) and smoked (ACME = 1.064, 95% CI: 1.02–1.12, proportion mediated = 56.7%) (Figure 3; Supporting Information Table S5).
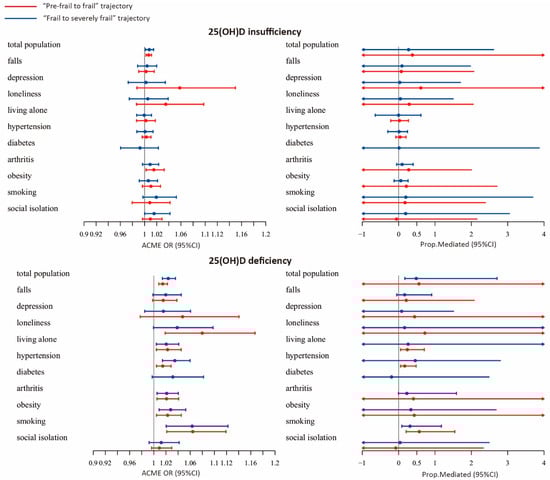
Figure 3.
Forest plot of the average causal mediation effect (ACME) of physical activity.
4. Discussion
Based on a large cohort of older adults in the UK, our analyses identified three distinct types of frailty trajectories over the ages of 60 to 85 years. Our results suggested that participants with VD deficiency had a greater likelihood of following the “Pre-frail to frail” and the “Frail to severely frail” trajectories relative to the “Non-frail” trajectory. In the causal mediation analysis, PA mediated approximately 48.4% of the association between VD deficiency and the “Pre-frail to frail” trajectory, but not the “Frail to severely frail” trajectory. These findings suggest that VD deficiency may accelerate the transition from pre-frailty to frailty through reduced physical activity. Therefore, it is important to promote physical activity for the primary prevention of frailty among older adults suffering from VD deficiency.
Limited studies have explored heterogeneous developmental frailty trajectories. Our study identified three distinct types of frailty trajectories: “Non-frail”, “Pre-frail to frail” and “Frail to severely frail”. Similar to our findings, Howrey et al. identified three groups of frailty: “non-frail”, “moderate progressive frailty” and “progressive high frailty” among older Mexican Americans [28]. However, this study used the survey wave as the underlying time scale, which is not suitable for analyzing the trajectory of age-related phenotypes. Recently, Mandelblatt et al. measured frailty with a 42-item deficit accumulation index and revealed three frailty trajectories using a growth mixture model among older adults with breast cancer and non-cancer controls: “remain robust”, “remain frail” and “became frailer” [29]. However, these results may be biased by their sample of cancer survivors and have limited generalizability to the general population. A prospective study from Spain that included 975 older adults identified five groups of frailty trajectories: “non-frailty”, “improving to non-frailty”, “developing frailty”, “remaining frail” and “increasing frailty” [30]. The study used a novel frailty measurement instrument, the Frailty Trait Scale (FTS5), which is not widely applied, and its validity has not been evaluated. Furthermore, they included only two frailty measurements five years apart; thus, the results were unable to reflect the continuous change in frailty over the longer term.
Although previous studies have investigated whether VD is associated with frailty, few have examined its association with the developmental trajectories of frailty. A recent systematic review [31] of 26 studies unequivocally suggested that a lower 25(OH)D concentration is associated with a higher risk of frailty. The present study further demonstrates that older adults with VD deficiency may be at greater risk of the onset and worsening of frailty. Although the exact mechanism remains unclear, VD may exert its effects on frailty mainly through its regulation of bones and muscles. VD deficiency affects the intestinal absorption of calcium, resulting in less calcium for bone mineralization, and may increase parathyroid hormone, which stimulates bone metabolism and accelerates bone loss [32]. In addition, individuals with deficient VD have reduced muscle fibers, particularly type II muscle fibers, which play important roles in moderate to vigorous activities [33]. The loss of body mass significantly undermines one’s ability to perform physical exercises, which causes further losses of physical functions. Therefore, PA may mediate the impact of VD deficiency on frailty. Our data support the hypothesis that PA mediates the association between VD deficiency and the frailty trajectory. This suggests that PA is a potential protective factor against frailty for older adults with deficient VD.
Our study has several advantages over previous studies. First, we gridded the longitudinal frailty assessment data by age; that is, we used age as the underlying time scale, which allowed us to better understand how frailty changes with age in older adults. Second, we took baseline PA into account to minimize reverse causation. However, our study has several limitations. First, we only examined VD at baseline, which ignores changes in VD over time. Second, some components of the FI were long-term or irreversible, which made it difficult to observe any improvement in frailty. Finally, most variables of the FI were self-reported, which makes them subject to recall bias and may lead to inaccurate estimates of the frailty trajectories.
5. Conclusions
Based on a nationally representative sample of older adults in the UK, we identified three distinct frailty trajectories: “Non-frail”, “Pre-frail to frail” and “Frail to severely frail.” Older adults with insufficient and deficient VD were at significantly higher risk of following the “Pre-frail to frail” and the “Frail to severely frail” trajectories. PA mediated approximately half of the association between VD deficiency and the “Pre-frail to frail” trajectory. Our results highlight the importance of developing strategies to promote physical activities to prevent the onset of frailty in older adults with low levels of VD. Given the observational nature of this analysis, interventional studies are needed to investigate the protective effect of PA in reducing frailty among older adults with VD deficiency.
Supplementary Materials
The following supporting information can be downloaded at: https://www.mdpi.com/article/10.3390/nu14112292/s1, Table S1. Prevalence of FI component variables in baseline (n = 4237), Table S2. Fit statistics for FI trajectories, Table S3. Maximum Likelihood Estimates of FI trajectories, Table S4. Linear regression between serum 25(OH)D level in wave 6 (treatment) and PA in wave 8 (mediator) in all participants and in subgroups with specific risk factors, Table S5. Causal mediation analysis of the mediating effect of physical activity, Table S6. Association between different 25(OH)D concentration and frailty trajectories by gender, Figure S1. The English Longitudinal Study of Ageing (ELSA) recruitment
Author Contributions
Z.S. and K.S. conceived the study. Z.S., K.S. and Y.F. developed the analytic plan. Z.S., K.S., Z.Z. and J.L. obtained data and performed data analyses. Z.S. and Y.F. obtained funding for the study. All authors provided critical input on the interpretation of results. Z.S. and K.S. drafted the initial manuscript. All authors have read and agreed to the published version of the manuscript.
Funding
This work was supported by the National Natural Science Foundation of China (grant numbers 81973144 and 82103951).
Institutional Review Board Statement
The ELSA study was conducted in accordance with the Declaration of Helsinki, and approved by approved by the London Multicentre Research Ethics Committee.
Informed Consent Statement
Informed consent was obtained from all subjects involved in ELSA.
Data Availability Statement
Publicly available datasets were analyzed in this study. The ELSA study data can be downloaded from UK Data Service: https://beta.ukdataservice.ac.uk/datacatalogue/series/series?id=200011 access on 14 May 2022.
Acknowledgments
The funding body had no role in the design of the study; the collection, analysis and interpretation of data; or the writing of the manuscript.
Conflicts of Interest
The authors declare no conflict of interest.
Abbreviations
ELSA: the English Longitudinal Study of Ageing; VD: vitamin D; PA: physical activity; 25(OH)D: 25-hydroxyvitamin D; FI: frailty index; BIC: Bayesian information criterion; AIC: Akaike’s information criterion.
References
- Clegg, A.; Young, J.; Iliffe, S.; Rikkert, M.O.; Rockwood, K. Frailty in elderly people. Lancet 2013, 381, 752–762. [Google Scholar] [CrossRef] [Green Version]
- O’Caoimh, R.; Sezgin, D.; O’Donovan, M.R.; Molloy, D.W.; Clegg, A.; Rockwood, K.; Liew, A. Prevalence of frailty in 62 countries across the world: A systematic review and meta-analysis of population-level studies. Age Ageing 2021, 50, 96–104. [Google Scholar] [CrossRef] [PubMed]
- Welstead, M.; Jenkins, N.D.; Russ, T.; Luciano, M.; Muniz-Terrera, G. A Systematic Review of Frailty Trajectories: Their Shape And Influencing Factors. Gerontologist 2020, 61, e463–e475. [Google Scholar] [CrossRef] [PubMed]
- Dominguez, L.J.; Farruggia, M.; Veronese, N.; Barbagallo, M. Vitamin D Sources, Metabolism, and Deficiency: Available Compounds and Guidelines for Its Treatment. Metabolites 2021, 11, 255. [Google Scholar] [CrossRef]
- de Jongh, R.T.; van Schoor, N.M.; Lips, P. Changes in vitamin D endocrinology during aging in adults. Mol. Cell Endocrinol. 2017, 453, 144–150. [Google Scholar] [CrossRef]
- Aspell, N.; Laird, E.; Healy, M.; Shannon, T.; Lawlor, B.; O’Sullivan, M. The Prevalence and Determinants of Vitamin D Status in Community-Dwelling Older Adults: Results from the English Longitudinal Study of Ageing (ELSA). Nutrients 2019, 11, 1253. [Google Scholar] [CrossRef] [Green Version]
- Vaes, A.M.M.; Brouwer-Brolsma, E.M.; Toussaint, N.; de Regt, M.; Tieland, M.; van Loon, L.J.C.; de Groot, L. The association between 25-hydroxyvitamin D concentration, physical performance and frailty status in older adults. Eur. J. Nutr. 2019, 58, 1173–1181. [Google Scholar] [CrossRef] [Green Version]
- Buta, B.J.; Walston, J.D.; Godino, J.G.; Park, M.; Kalyani, R.R.; Xue, Q.L.; Bandeen-Roche, K.; Varadhan, R. Frailty assessment instruments: Systematic characterization of the uses and contexts of highly-cited instruments. Ageing Res. Rev. 2016, 26, 53–61. [Google Scholar] [CrossRef] [Green Version]
- Fried, L.P.; Tangen, C.M.; Walston, J.; Newman, A.B.; Hirsch, C.; Gottdiener, J.; Seeman, T.; Tracy, R.; Kop, W.J.; Burke, G.; et al. Frailty in older adults: Evidence for a phenotype. J. Gerontol. A Biol. Sci. Med. Sci. 2001, 56, M146–M156. [Google Scholar] [CrossRef]
- Searle, S.D.; Mitnitski, A.; Gahbauer, E.A.; Gill, T.M.; Rockwood, K. A standard procedure for creating a frailty index. BMC Geriatr. 2008, 8, 24. [Google Scholar] [CrossRef] [Green Version]
- Yang, A.; Lv, Q.; Chen, F.; Wang, Y.; Liu, Y.; Shi, W.; Liu, Y.; Wang, D. The effect of vitamin D on sarcopenia depends on the level of physical activity in older adults. J. Cachexia Sarcopenia Muscle 2020, 11, 678–689. [Google Scholar] [CrossRef] [PubMed]
- Kolehmainen, L.; Havulinna, S.; Ngandu, T.; Strandberg, T.; Levalahti, E.; Lehtisalo, J.; Antikainen, R.; Hietikko, E.; Peltonen, M.; Polonen, A.; et al. Earlier life leisure-time physical activity in relation to age-related frailty syndrome. Age Ageing 2021, 50, 161–168. [Google Scholar] [CrossRef] [PubMed]
- Steptoe, A.; Breeze, E.; Banks, J.; Nazroo, J. Cohort profile: The English longitudinal study of ageing. Int. J. Epidemiol. 2013, 42, 1640–1648. [Google Scholar] [CrossRef] [PubMed] [Green Version]
- IOM (Institute of Medicine). Dietary Reference Intakes for Calcium and Vitamin D; Ross, A.C., Taylor, C.L., Yaktine, A.L., Del Valle, H.B., Eds.; The National Academies Press: Washington, DC, USA, 2011. [Google Scholar]
- Hamer, M.; de Oliveira, C.; Demakakos, P. Non-exercise physical activity and survival: English longitudinal study of ageing. Am. J. Prev. Med. 2014, 47, 452–460. [Google Scholar] [CrossRef] [PubMed] [Green Version]
- Ainsworth, B.E.; Haskell, W.L.; Whitt, M.C.; Irwin, M.L.; Swartz, A.M.; Strath, S.J.; O’Brien, W.L.; Bassett, D.R., Jr.; Schmitz, K.H.; Emplaincourt, P.O.; et al. Compendium of physical activities: An update of activity codes and MET intensities. Med. Sci. Sports Exerc. 2000, 32, S498–S504. [Google Scholar] [CrossRef] [PubMed] [Green Version]
- Piercy, K.L.; Troiano, R.P.; Ballard, R.M.; Carlson, S.A.; Fulton, J.E.; Galuska, D.A.; George, S.M.; Olson, R.D. The Physical Activity Guidelines for Americans. JAMA 2018, 320, 2020–2028. [Google Scholar] [CrossRef]
- Jette, M.; Sidney, K.; Blumchen, G. Metabolic equivalents (METS) in exercise testing, exercise prescription, and evaluation of functional capacity. Clin. Cardiol. 1990, 13, 555–565. [Google Scholar] [CrossRef]
- Watts, P.; Webb, E.; Netuveli, G. The role of sports clubs in helping older people to stay active and prevent frailty: A longitudinal mediation analysis. Int. J. Behav. Nutr. Phys. Act. 2017, 14, 95. [Google Scholar] [CrossRef] [Green Version]
- Rockwood, K.; Song, X.; MacKnight, C.; Bergman, H.; Hogan, D.B.; McDowell, I.; Mitnitski, A. A global clinical measure of fitness and frailty in elderly people. CMAJ 2005, 173, 489–495. [Google Scholar] [CrossRef] [Green Version]
- Najafi, B.; Veranyan, N.; Zulbaran-Rojas, A.; Park, C.; Nguyen, H.; Nakahara, Q.K.; Elizondo-Adamchik, H.; Chung, J.; Mills, J.L.; Montero-Baker, M.; et al. Association Between Wearable Device-Based Measures of Physical Frailty and Major Adverse Events Following Lower Extremity Revascularization. JAMA Netw. Open 2020, 3, e2020161. [Google Scholar] [CrossRef]
- Luiz, M.M.; Maximo, R.; Oliveira, D.C.; Ramirez, P.C.; de Souza, A.F.; Delinocente, M.L.B.; Steptoe, A.; de Oliveira, C.; Alexandre, T. Association of Serum 25-Hydroxyvitamin D Deficiency with Risk of Incidence of Disability in Basic Activities of Daily Living in Adults > 50 Years of Age. J. Nutr. 2020, 150, 2977–2984. [Google Scholar] [CrossRef] [PubMed]
- Jones, B.L.; Nagin, D.S. Advances in Group-Based Trajectory Modeling and an SAS Procedure for Estimating Them. Sociol. Methods Res. 2007, 35, 542–571. [Google Scholar] [CrossRef] [Green Version]
- Edelman, E.J.; Li, Y.; Barry, D.; Brennan Braden, J.; Crystal, S.; Kerns, R.D.; Gaither, J.R.; Gordon, K.S.; Manhapra, A.; Merlin, J.S.; et al. Trajectories of Self-Reported Opioid Use Among Patients with HIV Engaged in Care: Results from a National Cohort Study. J. Acquir. Immune Defic. Syndr. 2020, 84, 26–36. [Google Scholar] [CrossRef] [PubMed]
- Robins, J.M.; Greenland, S. Identifiability and exchangeability for direct and indirect effects. Epidemiology 1992, 3, 143–155. [Google Scholar] [CrossRef] [PubMed] [Green Version]
- Imai, K.; Keele, L.; Tingley, D. A general approach to causal mediation analysis. Psychol. Methods 2010, 15, 309–334. [Google Scholar] [CrossRef] [PubMed] [Green Version]
- VanderWeele, T.J. Mediation Analysis: A Practitioner’s Guide. Annu. Rev. Public Health 2016, 37, 17–32. [Google Scholar] [CrossRef] [Green Version]
- Howrey, B.T.; Al Snih, S.; Middleton, J.A.; Ottenbacher, K.J. Trajectories of Frailty and Cognitive Decline Among Older Mexican Americans. J. Gerontol. A Biol. Sci. Med. Sci. 2020, 75, 1551–1557. [Google Scholar] [CrossRef]
- Mandelblatt, J.S.; Zhou, X.; Small, B.J.; Ahn, J.; Zhai, W.; Ahles, T.; Extermann, M.; Graham, D.; Jacobsen, P.B.; Jim, H.; et al. Deficit Accumulation Frailty Trajectories of Older Breast Cancer Survivors and Non-Cancer Controls: The Thinking and Living with Cancer Study. J. Natl. Cancer Inst. 2021, 113, 1053–1064. [Google Scholar] [CrossRef]
- Alvarez-Bustos, A.; Carnicero-Carreno, J.A.; Sanchez-Sanchez, J.L.; Garcia-Garcia, F.J.; Alonso-Bouzon, C.; Rodriguez-Manas, L. Associations between frailty trajectories and frailty status and adverse outcomes in community-dwelling older adults. J. Cachexia Sarcopenia Muscle 2021, 13, 230–239. [Google Scholar] [CrossRef]
- Marcos-Perez, D.; Sanchez-Flores, M.; Proietti, S.; Bonassi, S.; Costa, S.; Teixeira, J.P.; Fernandez-Tajes, J.; Pasaro, E.; Valdiglesias, V.; Laffon, B. Low Vitamin D Levels and Frailty Status in Older Adults: A Systematic Review and Meta-Analysis. Nutrients 2020, 12, 2286. [Google Scholar] [CrossRef]
- Lips, P.; van Schoor, N.M. The effect of vitamin D on bone and osteoporosis. Best Pract. Res. Clin. Endocrinol. Metab. 2011, 25, 585–591. [Google Scholar] [CrossRef] [PubMed]
- Remelli, F.; Vitali, A.; Zurlo, A.; Volpato, S. Vitamin D Deficiency and Sarcopenia in Older Persons. Nutrients 2019, 11, 2861. [Google Scholar] [CrossRef] [PubMed] [Green Version]
Publisher’s Note: MDPI stays neutral with regard to jurisdictional claims in published maps and institutional affiliations. |
© 2022 by the authors. Licensee MDPI, Basel, Switzerland. This article is an open access article distributed under the terms and conditions of the Creative Commons Attribution (CC BY) license (https://creativecommons.org/licenses/by/4.0/).