
A Prospective Study of Fruit Juice Consumption and the Risk of Overall and Cardiovascular Disease Mortality


Abstract
:
1. Introduction
2. Materials and Methods
2.1. Study Population
2.2. Dietary Assessment
2.3. Assessment of Covariates
2.4. Ascertainment of Deaths
2.5. Statistical Analysis
3. Results
3.1. Baseline Characteristics
3.2. Association between Fruit Juice Consumption and Mortality
3.3. Substitution Analysis
3.4. Secondary Analysis
4. Discussion
5. Conclusions
Supplementary Materials
Author Contributions
Funding
Institutional Review Board Statement
Informed Consent Statement
Data Availability Statement
Acknowledgments
Conflicts of Interest
References
- Dreher, M.L. Whole Fruits and Fruit Fiber Emerging Health Effects. Nutrients 2018, 10, 1833. [Google Scholar] [CrossRef] [PubMed] [Green Version]
- Wallace, T.C.; Bailey, R.L.; Blumberg, J.B.; Burton-Freeman, B.; Chen, C.O.; Crowe-White, K.M.; Drewnowski, A.; Hooshmand, S.; Johnson, E.; Lewis, R.; et al. Fruits, vegetables, and health: A comprehensive narrative, umbrella review of the science and recommendations for enhanced public policy to improve intake. Crit. Rev. Food Sci. Nutr. 2020, 60, 2174–2211. [Google Scholar] [CrossRef] [PubMed] [Green Version]
- Ruxton, C.H.S.; Myers, M. Fruit Juices: Are They Helpful or Harmful? An Evidence Review. Nutrients 2021, 13, 1815. [Google Scholar] [CrossRef] [PubMed]
- Pepin, A.; Stanhope, K.L.; Imbeault, P. Are Fruit Juices Healthier than Sugar-Sweetened Beverages? A Review. Nutrients 2019, 11, 1006. [Google Scholar] [CrossRef] [PubMed] [Green Version]
- Auerbach, B.J.; Dibey, S.; Vallila-Buchman, P.; Kratz, M.; Krieger, J. Review of 100% Fruit Juice and Chronic Health Conditions: Implications for Sugar-Sweetened Beverage Policy. Adv. Nutr. 2018, 9, 78–85. [Google Scholar] [CrossRef] [PubMed]
- U.S. Department of Agriculture and U.S. Department of Health and Human Services. Dietary Guidelines for Americans, 2020–2025. 9th Ed. December 2020. Available online: https://www.dietaryguidelines.gov/ (accessed on 24 December 2021).
- Nutrition Science Team, Public Health England. The Eatwell Guide. Available online: https://www.gov.uk/government/publications/the-eatwell-guide (accessed on 24 December 2021).
- Health, High Council for Public Health. Statement Related to the Update of the French Nutrition and Health Programme’s Dietary Guidelines for Adults for the Period 2017–2021. Available online: https://www.hcsp.fr/Explore.cgi/Telecharger?NomFichier=hcspa20170216_reperesalimentairesactua2017_en.pdf (accessed on 24 December 2021).
- Kromhout, D.; Spaaij, C.J.; de Goede, J.; Weggemans, R.M. The 2015 Dutch food-based dietary guidelines. Eur. J. Clin. Nutr. 2016, 70, 869–878. [Google Scholar] [CrossRef]
- Umana—SINU, Società Italiana di Nutrizione Umana. IV Revisione dei Livelli di Assunzione di Riferimento di Nutrienti ed energia per la Popolazione Italiana (LARN). Available online: https://sinu.it/tabelle-larn-2014/ (accessed on 24 December 2021).
- Anderson, J.J.; Gray, S.R.; Welsh, P.; Mackay, D.F.; Celis-Morales, C.A.; Lyall, D.M.; Forbes, J.; Sattar, N.; Gill, J.M.R.; Pell, J.P. The associations of sugar-sweetened, artificially sweetened and naturally sweet juices with all-cause mortality in 198,285 UK Biobank participants: A prospective cohort study. BMC Med. 2020, 18, 97. [Google Scholar] [CrossRef] [Green Version]
- Pan, B.; Ge, L.; Lai, H.; Wang, Q.; Wang, Q.; Zhang, Q.; Yin, M.; Li, S.; Tian, J.; Yang, K.; et al. Association of soft drink and 100% fruit juice consumption with all-cause mortality, cardiovascular diseases mortality, and cancer mortality: A systematic review and dose-response meta-analysis of prospective cohort studies. Crit. Rev. Food Sci. Nutr. 2021, 1–12. [Google Scholar] [CrossRef]
- Odegaard, A.O.; Koh, W.P.; Yuan, J.M.; Pereira, M.A. Beverage habits and mortality in Chinese adults. J. Nutr. 2015, 145, 595–604. [Google Scholar] [CrossRef] [Green Version]
- Collin, L.J.; Judd, S.; Safford, M.; Vaccarino, V.; Welsh, J.A. Association of Sugary Beverage Consumption with Mortality Risk in US Adults: A Secondary Analysis of Data from the REGARDS Study. JAMA Netw. Open 2019, 2, e193121. [Google Scholar] [CrossRef]
- Khan, T.A.; Chiavaroli, L.; Zurbau, A.; Sievenpiper, J.L. A lack of consideration of a dose-response relationship can lead to erroneous conclusions regarding 100% fruit juice and the risk of cardiometabolic disease. Eur. J. Clin. Nutr. 2019, 73, 1556–1560. [Google Scholar] [CrossRef] [PubMed] [Green Version]
- (CDC), Centers for Disease Control and Prevention. About the National Health and Nutrition Examination Survey. Available online: https://www.cdc.gov/nchs/nhanes/about_nhanes.htm (accessed on 24 December 2021).
- Raper, N.; Perloff, B.; Ingwersen, L.; Steinfeldt, L.; Anand, J. An overview of USDA’s dietary intake data system. J. Food Compos. Anal. 2004, 17, 545–555. [Google Scholar] [CrossRef]
- Huang, Y.Q.; Shen, G.; Lo, K.; Huang, J.Y.; Liu, L.; Chen, C.L.; Yu, Y.L.; Sun, S.; Zhang, B.; Feng, Y.Q. Association of circulating selenium concentration with dyslipidemia: Results from the NHANES. J. Trace Elem. Med. Biol. 2020, 58, 126438. [Google Scholar] [CrossRef] [PubMed]
- Stampfer, M.J.; Willett, W.C.; Speizer, F.E.; Dysert, D.C.; Lipnick, R.; Rosner, B.; Hennekens, C.H. Test of the National Death Index. Am. J. Epidemiol. 1984, 119, 837–839. [Google Scholar] [CrossRef] [PubMed]
- Rich-Edwards, J.W.; Corsano, K.A.; Stampfer, M.J. Test of the National Death Index and Equifax Nationwide Death Search. Am. J. Epidemiol. 1994, 140, 1016–1019. [Google Scholar] [CrossRef]
- Song, M.; Giovannucci, E. Substitution analysis in nutritional epidemiology: Proceed with caution. Eur. J. Epidemiol. 2018, 33, 137–140. [Google Scholar] [CrossRef]
- Wang, D.D.; Li, Y.; Bhupathiraju, S.N.; Rosner, B.A.; Sun, Q.; Giovannucci, E.L.; Rimm, E.B.; Manson, J.E.; Willett, W.C.; Stampfer, M.J.; et al. Fruit and Vegetable Intake and Mortality: Results from 2 Prospective Cohort Studies of US Men and Women and a Meta-Analysis of 26 Cohort Studies. Circulation 2021, 143, 1642–1654. [Google Scholar] [CrossRef]
- Scheffers, F.R.; Boer, J.M.A.; Verschuren, W.M.M.; Verheus, M.; van der Schouw, Y.T.; Sluijs, I.; Smit, H.A.; Wijga, A.H. Pure fruit juice and fruit consumption and the risk of CVD: The European Prospective Investigation into Cancer and Nutrition-Netherlands (EPIC-NL) study. Br. J. Nutr. 2019, 121, 351–359. [Google Scholar] [CrossRef] [Green Version]
- D’Elia, L.; Dinu, M.; Sofi, F.; Volpe, M.; Strazzullo, P.; Sinu Working Group, Endorsed by SIPREC. 100% Fruit juice intake and cardiovascular risk: A systematic review and meta-analysis of prospective and randomised controlled studies. Eur. J. Nutr. 2021, 60, 2449–2467. [Google Scholar] [CrossRef]
- Zurbau, A.; Au-Yeung, F.; Mejia, S.B.; Khan, T.A.; Vuksan, V.; Jovanovski, E.; Leiter, L.A.; Kendall, C.W.C.; Jenkins, D.J.A.; Sievenpiper, J.L. Relation of Different Fruit and Vegetable Sources with Incident Cardiovascular Outcomes: A Systematic Review and Meta-Analysis of Prospective Cohort Studies. J. Am. Heart Assoc. 2020, 9, e017728. [Google Scholar] [CrossRef]
- Whelton, P.K.; Carey, R.M.; Aronow, W.S.; Casey, D.E., Jr.; Collins, K.J.; Himmelfarb, C.D.; DePalma, S.M.; Gidding, S.; Jamerson, K.A.; Jones, D.W.; et al. 2017 ACC/AHA/AAPA/ABC/ACPM/AGS/APhA/ASH/ASPC/NMA/PCNA Guideline for the Prevention, Detection, Evaluation, and Management of High Blood Pressure in Adults: A Report of the American College of Cardiology/American Heart Association Task Force on Clinical Practice Guidelines. Hypertension 2018, 71, e13–e115. [Google Scholar] [CrossRef] [PubMed]
- Williams, B.; Mancia, G.; Spiering, W.; Rosei, E.A.; Azizi, M.; Burnier, M.; Clement, D.L.; Coca, A.; de Simone, G.; Dominiczak, A.; et al. 2018 ESC/ESH Guidelines for the management of arterial hypertension: The Task Force for the management of arterial hypertension of the European Society of Cardiology and the European Society of Hypertension: The Task Force for the management of arterial hypertension of the European Society of Cardiology and the European Society of Hypertension. J. Hypertens 2018, 36, 1953–2041. [Google Scholar] [CrossRef] [PubMed] [Green Version]
- Li, Y.; Zhang, D.; Pagan, J.A. Social Norms and the Consumption of Fruits and Vegetables across New York City Neighborhoods. J. Urban Health 2016, 93, 244–255. [Google Scholar] [CrossRef] [PubMed] [Green Version]
- Benton, D.; Young, H.A. Role of fruit juice in achieving the 5-a-day recommendation for fruit and vegetable intake. Nutr. Rev. 2019, 77, 829–843. [Google Scholar] [CrossRef] [PubMed]
- Lustig, R. Fat Chance: The Bitter Truth about Sugar; HarperCollins UK: Glasgow, UK, 2012. [Google Scholar]
- Gillespie, D. Sweet Poison; Penguin UK: London, UK, 2008. [Google Scholar]
- World Health Organization. Healthy Diet. Available online: https://www.who.int/initiatives/behealthy/healthy-diet (accessed on 24 December 2021).
- Pan, A.; Hu, F.B. Effects of carbohydrates on satiety: Differences between liquid and solid food. Curr. Opin. Clin. Nutr. Metab. Care 2011, 14, 385–390. [Google Scholar] [CrossRef]
- Stanhope, K.L.; Schwarz, J.M.; Keim, N.L.; Griffen, S.C.; Bremer, A.A.; Graham, J.L.; Hatcher, B.; Cox, C.L.; Dyachenko, A.; Zhang, W.; et al. Consuming fructose-sweetened, not glucose-sweetened, beverages increases visceral adiposity and lipids and decreases insulin sensitivity in overweight/obese humans. J. Clin. Investig. 2009, 119, 1322–1334. [Google Scholar] [CrossRef] [Green Version]
- Ma, J.; McKeown, N.M.; Hwang, S.J.; Hoffmann, U.; Jacques, P.F.; Fox, C.S. Sugar-Sweetened Beverage Consumption Is Associated with Change of Visceral Adipose Tissue Over 6 Years of Follow-Up. Circulation 2016, 133, 370–377. [Google Scholar] [CrossRef] [Green Version]
- Chazelas, E.; Srour, B.; Desmetz, E.; Kesse-Guyot, E.; Julia, C.; Deschamps, V.; Druesne-Pecollo, N.; Galan, P.; Hercberg, S.; Latino-Martel, P.; et al. Sugary drink consumption and risk of cancer: Results from NutriNet-Sante prospective cohort. BMJ 2019, 366, l2408. [Google Scholar] [CrossRef] [Green Version]
- Bray, G.A. Energy and fructose from beverages sweetened with sugar or high-fructose corn syrup pose a health risk for some people. Adv. Nutr. 2013, 4, 220–225. [Google Scholar] [CrossRef] [Green Version]
- Liu, S.; Manson, J.E.; Buring, J.E.; Stampfer, M.J.; Willett, W.C.; Ridker, P.M. Relation between a diet with a high glycemic load and plasma concentrations of high-sensitivity C-reactive protein in middle-aged women. Am. J. Clin. Nutr. 2002, 75, 492–498. [Google Scholar] [CrossRef]
- Ravn-Haren, G.; Dragsted, L.O.; Buch-Andersen, T.; Jensen, E.N.; Jensen, R.I.; Nemeth-Balogh, M.; Paulovicsova, B.; Bergstrom, A.; Wilcks, A.; Licht, T.R.; et al. Intake of whole apples or clear apple juice has contrasting effects on plasma lipids in healthy volunteers. Eur. J. Nutr. 2013, 52, 1875–1889. [Google Scholar] [CrossRef] [PubMed]
- Nardin, T.; Barnaba, C.; Abballe, F.; Trenti, G.; Malacarne, M.; Larcher, R. Fast analysis of quaternary ammonium pesticides in food and beverages using cation-exchange chromatography coupled with isotope-dilution high-resolution mass spectrometry. J. Sep. Sci. 2017, 40, 3928–3937. [Google Scholar] [CrossRef] [PubMed]
- Albero, B.; Sanchez-Brunete, C.; Tadeo, J.L. Determination of organophosphorus pesticides in fruit juices by matrix solid-phase dispersion and gas chromatography. J. Agric. Food Chem. 2003, 51, 6915–6921. [Google Scholar] [CrossRef] [PubMed]
- Makarem, N.; Bandera, E.V.; Lin, Y.; Jacques, P.F.; Hayes, R.B.; Parekh, N. Consumption of Sugars, Sugary Foods, and Sugary Beverages in Relation to Adiposity-Related Cancer Risk in the Framingham Offspring Cohort (1991–2013). Cancer Prev. Res. 2018, 11, 347–358. [Google Scholar] [CrossRef] [Green Version]


| Characteristic | 100% Fruit Juice (g/day) | |||
|---|---|---|---|---|
| 0 | 1 to 124 | 125 to 249 | ≥250 | |
| No. of participants | 27,032 | 4782 | 4156 | 4104 |
| Age, years | 46.7 (18.9) | 51.5 (19.4) | 50.7 (20.9) | 43.4 (19.7) |
| Female, % | 51.5 | 61.0 | 54.3 | 46.1 |
| BMI, kg/m2 | 28.7 (6.8) | 28.4 (6.5) | 28.3 (6.5) | 28.3 (6.5) |
| Race/ethnicity, % | ||||
| Non-Hispanic white | 48.1 | 41.9 | 44.1 | 38.3 |
| Non-Hispanic black | 19.9 | 19.8 | 23.5 | 26.1 |
| Hispanic | 6.7 | 8.8 | 8.5 | 8.8 |
| Other | 25.4 | 29.5 | 23.9 | 26.8 |
| Education, % | ||||
| ≤12th grade | 30.1 | 26.0 | 25.1 | 29.7 |
| High school graduate/GED or equivalent | 24.7 | 21.9 | 22.9 | 21.6 |
| More than high school | 45.1 | 52.0 | 52.0 | 48.6 |
| Ratio of family income to poverty | ||||
| <1.3 | 29.8 | 27.2 | 27.4 | 30.0 |
| 1.3 to 3.5 | 34.6 | 34.6 | 33.6 | 33.4 |
| ≥3.5 | 27.8 | 30.1 | 30.5 | 28.5 |
| Marital status, % | ||||
| Married | 26.3 | 23.3 | 26.1 | 28.2 |
| Widowed/divorced/separated | 52.3 | 55.6 | 53.1 | 50.3 |
| Never married | 17.6 | 17.6 | 16.9 | 17.4 |
| Smoking, % | ||||
| Never smoking | 47.7 | 58.1 | 55.4 | 53.8 |
| Former smoking | 24.1 | 22.1 | 24.1 | 21.6 |
| Current smoking | 21.6 | 14.3 | 14.0 | 15.7 |
| Drinking, % | ||||
| Never drinking | 26.0 | 28.7 | 28.0 | 27.4 |
| Low to moderate drinking | 26.3 | 27.7 | 27.4 | 25.3 |
| Heavy drinking | 36.4 | 33.1 | 33.7 | 33.2 |
| Physical activity, METS-h/week | ||||
| <8.3 | 41.2 | 40.7 | 39.4 | 38.3 |
| 8.3–16.7 | 12.3 | 12.6 | 12.1 | 11.7 |
| >16.7 | 46.2 | 46.4 | 48.3 | 49.6 |
| Total energy, kcal/d | 1975 (734) | 1955 (695) | 2049 (712) | 2237 (737) |
| History of diseases, % | ||||
| Diabetes | 13.2 | 12.0 | 10.0 | 10.1 |
| Other CVDs (without hypertension) | 10.4 | 9.2 | 10.6 | 10.0 |
| Cancer | 8.4 | 9.1 | 9.4 | 7.6 |
| Hypertension | 35.7 | 35.2 | 35.8 | 33.3 |
| Dyslipidemia | 56.5 | 54.0 | 54.1 | 57.1 |
| HEI-2015 (without fruit juice component) | 48.7 (11.9) | 52.2 (11.9) | 52.6 (11.5) | 53.6 (11.1) |
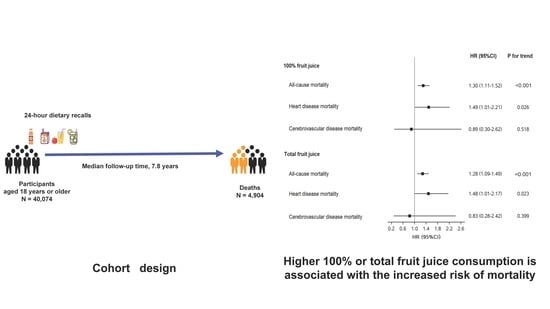
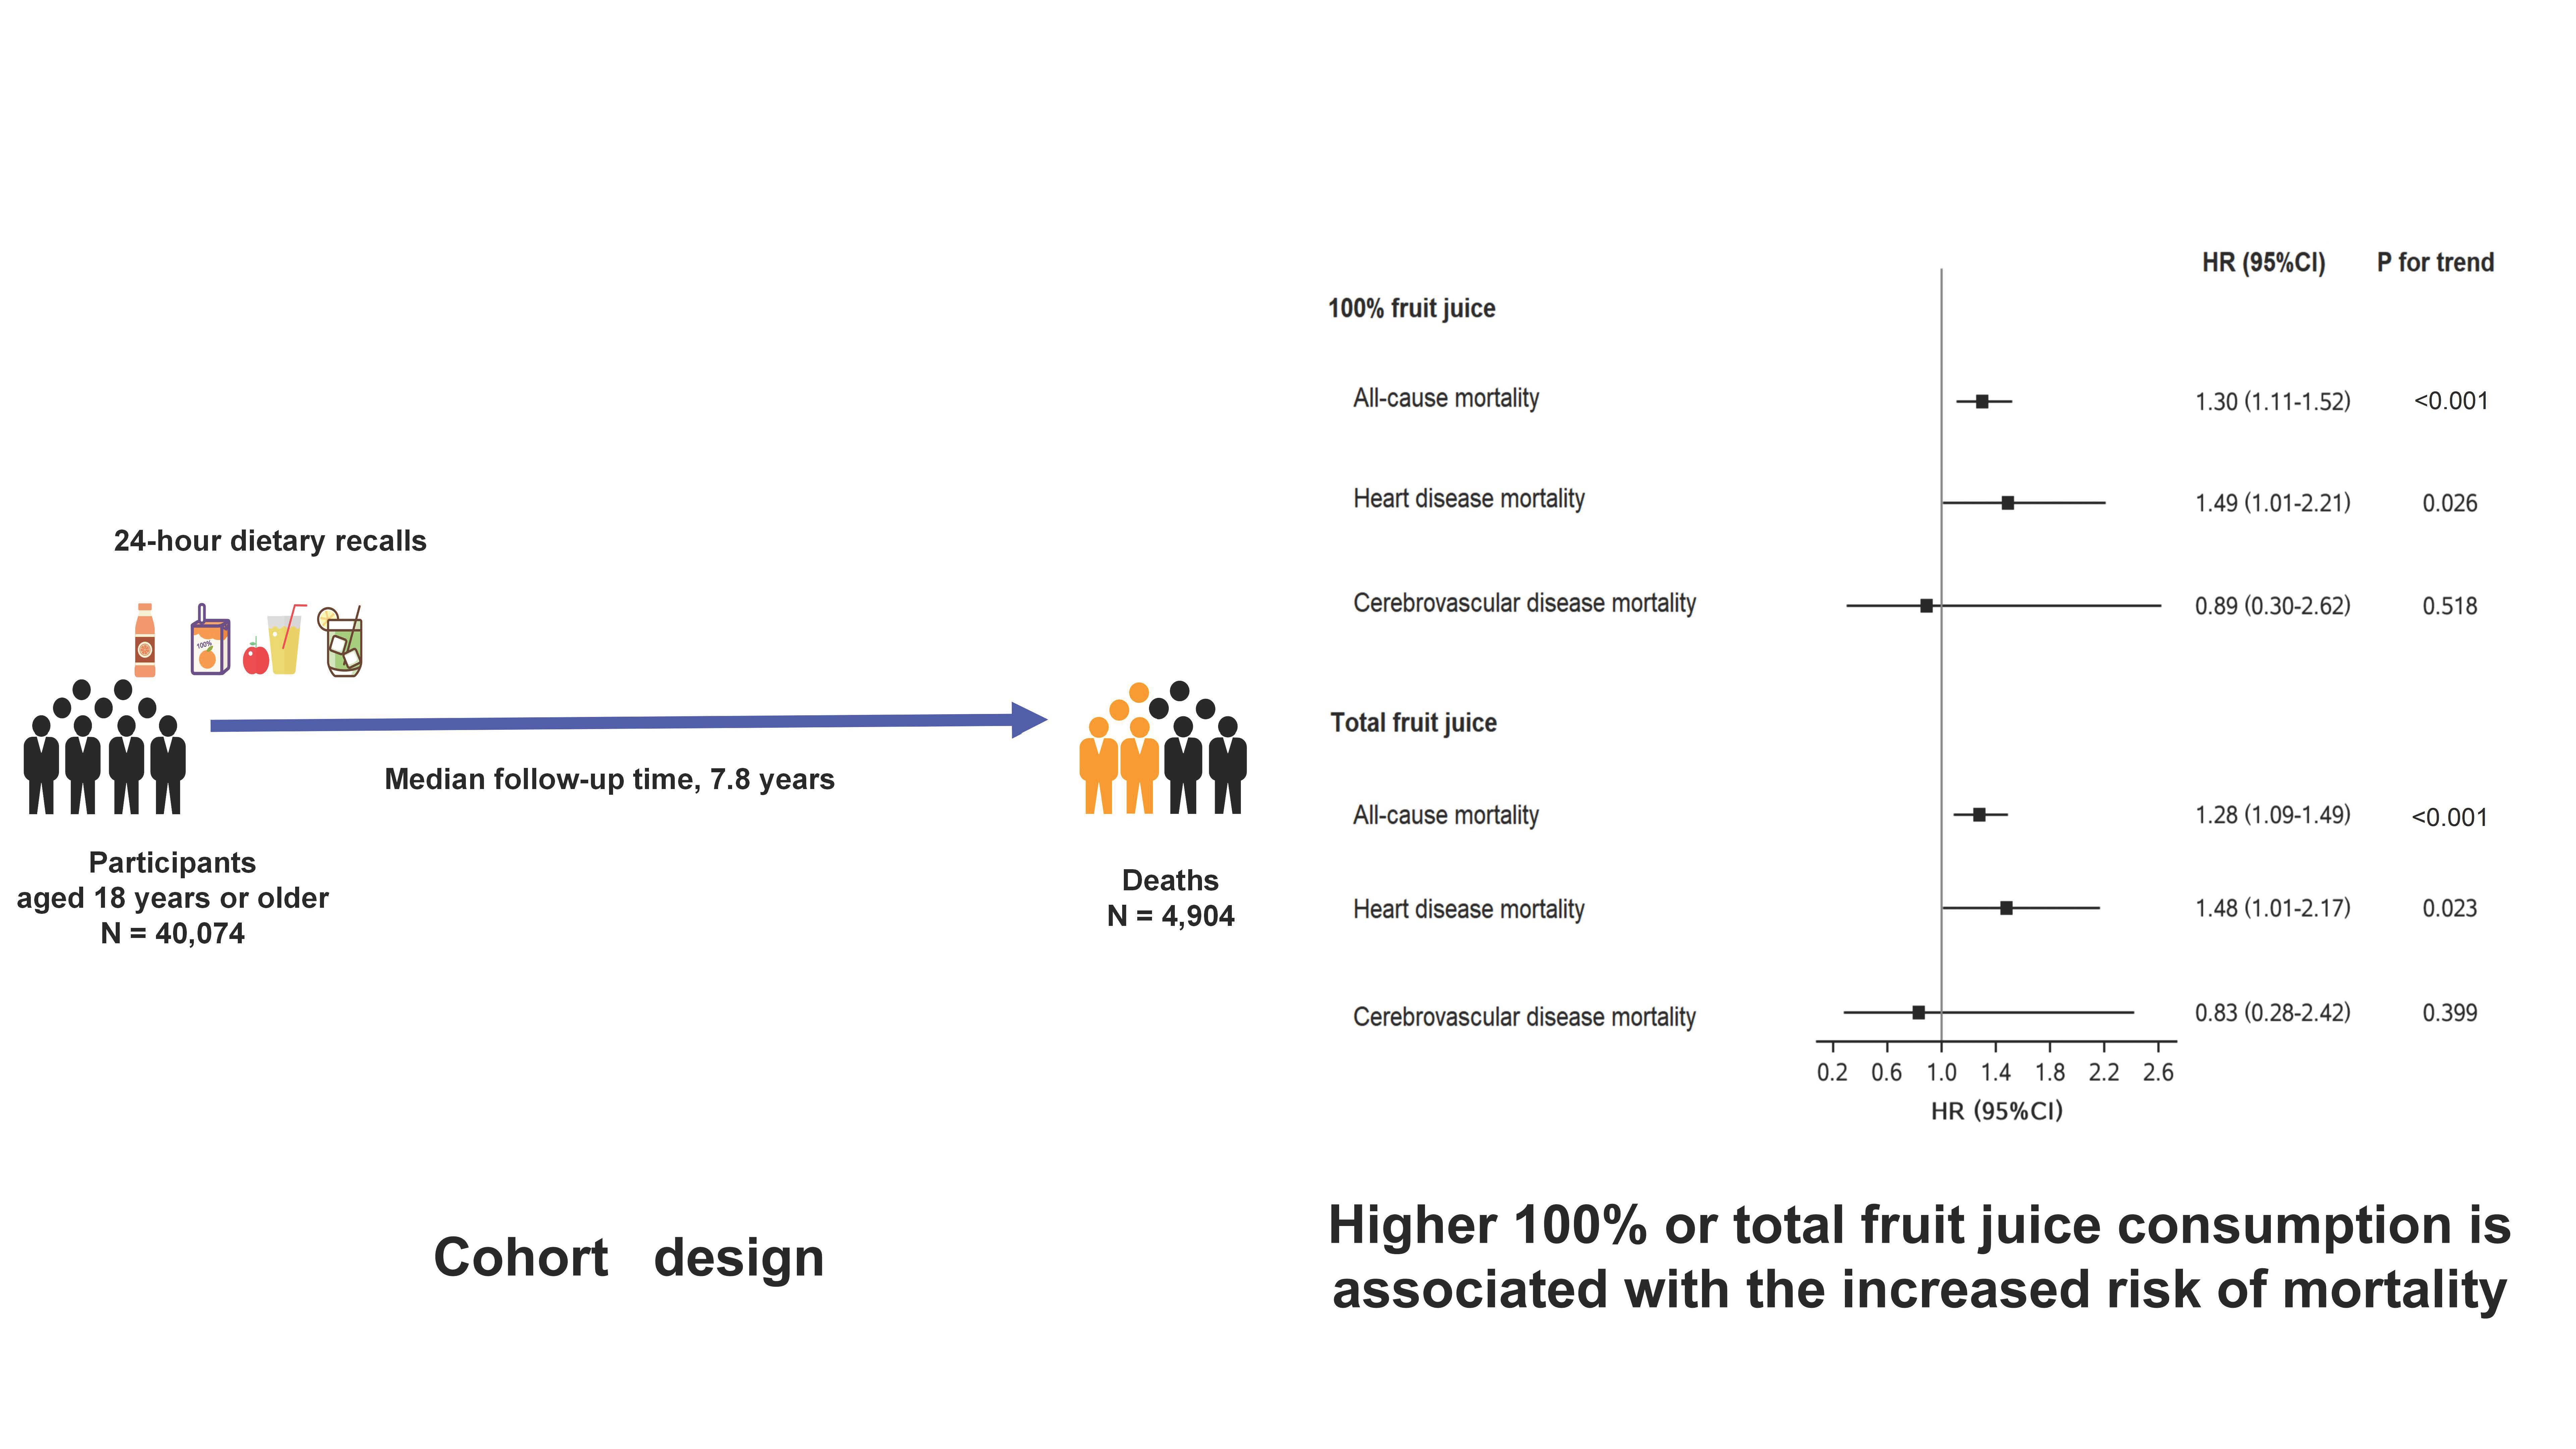
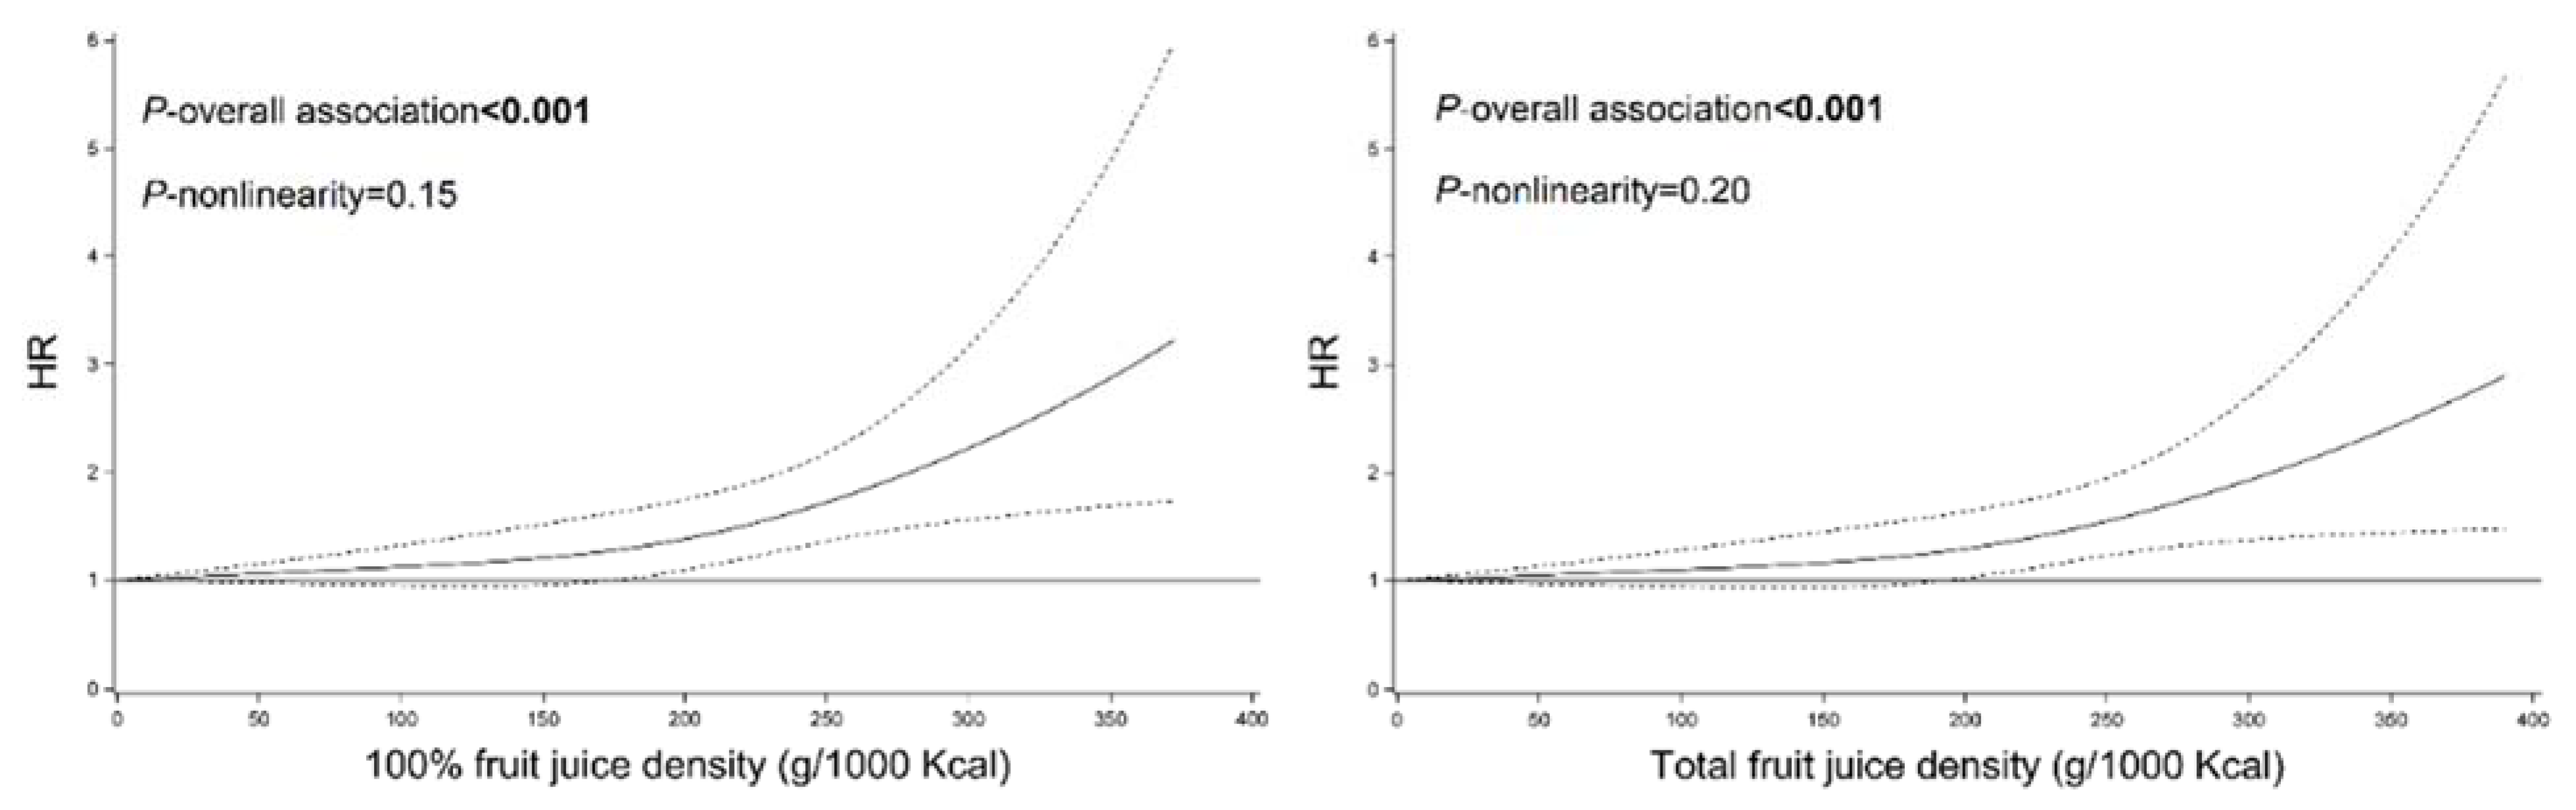
| Fruit Juice Consumption | HR (95% CI) | Ptrendc | ||||
|---|---|---|---|---|---|---|
| (g/day) | 0 | 1 to 124 | 125 to 249 | ≥250 | Per 100 g/day Increase | |
| 100% fruit juice | ||||||
| All-cause mortality | ||||||
| No. of deaths/person-years | 3180/222,833 | 630/34,656 | 649/32,387 | 445/36,029 | ||
| Model 1 a | 1 (Reference) | 1.01 (0.89–1.16) | 1.06 (0.92–1.22) | 1.13 (0.94–1.35) | 1.04 (0.99–1.08) | 0.109 |
| Model 2 b | 1 (Reference) | 1.15 (1.00–1.31) | 1.17 (0.99–1.38) | 1.30 (1.11–1.52) | 1.07 (1.04–1.10) | <0.001 |
| CVD mortality | ||||||
| No. of deaths/person-years | 677/222,833 | 117/34,656 | 147/32,387 | 88/36,029 | ||
| Model 1 a | 1 (Reference) | 0.74 (0.55–0.99) | 0.91 (0.69–1.21) | 1.13 (0.73–1.74) | 1.03 (0.92–1.15) | 0.633 |
| Model 2 b | 1 (Reference) | 0.87 (0.65–1.15) | 1.04 (0.74–1.45) | 1.38 (0.93–2.06) | 1.07 (0.99–1.16) | 0.093 |
| Heart disease mortality | ||||||
| No. of deaths/person-years | 557/222,833 | 94/34,656 | 124/32,387 | 71/36,029 | ||
| Model 1 a | 1 (Reference) | 0.75 (0.55–1.02) | 0.94 (0.70–1.26) | 1.20 (0.77–1.88) | 1.05 (0.93–1.18) | 0.471 |
| Model 2 b | 1 (Reference) | 0.88 (0.65–1.20) | 1.07 (0.76–1.51) | 1.49 (1.01–2.21) | 1.09 (1.01–1.18) | 0.026 |
| Cerebrovascular disease mortality | ||||||
| No. of deaths/person-years | 120/222,833 | 23/34,656 | 23/32,387 | 17/36,029 | ||
| Model 1 a | 1 (Reference) | 0.71 (0.29–1.77) | 0.80 (0.34–1.85) | 0.76 (0.26–2.22) | 0.88 (0.67–1.16) | 0.371 |
| Model 2 b | 1 (Reference) | 0.79 (0.30–2.05) | 0.89 (0.40–1.96) | 0.89 (0.30–2.62) | 0.92 (0.71–1.19) | 0.518 |
| Total fruit juice | ||||||
| All-cause mortality | ||||||
| No. of deaths/person-years | 3117/217,026 | 631/34,829 | 670/34,056 | 486/39,995 | ||
| Model 1 a | 1 (Reference) | 1.01 (0.89–1.15) | 1.01 (0.89–1.16) | 1.09 (0.91–1.31) | 1.03 (0.99–1.07) | 0.193 |
| Model 2 b | 1 (Reference) | 1.14 (1.00–1.30) | 1.15 (0.98–1.34) | 1.28 (1.09–1.49) | 1.06 (1.03–1.09) | <0.001 |
| CVD mortality | ||||||
| No. of deaths/person-years | 658/217,026 | 122/34,829 | 153/34,056 | 96/39,995 | ||
| Model 1 a | 1 (Reference) | 0.84 (0.64–1.11) | 0.92 (0.71–1.21) | 1.09 (0.71–1.68) | 1.02 (0.92–1.14) | 0.709 |
| Model 2 b | 1 (Reference) | 0.98 (0.75–1.28) | 1.07 (0.78–1.47) | 1.36 (0.92–2.01) | 1.07 (0.99–1.16) | 0.101 |
| Heart disease mortality | ||||||
| No. of deaths/person-years | 542/217,026 | 98/34,829 | 129/34,056 | 77/39,995 | ||
| Model 1 a | 1 (Reference) | 0.87 (0.63–1.19) | 0.97 (0.73–1.28) | 1.16 (0.75–1.81) | 1.04 (0.93–1.17) | 0.518 |
| Model 2 b | 1 (Reference) | 1.01 (0.73–1.40) | 1.12 (0.81–1.56) | 1.48 (1.01–2.17) | 1.09 (1.01–1.17) | 0.023 |
| Cerebrovascular disease mortality | ||||||
| No. of deaths/person-years | 116/217,026 | 24/34,829 | 24/34,056 | 19/39,995 | ||
| Model 1 a | 1 (Reference) | 0.76 (0.32–1.81) | 0.75 (0.32–1.73) | 0.71 (0.24–2.06) | 0.86 (0.66–1.14) | 0.292 |
| Model 2 b | 1 (Reference) | 0.84 (0.34–2.07) | 0.81 (0.38–1.73) | 0.83 (0.28–2.42) | 0.90 (0.69–1.16) | 0.399 |
| HR (95% CI) | ||
|---|---|---|
| Cause of Death | 100% Fruit Juice | Total Fruit Juice |
| All-cause mortality | ||
| Model 1 b | 1.18 (1.10–1.27) | 1.16 (1.08–1.25) |
| Model 2 c | 1.09 (1.02–1.16) | 1.08 (1.01–1.15) |
| CVD mortality | ||
| Model 1 b | 1.03 (0.91–1.17) | 1.01 (0.89–1.15) |
| Model 2 c | 1.00 (0.88–1.15) | 0.99 (0.87–1.13) |
Publisher’s Note: MDPI stays neutral with regard to jurisdictional claims in published maps and institutional affiliations. |
© 2022 by the authors. Licensee MDPI, Basel, Switzerland. This article is an open access article distributed under the terms and conditions of the Creative Commons Attribution (CC BY) license (https://creativecommons.org/licenses/by/4.0/).
Share and Cite
Zhang, Z.; Zeng, X.; Li, M.; Zhang, T.; Li, H.; Yang, H.; Huang, Y.; Zhu, Y.; Li, X.; Yang, W. A Prospective Study of Fruit Juice Consumption and the Risk of Overall and Cardiovascular Disease Mortality. Nutrients 2022, 14, 2127. https://doi.org/10.3390/nu14102127
Zhang Z, Zeng X, Li M, Zhang T, Li H, Yang H, Huang Y, Zhu Y, Li X, Yang W. A Prospective Study of Fruit Juice Consumption and the Risk of Overall and Cardiovascular Disease Mortality. Nutrients. 2022; 14(10):2127. https://doi.org/10.3390/nu14102127
Chicago/Turabian StyleZhang, Zhuang, Xueke Zeng, Meiling Li, Tengfei Zhang, Haowei Li, Hu Yang, Yong Huang, Yu Zhu, Xiude Li, and Wanshui Yang. 2022. "A Prospective Study of Fruit Juice Consumption and the Risk of Overall and Cardiovascular Disease Mortality" Nutrients 14, no. 10: 2127. https://doi.org/10.3390/nu14102127
APA StyleZhang, Z., Zeng, X., Li, M., Zhang, T., Li, H., Yang, H., Huang, Y., Zhu, Y., Li, X., & Yang, W. (2022). A Prospective Study of Fruit Juice Consumption and the Risk of Overall and Cardiovascular Disease Mortality. Nutrients, 14(10), 2127. https://doi.org/10.3390/nu14102127