
The Use and Effectiveness of Selected Alternative Markers for Insulin Sensitivity and Secretion Compared with Gold Standard Markers in Dietary Intervention Studies in Individuals without Diabetes: Results of a Systematic Review


Abstract
:1. Introduction
2. Materials and Methods
2.1. Search Strategy and Selection Criteria
2.1.1. Inclusion Criteria
2.1.2. Information Sources
2.1.3. Selection Process
2.2. Data Items
2.2.1. Types of Studies
2.2.2. Types of Intervention
2.3. Data Extraction and Quality Assessment
2.4. Data Synthesis and Analysis
3. Results

| Study | Study Design | Country | Subjects Characteristics | Dietary Treatment | Dietary Control | Dose | Sample Size | Duration (Days) | Funding Source |
|---|---|---|---|---|---|---|---|---|---|
| Bogdanski, 2013 [32] | Randomised, double-blind placebo-controlled study | Poland | Obese adults | L-arginine | Placebo | 9 g | 88 males and females | 180 | The Ministry of Science and Higher Education, Poland |
| Chachay, 2014 [41] | Randomised controlled trial | Australia | Healthy subjects (men) | Resveratrol | Placebo | 3000 milligrams | 20 | 56 | Princess Alexandra Research Foundation, the Lions Medical Research Foundation, and the National Health and Medical Research Council of Australia |
| Derosa, 2012 [42] | Randomised, double-blind, controlled study | Italy | Adults with dyslipidaemia | Supplementation with n-3 PUFAs. The diet included 50% calories from carbohydrates, 305 from fat (6% saturated), and 20% from proteins, with a maximum cholesterol content of 300 mg/day and 35 g/day of fibre. | Placebo | 1200 mg of EPA and 1350 mg of DHA | 167 (82 males and 85 females) | 180 | Not disclosed |
| Grimnes, 2011 [43] | Randomised double-blind controlled trial | Norway | Healthy adults | Vitamin D | Placebo | 20,000 IU | 94 males and females | 180 | Norwegian Council of Cardiovascular Disease |
| Hays, 2006 [44] | Randomised controlled trial | United States of America | Elderly adults with impaired glucose tolerance | Low-fat diet and aerobic exercise | Control diet (41%fat, 45%carbohydrate and 14% protein) | Low-fat diet (18% fat, 63% carbohydrate and 19% protein). Aerobic exercise = 4 d/w, 45 min, 75–80% peak heart rate. | 31 (18 females and 13 males) | 84 | National Institutes of Health grants |
| Hokayem, 2013 [45] | Randomised double-blind controlled trial | France | First-degree relatives of type 2 diabetic patients | Grape polyphenols | Placebo | 333.33 mg grape extract/per capsule were taken daily. Three during breakfast and three at dinner | 38 men and women | 63 | French National Research Agency |
| Johnston, 2010 [46] | Single-blind, randomised, parallel nutritional intervention | United Kingdom | Healthy subjects (women) | Resistant starch | Placebo | 40 g per day | 20 | 84 | The National Starch LLC and by infrastructure funding support from the Medical Research Council and the NIHR Biomedical Facility. |
| McAuley, 2002 [47] | Randomised controlled trial | New Zealand | Healthy men and women | Change in diet | Control group was advised to continue their usual diet and exercise during the 4-month experimental period | Modest diet (M): <32% fat, 11% saturated fat, 14% monounsaturated fat, 7% polyunsaturated fat, 50% CHO, 18% protein, cholesterol targets < 200 mg per day and dietary fibre > 25 g per day. Intensive diet (I): <26% fat, <6% saturated fat, 13% monounsaturated fat, 7% polyunsaturated fat, 55% of CHO, 18% protein, cholesterol < 140 mg/day and dietary fibre > 35 g/day | 77 | 120 | The Health Research Council, Otago University, and the Otago Diabetes Research Trust, New Zealand. |
| Sanchez, 1997 [33] | Randomised controlled trial | Spain | Hypertensive patients | Calcium supplementation | Placebo | 1500 mg/day | 20 (12 men and 8 women) | 84 | Not disclosed |
| Tardy, 2009 [48] | Randomised controlled trial | France | Overweight women | Low-trans fatty acids (TFA) diet and ruminant trans-fatty-acids-rich lipids diet. | Industrial Trans Fatty Acid-rich lipids food (5.58 g/d) | Low-TFA lipids/d (0.54 g/d), ruminant TFA–rich lipids (4.86 g/d) | 58 | 28 | Not disclosed |
| Lagerpusch, 2013a [49] | Controlled, parallel-group feeding trial | Germany | Healthy men | Modification of dietary content | During control diet, the 50%CHO group was assigned to a low glycaemic (LGI) diet, while the 65% CHO group was assigned to a high glycaemic diet (HGI). | Participants were divided into two groups differing in macronutrient composition of the diet (50%CHO group: 50% CHO, 35% fat, 15% protein; 65%CHO group: 65% CHO, 20% fat, 15%protein). During refeeding, the 50%CHO and 65%CHO groups were further subdivided into 2 groups (n = 8) receiving either high-fibre LGI or lower-fibre HGI foods. | 32 | 42 | The German Ministry of Education and Research and the German Research Foundation |
| Lagerpusch, 2013b [50] | A controlled, nutritional, intervention study | Germany | Healthy men | Diets and formula meals | The study comprised 1 week of overfeeding (+50% of energy requirement), 3 weeks of energy restriction (−50% of energy requirement), and 2 weeks of refeeding (+50% of energy requirement). During refeeding, subjects were divided into two sub-groups receiving either high-fibre LGI (low-glycaemic index) or HGI (high-glycaemic index) foods. | 16 | 42 | The German Ministry of Education and Research and the German Research Foundation | |
| Guebre-Egziabher, 2008 [51] | Crossover, intervention study | France | Healthy subjects | Dietary changes | Rapeseed oil was supplied with a daily intake of 20 mL and three fish meals per week (100 g of salmon, tuna, mackerel, herring, and sardines) which provided a mean of 1.25 g/day of EPA and DHA. | 17 (10 males and 7 females) | 70 | Association de langue francaise pour l’etude du diabete et autre maladies metaboliques (ALFEDIAM-Servier) and Fondation pour la Recherche Medicale, France. | |
| Le, 2009 [34] | Crossover design | Switzerland | Healthy males with and without a family history of type 2 diabetes | Isocaloric diet or the same isocaloric diet supplemented with fructose | Isocaloric diet = 55% CHO, 30% fat and 15% protein. Fructose supplement (+35% of energy requirements). The fructose provided was equally consumed as a 20% solution with the 3 main meals. | 16 | 42 (7 days of study + 35 washout days) | Supported by grants from the Swiss National Science Foundation and by grants from the Novartis Foundation and Takeda. | |
| Muller, 2015 [52] | Crossover study | Germany | Healthy males | Dietary intervention | 50% of the energy intake was given as a liquid-formula diet. The remaining 50% of energy was provided as a high-glycaemic index and low-glycaemic index meals and snacks | 42 | 32 | The German Ministry of Education and Research, the German Research Foundation, and the BMBF Kompetenznetz Adipositas, Core Domain “Body composition” | |
| Ryan, 2012 [35] | Longitudinal study | United States of America | Obese postmenopausal women with impaired glucose tolerance | Weight loss program | Participants were instructed to reduce their caloric intake by 500 kcal/day | 95 | 180 | The Baltimore Veterans Affairs Medical Research Service, a Veterans Affairs Research Career Scientist Award, the Department of Veterans Affairs and Veterans Affairs Medical Centre GRECC, National Institute on Aging Grants, Claude D. Pepper Older Americans Independence Centre Grant P30-AG-028747, the National Institute of Diabetes and Digestive and Kidney Diseases Mid-Atlantic Nutrition Obesity Research Centre, and the General Clinical Research Centre of the University of Maryland, Baltimore, Maryland. | |
| Brøns, 2004 [53] | Randomised, double-blinded, crossover intervention study | Denmark | Overweight men with a genetic predisposition for type II diabetes mellitus | Taurine | Placebo | 1.5 g | 18 | 112 + 14 wash-out | Steno Diabetes Centre, Gentofte, Denmark and by Aase and Ejnar Danielsens Foundation, Lyngby, Denmark |
| Ryan, 2013 [54] | Randomised crossover study | Australia | Individuals with non-alcoholic fatty liver disease | Mediterranean Diet (MD) | Low fat-high carbohydrate diet (LF/HCD) | The MD high in monounsaturated fats (MUFA) olive oil and omega-3 (ω3PUFA). Total of 40% fat, 40% carbohydrate, and 20% protein. The LF/HCD 30% fat, 50% carbohydrate, and 20% protein | 12 (6 men and 6 women) | 84 + 42 wash-out | NHMRC Neil Hamilton Fairley Fellowship and an Early Career Researcher Grant from the University of Melbourne. |
| Study | Study Design | Country | Subjects Characteristics | Dietary Treatment | Dietary Control | Dose | Sample Size | Duration (Days) | Funding Source |
|---|---|---|---|---|---|---|---|---|---|
| Alemzadeh, 1998 [55] | Randomised controlled trial | United States of America | Obese hyperinsulinaemic adults | Hypocaloric diet +Diazoxide | Hypocaloric diet + placebo | 1260 kcal/day for females and 1570 kcal/day for males comprised of liquid shakes (160 kcal/packet) and bars (150 kcal/bar) for six days. On the seventh day, participants consumed a hypocaloric diet (Optimealplan). Diazoxide 2 mg/kg/day for 8 weeks. | 20 females and 4 males | 56 | The American Heart Association. |
| Osterberg, 2015 [56] | Randomised, double-blind placebo-controlled study | United States of America | Healthy young male adults | High-fat and hypercaloric diet + prebiotic | High-fat and hypercaloric diet + placebo | High-fat diet (55% fat, 30% carbohydrate, and 15% protein). Two sachets of VSL#3 prebiotic (450 billion bacteria per sachet) | 20 | 42 | VSL Pharmaceuticals Inc. |
| Jans, 2012 [57] | Randomised controlled trial | Ireland, Netherlands, Norway, Sweden | Subjects with the metabolic syndrome | Three isoenergetic diets: high MUFA (HMUFA) or two low-fat, high complex carbohydrate diets supplemented with n-3 PUFA | High SFA (HSFA) with a control capsule | HSFA(38%E) = SFA-rich diet (16E% SFA, 12E% mono unsaturated fatty acids (MUFA), 6E% PUFA), HMUFA(38%E) = MUFA-rich diet (8E% SFA, 20E% MUFA, 6E% PUFA), LFHCC(28%E) = high-complex carbohydrate diet (8E% SFA, 11E% MUFA, 6E% PUFA), with a control capsule (1 g per day), LFHCCn-3 = high-complex carbohydrate diet (8E% SFA, 11E% MUFA, 6E% PUFA), with a long-chain n-3 PUFA supplement (1.24 g p/d of eicosapentaenoic and docosahexaenoic acid, ratio 1.4:1) | 84 men and women | 84 | Dutch Diabetes Research Foundation, the Johan Throne Holst Foundation, and Freia Medical Foundation. |
| Ard, 2004 [36] | Randomised study | United States of America | Subjects with above optimal blood pressure through stage 1 hypertension | Established diet (group B) or established + DASH diet (group C) | Advice only (group A) | Group B: Participants received concealing on low sodium/fat diets, an aim of 2.4 g/day or less of sodium and 30% of calories from fat weight loss, moderate alcohol intake, and increased physical activity of at least 180 min per week. minutes a week. Daily goals for group C were similar to those of group B, except goals for 25% of calories from fat, with 7% of calories from saturated fat; 9–12 servings of fruits and vegetables per day; and 2–3 servings of low-fat dairy per day | 52 men and women | 183 | Not disclosed |
| Davy, 2002 [58] | Randomised trial | United States of America | Healthy men | Oat cereal | Wheat cereal | Oat group: 60 g of Quaker Oatmeal and 76 g of Quaker oat bran ready-to-eat cold cereal. Wheat group: consumed 60 g of Mother’s whole-wheat hot natural cereal and 81 g of frosted mini wheats. | 36 men, 18 per group | 84 | The Quaker Oats Company |
| Kolehmainen, 2012 [59] | Randomised controlled dietary intervention | Finland | Individuals with features of metabolic syndrome. | Fresh bilberries | Habitual diet | 400 g of fresh bilberries | 27 men and women | 112 | Tekes—the Finnish Funding Agency for Technology and Innovation, the Academy of Finland, the Nordic Centre of Excellence on Systems Biology in Controlled Dietary Interventions and Cohort Studies, the European Nutrigenomics Organisation, the Yrj¨o Jahnsson Foundation, the Juho Vainio Foundation, the ABS Graduate School, and the Medical Research Fund of Tam pere University Hospital. |
| Larson-Meyer, 2006 [37] | Randomised study | Australia | Overweight subjects | Participants were randomised into three groups: calorie restriction (CR), calorie restriction + energy expenditure through structured exercise (CREX), and weight loss by a low-calorie diet followed by weight maintenance for 6 months (LCD) | Control diet (100% requirements) | CR = 25% calorie restriction, CREX = 12.5% calorie restriction +12.5% energy expenditure through structured exercise, LCD = 15% weight loss by a low-calorie diet followed by weight maintenance for 6 months | 46 men and women | 180 | The National Health and Medical Research Council of Australia |
| Tierney, 2011 [60] | Randomised dietary intervention study | Ireland, United Kingdom, France, Sweden, Poland, Netherlands, Spain and Norway | Subjects with metabolic syndrome | Participants were randomised to four different diets: high-fat SFA-rich diet (high SFA (HSFA), high-fat MUFA-rich diet (HMUFAs), isoenergetic low-fat, high complex carbohydrate diet (LFHCC), isoenergetic low-fat, high complex carbohydrate diet (LFHCC n-3) | HSFA = 38% energy from fat and SFA-rich diet (16% SFA, 12% MUFA, 6% PUFA). HMUFAs = 38% energy from fat, MUFA-rich diet (8% SFA, 20% MUFA, 6% PUFA). LFHCC = 28% energy from fat (8% SFA, 11% MUFA, 6% PUFA) with 1 g day high oleic sunflower oil supplement. LFHCC n-3 = 28% energy from fat (8% SFA, 11% MUFA, 6% PUFA) with 1.24 g day VLC n-3 PUFA supplement | 417 (185 males and 232 females) | 84 | The EU 6 Framework Food Safety and Quality Programme, ‘Diet, genomics, and the metabolic syndrome: an integrated nutrition, agro-food, social and economic analyses. The Norwegian Foundation for Health and Rehabilitation, South-Eastern Norway Regional Health Authority, the Johan Throne Holst Foundation for Nutrition Research, and the Freia Medical Research Foundation. | |
| Brady, 2004 [61] | 2-period, parallel dietary intervention | United Kingdom | Indian Asians (males) | Participants were randomly assigned to consume the high (corn oil-based) n-6 PUFA cooking oils and spread them with their usual diet for the first six weeks. For the second 6-weeks of the study the participants consumed a daily supplement of n-3 LC-PUFA. | 16 g of spread, 21 g from cooking oils per day. Daily supplement: 4.0 g of fish oil, 2.5 g of EPA + DHA | 29 | 84 | Food Standards Agency of the United Kingdom | |
| Fava, 2013 [62] | Randomised, controlled, single-blind, parallel design | United Kingdom | Men and women, aged between 30 and 65 years, with normal hepatic and renal function. | Participants followed a 4-week run-in reference diet that was a high saturated fat diet (HS; saturated fatty acids, SFA)- high glycemic index (GI) diet (38% fat), after which they were randomly assigned to either continue with the reference diet or one of four experimental diets HM/LGI, HC/HGI, HM/HGI or HC/LGI | HS: total fat 38%E, SFA 18%E, MUFA 12%E, PUFA 6%E, CHO 45%E, GI 64%. | HM/HGI: total fat 38%E, SFA 10%E, MUFA 20%E, PUFA 6%E, CHO 45%E, GI 64%; HM/LGI: total fat 38%E, SFA 10%E, MUFA 20%E, PUFA 6%E, CHO 45%E, GI 53%; HC/HGI: total fat 28%E, SFA 10%E, MUFA 11%E, PUFA 6%E, CHO 55%E, GI 64%; HC/LGI: total fat 28%E, SFA 10%E, MUFA 11E, PUFA 6%E, CHO 55%E, GI 51%. | 88, 43 men and 45 women | 196 | UK Food Standards Agency |
| Giacco, 2013 [63] | Randomised, controlled, parallel-group design | Italy and Finland | Healthy subjects | Diet based on wholegrain | Refined cereals | The wholegrain diet in Naples (Italy): wholegrain products include whole wheat bread (plus some endosperm rye bread), whole wheat pasta, barley kernels, wholegrain oat biscuits, and breakfast cereals (all bran sticks and flakes). Participants in Kuopio (Finland) were advised to replace their habitual potato consumption with 210 g dry weight of whole wheat pasta per week and were given whole oat biscuits for snacks. | 123 men and women | 84 | European Commission in the 6th Framework Programme, Project HEALTHGRAIN, by Raisio Plc Research Foundation (JL), the Nordic Centre of Excellence projects “HELGA whole grains and health”, “SYSDIET Systems biology in controlled dietary interventions and cohort studies” (MK, US, MU). Barilla G&R F.lli. SpA, Parma, Italy and Raiso Nutrition Ltd., Finland. |
| Juntunen, 2003 [64] | Randomised crossover trial | Finland | Healthy postmenopausal women. | Participants consumed high-fibre rye bread and white-wheat bread. Participants acted as their controls. | One portion of rye bread contained on average 206 kJ and 4.4 g of fibre. One portion of wheat bread contained 241 kJ and 0.6 g of fibre. A minimum of 4–5 portions of the test bread had to be eaten each day, and the number of portions to be eaten varied according to the daily energy intake of the individual. | 20 | 56 + 56 wash-out days | Not disclosed | |
| Kien, 2013 [40] | Two-treatment, Two-period, two-sequence crossover design. | United States of America | Young adults. | All subjects ingested a low-fat/low-PA (palmitic acid), baseline control diet for 7 days. Then, subjects participated in a crossover study of two 3-week experimental diets. One diet was designed to resemble the habitual diet and was high in PA (HPA) or a diet low in PA and high in OA (oleic acid) (HOA) | HPA = 40.4% kcal; PA, 16.0% kcal; and OA, 16.2% kcal. HOA = 40.1% kcal; 2.4% kcal; and 28.8% kcal, respectively | 18 men and women | 28 + 7 wash-out days | National Institutes of Health Grants, and the National Centre for Research Resources, National Institutes of Health, U.S. Public Health Service. | |
| Douglas, 2006 [65] | Crossover design | United States of America | Women with polycystic ovary syndrome | Low carbohydrate diet (Low CHO), MUFA diet (monounsaturated fatty acid), and STD diet (standard diet) | The CHO diet comprised 2014 calories, 43% of CHO, 45% of fat, and 15% of proteins. The MUFA diet comprised 2006 calories, 55% of CHO, 15% of proteins, and 33% of fats | STD diet comprised 56% CHO, 31% fat and 16% protein, and 2000 calories | 11 | 48 + 42 wash-out days | Not disclosed |
| Paniagua, 2007 [38] | Crossover design | Spain | Insulin resistant subjects | Participants consumed three different diets: (1) diet enriched in saturated fat (SAT), (2) diet rich in monounsaturated fat (MUFA), and (3) diet rich in carbohydrates (CHOs) | CHO diet contained 65% CHO and 20% fat (6%SAT, 8% MUFA, and 6% polyunsaturated fat (PUFA)). The MUFA diet contained 47% CHO and 38% fat (9% SAT, 23% MUFA, 75% of which was provided as an extra virgin olive oil, and 6% PUFA), the rich diet. The SAT diet contained 47% CHO, 15% protein, and 38% fat (23% SAT, 9% MUFA, and 6% MUFA) | 11, 4 men and 7 women | 84 | The Spanish Arteriosclerosis Foundation, the Pharmaceutics Foundation AVEN ZOAR of Seville (2004); the Medical College of Cordova Foundation (2004); and the Secretaria General de Calidad y Eficiencia, Junta de Andalucia (78/02 and 240/04). | |
| Davis, 2012 [39] | Randomised trial | United States of America | Overweight minority adolescents. | Nutrition newsletter | Strength newsletter | The nutrition newsletter covered tips on how to continue to eat foods and drink beverages low in sugar and high in fibre and included one or two new low-sugar or high-fibre recipes. The strength training newsletter covered the benefits of that type of exercise and sample strength-training exercises. | 53 adolescents, 24 males, and 29 females. | 240 | The National Institutes of Cancer, University of Southern California Centre for Transdisciplinary Research on Energetics and Cancer, the National Institute of Child Health and Human Development, the National Cancer Institute (Cancer Control and Epidemiology Research Training Grant), the Dr Robert C. and Veronica Atkins Foundation |
| Davis, 2009 [66] | Randomised controlled trial | United States of America | Overweight Latino adolescents | Nutrition intervention group and Nutrition intervention + strength training group | Control | The dietary intervention targeted two goals: <10% of total daily calorie intake from added sugar and consuming at least 14 g/1000 kcal of dietary fibre a day. The nutrition education + strength training, participants received strength training twice per week (60 min/session). The control group followed their usual diet | 54. Control = 16, nutrition education = 21, nutrition + strength training = 17 | 112 | The National Institutes of Cancer, University of Southern California Centre for Transdisciplinary Research on Energetics and Cancer, the National Institute of Child Health and Human Development, the National Cancer Institute (Cancer Control and Epidemiology Research Training Grant), the Dr Robert C. and Veronica Atkins Foundation |
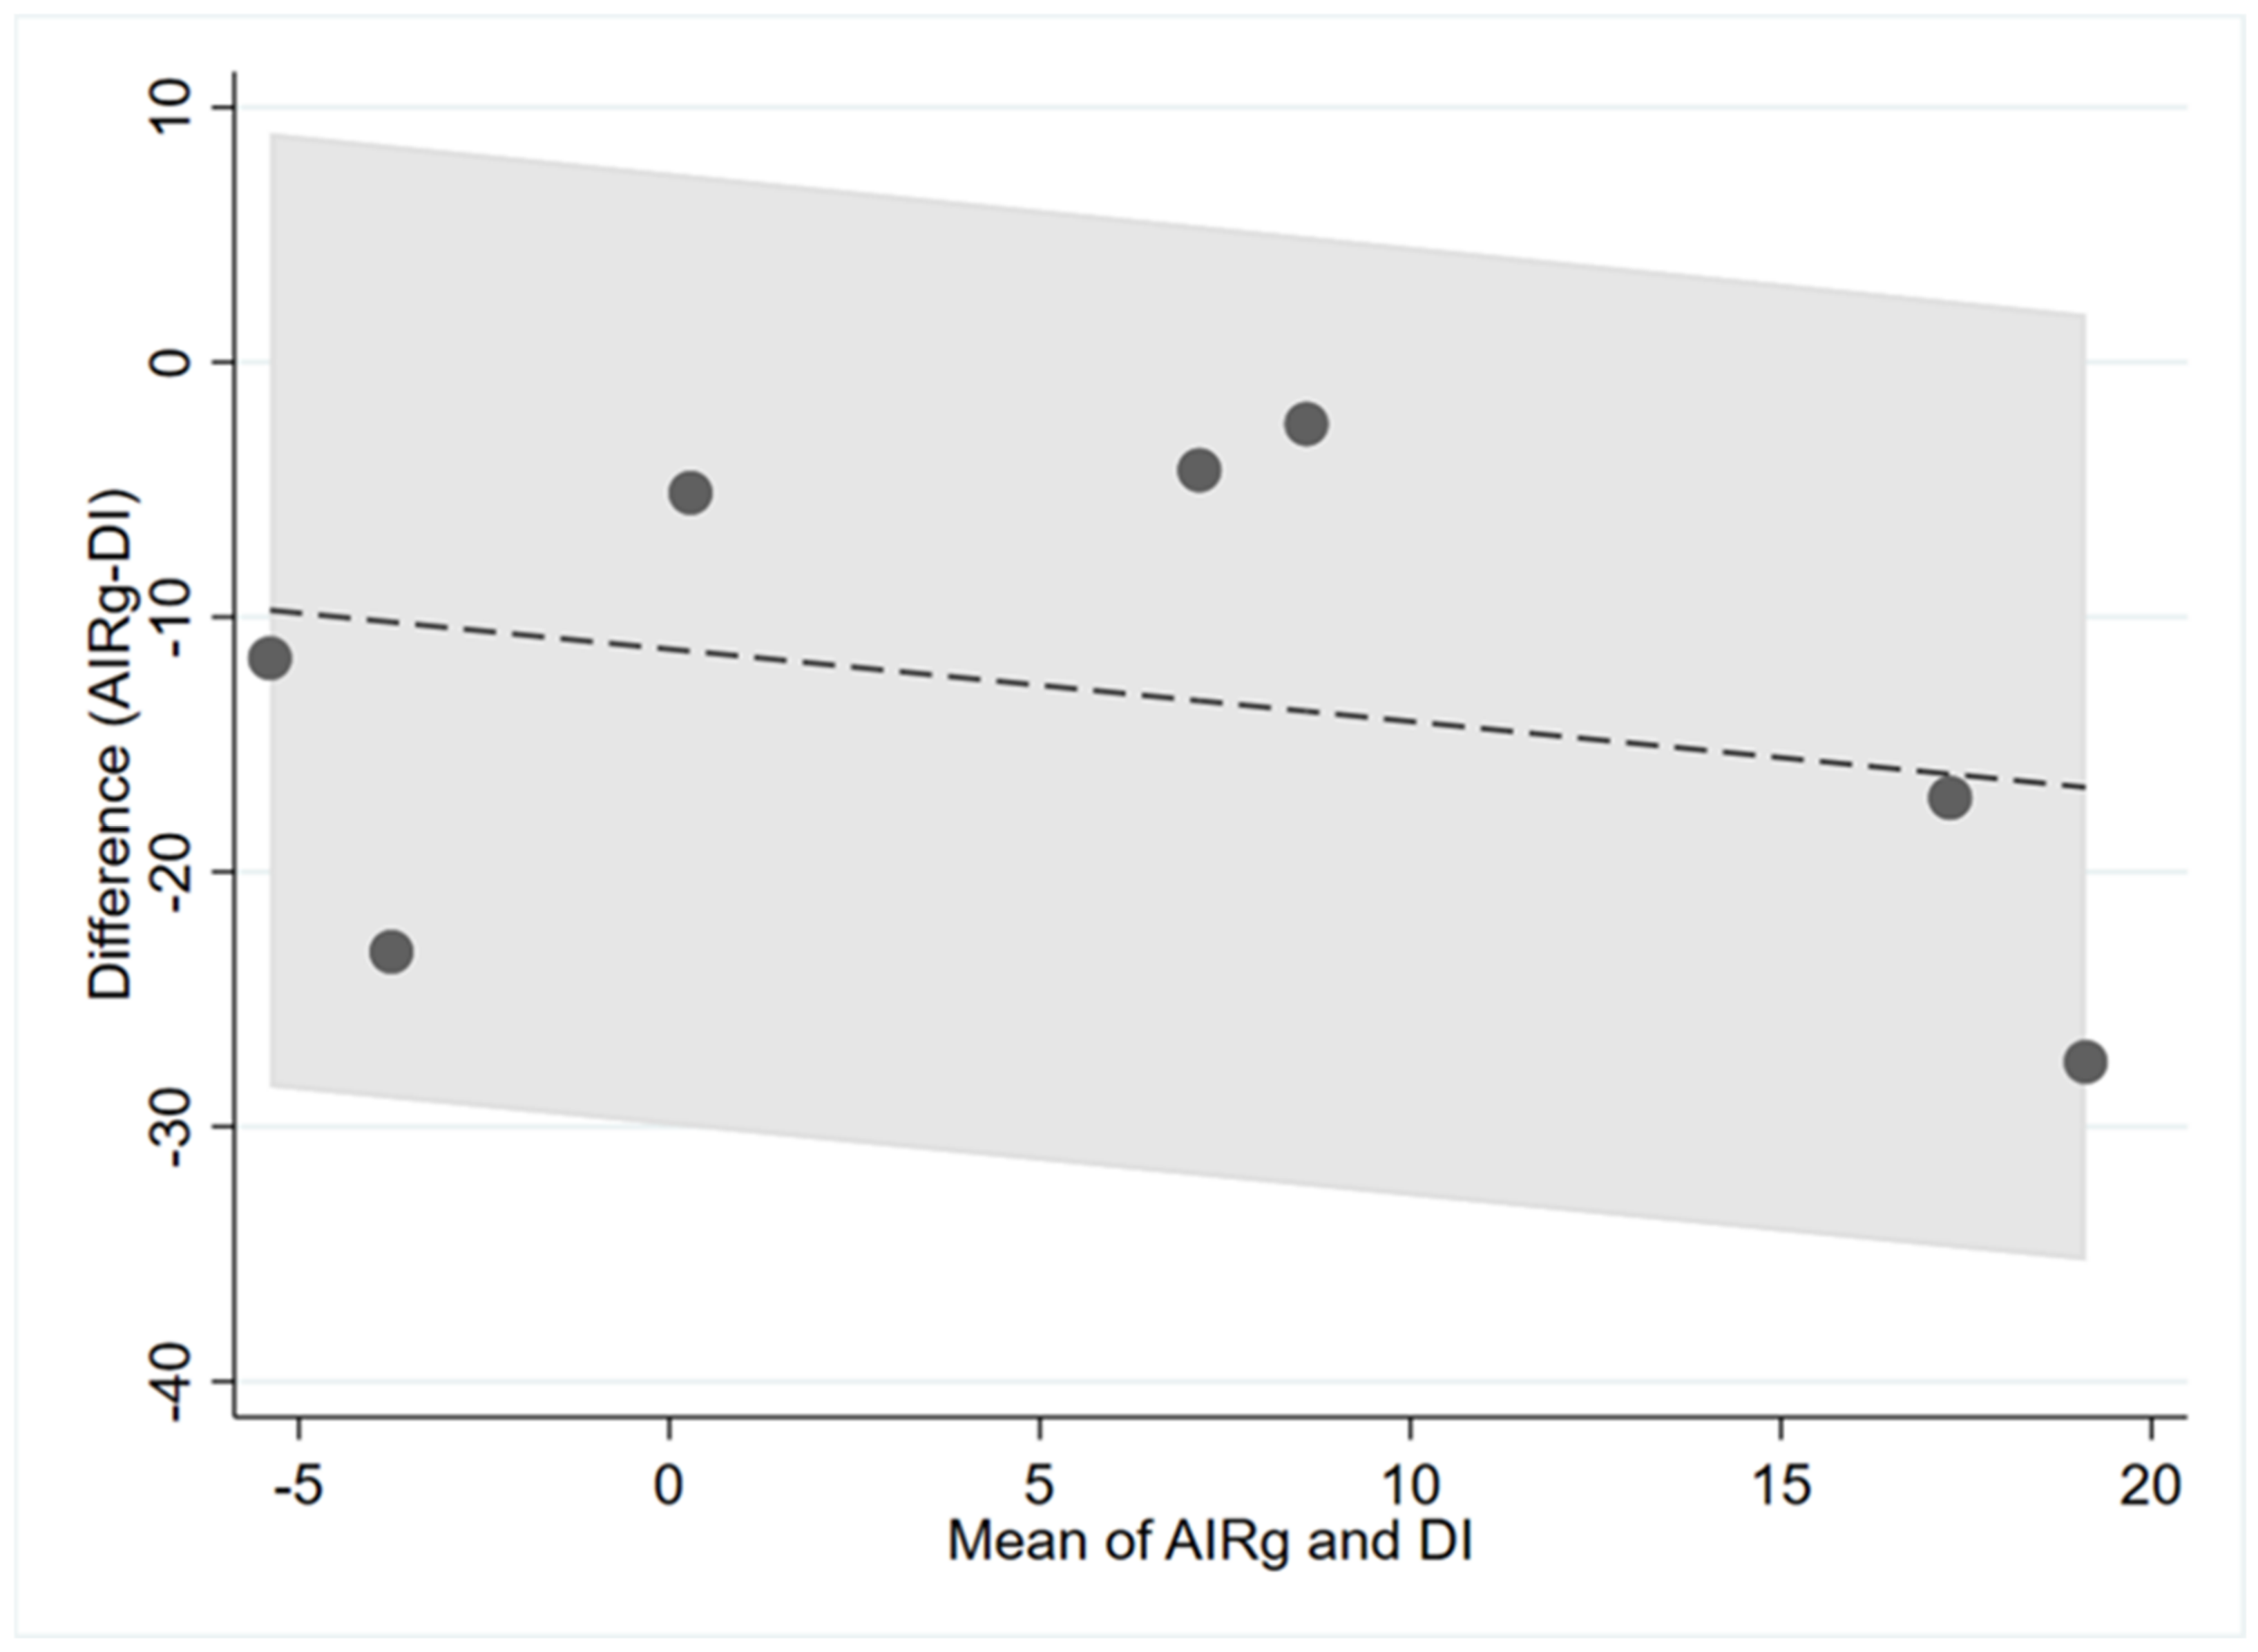
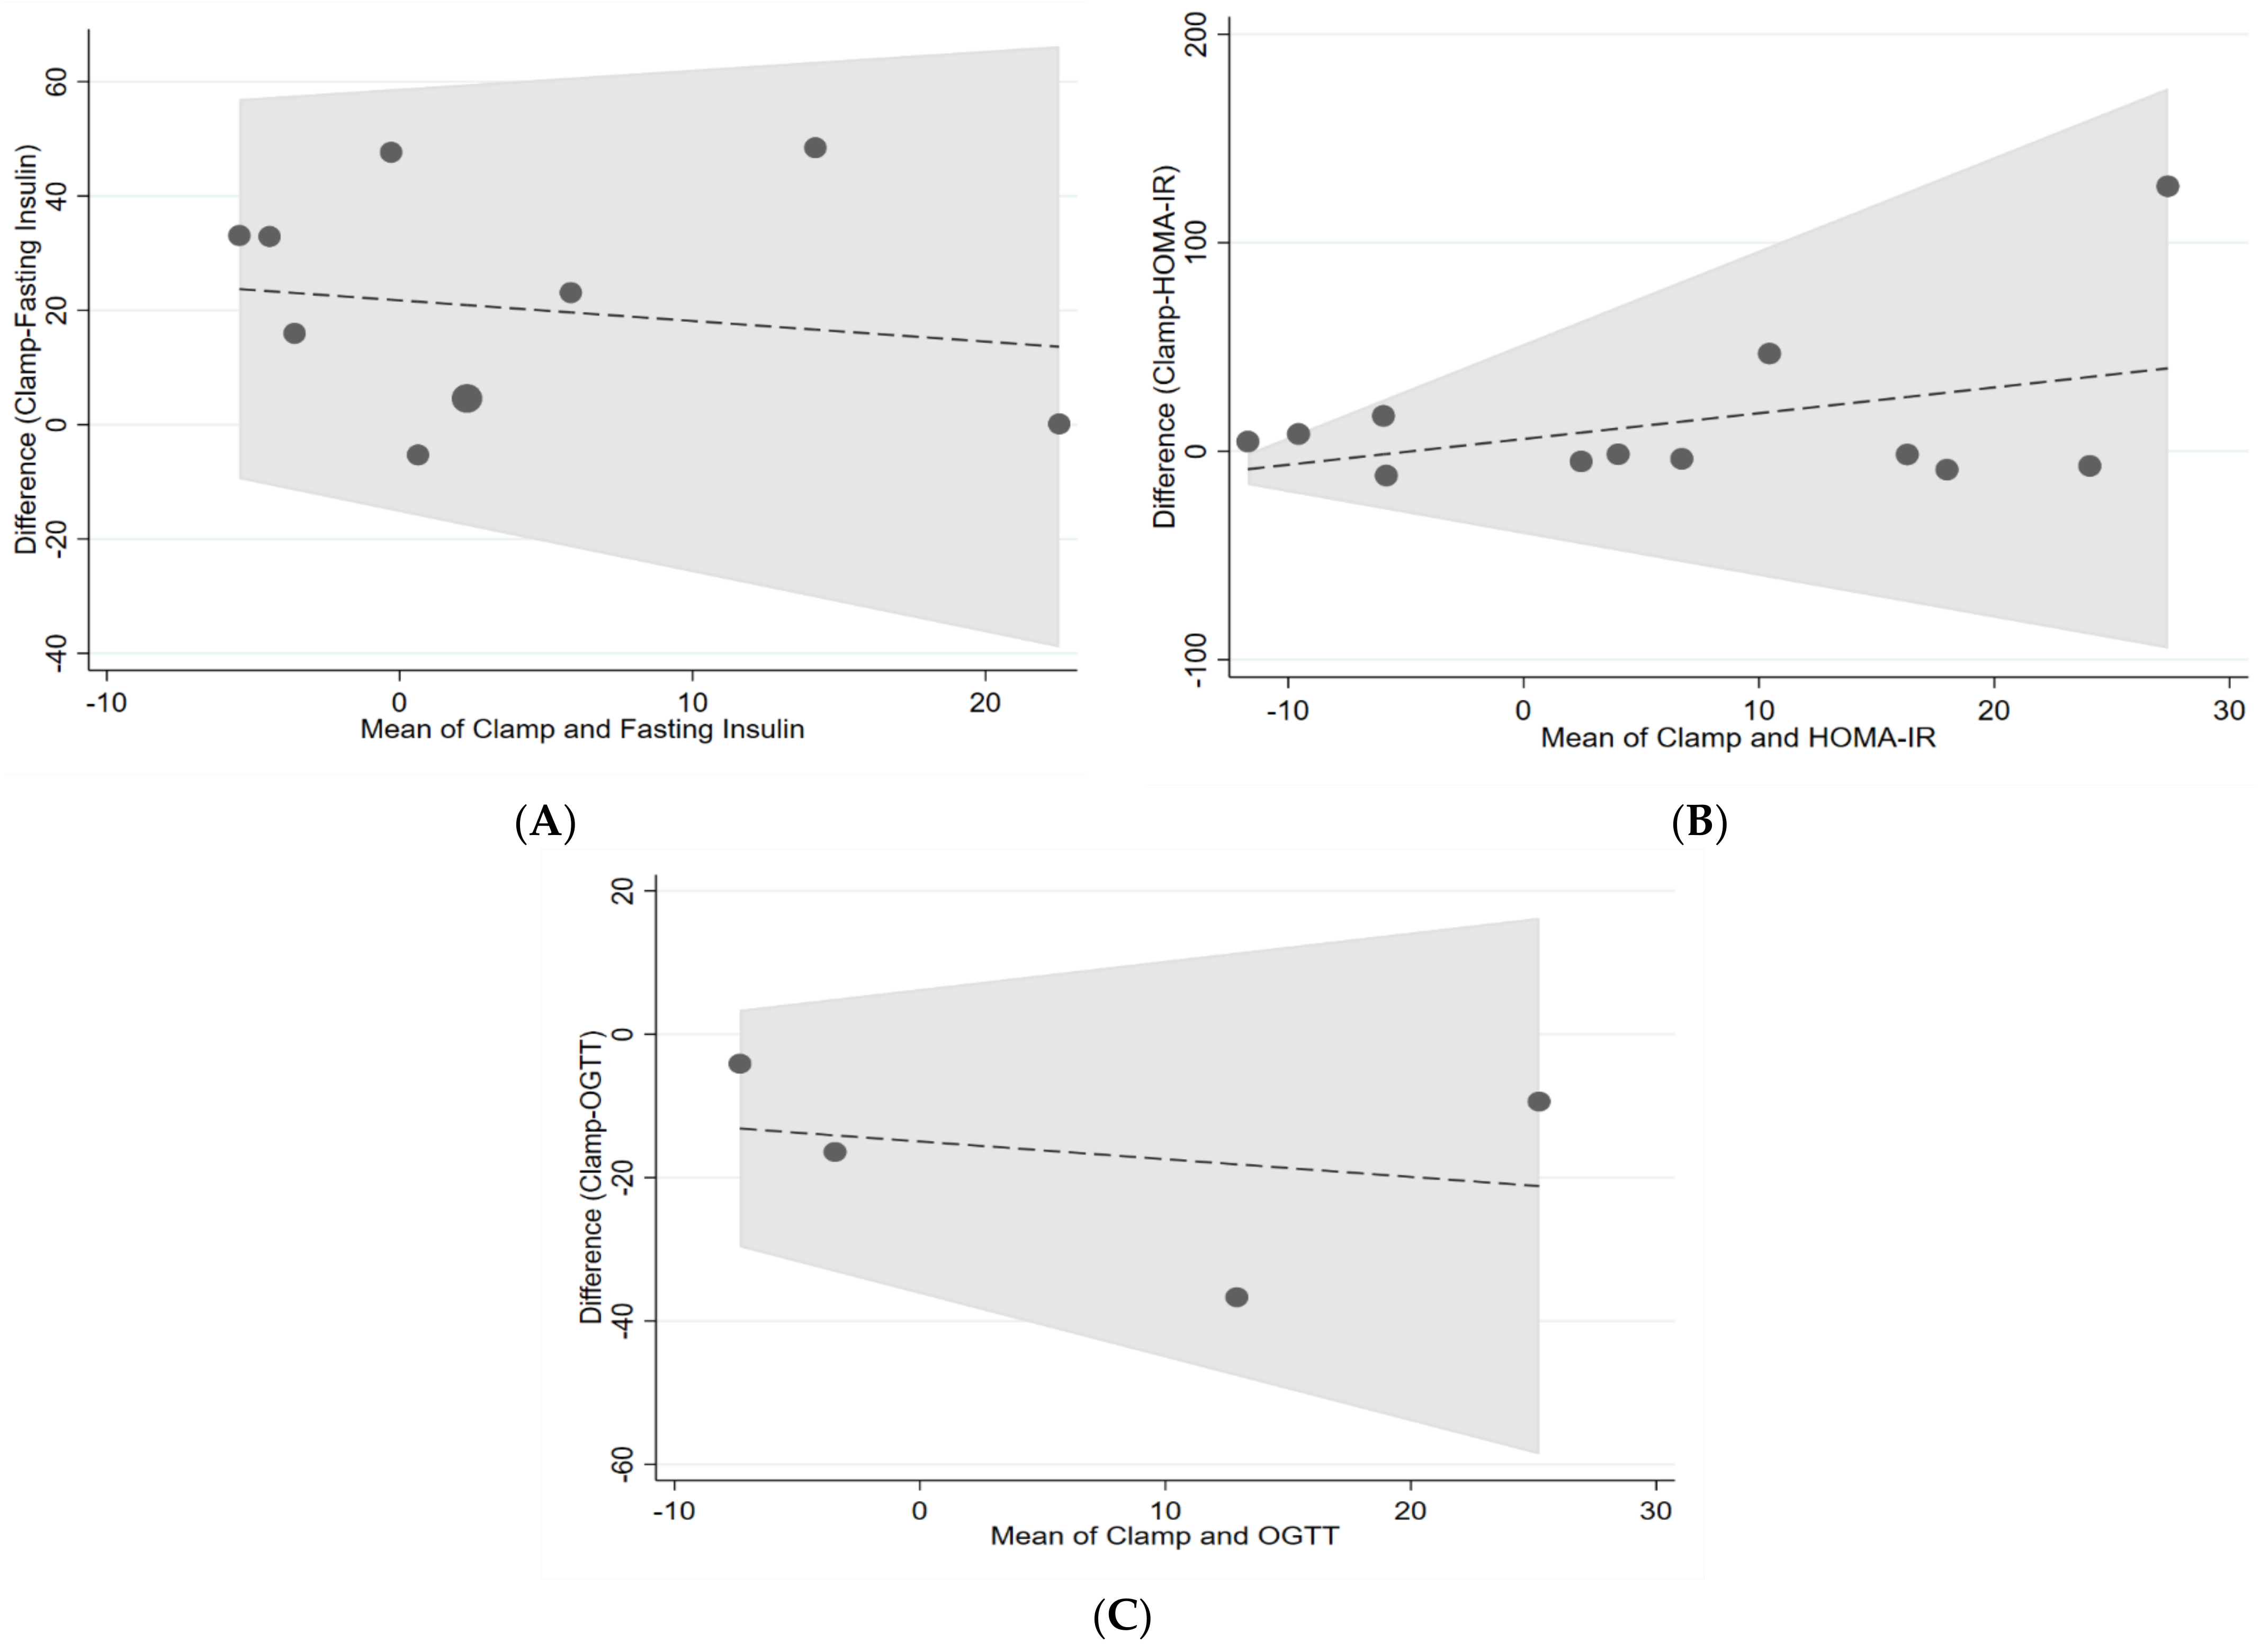
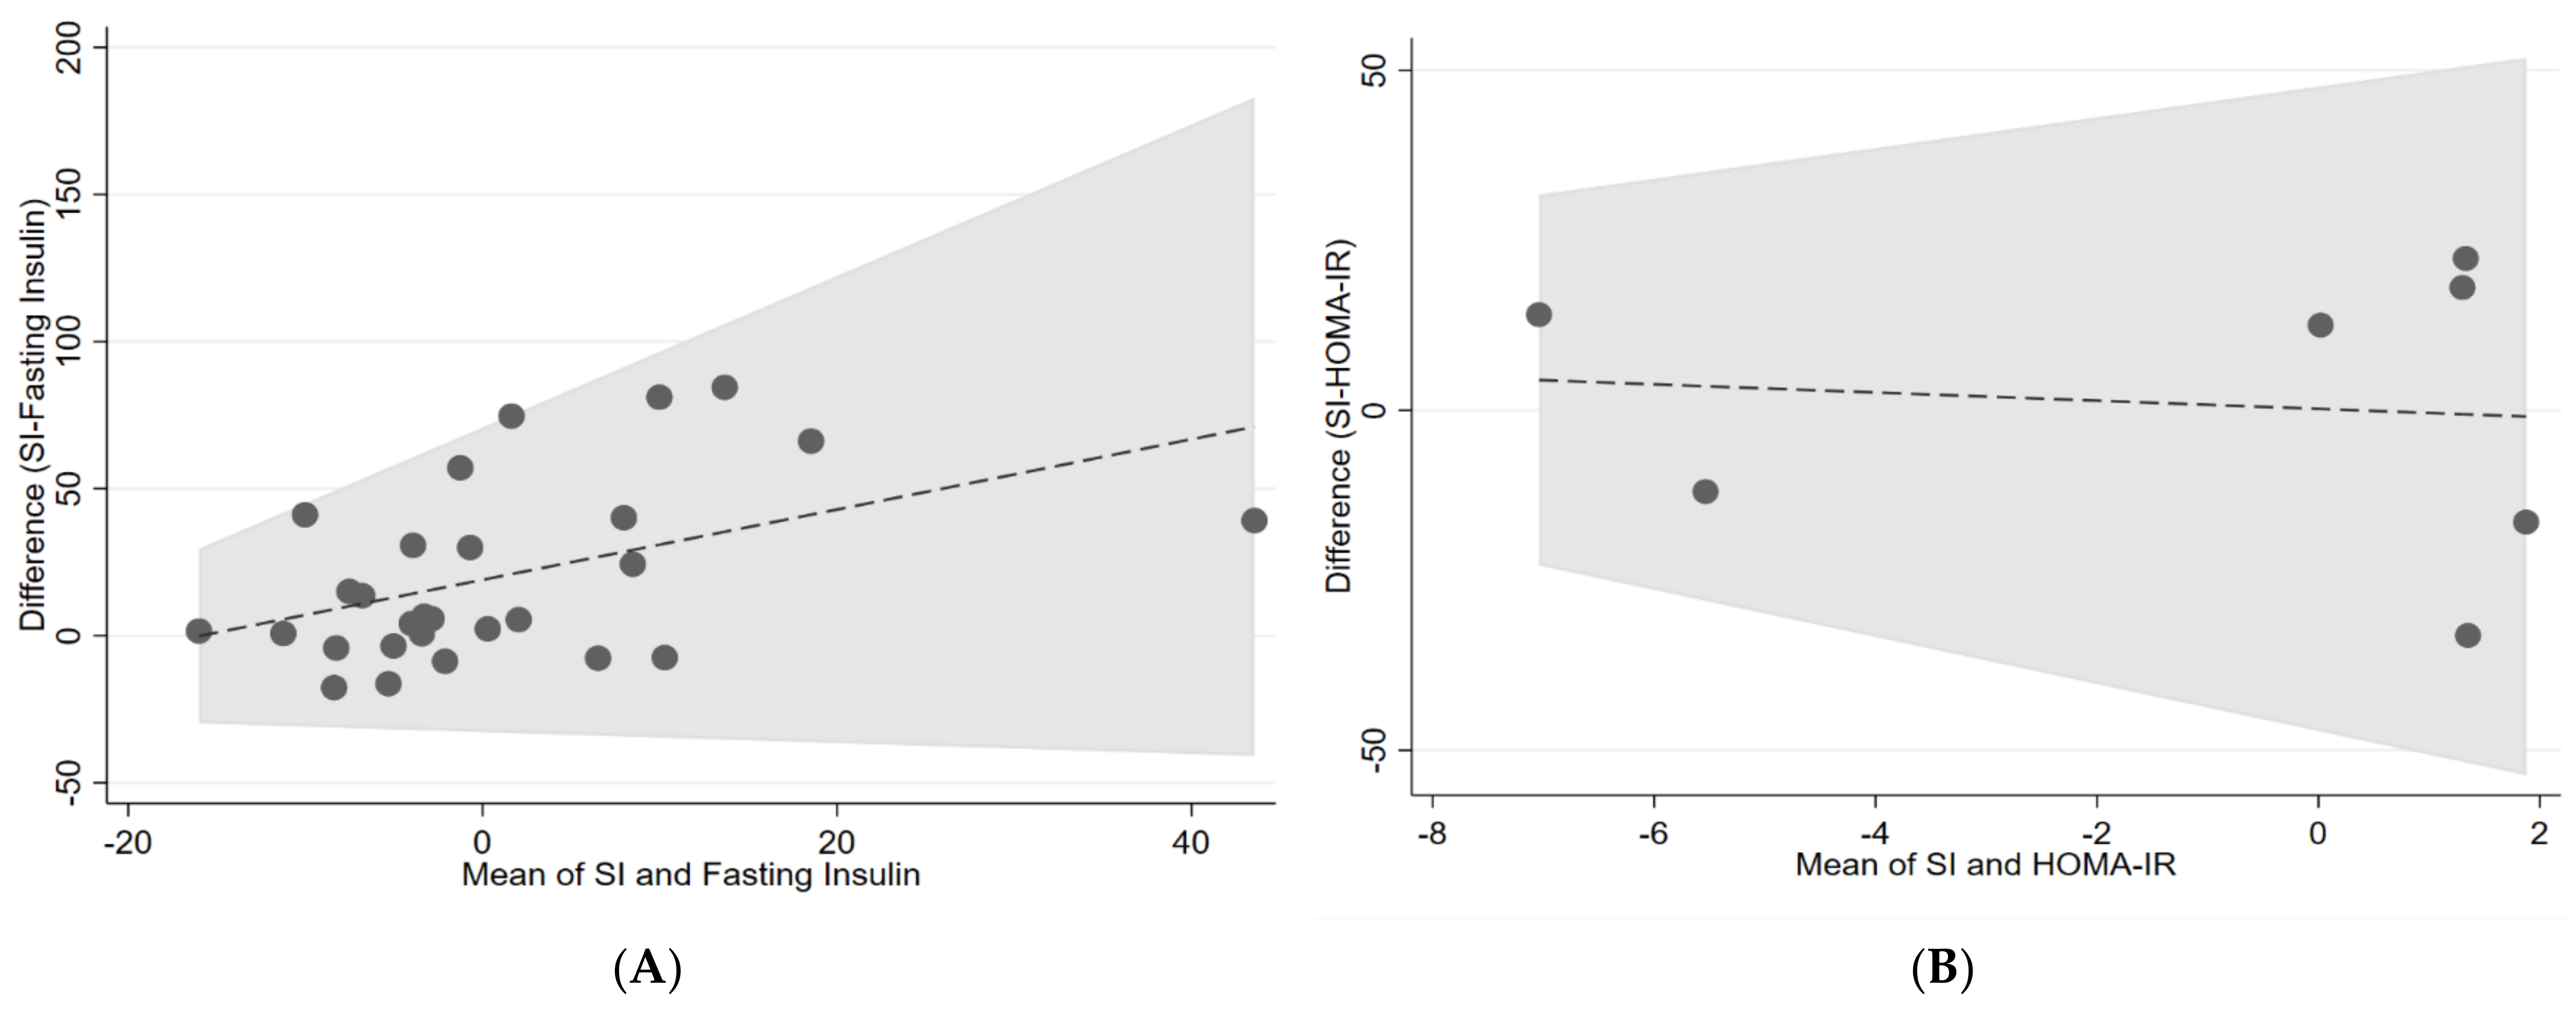
| LCCC | 95% Confidence Intervals | ||
|---|---|---|---|
| AIRg and DI | 0.14 | −0.11 | 0.75 |
| Clamp and fasting insulin | 0.76 | −0.33 | 0.24 |
| Clamp and HOMA-IR | 0.17 | −0.76 | 0.13 |
| Clamp and AUC OGTT | 0.29 | −0.33 | 1.1 |
| IVGTT (Si) and fasting insulin | 0.15 | −0.37 | 0.06 |
| IVGTT (Si) and HOMA-IR | 0 | −1.13 | −0.42 |
| IVGTT (Si) and AUC OGTT | 0.93 | −0.35 | 0.38 |

4. Discussion
5. Conclusions
Supplementary Materials
Author Contributions
Funding
Institutional Review Board Statement
Informed Consent Statement
Data Availability Statement
Acknowledgments
Conflicts of Interest
References
- Federation, I.D. IDF Diabetes Atlas, 10th ed.; International Diabetes Federation: Brussels, Belgium, 2021. [Google Scholar]
- Blindness, G.B.D. Vision Impairment C, Vision Loss Expert Group of the Global Burden of Disease S. Causes of blindness and vision impairment in 2020 and trends over 30 years, and prevalence of avoidable blindness in relation to VISION 2020: The Right to Sight: An analysis for the Global Burden of Disease Study. Lancet Glob. Health 2021, 9, e144–e160. [Google Scholar] [CrossRef]
- Tabák, A.G.; Jokela, M.; Akbaraly, T.N.; Brunner, E.J.; Kivimäki, M.; Witte, D.R. Trajectories of glycaemia, insulin sensitivity, and insulin secretion before diagnosis of type 2 diabetes: An analysis from the Whitehall II study. Lancet 2009, 373, 2215–2221. [Google Scholar] [CrossRef] [Green Version]
- DeFronzo, R.A.; Tobin, J.D.; Andres, R. Glucose clamp technique: A method for quantifying insulin secretion and resistance. Am. J. Physiol. 1979, 237, E214–E223. [Google Scholar] [CrossRef]
- Molina, J.M.; Baron, A.D.; Edelman, S.V.; Brechtel, G.; Wallace, P.; Olefsky, J.M. Use of a variable tracer infusion method to determine glucose turnover in humans. Am. J. Physiol. 1990, 258, E16–E23. [Google Scholar] [CrossRef]
- Bergman, R.N.; Phillips, L.S.; Cobelli, C. Physiologic evaluation of factors controlling glucose tolerance in man: Measurement of insulin sensitivity and beta-cell glucose sensitivity from the response to intravenous glucose. J. Clin. Investig. 1981, 68, 1456–1467. [Google Scholar] [CrossRef] [Green Version]
- Beard, J.C.; Bergman, R.N.; Ward, W.K.; Porte, D., Jr. The insulin sensitivity index in nondiabetic man. Correlation between clamp-derived and IVGTT-derived values. Diabetes 1986, 35, 362–369. [Google Scholar] [CrossRef]
- Finegood, D.T.; Hramiak, I.M.; Dupre, J. A modified protocol for estimation of insulin sensitivity with the minimal model of glucose kinetics in patients with insulin-dependent diabetes. J. Clin. Endocrinol. Metab. 1990, 70, 1538–1549. [Google Scholar] [CrossRef]
- Welch, S.; Gebhart, S.S.; Bergman, R.N.; Phillips, L.S. Minimal model analysis of intravenous glucose tolerance test-derived insulin sensitivity in diabetic subjects. J. Clin. Endocrinol. Metab. 1990, 71, 1508–1518. [Google Scholar] [CrossRef]
- Boston, R.C.; Stefanovski, D.; Moate, P.J.; Sumner, A.E.; Watanabe, R.M.; Bergman, R.N. MINMOD Millennium: A computer program to calculate glucose effectiveness and insulin sensitivity from the frequently sampled intravenous glucose tolerance test. Diabetes Technol. Ther. 2003, 5, 1003–1015. [Google Scholar] [CrossRef] [Green Version]
- Bunt, J.C.; Krakoff, J.; Ortega, E.; Knowler, W.C.; Bogardus, C. Acute insulin response is an independent predictor of type 2 diabetes mellitus in individuals with both normal fasting and 2-h plasma glucose concentrations. Diabetes Metab. Res. Rev. 2007, 23, 304–310. [Google Scholar] [CrossRef] [Green Version]
- Otten, J.; Ahrén, B.; Olsson, T. Surrogate measures of insulin sensitivity vs. the hyperinsulinaemic-euglycaemic clamp: A meta-analysis. Diabetologia 2014, 57, 1781–1788. [Google Scholar] [CrossRef] [PubMed] [Green Version]
- Dalla Man, C.; Campioni, M.; Polonsky, K.S.; Basu, R.; Rizza, R.A.; Toffolo, G.; Cobelli, C. Two-hour seven-sample oral glucose tolerance test and meal protocol: Minimal model assessment of beta-cell responsivity and insulin sensitivity in nondiabetic individuals. Diabetes 2005, 54, 3265–3273. [Google Scholar] [CrossRef] [PubMed] [Green Version]
- Matthews, D.R.; Hosker, J.P.; Rudenski, A.S.; Naylor, B.A.; Treacher, D.F.; Turner, R.C. Homeostasis model assessment: Insulin resistance and beta-cell function from fasting plasma glucose and insulin concentrations in man. Diabetologia 1985, 28, 412–419. [Google Scholar] [CrossRef] [PubMed] [Green Version]
- Katz, A.; Nambi, S.S.; Mather, K.; Baron, A.D.; Follmann, D.A.; Sullivan, G.; Quon, M.J. Quantitative insulin sensitivity check index: A simple, accurate method for assessing insulin sensitivity in humans. J. Clin. Endocrinol. Metab. 2000, 85, 2402–2410. [Google Scholar] [CrossRef] [PubMed]
- Thomas, G.N.; Critchley, J.A.; Tomlinson, B.; Anderson, P.J.; Lee, Z.S.; Chan, J.C. Obesity, independent of insulin resistance, is a major determinant of blood pressure in normoglycemic Hong Kong Chinese. Metabolism 2000, 49, 1523–1528. [Google Scholar] [CrossRef]
- Singh, B.; Saxena, A. Surrogate markers of insulin resistance: A review. World J. Diabetes 2010, 1, 36–47. [Google Scholar] [CrossRef]
- Kahn, S.E.; Prigeon, R.L.; McCulloch, D.K.; Boyko, E.J.; Bergman, R.N.; Schwartz, M.W.; Neifing, J.L.; Ward, W.K.; Beard, J.C.; Palmer, J.P.; et al. Quantification of the relationship between insulin sensitivity and beta-cell function in human subjects. Evidence for a hyperbolic function. Diabetes 1993, 42, 1663–1672. [Google Scholar] [CrossRef]
- Antuna-Puente, B.; Disse, E.; Rabasa-Lhoret, R.; Laville, M.; Capeau, J.; Bastard, J.P. How can we measure insulin sensitivity/resistance? Diabetes Metab. 2011, 37, 179–188. [Google Scholar] [CrossRef]
- Borai, A.; Livingstone, C.; Kaddam, I.; Ferns, G. Selection of the appropriate method for the assessment of insulin resistance. BMC Med. Res. Methodol. 2011, 11, 158. [Google Scholar] [CrossRef] [Green Version]
- Ferrannini, E.; Mari, A. How to measure insulin sensitivity. J. Hypertens. 1998, 16, 895–906. [Google Scholar] [CrossRef]
- Wallace, T.M.; Matthews, D.R. The assessment of insulin resistance in man. Diabet. Med. 2002, 19, 527–534. [Google Scholar] [CrossRef]
- Cobelli, C.; Toffolo, G.M.; Dalla Man, C.; Campioni, M.; Denti, P.; Caumo, A.; Butler, P.; Rizza, R. Assessment of beta-cell function in humans, simultaneously with insulin sensitivity and hepatic extraction, from intravenous and oral glucose tests. Am. J. Physiol. Endocrinol. Metab. 2007, 293, E1–E15. [Google Scholar] [CrossRef]
- Cersosimo, E.; Solis-Herrera, C.; Trautmann, M.E.; Malloy, J.; Triplitt, C.L. Assessment of pancreatic β-cell function: Review of methods and clinical applications. Curr. Diabetes Rev. 2014, 10, 2–42. [Google Scholar] [CrossRef] [Green Version]
- Hannon, T.S.; Kahn, S.E.; Utzschneider, K.M.; Buchanan, T.A.; Nadeau, K.J.; Zeitler, P.S.; Ehrmann, D.A.; Arslanian, S.A.; Caprio, S.; Edelstein, S.L.; et al. Review of methods for measuring β-cell function: Design considerations from the Restoring Insulin Secretion (RISE) Consortium. Diabetes Obes. Metab. 2018, 20, 14–24. [Google Scholar] [CrossRef] [Green Version]
- Pacini, G.; Mari, A. Methods for clinical assessment of insulin sensitivity and beta-cell function. Best Pract. Res. Clin. Endocrinol. Metab. 2003, 17, 305–322. [Google Scholar] [CrossRef]
- Rudvik, A.; Månsson, M. Evaluation of surrogate measures of insulin sensitivity–correlation with gold standard is not enough. BMC Med. Res. Methodol. 2018, 18, 64. [Google Scholar] [CrossRef]
- Lin, L.I. A concordance correlation coefficient to evalu.u.uate reproducibility. Biometrics 1989, 45, 255–268. [Google Scholar] [CrossRef]
- Bland, J.M.; Altman, D.G. Statistical methods for assessing agreement between two methods of clinical measurement. Lancet 1986, 1, 307–310. [Google Scholar] [CrossRef]
- McBride, G. A Proposal for Strength-of-Agreement Criteria for Lin’s Concordance Correlation Coefficient; National Institute of Water & Atmospheric Research: Hamilton, New Zealand, 2005; pp. 307–310. [Google Scholar]
- Sterne, J.A.C.; Savović, J.; Page, M.J.; Elbers, R.G.; Blencowe, N.S.; Boutron, I.; Cates, C.J.; Cheng, H.Y.; Corbett, M.S.; Eldridge, S.M.; et al. RoB 2: A revised tool for assessing risk of bias in randomised trials. Bmj 2019, 366, l4898. [Google Scholar] [CrossRef] [Green Version]
- Bogdanski, P.; Szulinska, M.; Suliburska, J.; Pupek-Musialik, D.; Jablecka, A.; Witmanowski, H. Supplementation with L-arginine favorably influences plasminogen activator inhibitor type 1 concentration in obese patients. A randomized, double blind trial. J. Endocrinol. Invest. 2013, 36, 221–226. [Google Scholar] [CrossRef]
- Sánchez, M.; de la Sierra, A.; Coca, A.; Poch, E.; Giner, V.; Urbano-Márquez, A. Oral calcium supplementation reduces intraplatelet free calcium concentration and insulin resistance in essential hypertensive patients. Hypertension 1997, 29, 531–536. [Google Scholar] [CrossRef] [Green Version]
- Lê, K.A.; Ith, M.; Kreis, R.; Faeh, D.; Bortolotti, M.; Tran, C.; Boesch, C.; Tappy, L. Fructose overconsumption causes dyslipidemia and ectopic lipid deposition in healthy subjects with and without a family history of type 2 diabetes. Am. J. Clin. Nutr. 2009, 89, 1760–1765. [Google Scholar] [CrossRef] [Green Version]
- Ryan, A.S.; Ortmeyer, H.K.; Sorkin, J.D. Exercise with calorie restriction improves insulin sensitivity and glycogen synthase activity in obese postmenopausal women with impaired glucose tolerance. Am. J. Physiol. Endocrinol. Metab. 2012, 302, E145–E152. [Google Scholar] [CrossRef] [Green Version]
- Ard, J.D.; Grambow, S.C.; Liu, D.; Slentz, C.A.; Kraus, W.E.; Svetkey, L.P. The effect of the PREMIER interventions on insulin sensitivity. Diabetes Care 2004, 27, 340–347. [Google Scholar] [CrossRef] [Green Version]
- Larson-Meyer, D.E.; Heilbronn, L.K.; Redman, L.M.; Newcomer, B.R.; Frisard, M.I.; Anton, S.; Smith, S.R.; Alfonso, A.; Ravussin, E. Effect of calorie restriction with or without exercise on insulin sensitivity, beta-cell function, fat cell size, and ectopic lipid in overweight subjects. Diabetes Care 2006, 29, 1337–1344. [Google Scholar] [CrossRef] [Green Version]
- Paniagua, J.A.; Gallego de la Sacristana, A.; Romero, I.; Vidal-Puig, A.; Latre, J.M.; Sanchez, E.; Perez-Martinez, P.; Lopez-Miranda, J.; Perez-Jimenez, F. Monounsaturated fat-rich diet prevents central body fat distribution and decreases postprandial adiponectin expression induced by a carbohydrate-rich diet in insulin-resistant subjects. Diabetes Care 2007, 30, 1717–1723. [Google Scholar] [CrossRef] [Green Version]
- Davis, J.N.; Ventura, E.E.; Tung, A.; Munevar, M.A.; Hasson, R.E.; Byrd-Williams, C.; Vanni, A.K.; Spruijt-Metz, D.; Weigensberg, M.; Goran, M.I. Effects of a randomized maintenance intervention on adiposity and metabolic risk factors in overweight minority adolescents. Pediatr. Obes. 2012, 7, 16–27. [Google Scholar] [CrossRef] [PubMed] [Green Version]
- Kien, C.L.; Bunn, J.Y.; Poynter, M.E.; Stevens, R.; Bain, J.; Ikayeva, O.; Fukagawa, N.K.; Champagne, C.M.; Crain, K.I.; Koves, T.R.; et al. A lipidomics analysis of the relationship between dietary fatty acid composition and insulin sensitivity in young adults. Diabetes 2013, 62, 1054–1063. [Google Scholar] [CrossRef] [PubMed] [Green Version]
- Chachay, V.S.; Macdonald, G.A.; Martin, J.H.; Whitehead, J.P.; O’Moore-Sullivan, T.M.; Lee, P.; Franklin, M.; Klein, K.; Taylor, P.J.; Ferguson, M.; et al. Resveratrol does not benefit patients with nonalcoholic fatty liver disease. Clin. Gastroenterol. Hepatol. 2014, 12, 2092–2103.e6. [Google Scholar] [CrossRef] [PubMed] [Green Version]
- Derosa, G.; Cicero, A.F.; Fogari, E.; D’Angelo, A.; Bonaventura, A.; Romano, D.; Maffioli, P. Effects of n-3 PUFAs on postprandial variation of metalloproteinases, and inflammatory and insulin resistance parameters in dyslipidemic patients: Evaluation with euglycemic clamp and oral fat load. J. Clin. Lipidol. 2012, 6, 553–564. [Google Scholar] [CrossRef] [PubMed]
- Grimnes, G.; Figenschau, Y.; Almås, B.; Jorde, R. Vitamin D, insulin secretion, sensitivity, and lipids: Results from a case-control study and a randomized controlled trial using hyperglycemic clamp technique. Diabetes 2011, 60, 2748–2757. [Google Scholar] [CrossRef] [Green Version]
- Hays, N.P.; Starling, R.D.; Sullivan, D.H.; Fluckey, J.D.; Coker, R.H.; Evans, W.J. Comparison of insulin sensitivity assessment indices with euglycemic-hyperinsulinemic clamp data after a dietary and exercise intervention in older adults. Metabolism 2006, 55, 525–532. [Google Scholar] [CrossRef]
- Hokayem, M.; Blond, E.; Vidal, H.; Lambert, K.; Meugnier, E.; Feillet-Coudray, C.; Coudray, C.; Pesenti, S.; Luyton, C.; Lambert-Porcheron, S.; et al. Grape polyphenols prevent fructose-induced oxidative stress and insulin resistance in first-degree relatives of type 2 diabetic patients. Diabetes Care 2013, 36, 1454–1461. [Google Scholar] [CrossRef] [Green Version]
- Johnston, K.L.; Thomas, E.L.; Bell, J.D.; Frost, G.S.; Robertson, M.D. Resistant starch improves insulin sensitivity in metabolic syndrome. Diabet. Med. 2010, 27, 391–397. [Google Scholar] [CrossRef]
- McAuley, K.A.; Williams, S.M.; Mann, J.I.; Goulding, A.; Chisholm, A.; Wilson, N.; Story, G.; McLay, R.T.; Harper, M.J.; Jones, I.E. Intensive lifestyle changes are necessary to improve insulin sensitivity: A randomized controlled trial. Diabetes Care 2002, 25, 445–452. [Google Scholar] [CrossRef] [Green Version]
- Tardy, A.L.; Lambert-Porcheron, S.; Malpuech-Brugère, C.; Giraudet, C.; Rigaudière, J.P.; Laillet, B.; Leruyet, P.; Peyraud, J.L.; Boirie, Y.; Laville, M.; et al. Dairy and industrial sources of trans fat do not impair peripheral insulin sensitivity in overweight women. Am. J. Clin. Nutr. 2009, 90, 88–94. [Google Scholar] [CrossRef] [Green Version]
- Lagerpusch, M.; Enderle, J.; Later, W.; Eggeling, B.; Pape, D.; Müller, M.J.; Bosy-Westphal, A. Impact of glycaemic index and dietary fibre on insulin sensitivity during the refeeding phase of a weight cycle in young healthy men. Br. J. Nutr. 2013, 109, 1606–1616. [Google Scholar] [CrossRef] [Green Version]
- Lagerpusch, M.; Enderle, J.; Eggeling, B.; Braun, W.; Johannsen, M.; Pape, D.; Müller, M.J.; Bosy-Westphal, A. Carbohydrate quality and quantity affect glucose and lipid metabolism during weight regain in healthy men. J. Nutr. 2013, 143, 1593–1601. [Google Scholar] [CrossRef] [Green Version]
- Guebre-Egziabher, F.; Rabasa-Lhoret, R.; Bonnet, F.; Bastard, J.P.; Desage, M.; Skilton, M.R.; Vidal, H.; Laville, M. Nutritional intervention to reduce the n-6/n-3 fatty acid ratio increases adiponectin concentration and fatty acid oxidation in healthy subjects. Eur. J. Clin. Nutr. 2008, 62, 1287–1293. [Google Scholar] [CrossRef]
- Müller, M.J.; Enderle, J.; Pourhassan, M.; Braun, W.; Eggeling, B.; Lagerpusch, M.; Glüer, C.C.; Kehayias, J.J.; Kiosz, D.; Bosy-Westphal, A. Metabolic adaptation to caloric restriction and subsequent refeeding: The Minnesota Starvation Experiment revisited. Am. J. Clin. Nutr. 2015, 102, 807–819. [Google Scholar] [CrossRef]
- Brøns, C.; Spohr, C.; Storgaard, H.; Dyerberg, J.; Vaag, A. Effect of taurine treatment on insulin secretion and action, and on serum lipid levels in overweight men with a genetic predisposition for type II diabetes mellitus. Eur. J. Clin. Nutr. 2004, 58, 1239–1247. [Google Scholar] [CrossRef] [PubMed]
- Ryan, M.C.; Itsiopoulos, C.; Thodis, T.; Ward, G.; Trost, N.; Hofferberth, S.; O’Dea, K.; Desmond, P.V.; Johnson, N.A.; Wilson, A.M. The Mediterranean diet improves hepatic steatosis and insulin sensitivity in individuals with non-alcoholic fatty liver disease. J. Hepatol. 2013, 59, 138–143. [Google Scholar] [CrossRef] [PubMed]
- Alemzadeh, R.; Langley, G.; Upchurch, L.; Smith, P.; Slonim, A.E. Beneficial effect of diazoxide in obese hyperinsulinemic adults. J. Clin. Endocrinol. Metab. 1998, 83, 1911–1915. [Google Scholar] [CrossRef] [PubMed]
- Osterberg, K.L.; Boutagy, N.E.; McMillan, R.P.; Stevens, J.R.; Frisard, M.I.; Kavanaugh, J.W.; Davy, B.M.; Davy, K.P.; Hulver, M.W. Probiotic supplementation attenuates increases in body mass and fat mass during high-fat diet in healthy young adults. Obesity 2015, 23, 2364–2370. [Google Scholar] [CrossRef]
- Jans, A.; van Hees, A.M.; Gjelstad, I.M.; Sparks, L.M.; Tierney, A.C.; Risérus, U.; Drevon, C.A.; Schrauwen, P.; Roche, H.M.; Blaak, E.E. Impact of dietary fat quantity and quality on skeletal muscle fatty acid metabolism in subjects with the metabolic syndrome. Metabolism 2012, 61, 1554–1565. [Google Scholar] [CrossRef]
- Davy, B.M.; Davy, K.P.; Ho, R.C.; Beske, S.D.; Davrath, L.R.; Melby, C.L. High-fiber oat cereal compared with wheat cereal consumption favorably alters LDL-cholesterol subclass and particle numbers in middle-aged and older men. Am. J. Clin. Nutr. 2002, 76, 351–358. [Google Scholar] [CrossRef]
- Kolehmainen, M.; Mykkänen, O.; Kirjavainen, P.V.; Leppänen, T.; Moilanen, E.; Adriaens, M.; Laaksonen, D.E.; Hallikainen, M.; Puupponen-Pimiä, R.; Pulkkinen, L.; et al. Bilberries reduce low-grade inflammation in individuals with features of metabolic syndrome. Mol. Nutr. Food Res. 2012, 56, 1501–1510. [Google Scholar] [CrossRef] [Green Version]
- Tierney, A.C.; McMonagle, J.; Shaw, D.I.; Gulseth, H.L.; Helal, O.; Saris, W.H.; Paniagua, J.A.; Gołąbek-Leszczyñska, I.; Defoort, C.; Williams, C.M.; et al. Effects of dietary fat modification on insulin sensitivity and on other risk factors of the metabolic syndrome—LIPGENE: A European randomized dietary intervention study. Int. J. Obes. 2011, 35, 800–809. [Google Scholar] [CrossRef] [Green Version]
- Brady, L.M.; Lovegrove, S.S.; Lesauvage, S.V.; Gower, B.A.; Minihane, A.M.; Williams, C.M.; Lovegrove, J.A. Increased n-6 polyunsaturated fatty acids do not attenuate the effects of long-chain n-3 polyunsaturated fatty acids on insulin sensitivity or triacylglycerol reduction in Indian Asians. Am. J. Clin. Nutr. 2004, 79, 983–991. [Google Scholar] [CrossRef] [Green Version]
- Fava, F.; Gitau, R.; Griffin, B.A.; Gibson, G.R.; Tuohy, K.M.; Lovegrove, J.A. The type and quantity of dietary fat and carbohydrate alter faecal microbiome and short-chain fatty acid excretion in a metabolic syndrome ‘at-risk’ population. Int. J. Obes. 2013, 37, 216–223. [Google Scholar] [CrossRef] [Green Version]
- Giacco, R.; Lappi, J.; Costabile, G.; Kolehmainen, M.; Schwab, U.; Landberg, R.; Uusitupa, M.; Poutanen, K.; Pacini, G.; Rivellese, A.A.; et al. Effects of rye and whole wheat versus refined cereal foods on metabolic risk factors: A randomised controlled two-centre intervention study. Clin. Nutr. 2013, 32, 941–949. [Google Scholar] [CrossRef]
- Juntunen, K.S.; Laaksonen, D.E.; Poutanen, K.S.; Niskanen, L.K.; Mykkänen, H.M. High-fiber rye bread and insulin secretion and sensitivity in healthy postmenopausal women. Am. J. Clin. Nutr. 2003, 77, 385–391. [Google Scholar] [CrossRef] [Green Version]
- Douglas, C.C.; Gower, B.A.; Darnell, B.E.; Ovalle, F.; Oster, R.A.; Azziz, R. Role of diet in the treatment of polycystic ovary syndrome. Fertil. Steril. 2006, 85, 679–688. [Google Scholar] [CrossRef] [Green Version]
- Davis, J.N.; Kelly, L.A.; Lane, C.J.; Ventura, E.E.; Byrd-Williams, C.E.; Alexandar, K.A.; Azen, S.P.; Chou, C.P.; Spruijt-Metz, D.; Weigensberg, M.J.; et al. Randomized control trial to improve adiposity and insulin resistance in overweight Latino adolescents. Obesity 2009, 17, 1542–1548. [Google Scholar] [CrossRef] [Green Version]
- Knowler, W.C.; Barrett-Connor, E.; Fowler, S.E.; Hamman, R.F.; Lachin, J.M.; Walker, E.A.; Nathan, D.M. Reduction in the incidence of type 2 diabetes with lifestyle intervention or metformin. N. Engl. J. Med. 2002, 346, 393–403. [Google Scholar] [CrossRef]
- Astrup, A.; Ryan, L.; Grunwald, G.K.; Storgaard, M.; Saris, W.; Melanson, E.; Hill, J.O. The role of dietary fat in body fatness: Evidence from a preliminary meta-analysis of ad libitum low-fat dietary intervention studies. Br. J. Nutr. 2000, 83 (Suppl. S1), S25–S32. [Google Scholar] [CrossRef] [Green Version]
- Risérus, U.; Willett, W.C.; Hu, F.B. Dietary fats and prevention of type 2 diabetes. Prog. Lipid Res. 2009, 48, 44–51. [Google Scholar] [CrossRef] [Green Version]
- Laaksonen, D.E.; Toppinen, L.K.; Juntunen, K.S.; Autio, K.; Liukkonen, K.H.; Poutanen, K.S.; Niskanen, L.; Mykkänen, H.M. Dietary carbohydrate modification enhances insulin secretion in persons with the metabolic syndrome. Am. J. Clin. Nutr. 2005, 82, 1218–1227. [Google Scholar] [CrossRef] [Green Version]
- Katsuki, A.; Sumida, Y.; Urakawa, H.; Gabazza, E.C.; Murashima, S.; Morioka, K.; Kitagawa, N.; Tanaka, T.; Araki-Sasaki, R.; Hori, Y.; et al. Neither homeostasis model assessment nor quantitative insulin sensitivity check index can predict insulin resistance in elderly patients with poorly controlled type 2 diabetes mellitus. J. Clin. Endocrinol. Metab. 2002, 87, 5332–5335. [Google Scholar] [CrossRef] [Green Version]
- Faerch, K.; Brøns, C.; Alibegovic, A.C.; Vaag, A. The disposition index: Adjustment for peripheral vs. hepatic insulin sensitivity? J. Physiol. 2010, 588, 759–764. [Google Scholar] [CrossRef]
- Watson, P.F.; Petrie, A. Method agreement analysis: A review of correct methodology. Theriogenology 2010, 73, 1167–1179. [Google Scholar] [CrossRef] [Green Version]

| Number | Search String |
|---|---|
| 1 | (insulin-secreting cells[MeSH Terms] OR insulin secretion[Title/Abstract] OR intravenous glucose tolerance[Title/Abstract] OR glucose tolerance test[MeSH Terms] OR hyperglycaemic clamp[Title/Abstract] OR hyperglycemic clamp[Title/Abstract] OR insulin resistance[MeSH Terms] OR insulin resistance[Title/Abstract] OR glucose clamp technique[MeSH Terms]) |
| 2 | (diet[MeSH Terms] OR diet[Title/Abstract] OR dietary[title/abstract] OR food[MeSH Terms] OR nutrition[MeSH Terms]) AND (intervention[Title/Abstract] OR trial[Title/Abstract]) |
Publisher’s Note: MDPI stays neutral with regard to jurisdictional claims in published maps and institutional affiliations. |
© 2022 by the authors. Licensee MDPI, Basel, Switzerland. This article is an open access article distributed under the terms and conditions of the Creative Commons Attribution (CC BY) license (https://creativecommons.org/licenses/by/4.0/).
Share and Cite
Vazquez Rocha, L.; Macdonald, I.; Alssema, M.; Færch, K. The Use and Effectiveness of Selected Alternative Markers for Insulin Sensitivity and Secretion Compared with Gold Standard Markers in Dietary Intervention Studies in Individuals without Diabetes: Results of a Systematic Review. Nutrients 2022, 14, 2036. https://doi.org/10.3390/nu14102036
Vazquez Rocha L, Macdonald I, Alssema M, Færch K. The Use and Effectiveness of Selected Alternative Markers for Insulin Sensitivity and Secretion Compared with Gold Standard Markers in Dietary Intervention Studies in Individuals without Diabetes: Results of a Systematic Review. Nutrients. 2022; 14(10):2036. https://doi.org/10.3390/nu14102036
Chicago/Turabian StyleVazquez Rocha, Lucia, Ian Macdonald, Marjan Alssema, and Kristine Færch. 2022. "The Use and Effectiveness of Selected Alternative Markers for Insulin Sensitivity and Secretion Compared with Gold Standard Markers in Dietary Intervention Studies in Individuals without Diabetes: Results of a Systematic Review" Nutrients 14, no. 10: 2036. https://doi.org/10.3390/nu14102036
APA StyleVazquez Rocha, L., Macdonald, I., Alssema, M., & Færch, K. (2022). The Use and Effectiveness of Selected Alternative Markers for Insulin Sensitivity and Secretion Compared with Gold Standard Markers in Dietary Intervention Studies in Individuals without Diabetes: Results of a Systematic Review. Nutrients, 14(10), 2036. https://doi.org/10.3390/nu14102036