
Association between Health-Related Physical Fitness and Risk of Dyslipidemia in University Staff: A Cross-Sectional Study and a ROC Curve Analysis

 ,
,
Abstract
:1. Introduction
2. Materials and Methods
2.1. Participant Recruitment and Study Design
2.2. Anthropometric and HPF Tests
2.3. Blood Pressure Measurement and Blood Biochemical Assays
2.4. Diagnostic Criteria
2.5. Statistical Analyses
3. Results
3.1. Subsection Differences in Anthropometry, HPF Indicators, and Blood Biochemistry
3.2. Analyses of Risk Factors for Dyslipidemia
3.3. Diagnostic Accuracy of HPF Indicators for Predicting Risk of Dyslipidemia
4. Discussion
4.1. Prevalence of DL among University Staff
4.2. Risk Factors for DL in University Staff
4.3. Relationship between HPF Indicators and Risk of DL
4.4. Prognostic Value of Body Composition Indicators for Risk of Dyslipidemia
5. Conclusions
Author Contributions
Funding
Institutional Review Board Statement
Informed Consent Statement
Data Availability Statement
Acknowledgments
Conflicts of Interest
References
- Duff, O.M.; Walsh, D.M.; Furlong, B.A.; O’Connor, N.E.; Moran, K.A.; Woods, C.B. Behavior Change Techniques in Physical Activity eHealth Interventions for People With Cardiovascular Disease: Systematic Review. J. Med. Internet Res. 2017, 19, e281. [Google Scholar] [CrossRef] [Green Version]
- Liu, S.; Li, Y.; Zeng, X.; Wang, H.; Yin, P.; Wang, L.; Liu, Y.; Liu, J.; Qi, J.; Ran, S.; et al. Burden of Cardiovascular Diseases in China, 1990-2016: Findings From the 2016 Global Burden of Disease Study. JAMA Cardiol. 2019, 4, 342–352. [Google Scholar] [CrossRef] [PubMed]
- Pan, L.; Yang, Z.; Wu, Y.; Yin, R.X.; Liao, Y.; Wang, J.; Gao, B.; Zhang, L. The prevalence, awareness, treatment and control of dyslipidemia among adults in China. Atherosclerosis 2016, 248, 2–9. [Google Scholar] [CrossRef]
- Liu, X.; Yu, S.; Mao, Z.; Li, Y.; Zhang, H.; Yang, K.; Zhang, H.; Liu, R.; Qian, X.; Li, L.; et al. Dyslipidemia prevalence, awareness, treatment, control, and risk factors in Chinese rural population: The Henan rural cohort study. Lipids Health Dis. 2018, 17, 119. [Google Scholar] [CrossRef] [Green Version]
- Xi, Y.; Niu, L.; Cao, N.; Bao, H.; Xu, X.; Zhu, H.; Yan, T.; Zhang, N.; Qiao, L.; Han, K.; et al. Prevalence of dyslipidemia and associated risk factors among adults aged >/=35 years in northern China: A cross-sectional study. BMC Public Health 2020, 20, 1068. [Google Scholar] [CrossRef]
- Gu, T.; Zhou, W.; Sun, J.; Wang, J.; Zhu, D.; Bi, Y. Gender and Age Differences in Lipid Profile Among Chinese Adults in Nanjing: A Retrospective Study of Over 230,000 Individuals from 2009 to 2015. Exp. Clin. Endocrinol. Diabetes 2018, 126, 429–436. [Google Scholar] [CrossRef] [PubMed]
- Paim, R.T.T.; Rodrigues, P.S.A.; Silva, J.; Paula Junior, V.F.; Silva, B.B.D.; Freitas, C.A.S.; Oria, R.B.; Florean, E.; Rondina, D.; Guedes, M.I.F. p-Methoxycinnamic Acid Diesters Lower Dyslipidemia, Liver Oxidative Stress and Toxicity in High-Fat Diet Fed Mice and Human Peripheral Blood Lymphocytes. Nutrients 2020, 12, 262. [Google Scholar] [CrossRef] [Green Version]
- Lee, J.S.; Chang, P.Y.; Zhang, Y.; Kizer, J.R.; Best, L.G.; Howard, B.V. Triglyceride and HDL-C Dyslipidemia and Risks of Coronary Heart Disease and Ischemic Stroke by Glycemic Dysregulation Status: The Strong Heart Study. Diabetes Care 2017, 40, 529–537. [Google Scholar] [CrossRef] [Green Version]
- Cho, S.M.J.; Lee, H.J.; Shim, J.S.; Song, B.M.; Kim, H.C. Associations between age and dyslipidemia are differed by education level: The Cardiovascular and Metabolic Diseases Etiology Research Center (CMERC) cohort. Lipids Health Dis. 2020, 19, 12. [Google Scholar] [CrossRef] [Green Version]
- Tian, D.; Meng, J. Exercise for Prevention and Relief of Cardiovascular Disease: Prognoses, Mechanisms, and Approaches. Oxid. Med. Cell Longev. 2019, 2019, 3756750. [Google Scholar] [CrossRef] [Green Version]
- Smith, S.C., Jr.; Benjamin, E.J.; Bonow, R.O.; Braun, L.T.; Creager, M.A.; Franklin, B.A.; Gibbons, R.J.; Grundy, S.M.; Hiratzka, L.F.; Jones, D.W.; et al. AHA/ACCF secondary prevention and risk reduction therapy for patients with coronary and other atherosclerotic vascular disease: 2011 update: A guideline from the American Heart Association and American College of Cardiology Foundation endorsed by the World Heart Federation and the Preventive Cardiovascular Nurses Association. J. Am. Coll. Cardiol. 2011, 58, 2432–2446. [Google Scholar]
- Artero, E.G.; Lee, D.C.; Lavie, C.J.; Espana-Romero, V.; Sui, X.; Church, T.S.; Blair, S.N. Effects of muscular strength on cardiovascular risk factors and prognosis. J. Cardiopulm. Rehabil. Prev. 2012, 32, 351–358. [Google Scholar] [CrossRef] [PubMed] [Green Version]
- Liu, Y.; Lee, D.C.; Li, Y.; Zhu, W.; Zhang, R.; Sui, X.; Lavie, C.J.; Blair, S.N. Associations of Resistance Exercise with Cardiovascular Disease Morbidity and Mortality. Med. Sci. Sports Exerc. 2019, 51, 499–508. [Google Scholar] [CrossRef] [PubMed]
- Lavie, C.J.; Kachur, S.; Sui, X. Impact of fitness and changes in fitness on lipids and survival. Prog. Cardiovasc. Dis. 2019, 62, 431–435. [Google Scholar] [CrossRef]
- Mann, S.; Beedie, C.; Jimenez, A. Differential effects of aerobic exercise, resistance training and combined exercise modalities on cholesterol and the lipid profile: Review, synthesis and recommendations. Sports Med. 2014, 44, 211–221. [Google Scholar] [CrossRef] [PubMed] [Green Version]
- De Lima, T.R.; Martins, P.C.; Guerra, P.H.; Santos Silva, D.A. Muscular strength and cardiovascular risk factors in adults: A systematic review. Phys. Sportsmed. 2021, 49, 18–30. [Google Scholar] [CrossRef]
- Chen, J.; Zhou, Y.; Pan, X.; Li, X.; Long, J.; Zhang, H.; Zhang, J. Associations between Health-Related Physical Fitness and Cardiovascular Disease Risk Factors in Overweight and Obese University Staff. Int. J. Environ. Res. Public Health 2020, 17, 9031. [Google Scholar] [CrossRef] [PubMed]
- Chen, G.C.; Arthur, R.; Iyengar, N.M.; Kamensky, V.; Xue, X.; Wassertheil-Smoller, S.; Allison, M.A.; Shadyab, A.H.; Wild, R.A.; Sun, Y.; et al. Association between regional body fat and cardiovascular disease risk among postmenopausal women with normal body mass index. Eur. Heart J. 2019, 40, 2849–2855. [Google Scholar] [CrossRef] [PubMed]
- Breneman, C.B.; Polinski, K.; Sarzynski, M.A.; Lavie, C.J.; Kokkinos, P.F.; Ahmed, A.; Sui, X. The Impact of Cardiorespiratory Fitness Levels on the Risk of Developing Atherogenic Dyslipidemia. Am. J. Med. 2016, 129, 1060–1066. [Google Scholar] [CrossRef] [Green Version]
- Lin, X.; Zhang, X.; Guo, J.; Roberts, C.K.; McKenzie, S.; Wu, W.C.; Liu, S.; Song, Y. Effects of Exercise Training on Cardiorespiratory Fitness and Biomarkers of Cardiometabolic Health: A Systematic Review and Meta-Analysis of Randomized Controlled Trials. J. Am. Heart Assoc. 2015, 4, e002014. [Google Scholar] [CrossRef] [Green Version]
- Celis-Morales, C.A.; Welsh, P.; Lyall, D.M.; Steell, L.; Petermann, F.; Anderson, J.; Iliodromiti, S.; Sillars, A.; Graham, N.; Mackay, D.F.; et al. Associations of grip strength with cardiovascular, respiratory, and cancer outcomes and all cause mortality: Prospective cohort study of half a million UK Biobank participants. BMJ 2018, 361, k1651. [Google Scholar] [PubMed]
- Kahn, H.S. The “lipid accumulation product” performs better than the body mass index for recognizing cardiovascular risk: A population-based comparison. BMC Cardiovasc. Disord. 2005, 5, 26. [Google Scholar] [CrossRef] [Green Version]
- Mills, K.T.; Bundy, J.D.; Kelly, T.N.; Reed, J.E.; Kearney, P.M.; Reynolds, K.; Chen, J.; He, J. Global Disparities of Hypertension Prevalence and Control: A Systematic Analysis of Population-Based Studies From 90 Countries. Circulation 2016, 134, 441–450. [Google Scholar] [CrossRef] [PubMed]
- Zhang, F.L.; Xing, Y.Q.; Wu, Y.H.; Liu, H.Y.; Luo, Y.; Sun, M.S.; Guo, Z.N.; Yang, Y. The prevalence, awareness, treatment, and control of dyslipidemia in northeast China: A population-based cross-sectional survey. Lipids Health Dis. 2017, 16, 61. [Google Scholar] [CrossRef] [PubMed] [Green Version]
- Costanza, M.C.; Cayanis, E.; Ross, B.M.; Flaherty, M.S.; Alvin, G.B.; Das, K.; Morabia, A. Relative contributions of genes, environment, and interactions to blood lipid concentrations in a general adult population. Am. J. Epidemiol. 2005, 161, 714–724. [Google Scholar] [CrossRef] [Green Version]
- Al-Sayegh, N.; Al-Enezi, K.; Nadar, M.; Dean, E. Health Status, Behaviors, and Beliefs of Health Sciences Students and Staff at Kuwait University: Toward Maximizing the Health of Future Health Professionals and Their Patients. Int J. Environ. Res. Public Health 2020, 17, 8776. [Google Scholar] [CrossRef]
- Nabi, H.; Kivimaki, M.; Batty, G.D.; Shipley, M.J.; Britton, A.; Brunner, E.J.; Vahtera, J.; Lemogne, C.; Elbaz, A.; Singh-Manoux, A. Increased risk of coronary heart disease among individuals reporting adverse impact of stress on their health: The Whitehall II prospective cohort study. Eur. Heart J. 2013, 34, 2697–2705. [Google Scholar] [CrossRef] [Green Version]
- Satyjeet, F.; Naz, S.; Kumar, V.; Aung, N.H.; Bansari, K.; Irfan, S.; Rizwan, A. Psychological Stress as a Risk Factor for Cardiovascular Disease: A Case-Control Study. Cureus 2020, 12, e10757. [Google Scholar] [CrossRef]
- Steptoe, A.; Kivimaki, M. Stress and cardiovascular disease: An update on current knowledge. Annu. Rev. Public Health 2013, 34, 337–354. [Google Scholar] [CrossRef] [PubMed]
- Von Kanel, R.; Mills, P.J.; Fainman, C.; Dimsdale, J.E. Effects of psychological stress and psychiatric disorders on blood coagulation and fibrinolysis: A biobehavioral pathway to coronary artery disease? Psychosom. Med. 2001, 63, 531–544. [Google Scholar] [CrossRef]
- Brunner, E.J.; Hemingway, H.; Walker, B.R.; Page, M.; Clarke, P.; Juneja, M.; Shipley, M.J.; Kumari, M.; Andrew, R.; Seckl, J.R.; et al. Adrenocortical, autonomic, and inflammatory causes of the metabolic syndrome: Nested case-control study. Circulation 2002, 106, 2659–2665. [Google Scholar] [CrossRef]
- Yang, W.; Xiao, J.; Yang, Z.; Ji, L.; Jia, W.; Weng, J.; Lu, J.; Shan, Z.; Liu, J.; Tian, H.; et al. Serum lipids and lipoproteins in Chinese men and women. Circulation 2012, 125, 2212–2221. [Google Scholar] [CrossRef] [Green Version]
- Cai, L.; Zhang, L.; Liu, A.; Li, S.; Wang, P. Prevalence, awareness, treatment, and control of dyslipidemia among adults in Beijing, China. J. Atheroscler. Thromb. 2012, 19, 159–168. [Google Scholar] [CrossRef] [PubMed]
- Mathias, P.C.; Elmhiri, G.; de Oliveira, J.C.; Delayre-Orthez, C.; Barella, L.F.; Tofolo, L.P.; Fabricio, G.S.; Chango, A.; Abdennebi-Najar, L. Maternal diet, bioactive molecules, and exercising as reprogramming tools of metabolic programming. Eur. J. Nutr. 2014, 53, 711–722. [Google Scholar] [CrossRef] [PubMed]
- Klop, B.; Elte, J.W.; Cabezas, M.C. Dyslipidemia in obesity: Mechanisms and potential targets. Nutrients 2013, 5, 1218–1240. [Google Scholar] [CrossRef] [Green Version]
- Vekic, J.; Zeljkovic, A.; Stefanovic, A.; Jelic-Ivanovic, Z.; Spasojevic-Kalimanovska, V. Obesity and dyslipidemia. Metabolism 2019, 92, 71–81. [Google Scholar] [CrossRef]
- Natarajan, P.; Ray, K.K.; Cannon, C.P. High-density lipoprotein and coronary heart disease: Current and future therapies. J. Am. Coll. Cardiol. 2010, 55, 1283–1299. [Google Scholar] [CrossRef] [PubMed] [Green Version]
- Hoene, M.; Weigert, C. The role of interleukin-6 in insulin resistance, body fat distribution and energy balance. Obes. Rev. 2008, 9, 20–29. [Google Scholar] [CrossRef]
- Matsuki, T.; Horai, R.; Sudo, K.; Iwakura, Y. IL-1 plays an important role in lipid metabolism by regulating insulin levels under physiological conditions. J. Exp. Med. 2003, 198, 877–888. [Google Scholar] [CrossRef] [Green Version]
- Baker, R.G.; Hayden, M.S.; Ghosh, S. NF-kappaB, inflammation, and metabolic disease. Cell Metab. 2011, 13, 11–22. [Google Scholar] [CrossRef] [Green Version]
- Kario, K.; Saito, I.; Kushiro, T.; Teramukai, S.; Ishikawa, Y.; Mori, Y.; Kobayashi, F.; Shimada, K. Home blood pressure and cardiovascular outcomes in patients during antihypertensive therapy: Primary results of HONEST, a large-scale prospective, real-world observational study. Hypertension 2014, 64, 989–996. [Google Scholar] [CrossRef] [Green Version]
- Cohen, J.D.; Cziraky, M.J.; Cai, Q.; Wallace, A.; Wasser, T.; Crouse, J.R.; Jacobson, T.A. 30-year trends in serum lipids among United States adults: Results from the National Health and Nutrition Examination Surveys II, III, and 1999-2006. Am. J. Cardiol. 2010, 106, 969–975. [Google Scholar] [CrossRef] [PubMed]
- Otsuka, T.; Takada, H.; Nishiyama, Y.; Kodani, E.; Saiki, Y.; Kato, K.; Kawada, T. Dyslipidemia and the Risk of Developing Hypertension in a Working-Age Male Population. J. Am. Heart Assoc. 2016, 5, e003053. [Google Scholar] [CrossRef] [PubMed] [Green Version]
- Wilkinson, I.B.; Prasad, K.; Hall, I.R.; Thomas, A.; MacCallum, H.; Webb, D.J.; Frenneaux, M.P.; Cockcroft, J.R. Increased central pulse pressure and augmentation index in subjects with hypercholesterolemia. J. Am. Coll. Cardiol. 2002, 39, 1005–1011. [Google Scholar] [CrossRef] [Green Version]
- McGill, J.B.; Haffner, S.; Rees, T.J.; Sowers, J.R.; Tershakovec, A.M.; Weber, M. Progress and controversies: Treating obesity and insulin resistance in the context of hypertension. J. Clin. Hypertens. 2009, 11, 36–41. [Google Scholar] [CrossRef]
- Lin, H.Q.; Wu, J.Y.; Chen, M.L.; Chen, F.Q.; Liao, Y.J.; Wu, Y.T.; Guo, Z.J. Prevalence of dyslipidemia and prediction of 10-year CVD risk among older adults living in southeast coastal regions in China: A cross-sectional study. Clin. Interv. Aging 2019, 14, 1119–1129. [Google Scholar] [CrossRef] [PubMed] [Green Version]
- Liu, H.H.; Li, J.J. Aging and dyslipidemia: A review of potential mechanisms. Ageing Res. Rev. 2015, 19, 43–52. [Google Scholar] [CrossRef] [PubMed]
- Niu, Z.; Lin, N.; Gu, R.; Sun, Y.; Feng, Y. Associations between insulin resistance, free fatty acids, and oocyte quality in polycystic ovary syndrome during in vitro fertilization. J. Clin. Endocrinol. Metab. 2014, 99, E2269–E2276. [Google Scholar] [CrossRef] [Green Version]
- Cartier, A.; Cote, M.; Lemieux, I.; Perusse, L.; Tremblay, A.; Bouchard, C.; Despres, J.P. Age-related differences in inflammatory markers in men: Contribution of visceral adiposity. Metabolism 2009, 58, 1452–1458. [Google Scholar] [CrossRef]
- Shanmugasundaram, M.; Rough, S.J.; Alpert, J.S. Dyslipidemia in the elderly: Should it be treated? Clin. Cardiol. 2010, 33, 4–9. [Google Scholar] [CrossRef] [PubMed]
- Qian, Y.; Lin, Y.; Zhang, T.; Bai, J.; Chen, F.; Zhang, Y.; Luo, S.; Shen, H. The characteristics of impaired fasting glucose associated with obesity and dyslipidaemia in a Chinese population. BMC Public Health 2010, 10, 139. [Google Scholar] [CrossRef] [PubMed] [Green Version]
- Juutilainen, A.; Lehto, S.; Ronnemaa, T.; Pyorala, K.; Laakso, M. Similarity of the impact of type 1 and type 2 diabetes on cardiovascular mortality in middle-aged subjects. Diabetes Care 2008, 31, 714–719. [Google Scholar] [CrossRef] [PubMed] [Green Version]
- Cheng, Y.J.; Imperatore, G.; Geiss, L.S.; Saydah, S.H.; Albright, A.L.; Ali, M.K.; Gregg, E.W. Trends and Disparities in Cardiovascular Mortality Among U.S. Adults With and Without Self-Reported Diabetes, 1988-2015. Diabetes Care 2018, 41, 2306–2315. [Google Scholar] [CrossRef] [PubMed] [Green Version]
- Soriguer, F.; Goday, A.; Bosch-Comas, A.; Bordiu, E.; Calle-Pascual, A.; Carmena, R.; Casamitjana, R.; Castano, L.; Castell, C.; Catala, M.; et al. Prevalence of diabetes mellitus and impaired glucose regulation in Spain: The Di@bet.es Study. Diabetologia 2012, 55, 88–93. [Google Scholar] [CrossRef] [Green Version]
- Esteban-Fernandez, A.; Bover-Freire, R.; Guinea-Lopez, R.; Facila, L. Impaired blood glucose levels in patients with dyslipidemia: What are the therapeutic implications? The PREVENDIAB study. Future Cardiol. 2019, 15, 175–182. [Google Scholar] [CrossRef] [PubMed]
- Lee, D.C.; Sui, X.; Church, T.S.; Lavie, C.J.; Jackson, A.S.; Blair, S.N. Changes in fitness and fatness on the development of cardiovascular disease risk factors hypertension, metabolic syndrome, and hypercholesterolemia. J. Am. Coll. Cardiol. 2012, 59, 665–672. [Google Scholar] [CrossRef] [Green Version]
- Ozemek, C.; Laddu, D.R.; Lavie, C.J.; Claeys, H.; Kaminsky, L.A.; Ross, R.; Wisloff, U.; Arena, R.; Blair, S.N. An Update on the Role of Cardiorespiratory Fitness, Structured Exercise and Lifestyle Physical Activity in Preventing Cardiovascular Disease and Health Risk. Prog. Cardiovasc. Dis. 2018, 61, 484–490. [Google Scholar] [CrossRef] [Green Version]
- Zhu, W.; Hooker, S.P.; Sun, Y.; Xie, M.; Su, H.; Cao, J. Associations of cardiorespiratory fitness with cardiovascular disease risk factors in middle-aged Chinese women: A cross-sectional study. BMC Womens Health 2014, 14, 62. [Google Scholar] [CrossRef] [PubMed] [Green Version]
- Blair, S.N.; Cooper, K.H.; Gibbons, L.W.; Gettman, L.R.; Lewis, S.; Goodyear, N. Changes in coronary heart disease risk factors associated with increased treadmill time in 753 men. Am. J. Epidemiol. 1983, 118, 352–359. [Google Scholar] [CrossRef]
- Bakker, E.A.; Lee, D.C.; Sui, X.; Artero, E.G.; Ruiz, J.R.; Eijsvogels, T.M.H.; Lavie, C.J.; Blair, S.N. Association of Resistance Exercise, Independent of and Combined With Aerobic Exercise, With the Incidence of Metabolic Syndrome. Mayo Clin. Proc. 2017, 92, 1214–1222. [Google Scholar] [CrossRef] [PubMed]
- Bakker, E.A.; Lee, D.C.; Sui, X.; Eijsvogels, T.M.H.; Ortega, F.B.; Lee, I.M.; Lavie, C.J.; Blair, S.N. Association of Resistance Exercise With the Incidence of Hypercholesterolemia in Men. Mayo Clin. Proc. 2018, 93, 419–428. [Google Scholar] [CrossRef]
- Momma, H.; Kato, K.; Sawada, S.S.; Gando, Y.; Kawakami, R.; Miyachi, M.; Nagatomi, R.; Tashiro, M.; Matsubayashi, Y.; Kodama, S.; et al. Physical Fitness and Dyslipidemia Among Japanese: A Cohort Study From the Niigata Wellness Study. J. Epidemiol. 2021, 31, 287–296. [Google Scholar] [CrossRef] [PubMed]
- Li, D.; Guo, G.; Xia, L.; Yang, X.; Zhang, B.; Liu, F.; Ma, J.; Hu, Z.; Li, Y.; Li, W.; et al. Relative Handgrip Strength Is Inversely Associated with Metabolic Profile and Metabolic Disease in the General Population in China. Front. Physiol. 2018, 9, 59. [Google Scholar] [CrossRef] [PubMed] [Green Version]
- Chang, K.V.; Hung, C.Y.; Li, C.M.; Lin, Y.H.; Wang, T.G.; Tsai, K.S.; Han, D.S. Reduced flexibility associated with metabolic syndrome in community-dwelling elders. PLoS ONE 2015, 10, e0117167. [Google Scholar] [CrossRef] [Green Version]
- Supriya, R.; Yu, A.P.; Lee, P.H.; Lai, C.W.; Cheng, K.K.; Yau, S.Y.; Chan, L.W.; Yung, B.Y.; Siu, P.M. Yoga training modulates adipokines in adults with high-normal blood pressure and metabolic syndrome. Scand. J. Med. Sci. Sports 2018, 28, 1130–1138. [Google Scholar] [CrossRef] [PubMed] [Green Version]
- Carneiro Roriz, A.K.; Santana Passos, L.C.; Cunha de Oliveira, C.; Eickemberg, M.; de Almeida Moreira, P.; Ramos Sampaio, L. Discriminatory power of indicators predictors of visceral adiposity evaluated by computed tomography in adults and elderly individuals. Nutr. Hosp. 2014, 29, 1401–1407. [Google Scholar]
- Walls, H.L.; Stevenson, C.E.; Mannan, H.R.; Abdullah, A.; Reid, C.M.; McNeil, J.J.; Peeters, A. Comparing trends in BMI and waist circumference. Obesity 2011, 19, 216–219. [Google Scholar] [CrossRef] [PubMed]
- Ray, L.; Ravichandran, K.; Nanda, S.K. Comparison of Lipid Accumulation Product Index with Body Mass Index and Waist Circumference as a Predictor of Metabolic Syndrome in Indian Population. Metab. Syndr. Relat. Disord. 2018, 16, 240–245. [Google Scholar] [CrossRef]
- Kyrou, I.; Panagiotakos, D.B.; Kouli, G.M.; Georgousopoulou, E.; Chrysohoou, C.; Tsigos, C.; Tousoulis, D.; Pitsavos, C. Lipid accumulation product in relation to 10-year cardiovascular disease incidence in Caucasian adults: The ATTICA study. Atherosclerosis 2018, 279, 10–16. [Google Scholar] [CrossRef] [PubMed] [Green Version]
- Wehr, E.; Pilz, S.; Boehm, B.O.; Marz, W.; Obermayer-Pietsch, B. The lipid accumulation product is associated with increased mortality in normal weight postmenopausal women. Obesity 2011, 19, 1873–1880. [Google Scholar] [CrossRef]
- Anoop, S.S.; Dasgupta, R.; Rebekah, G.; Jose, A.; Inbakumari, M.P.; Finney, G.; Thomas, N. Lipid accumulation product (LAP) as a potential index to predict risk of insulin resistance in young, non-obese Asian Indian males from Southern India: Observations from hyperinsulinemic-euglycemic clamp studies. BMJ Open Diabetes Res. Care 2021, 9, e002414. [Google Scholar] [CrossRef] [PubMed]
- Li, R.; Li, Q.; Cui, M.; Ying, Z.; Li, L.; Zhong, T.; Huo, Y.; Xie, P. Visceral adiposity index, lipid accumulation product and intracranial atherosclerotic stenosis in middle-aged and elderly Chinese. Sci. Rep. 2017, 7, 7951. [Google Scholar] [CrossRef] [Green Version]
- Wang, H.; Chen, Y.; Sun, G.; Jia, P.; Qian, H.; Sun, Y. Validity of cardiometabolic index, lipid accumulation product, and body adiposity index in predicting the risk of hypertension in Chinese population. Postgrad. Med. 2018, 130, 325–333. [Google Scholar] [CrossRef] [PubMed]
- Zhang, Y.; Gu, Y.; Wang, N.; Zhao, Q.; Ng, N.; Wang, R.; Zhou, X.; Jiang, Y.; Wang, W.; Zhao, G. Association between anthropometric indicators of obesity and cardiovascular risk factors among adults in Shanghai, China. BMC Public Health 2019, 19, 1035. [Google Scholar] [CrossRef] [PubMed]
- Jablonowska-Lietz, B.; Wrzosek, M.; Wlodarczyk, M.; Nowicka, G. New indexes of body fat distribution, visceral adiposity index, body adiposity index, waist-to-height ratio, and metabolic disturbances in the obese. Kardiologia Polska 2017, 75, 1185–1191. [Google Scholar] [CrossRef] [PubMed] [Green Version]
- Ashwell, M.; Gunn, P.; Gibson, S. Waist-to-height ratio is a better screening tool than waist circumference and BMI for adult cardiometabolic risk factors: Systematic review and meta-analysis. Obes. Rev. 2012, 13, 275–286. [Google Scholar] [CrossRef]
- Wang, K.; Pan, L.; Wang, D.; Dong, F.; Yu, Y.; Wang, L.; Li, L.; Liu, T.; Sun, L.; Zhu, G.; et al. Association between obesity indicators and cardiovascular risk factors among adults in low-income Han Chinese from southwest China. Medicine 2020, 99, e20176. [Google Scholar] [CrossRef]
- Hsieh, S.D.; Yoshinaga, H.; Muto, T. Waist-to-height ratio, a simple and practical index for assessing central fat distribution and metabolic risk in Japanese men and women. Int J. Obes. Relat. Metab. Disord. 2003, 27, 610–616. [Google Scholar] [CrossRef] [Green Version]


| Age (years) | 40 (15)/42 (19) |
| Sex (n) | 407/369 |
| Height (cm) | 1.62 (0.06)/1.73 (0.06) |
| Weight (kg) | 56.70 (9.80)/73.20 (13.20) |
| BMI (Kg/m2) | 21.79 (2.86)/24.53 (3.59) |
| WC (cm) | 73.70 (8)/86.20 (9) |
| Variables | Dyslipidemia (N = 360) | Normolipidemic (N = 416) | t/χ2/Z | p |
|---|---|---|---|---|
| Age (years) | 45.00 (16.00) | 38.00 (15.00) | −7.573 | <0.001 |
| Female | 46.50 (15.00) | 37.00 (13.00) | −8.069 | <0.001 |
| Male | 45.00 (19.00) | 40.00 (17.00) | −2.438 | 0.015 |
| Dyslipidemia (n, %) | 360 (46.39) | 416 (53.61) | ||
| Female (n, %) | 170 (41.77) | 237 (58.23) | 2.687 | 0.101 a |
| Male (n, %) | 190 (51.49) | 179 (48.51) | ||
| Hypertension (n, %) | ||||
| Female (n, %) | 19 (11.18) | 4 (1.69) | 9.104 | 0.003 b |
| Male (n, %) | 50 (26.32) | 35 (19.55) | ||
| Body composition | ||||
| Height (m) | 1.68 (0.11) | 1.66 (0.10) | −1.046 | 0.296 |
| Weight (kg) | 65.50 (18.03) | 62.55 (15.00) | −3.203 | 0.001 |
| BMI (kg/m2) | 23.60 (4.33) | 22.44 (3.61) | −4.723 | <0.001 |
| BF (kg) | 18.30 (9.25) | 16.75 (8.38) | −3.987 | <0.001 |
| WHtR | 0.49 (0.07) | 0.47 (0.04) | −5.994 | <0.001 |
| LAP | 28.00 (27.25) | 15.35 (14.22) | −10.919 | <0.001 |
| SMI (kg/m2) | 8.49 (2.39) | 8.69 (1.85) | −0.170 | 0.865 |
| Muscle Fitness | ||||
| GS (kg) | 35.25 (18.50) | 32.60 (15.22) | −1.391 | 0.164 |
| VG (cm) | 35.56 (17.71) | 35.75 (18.00) | −0.955 | 0.339 |
| Cardiorespiratory fitness | ||||
| VCI (ml/kg) * | 50.14 (11.71) | 52.62 (12.26) | 2.868 | 0.004 |
| Flexibility | ||||
| SAR (cm) | 7.48 (8.62) | 9.00 (13.00) | −2.479 | 0.013 |
| Blood pressure | ||||
| SBP (mmHg) | 123.50 (18.00) | 117.55 (16.00) | −5.804 | <0.001 |
| DBP (mmHg) | 78.00 (13.00) | 74.00 (12.00) | −5.500 | <0.001 |
| Blood biochemical | ||||
| GLU (mmol/L) | 4.96 (0.57) | 4.90 (0.51) | −3.362 | 0.001 |
| TG (mmol/L) | 1.37 (0.99) | 0.87 (0.50) | −13.051 | <0.001 |
| TC (mmol/L) | 5.45 (0.70) | 4.45 (0.78) | −18.580 | <0.001 |
| HDL-C (mmol/L) | 1.48 (0.56) | 1.54 (0.38) | −1.913 | 0.056 |
| LDL-C (mmol/L) | 3.28 (0.68) | 2.47 (0.63) | −17.054 | <0.001 |
| Variables | β | SE | Wald | OR | 95%CI | p |
|---|---|---|---|---|---|---|
| Gender | ||||||
| Female | -- | - | - | 1.000 | - | - |
| Male | 0.392 | 0.145 | 7.331 | 1.480 | 1.114–1.965 | 0.007 |
| Blood pressure | ||||||
| Normotensive | - | - | - | 1.000 | - | - |
| Hypertension | 0.829 | 0.215 | 14.885 | 2.292 | 1.504–3.493 | <0.001 |
| LAP | ||||||
| Q1 | - | - | - | 1.000 | - | - |
| Q2 | 0.414 | 0.222 | 3.485 | 1.513 | 0.980–2.338 | 0.062 |
| Q3 | 0.886 | 0.218 | 16.603 | 2.426 | 1.584–3.717 | <0.001 |
| Q4 | 2.287 | 0.238 | 92.615 | 9.846 | 6.180–15.688 | <0.001 |
| VCI | ||||||
| Q1 | - | - | - | 1.000 | - | - |
| Q2 | −0.165 | 0.203 | 0.660 | 0.848 | 0.569–1.263 | 0.417 |
| Q3 | −0.310 | 0.204 | 2.316 | 0.733 | 0.492–1.093 | 0.128 |
| Q4 | −0.607 | 0.206 | 8.669 | 0.545 | 0.364–0.816 | 0.003 |
| Age | 0.059 | 0.008 | 55.498 | 1.061 | 1.045–1.078 | <0.001 |
| GLU | 0.649 | 0.159 | 16.730 | 1.914 | 1.402–2.613 | <0.001 |
| BMI | 0.125 | 0.026 | 22.230 | 1.133 | 1.076–1.193 | <0.001 |
| BF | 0.022 | 0.007 | 8.741 | 1.022 | 1.007–1.037 | <0.001 |
| WHtR | 0.424 | 0.078 | 29.792 | 1.528 | 1.312–1.779 | <0.001 |
| SMI | 0.021 | 0.043 | 0.243 | 1.021 | 0.939–1.111 | 0.622 |
| GS | 0.011 | 0.007 | 2.397 | 1.011 | 0.997–1.024 | 0.122 |
| VG | −0.004 | 0.005 | 0.515 | 0.996 | 0.986–1.007 | 0.473 |
| SAR | −0.020 | 0.008 | 6.295 | 0.980 | 0.964–0.996 | 0.012 |
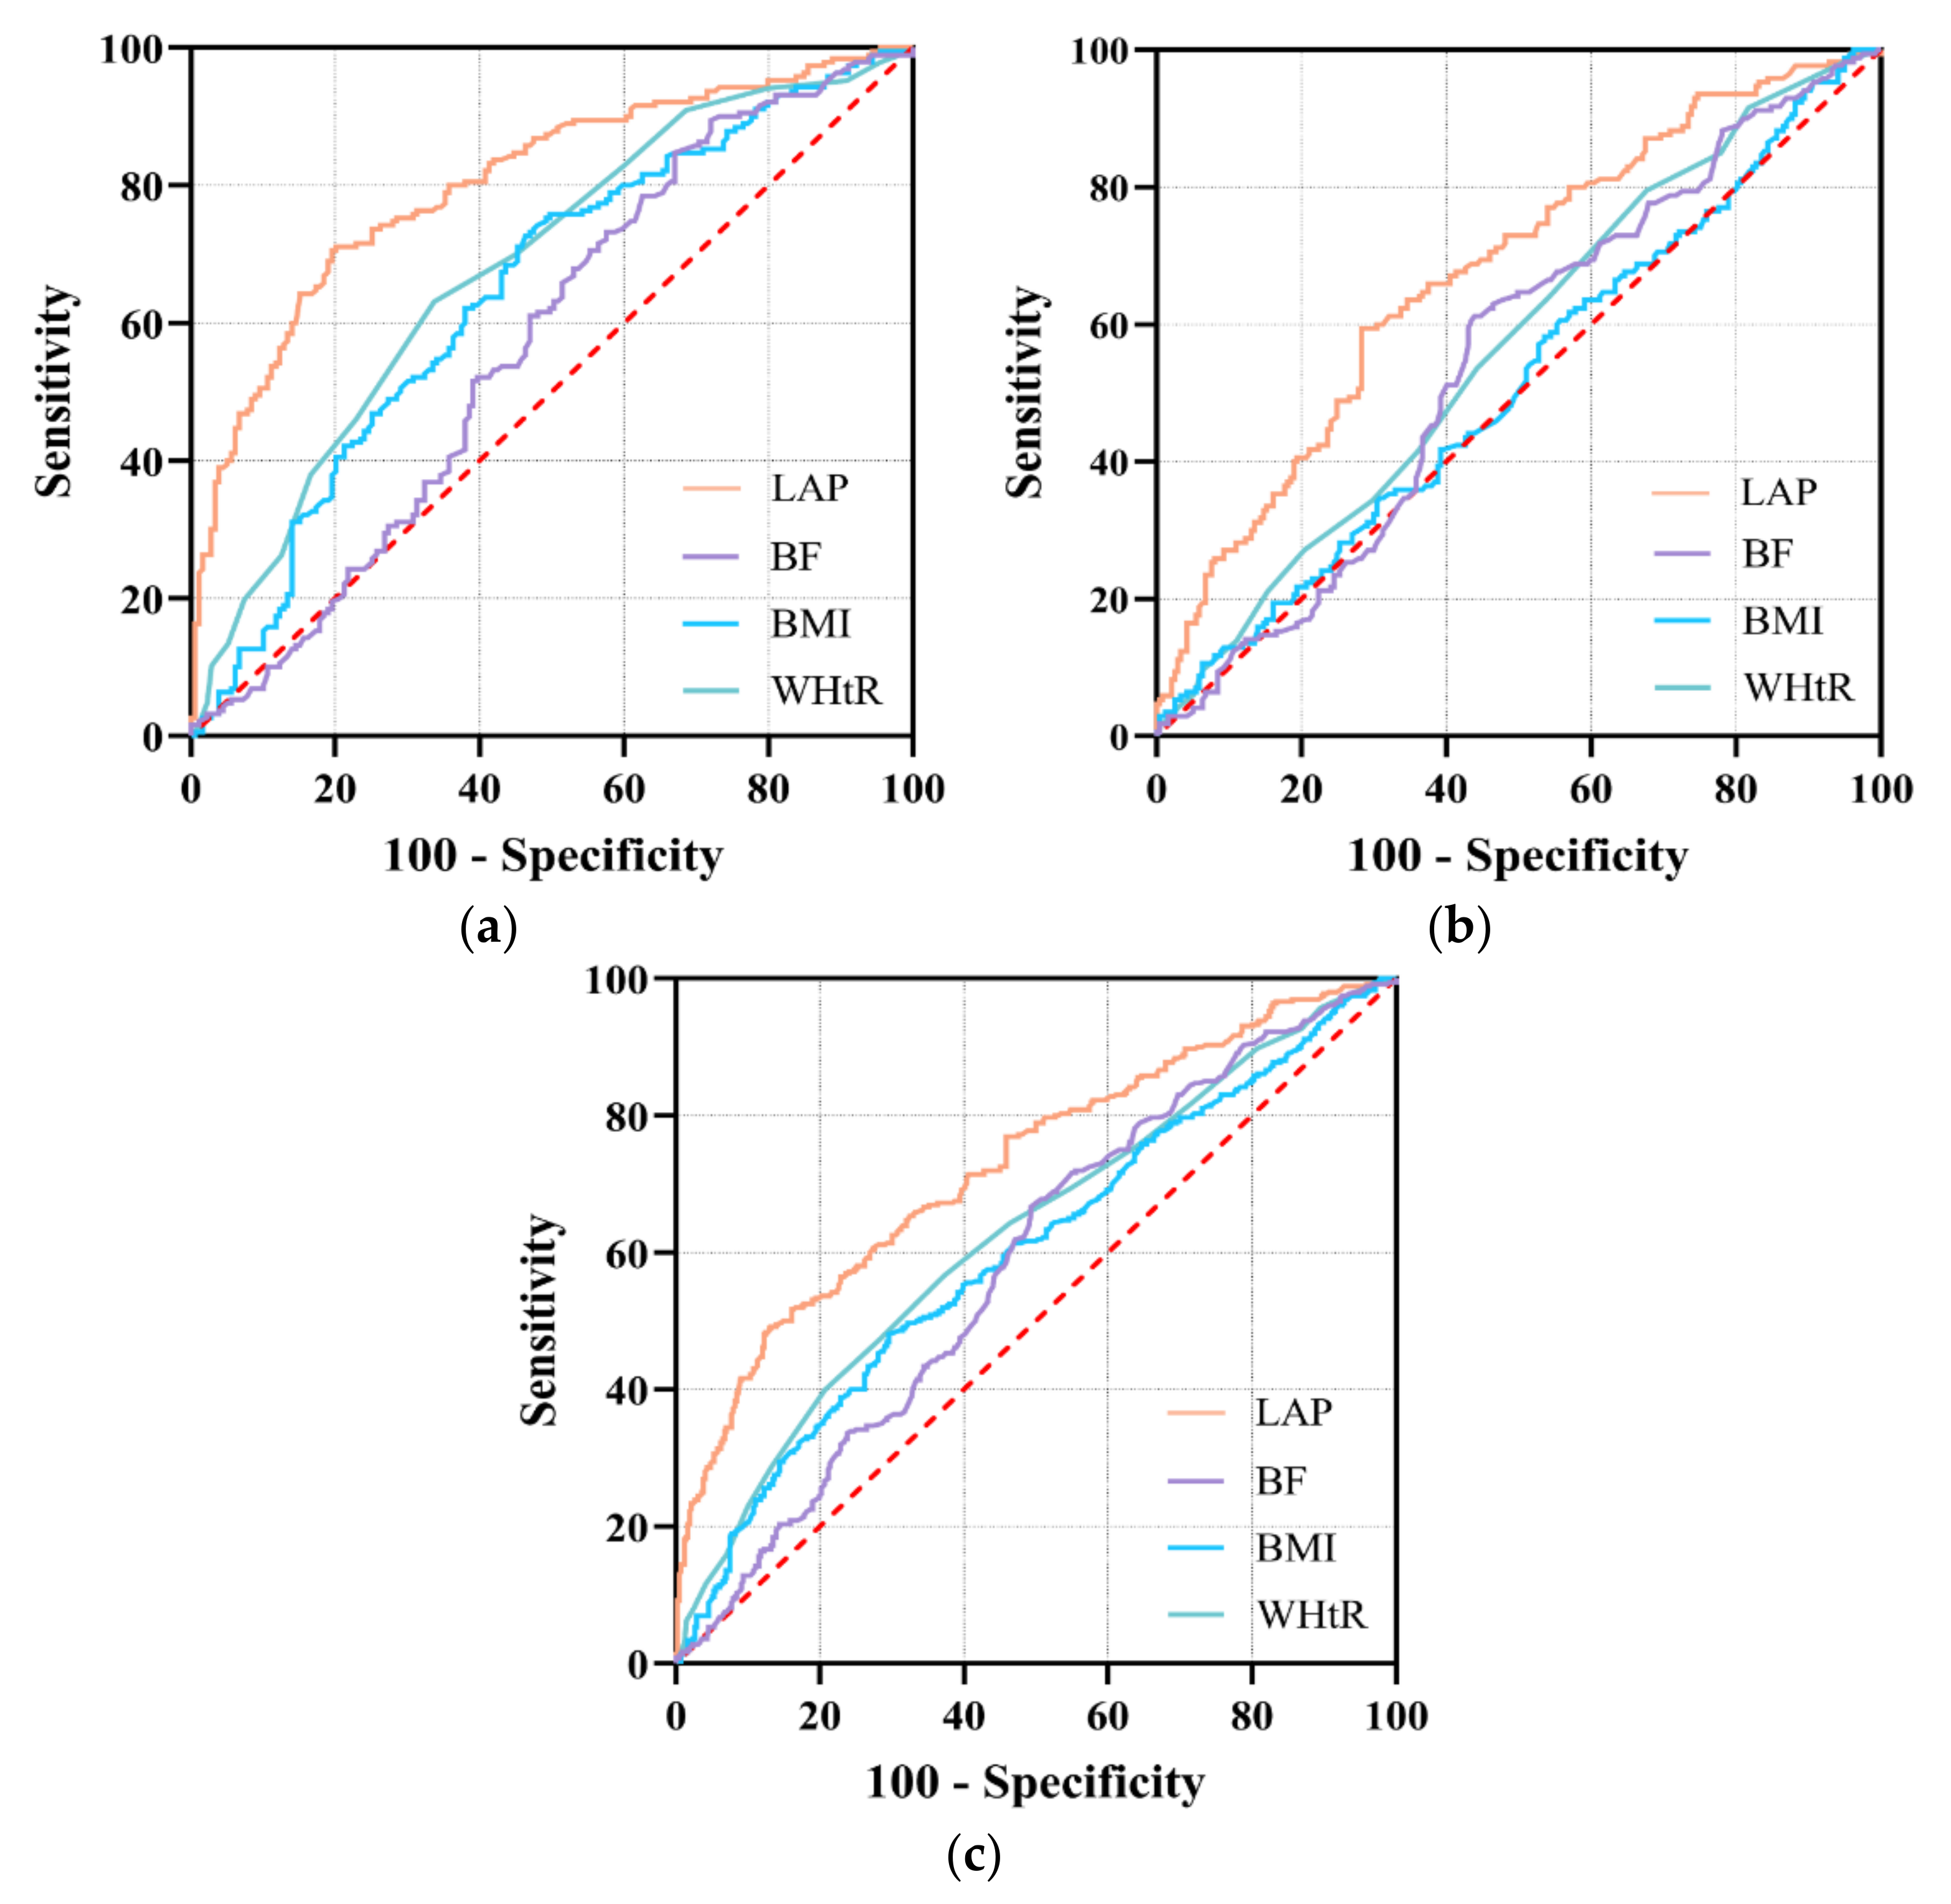
| Variables | Cut-Off Value | Sensitivity (%) | Specificity (%) | AUC (95% CI) | Z | p |
|---|---|---|---|---|---|---|
| Female | ||||||
| BMI | 18.765 | 94.0 | 10.6 | 0.512 (0.462–0.562) | 6.036 | <0.001 |
| BF | 16.750 | 60.2 | 56.6 | 0.548 (0.498–0.597) | 4.577 | <0.001 |
| WHtR | 0.436 * | 77.7 | 35.3 | 0.567 (0.517–0.616) | 5.479 | <0.001 |
| LAP | 16.035 # | 58.4 | 72.3 | 0.675 (0.627–0.721) | ||
| Male | ||||||
| BMI | 23.955 # | 73.3 | 53.7 | 0.649 (0.597–0.698) | 6.388 | <0.001 |
| BF | 14.950 * | 84.5 | 33.7 | 0.573 (0.521–0.625) | 6.845 | <0.001 |
| WHtR | 0.504 # | 63.1 | 66.3 | 0.682 (0.632–0.730) | 5.421 | <0.001 |
| LAP | 29.320 # | 70.6 | 81.1 | 0.809 (0.765–0.848) | ||
| All | ||||||
| BMI | 23.915 # | 47.9 | 70.7 | 0.599 (0.563–0.634) | 8.074 | <0.001 |
| BF | 16.910 # | 66.0 | 51.5 | 0.584 (0.548–0.619) | 6.977 | <0.001 |
| WHtR | 0.494 # | 49.3 | 71.5 | 0.626 (0.590–0.660) | 7.919 | <0.001 |
| LAP | 29.165 # | 48.7 | 87.6 | 0.730 (0.697–0.762) | - | - |
Publisher’s Note: MDPI stays neutral with regard to jurisdictional claims in published maps and institutional affiliations. |
© 2021 by the authors. Licensee MDPI, Basel, Switzerland. This article is an open access article distributed under the terms and conditions of the Creative Commons Attribution (CC BY) license (https://creativecommons.org/licenses/by/4.0/).
Share and Cite
Zhou, Y.; Zhang, J.; Liu, R.-H.; Xie, Q.; Li, X.-L.; Chen, J.-G.; Pan, X.-L.; Ye, B.; Liu, L.-L.; Wang, W.-W.; et al. Association between Health-Related Physical Fitness and Risk of Dyslipidemia in University Staff: A Cross-Sectional Study and a ROC Curve Analysis. Nutrients 2022, 14, 50. https://doi.org/10.3390/nu14010050
Zhou Y, Zhang J, Liu R-H, Xie Q, Li X-L, Chen J-G, Pan X-L, Ye B, Liu L-L, Wang W-W, et al. Association between Health-Related Physical Fitness and Risk of Dyslipidemia in University Staff: A Cross-Sectional Study and a ROC Curve Analysis. Nutrients. 2022; 14(1):50. https://doi.org/10.3390/nu14010050
Chicago/Turabian StyleZhou, Yuan, Jing Zhang, Rong-Hua Liu, Qian Xie, Xiao-Long Li, Jian-Gang Chen, Xin-Liang Pan, Bo Ye, Long-Long Liu, Wan-Wan Wang, and et al. 2022. "Association between Health-Related Physical Fitness and Risk of Dyslipidemia in University Staff: A Cross-Sectional Study and a ROC Curve Analysis" Nutrients 14, no. 1: 50. https://doi.org/10.3390/nu14010050
APA StyleZhou, Y., Zhang, J., Liu, R.-H., Xie, Q., Li, X.-L., Chen, J.-G., Pan, X.-L., Ye, B., Liu, L.-L., Wang, W.-W., Yan, L.-L., Wei, W.-X., & Jiang, X.-C. (2022). Association between Health-Related Physical Fitness and Risk of Dyslipidemia in University Staff: A Cross-Sectional Study and a ROC Curve Analysis. Nutrients, 14(1), 50. https://doi.org/10.3390/nu14010050