
Association of Household Income Level with Vitamin and Mineral Intake


Abstract
:1. Introduction
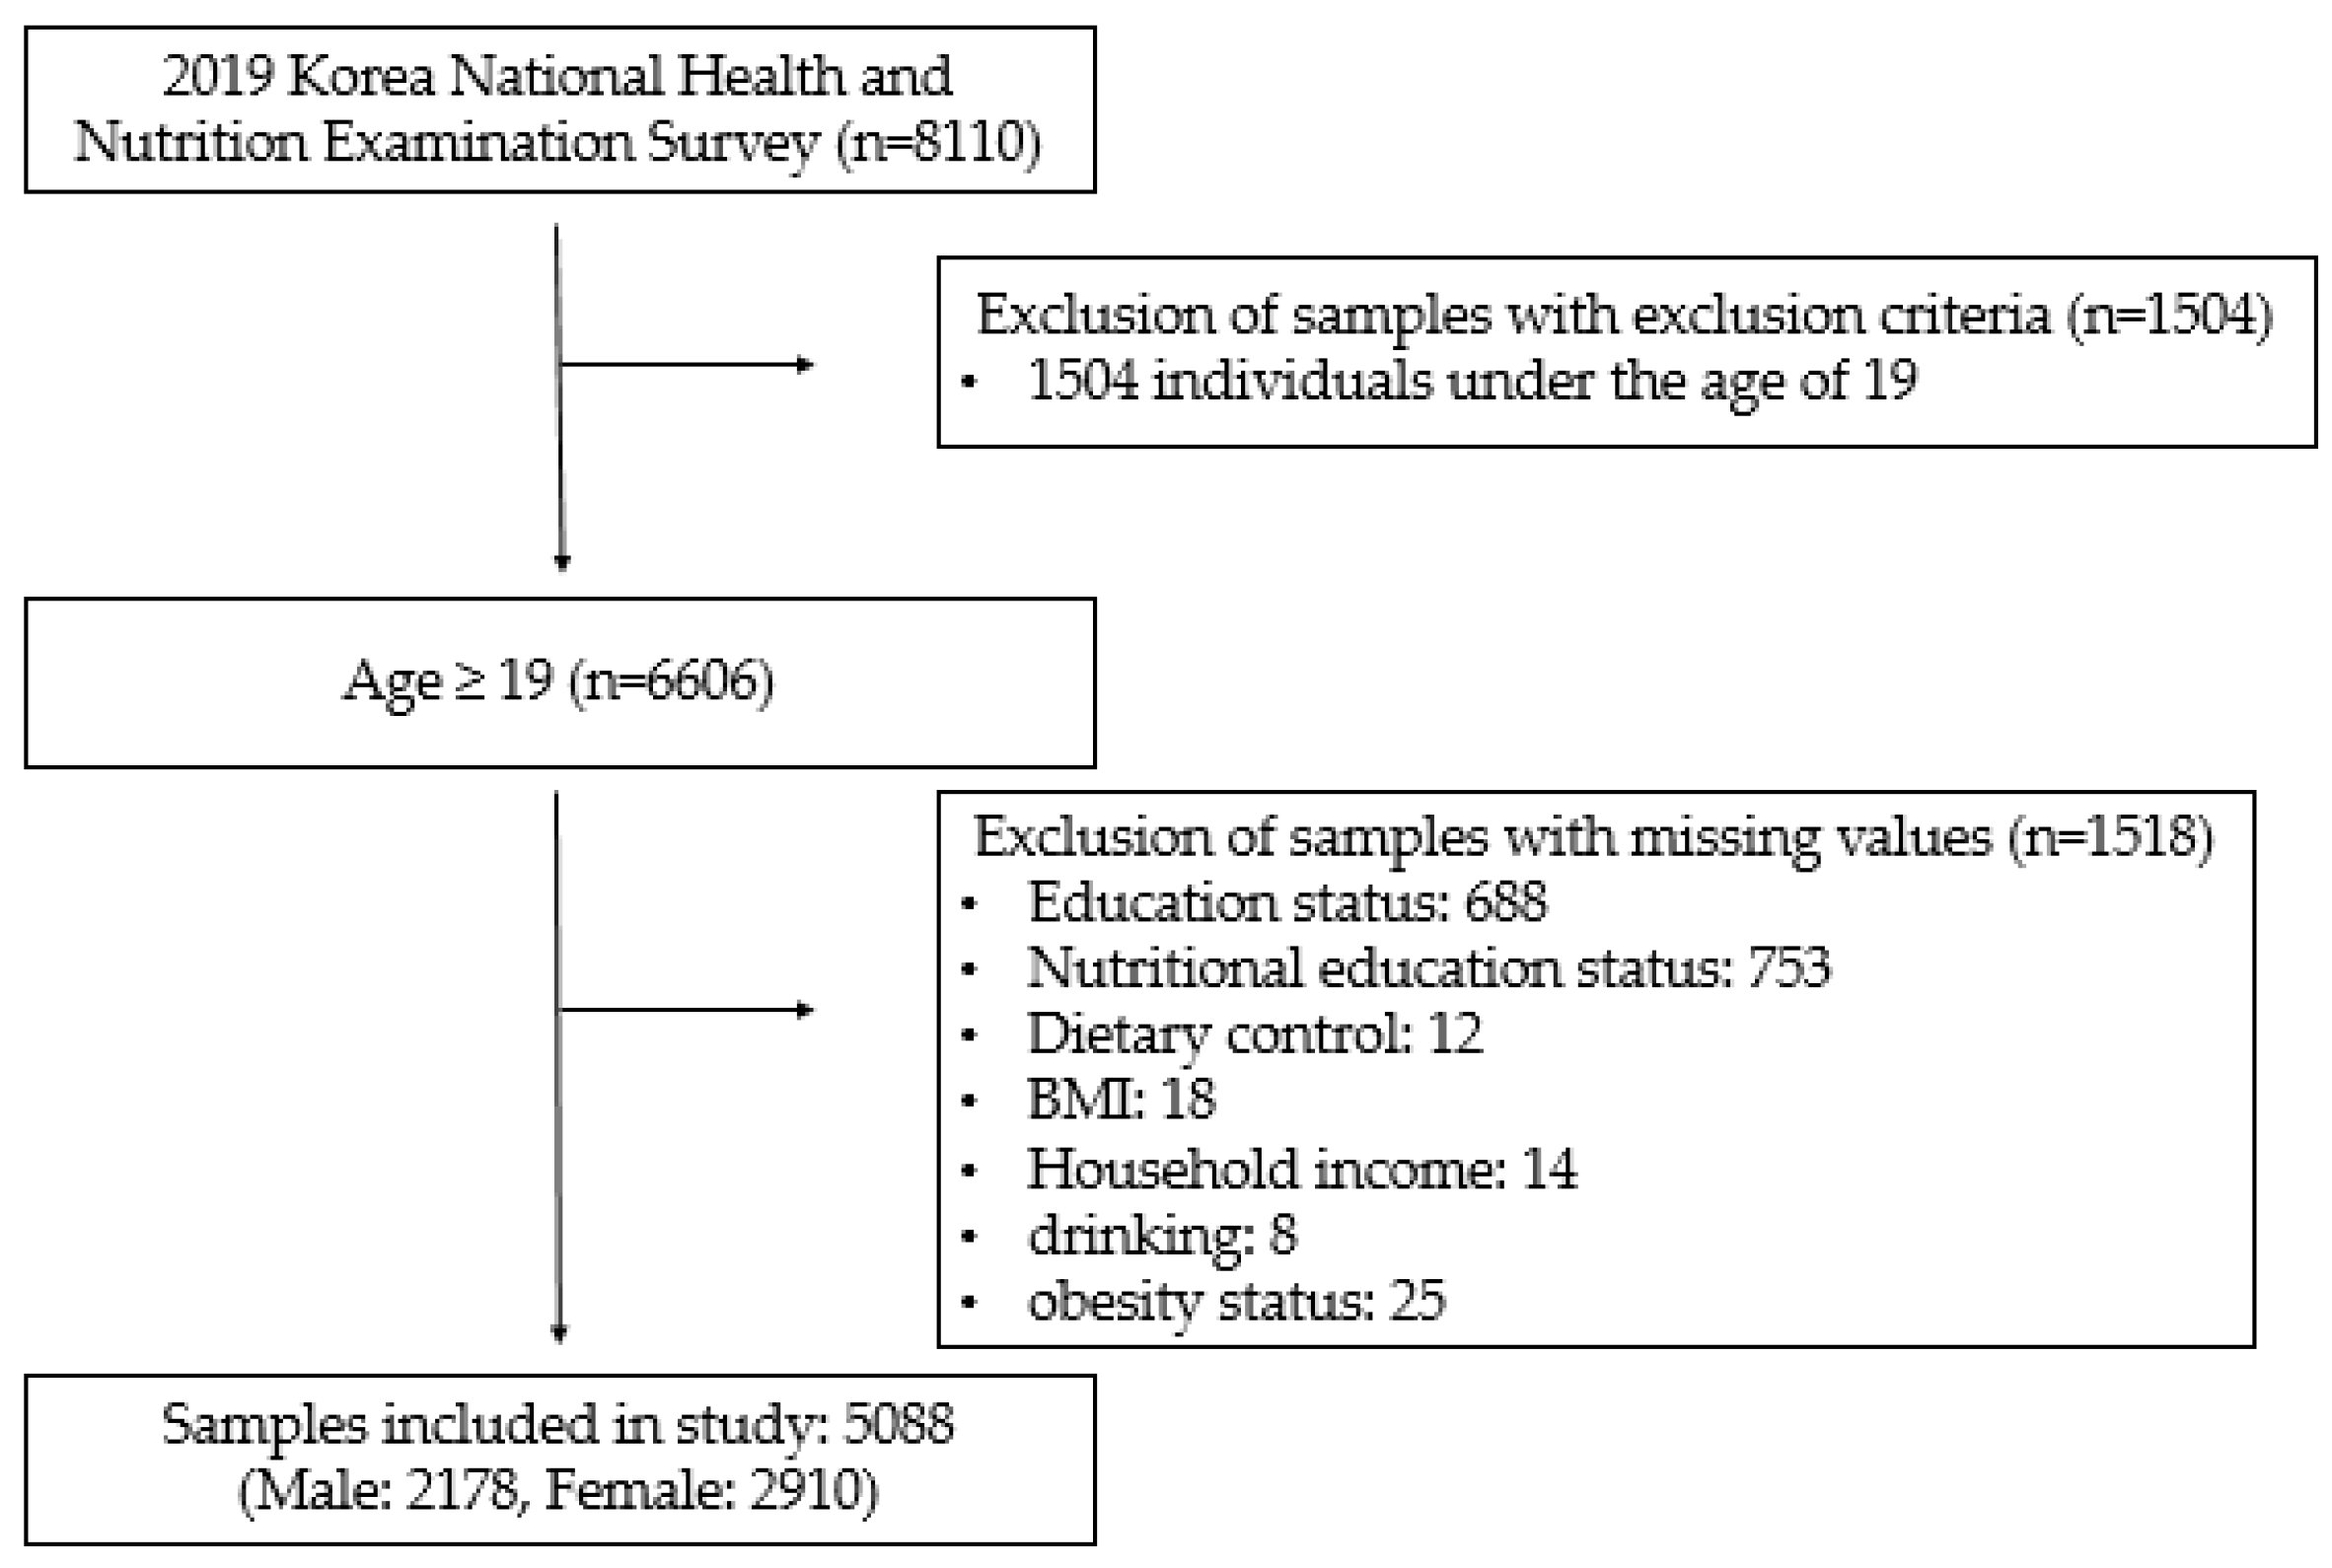
2. Materials and Methods
2.1. Data Collection
2.2. Variables
2.3. Statistical Analysis
3. Results
3.1. Analysis of Overall Intake Suitability
3.2. Analysis of Individual Nutrient Intake Suitability
3.3. Subgroup Analysis of Overall Mineral Intake Suitability
4. Discussion
5. Conclusions
Supplementary Materials
Author Contributions
Funding
Institutional Review Board Statement
Informed Consent Statement
Data Availability Statement
Acknowledgments
Conflicts of Interest
References
- Ford, E.S.; Dietz, W.H. Trends in energy intake among adults in the United States: Findings from NHANES. Am. J. Clin. Nutr. 2013, 97, 848–853. [Google Scholar] [CrossRef] [PubMed] [Green Version]
- Yun, S.; Kim, H.J.; Oh, K. Trends in energy intake among Korean adults, 1998-2015: Results from the Korea National Health and Nutrition Examination Survey. Nutr. Res. Pract. 2017, 11, 147–154. [Google Scholar] [CrossRef] [Green Version]
- Kennedy, D.O. B Vitamins and the Brain: Mechanisms, Dose and Efficacy—A Review. Nutrients 2016, 8, 68. [Google Scholar] [CrossRef] [Green Version]
- Eshak, E.S.; Arafa, A.E. Thiamine deficiency and cardiovascular disorders. Nutr. Metab. Cardiovasc. Dis. 2018, 28, 965–972. [Google Scholar] [CrossRef] [PubMed]
- Mosegaard, S.; Dipace, G.; Bross, P.; Carlsen, J.; Gregersen, N.; Olsen, R.K.J. Riboflavin Deficiency-Implications for General Human Health and Inborn Errors of Metabolism. Int. J. Mol. Sci. 2020, 21, 3847. [Google Scholar] [CrossRef]
- Meyer-Ficca, M.; Kirkland, J.B. Niacin. Adv. Nutr. 2016, 7, 556–558. [Google Scholar] [CrossRef] [Green Version]
- Chan, Y.M.; Bailey, R.; O’Connor, D.L. Folate. Adv. Nutr. 2013, 4, 123–125. [Google Scholar] [CrossRef] [PubMed]
- Abbaspour, R.H.N.; Kelishadi, R. Review on iron and its importance for human health. J. Res. Med. Sci. 2014, 19, 164–174. [Google Scholar] [PubMed]
- Dinaz, Z.; Nalgamwalla, J.A.W. Urs Giger. Iron deficiency anemia. Can. Vet. J. 2012, 53, 250–256. [Google Scholar]
- Takeda, E.; Yamamoto, H.; Yamanaka-Okumura, H.; Taketani, Y. Dietary phosphorus in bone health and quality of life. Nutr. Rev. 2012, 70, 311–321. [Google Scholar] [CrossRef] [PubMed]
- Cashman, K.D. Calcium intake, calcium bioavailability and bone health. Br. J. Nutr. 2007, 87, S169–S177. [Google Scholar] [CrossRef]
- Verkaik-Kloosterman, J.; McCann, M.T.; Hoekstra, J.; Verhagen, H. Vitamins and minerals: Issues associated with too low and too high population intakes. Food Nutr. Res. 2012, 56, 5728. [Google Scholar] [CrossRef] [PubMed]
- Hiza, H.A.; Casavale, K.O.; Guenther, P.M.; Davis, C.A. Diet quality of Americans differs by age, sex, race/ethnicity, income, and education level. J. Acad. Nutr. Diet. 2013, 113, 297–306. [Google Scholar] [CrossRef] [PubMed]
- Dubois, M.G.L. Social position and nutrition a gradient relationship in Canada and USA. Eur. J. Clin. Nutr. 2001, 55, 366–373. [Google Scholar] [CrossRef] [Green Version]
- OECD. Poverty Rate (Indicator); OECD: Paris, France, 2021. [Google Scholar] [CrossRef]
- Hur, I.; Jang, M.J.; Oh, K. Food and nutrient intakes according to income in korean men and women. Osong Public Health Res. Perspect. 2011, 2, 192–197. [Google Scholar] [CrossRef] [Green Version]
- Kweon, S.; Kim, Y.; Jang, M.J.; Kim, Y.; Kim, K.; Choi, S.; Chun, C.; Khang, Y.H.; Oh, K. Data resource profile: The Korea National Health and Nutrition Examination Survey (KNHANES). Int. J. Epidemiol. 2014, 43, 69–77. [Google Scholar] [CrossRef] [Green Version]
- Tsakoumaki, F.; Kyrkou, C.; Athanasiadis, A.P.; Menexes, G.; Michaelidou, A.M. Nutritional Inadequacy: Unraveling the Methodological Challenges for the Application of the Probability Approach or the EAR Cut-Point Method-A Pregnancy Perspective. Nutrients 2021, 13, 3473. [Google Scholar] [CrossRef]
- Institute of Medicine (US) Subcommittee on Interpretation; Uses of Dietary Reference Intakes; Institute of Medicine (US) Standing Committee on the Scientific Evaluation of Dietary Reference Intakes. DRI Dietary Reference Intakes: Applications in Dietary Assessment; National Academies Press (US): Washington, DC, USA, 2000. [Google Scholar] [CrossRef]
- Alicia, L.; Carriquiry, G.C.-G. Evaluation of Dietary Intake Data Using the Tolerable Upper Intake Levels. J. Nutr. 2006, 136, 507–513. [Google Scholar]
- Dietary Reference Intakes for Koreans 2020; The Korean Ministry of Health and Welfare: Sejong, Korea, 2020.
- Drewnowski, A.; Darmon, N. The economics of obesity: Dietary energy density and energy cost. Am. J. Clin. Nutr. 2005, 82, 265s–273s. [Google Scholar] [CrossRef]
- Alison, M.; Smith, K.I.B. Public health implications of dietary differences between social status and occupational category groups. J. Epidemiol. Community Health 1992, 46, 409–416. [Google Scholar]
- Monsivais, P.; Aggarwal, A.; Drewnowski, A. Time Spent on Home Food Preparation and Indicators of Healthy Eating. Am. J. Prev. Med. 2014, 47, 796–802. [Google Scholar] [CrossRef] [PubMed] [Green Version]
- Fleischhacker, S.E.; Evenson, K.R.; Rodriguez, D.A.; Ammerman, A.S. A systematic review of fast food access studies. Obes Rev. 2011, 12, e460–e471. [Google Scholar] [CrossRef] [PubMed]
- He, K.S.; Yoon, K.A.; Kim, W.K.; Park, O.J. Urban nutritional problems of Korea. Southeast. Asian J. Trop. Med. Public Health 1992, 23 (Suppl. 3), 69–76. [Google Scholar] [PubMed]
- Kim, Y.N.; Cho, Y.O. Prevalent Low Thiamine Status Among Adults Living in Seoul Metropolitan Area (South Korea). Int. J. Vitam Nutr. Res. 2019, 89, 314–320. [Google Scholar] [CrossRef]
- Choi, J.Y.; Kim, Y.-N.; Cho, Y.-O. Evaluation of riboflavin intakes and status of 20-64-year-old adults in South Korea. Nutrients 2014, 7, 253–264. [Google Scholar] [CrossRef] [Green Version]
- Salvador Castell, G.; Serra-Majem, L.; Ribas-Barba, L. What and how much do we eat? 24-hour dietary recall method. Nutr. Hosp. 2015, 31 (Suppl. 3), 46–48. [Google Scholar] [CrossRef] [PubMed]
- Bedard, D.; Shatenstein, B.; Nadon, S. Underreporting of energy intake from a self-administered food-frequency questionnaire completed by adults in Montreal. Public Health Nutr. 2004, 7, 675–681. [Google Scholar] [CrossRef]
- Burrows, T.L.; Ho, Y.Y.; Rollo, M.E.; Collins, C.E. Validity of Dietary Assessment Methods When Compared to the Method of Doubly Labeled Water: A Systematic Review in Adults. Front. Endocrinol. 2019, 10, 850. [Google Scholar] [CrossRef] [Green Version]
- Mumu, S.J.; Merom, D.; Ali, L.; Fahey, P.P.; Hossain, I.; Rahman, A.K.M.F.; Allman-Farinelli, M. Validation of a food frequency questionnaire as a tool for assessing dietary intake in cardiovascular disease research and surveillance in Bangladesh. Nutr. J. 2020, 19, 42. [Google Scholar] [CrossRef]
- Yook, S.-M.; Park, S.; Moon, H.-K.; Kim, K.; Shim, J.E.; Hwang, J.-Y. Development of Korean Healthy Eating Index for adults using the Korea National Health and Nutrition Examination Survey data. J. Nutr. Health 2015, 48, 419–428. [Google Scholar] [CrossRef] [Green Version]
- Lee, J.-Y.; Choi, S.-K.; Seo, J.-S. Evaluation of the Nutrition Status and Metabolic Syndrome Prevalence of the Members according to the Number of Household Members based on the Korea National Health and Nutrition Examination Survey (2013–2014). Korean J. Community Nutr. 2019, 24, 232–244. [Google Scholar] [CrossRef] [Green Version]
- Wolla, S.A.; Sullivan, J. “Education, Income, and Wealth,” Page One Economics®. 2017. Available online: https://research.stlouisfed.org/publications/page1-econ/2017/01/03/education-income-and-wealth/ (accessed on 15 November 2021).
- Hong, S.A.; Kim, K.; Kim, M.K. Trends in the inequality of fruit and vegetable consumption between education levels indicated by the Korea National Health and Nutrition Examination Surveys. Eur. J. Clin. Nutr. 2012, 66, 942–949. [Google Scholar] [CrossRef] [PubMed]
- Kim, H.-J.; Ruger, J.P. Socioeconomic disparities in behavioral risk factors and health outcomes by gender in the Republic of Korea. BMC Public Health 2010, 10, 195. [Google Scholar] [CrossRef] [Green Version]

| Variables | Overall Vitamins | Overall Minerals | ||||||||||
|---|---|---|---|---|---|---|---|---|---|---|---|---|
| Total | Suitability = 0 | Suitability = 1 | p-Value | Suitability = 0 | Suitability = 1 | p-Value | ||||||
| N | % | N | % | N | % | N | % | N | % | |||
| Total (n = 5088) | 5088 | 100 | 4647 | 91.3 | 441 | 8.7 | 3878 | 76.2 | 1210 | 23.8 | ||
| Household income quintile | 0.004 | <0.0001 | ||||||||||
| 1 (very low) | 765 | 15.0 | 714 | 93.3 | 51 | 6.7 | 643 | 84.1 | 122 | 15.9 | ||
| 2 (low) | 946 | 18.6 | 879 | 92.9 | 67 | 7.1 | 740 | 78.2 | 206 | 21.8 | ||
| 3 (medium) | 1001 | 19.7 | 917 | 91.6 | 84 | 8.4 | 750 | 74.9 | 251 | 25.1 | ||
| 4 (high) | 1159 | 22.8 | 1054 | 90.9 | 105 | 9.1 | 871 | 75.2 | 288 | 24.8 | ||
| 5 (very high) | 1217 | 23.9 | 1083 | 89.0 | 134 | 11.0 | 874 | 71.8 | 343 | 28.2 | ||
| Sex | 0.823 | <0.0001 | ||||||||||
| Male | 2178 | 42.8 | 1987 | 91.2 | 191 | 8.8 | 1545 | 70.9 | 633 | 29.1 | ||
| Female | 2910 | 57.2 | 2660 | 91.4 | 250 | 8.6 | 2333 | 80.2 | 577 | 19.8 | ||
| Age (years) | 0.003 | <0.0001 | ||||||||||
| 19~29 | 579 | 11.4 | 541 | 93.4 | 38 | 6.6 | 469 | 81.0 | 119 | 20.6 | ||
| 30~39 | 737 | 14.5 | 675 | 91.6 | 62 | 8.4 | 572 | 77.6 | 165 | 22.4 | ||
| 40~49 | 936 | 18.4 | 847 | 90.5 | 89 | 9.5 | 724 | 77.4 | 212 | 22.6 | ||
| 50~59 | 961 | 18.9 | 857 | 89.2 | 104 | 10.8 | 675 | 70.2 | 286 | 29.8 | ||
| 60~69 | 928 | 18.2 | 839 | 90.4 | 89 | 9.6 | 673 | 72.5 | 255 | 27.5 | ||
| 70+ | 947 | 18.6 | 888 | 93.8 | 59 | 6.2 | 774 | 81.7 | 173 | 18.3 | ||
| Educational level | 0.002 | <0.0001 | ||||||||||
| below middle school | 1360 | 26.7 | 1275 | 93.8 | 85 | 6.3 | 1120 | 82.4 | 240 | 17.6 | ||
| high school | 1407 | 27.7 | 1276 | 90.7 | 131 | 9.3 | 1049 | 74.6 | 358 | 25.4 | ||
| College | 2064 | 40.6 | 1868 | 90.5 | 196 | 9.5 | 1534 | 74.3 | 530 | 25.7 | ||
| graduate school | 257 | 5.1 | 228 | 88.7 | 29 | 11.3 | 175 | 68.1 | 82 | 31.9 | ||
| Chronic disease a | 0.103 | 0.152 | ||||||||||
| 0 | 3354 | 65.9 | 3043 | 90.7 | 311 | 9.3 | 2535 | 75.6 | 819 | 24.4 | ||
| 1 | 931 | 18.3 | 861 | 92.5 | 70 | 7.5 | 710 | 76.3 | 221 | 23.7 | ||
| ≥2 | 803 | 15.8 | 743 | 92.5 | 60 | 7.5 | 633 | 78.8 | 170 | 21.2 | ||
| Alcohol | 0.167 | 0.013 | ||||||||||
| Never | 559 | 11.0 | 516 | 92.3 | 43 | 7.7 | 453 | 81.0 | 106 | 19.0 | ||
| Occasionally, 2~4 times/month | 3489 | 68.6 | 3169 | 90.8 | 320 | 9.2 | 2648 | 75.9 | 841 | 24.1 | ||
| 2~4 times/week | 1040 | 20.4 | 962 | 92.5 | 78 | 7.5 | 777 | 74.7 | 263 | 25.3 | ||
| Smoking | 0.670 | <0.0001 | ||||||||||
| Never | 3088 | 60.7 | 2813 | 91.1 | 275 | 8.9 | 2430 | 78.7 | 658 | 21.3 | ||
| Quit smoking | 1167 | 22.9 | 1065 | 91.3 | 102 | 8.7 | 834 | 71.5 | 333 | 28.5 | ||
| <1 time/day | 125 | 2.5 | 117 | 93.6 | 8 | 6.4 | 100 | 80.0 | 25 | 20.0 | ||
| ≥1 time/day | 708 | 13.9 | 652 | 92.1 | 56 | 7.9 | 514 | 72.6 | 194 | 27.4 | ||
| Obesity Status b | 0.217 | 0.335 | ||||||||||
| Underweight | 198 | 3.9 | 183 | 92.4 | 15 | 7.6 | 159 | 80.3 | 39 | 19.7 | ||
| Normal | 2001 | 39.3 | 1807 | 90.3 | 194 | 9.7 | 1519 | 75.9 | 482 | 24.1 | ||
| Overweight | 1180 | 23.2 | 1085 | 91.9 | 95 | 8.1 | 885 | 75.0 | 295 | 25.0 | ||
| Obese | 1709 | 33.6 | 1572 | 92.0 | 137 | 8.0 | 1315 | 76.9 | 394 | 23.1 | ||
| Nutritional Education Status | 0.000 | 0.479 | ||||||||||
| Yes | 278 | 5.5 | 237 | 85.3 | 41 | 14.7 | 207 | 74.5 | 71 | 25.5 | ||
| No | 4810 | 94.5 | 4410 | 91.7 | 400 | 8.3 | 3671 | 76.3 | 1139 | 23.7 | ||
| Diet | 0.057 | 0.372 | ||||||||||
| Yes | 1473 | 29.0 | 1328 | 90.2 | 145 | 9.8 | 1135 | 77.1 | 338 | 22.9 | ||
| No | 3615 | 71.0 | 3319 | 91.8 | 296 | 8.2 | 2743 | 75.9 | 872 | 24.1 | ||
| Energy intake (Mean, SD, kcal) | 1849 | 862.3 | 1771 | 802.6 | 2667 | 1030 | <0.0001 | 1663 | 750.5 | 2255 | 924.3 | <0.0001 |
| Variables | Overall Vitamins | Overall Minerals | ||||||||
|---|---|---|---|---|---|---|---|---|---|---|
| AOR | 95% CI | p-Value | AOR | 95% CI | p-Value | |||||
| Household income quintile | 0.165 | 0.129 | ||||||||
| 1 (very low) | 1.00 | 1.00 | ||||||||
| 2 (low) | 0.89 | 0.51 | – | 1.53 | 1.42 | 1.00 | – | 2.01 | ||
| 3 (medium) | 0.95 | 0.53 | – | 1.70 | 1.41 | 1.01 | – | 1.96 | ||
| 4 (high) | 1.07 | 0.63 | – | 1.82 | 1.30 | 0.90 | – | 1.86 | ||
| 5 (very high) | 1.21 | 0.69 | – | 2.10 | 1.54 | 1.07 | – | 2.21 | ||
| Sex | ||||||||||
| Male | 1.00 | 1.00 | ||||||||
| Female | 1.65 | 1.11 | – | 2.44 | 1.10 | 0.85 | – | 1.44 | ||
| Age (years) | ||||||||||
| 19~29 | 1.00 | 1.00 | ||||||||
| 30~39 | 1.80 | 1.00 | – | 3.24 | 1.18 | 0.81 | – | 1.71 | ||
| 40~49 | 2.48 | 1.46 | – | 4.19 | 1.45 | 1.01 | – | 2.06 | ||
| 50~59 | 3.33 | 1.88 | – | 5.90 | 2.87 | 2.00 | – | 4.12 | ||
| 60~69 | 4.99 | 2.76 | – | 9.04 | 3.94 | 2.58 | – | 6.00 | ||
| 70+ | 5.23 | 2.54 | – | 10.78 | 3.73 | 2.32 | – | 5.98 | ||
| Educational level | ||||||||||
| below middle school | 1.00 | 1.00 | ||||||||
| high school | 1.59 | 0.97 | – | 2.61 | 1.56 | 1.16 | – | 2.09 | ||
| college | 1.61 | 0.98 | – | 2.66 | 1.71 | 1.22 | – | 2.39 | ||
| graduate school | 1.74 | 0.98 | – | 3.08 | 1.88 | 1.21 | – | 2.93 | ||
| Chronic disease a | ||||||||||
| 0 | 1.00 | 1.00 | ||||||||
| 1 | 0.95 | 0.66 | – | 1.36 | 1.03 | 0.82 | – | 1.30 | ||
| ≥2 | 0.79 | 0.53 | – | 1.18 | 0.86 | 0.65 | – | 1.13 | ||
| Alcohol | ||||||||||
| Never | 1.00 | 1.00 | ||||||||
| Occasionally, 2~4 times/month | 0.97 | 0.64 | – | 1.46 | 1.12 | 0.81 | – | 1.54 | ||
| 2~4 times/week | 0.41 | 0.24 | – | 0.72 | 0.71 | 0.48 | – | 1.05 | ||
| Smoking | ||||||||||
| Never | 1.00 | 1.00 | ||||||||
| Quit smoking | 0.90 | 0.57 | – | 1.43 | 0.98 | 0.73 | – | 1.31 | ||
| <1 time/day | 1.02 | 0.33 | – | 3.18 | 0.79 | 0.42 | – | 1.49 | ||
| ≥1 time/day | 0.76 | 0.47 | – | 1.23 | 0.90 | 0.65 | – | 1.24 | ||
| Obesity Status b | ||||||||||
| Normal | 1.00 | 1.00 | ||||||||
| Underweight | 1.24 | 0.69 | – | 2.23 | 1.13 | 0.75 | – | 1.69 | ||
| Overweight | 0.73 | 0.54 | – | 0.99 | 0.90 | 0.73 | – | 1.10 | ||
| Obese | 0.80 | 0.59 | – | 1.09 | 0.85 | 0.71 | – | 1.02 | ||
| Nutritional Education Status | ||||||||||
| No | 1.00 | 1.00 | ||||||||
| Yes | 1.85 | 1.19 | – | 2.88 | 1.14 | 0.79 | – | 1.65 | ||
| Diet | ||||||||||
| No | 1.00 | 1.00 | ||||||||
| Yes | 1.48 | 1.14 | – | 1.92 | 1.10 | 0.91 | – | 1.33 | ||
| Energy intake (kcal) | 1.00 | 1.00 | – | 1.00 | 1.00 | 1.00 | – | 1.00 | ||
| Household Income Quintile | ||||||||||||||||||
|---|---|---|---|---|---|---|---|---|---|---|---|---|---|---|---|---|---|---|
| Outcomes | Quintile 1 (Very Low) | Quintile 2 (Low) | Quintile 3 (Medium) | Quintile 4 (High) | Quintile 5 (Very High) | p-Value | ||||||||||||
| AOR | AOR | 95% CI | AOR | 95% CI | AOR | 95% CI | AOR | 95% CI | ||||||||||
| Vitamin A intake suitability | 1.00 | 0.89 | 0.51 | – | 1.53 | 0.95 | 0.53 | – | 1.70 | 1.07 | 0.63 | – | 1.82 | 1.21 | 0.69 | – | 2.10 | 0.212 |
| Vitamin B1 intake suitability | 1.00 | 1.03 | 0.74 | – | 1.43 | 1.05 | 0.51 | – | 1.53 | 1.10 | 0.77 | – | 1.57 | 1.20 | 0.82 | – | 1.77 | 0.762 |
| Vitamin B2 intake suitability | 1.00 | 0.93 | 0.68 | – | 1.26 | 0.97 | 0.71 | – | 1.34 | 0.91 | 0.66 | – | 1.26 | 0.94 | 0.67 | – | 1.32 | 0.216 |
| Vitamin B3 intake suitability | 1.00 | 1.28 | 0.98 | – | 1.66 | 1.09 | 0.78 | – | 1.52 | 1.11 | 0.80 | – | 1.53 | 1.44 | 1.05 | – | 1.98 | 0.103 |
| Vitamin B9 intake suitability | 1.00 | 1.03 | 0.76 | – | 1.38 | 1.21 | 0.85 | – | 1.71 | 1.26 | 0.90 | – | 1.77 | 1.44 | 1.03 | – | 2.03 | 0.005 |
| Vitamin C intake suitability | 1.00 | 0.97 | 0.71 | – | 1.33 | 1.24 | 0.89 | – | 1.72 | 1.25 | 0.91 | – | 1.71 | 1.47 | 1.03 | – | 2.09 | 0.006 |
| Ca intake suitability | 1.00 | 1.43 | 1.02 | – | 2.01 | 1.55 | 1.12 | – | 2.13 | 1.26 | 0.90 | – | 1.75 | 1.40 | 1.00 | – | 1.96 | 0.530 |
| P intake suitability | 1.00 | 1.04 | 0.75 | – | 1.43 | 1.00 | 0.70 | – | 1.43 | 1.20 | 0.85 | – | 1.71 | 1.67 | 1.19 | – | 2.34 | 0.011 |
| Fe intake suitability | 1.00 | 1.51 | 1.06 | – | 2.13 | 1.49 | 1.06 | – | 2.10 | 1.55 | 1.06 | – | 2.27 | 1.84 | 1.23 | – | 2.75 | <0.001 |
| Variables | Household Income Quintile | |||||||||||||||||
|---|---|---|---|---|---|---|---|---|---|---|---|---|---|---|---|---|---|---|
| Quintile 1 (Very Low) | Quintile 2 (Low) | Quintile 3 (Medium) | Quintile 4 (High) | Quintile 5 (Very High) | p-Value | |||||||||||||
| AOR | AOR | 95% CI | AOR | 95% CI | AOR | 95% CI | AOR | 95% CI | ||||||||||
| Sex | ||||||||||||||||||
| Male | 1.00 | 1.08 | 0.70 | – | 1.68 | 1.18 | 0.78 | – | 1.79 | 0.92 | 0.58 | – | 1.47 | 1.17 | 0.76 | - | 1.81 | 0.767 |
| Female | 1.00 | 1.79 | 1.04 | – | 3.07 | 1.74 | 1.01 | – | 3.01 | 1.90 | 1.11 | – | 3.23 | 2.12 | 1.16 | - | 3.88 | 0.041 |
| Age (years) | – | |||||||||||||||||
| 19~29 | 1.00 | 1.89 | 0.50 | – | 7.18 | 1.21 | 0.43 | – | 3.41 | 1.07 | 0.35 | – | 3.31 | 1.89 | 0.65 | - | 5.46 | 0.295 |
| 30~39 | 1.00 | 1.41 | 0.48 | – | 4.13 | 1.04 | 0.33 | – | 3.25 | 1.17 | 0.35 | – | 3.89 | 0.89 | 0.27 | - | 2.97 | 0.354 |
| 40~49 | 1.00 | 0.76 | 0.24 | – | 2.38 | 0.67 | 0.23 | – | 1.94 | 0.80 | 0.27 | – | 2.36 | 0.85 | 0.30 | - | 2.43 | 0.704 |
| 50~59 | 1.00 | 0.99 | 0.39 | – | 2.51 | 1.03 | 0.42 | – | 2.54 | 1.14 | 0.50 | – | 2.64 | 1.48 | 0.67 | – | 3.25 | 0.085 |
| 60~69 | 1.00 | 1.15 | 0.54 | – | 2.48 | 2.65 | 1.22 | – | 5.75 | 1.34 | 0.63 | – | 2.86 | 1.62 | 0.71 | – | 3.65 | 0.238 |
| 70+ | 1.00 | 1.77 | 1.06 | – | 2.96 | 1.67 | 0.93 | – | 3.01 | 0.90 | 0.47 | – | 1.72 | 0.77 | 0.20 | – | 3.01 | 0.995 |
| Educational level | ||||||||||||||||||
| below middle school | 1.00 | 1.50 | 0.89 | – | 2.53 | 1.98 | 1.15 | – | 3.38 | 1.62 | 0.88 | – | 2.98 | 1.72 | 0.78 | – | 3.78 | 0.061 |
| high school | 1.00 | 1.46 | 0.75 | – | 2.84 | 0.98 | 0.54 | – | 1.78 | 0.98 | 0.52 | – | 1.83 | 1.10 | 0.60 | – | 2.02 | 0.481 |
| college | 1.00 | 1.05 | 0.54 | – | 2.04 | 1.22 | 0.68 | – | 2.19 | 1.02 | 0.52 | – | 1.99 | 1.38 | 0.74 | – | 2.59 | 0.224 |
| graduate school | 1.00 | 0.77 | 0.06 | – | 10.22 | 1.20 | 0.13 | – | 11.26 | 1.84 | 0.20 | – | 17.21 | 1.28 | 0.14 | – | 12.07 | 0.726 |
| Chronic disease a | ||||||||||||||||||
| 0.000 | 1.00 | 1.15 | 0.73 | – | 1.81 | 1.04 | 0.66 | – | 1.62 | 1.10 | 0.69 | – | 1.76 | 1.23 | 0.77 | – | 1.97 | 0.384 |
| 1.000 | 1.00 | 1.87 | 0.96 | – | 3.66 | 3.25 | 1.72 | – | 6.12 | 1.54 | 0.73 | – | 3.21 | 2.57 | 1.25 | – | 5.27 | 0.084 |
| ≥2 | 1.00 | 1.68 | 0.80 | – | 3.53 | 1.65 | 0.77 | – | 3.51 | 1.44 | 0.55 | – | 3.79 | 1.61 | 0.69 | – | 3.76 | 0.517 |
| Alcohol | ||||||||||||||||||
| Never | 1.00 | 1.79 | 0.69 | – | 4.62 | 4.12 | 1.57 | – | 10.84 | 1.85 | 0.69 | – | 4.98 | 1.55 | 0.46 | – | 5.19 | 0.307 |
| Occasionally, 2~4 times/month | 1.00 | 1.56 | 1.04 | – | 2.34 | 1.35 | 0.88 | – | 2.07 | 1.37 | 0.90 | – | 2.09 | 1.64 | 1.11 | – | 2.44 | 0.099 |
| 2~4 times/week | 1.00 | 1.03 | 0.49 | – | 2.17 | 1.03 | 0.48 | – | 2.20 | 0.88 | 0.39 | – | 1.98 | 1.06 | 0.47 | – | 2.40 | 0.981 |
| Smoking | ||||||||||||||||||
| Never | 1.00 | 1.76 | 1.08 | – | 2.87 | 1.48 | 0.89 | – | 2.45 | 1.47 | 0.90 | – | 2.40 | 1.66 | 0.98 | – | 2.80 | 0.330 |
| Quit smoking | 1.00 | 1.24 | 0.70 | – | 2.20 | 1.40 | 0.77 | – | 2.53 | 1.22 | 0.65 | – | 2.28 | 1.55 | 0.90 | – | 2.65 | 0.230 |
| <1 time/day | 1.00 | 0.42 | 0.02 | – | 8.02 | 12.23 | 1.65 | – | 90.56 | 4.95 | 0.22 | – | 112.47 | 13.46 | 1.34 | – | 135.04 | 0.065 |
| ≥1 time/day | 1.00 | 0.88 | 0.42 | – | 1.84 | 1.13 | 0.52 | – | 2.45 | 0.88 | 0.39 | – | 1.97 | 0.98 | 0.41 | – | 2.38 | 0.958 |
| Obesity Status b | ||||||||||||||||||
| Normal | 1.00 | 1.68 | 0.85 | – | 3.33 | 1.19 | 0.63 | – | 2.28 | 1.74 | 0.92 | – | 3.29 | 1.98 | 0.98 | – | 4.00 | 0.052 |
| Underweight | 1.00 | 0.28 | 0.05 | – | 1.73 | 1.09 | 0.21 | – | 5.65 | 1.80 | 0.24 | – | 13.41 | 1.62 | 0.28 | – | 9.45 | 0.247 |
| Overweight | 1.00 | 1.47 | 0.81 | – | 2.66 | 1.34 | 0.74 | – | 2.43 | 1.14 | 0.62 | – | 2.12 | 1.25 | 0.70 | – | 2.23 | 0.910 |
| Obese | 1.00 | 1.06 | 0.61 | – | 1.83 | 1.63 | 0.96 | – | 2.76 | 0.97 | 0.54 | – | 1.76 | 1.22 | 0.70 | – | 2.13 | 0.970 |
| Nutritional Education Status | ||||||||||||||||||
| No | 1.00 | 1.47 | 1.02 | – | 2.11 | 1.50 | 1.07 | – | 2.11 | 1.39 | 0.96 | – | 2.00 | 1.59 | 1.09 | – | 2.30 | 0.124 |
| Yes | 1.00 | 0.74 | 0.21 | – | 2.58 | 0.52 | 0.15 | – | 1.83 | 0.42 | 0.07 | – | 2.63 | 1.32 | 0.27 | – | 6.51 | 0.526 |
| Diet | ||||||||||||||||||
| No | 1.00 | 1.66 | 1.09 | – | 2.52 | 1.46 | 0.96 | – | 2.21 | 1.56 | 1.02 | – | 2.39 | 1.63 | 1.05 | – | 2.53 | 0.169 |
| Yes | 1.00 | 0.98 | 0.52 | – | 1.83 | 1.38 | 0.76 | – | 2.53 | 0.86 | 0.46 | – | 1.60 | 1.42 | 0.79 | – | 2.56 | 0.297 |
Publisher’s Note: MDPI stays neutral with regard to jurisdictional claims in published maps and institutional affiliations. |
© 2021 by the authors. Licensee MDPI, Basel, Switzerland. This article is an open access article distributed under the terms and conditions of the Creative Commons Attribution (CC BY) license (https://creativecommons.org/licenses/by/4.0/).
Share and Cite
Oh, H.; Kim, J.; Huh, Y.; Kim, S.H.; Jang, S.-I. Association of Household Income Level with Vitamin and Mineral Intake. Nutrients 2022, 14, 38. https://doi.org/10.3390/nu14010038
Oh H, Kim J, Huh Y, Kim SH, Jang S-I. Association of Household Income Level with Vitamin and Mineral Intake. Nutrients. 2022; 14(1):38. https://doi.org/10.3390/nu14010038
Chicago/Turabian StyleOh, Haegyu, Juyeon Kim, Yune Huh, Seung Hoon Kim, and Sung-In Jang. 2022. "Association of Household Income Level with Vitamin and Mineral Intake" Nutrients 14, no. 1: 38. https://doi.org/10.3390/nu14010038
APA StyleOh, H., Kim, J., Huh, Y., Kim, S. H., & Jang, S.-I. (2022). Association of Household Income Level with Vitamin and Mineral Intake. Nutrients, 14(1), 38. https://doi.org/10.3390/nu14010038