Exploring the Geographic Variation in Fruit and Vegetable Purchasing Behaviour Using Supermarket Transaction Data

 ,
,
Abstract
1. Introduction
- Examine the small-area spatial distribution of fruit and vegetable purchases and predictors of this purchase behaviour
- Explore associations at a neighbourhood level between mean daily fruit and vegetable portions purchased and area socioeconomic characteristics, customer demographics, and access to supermarkets.
- Develop a statistical model that identifies drivers of fruit and vegetable purchasing at a neighbourhood level.
2. Materials and Methods
2.1. Study Sample
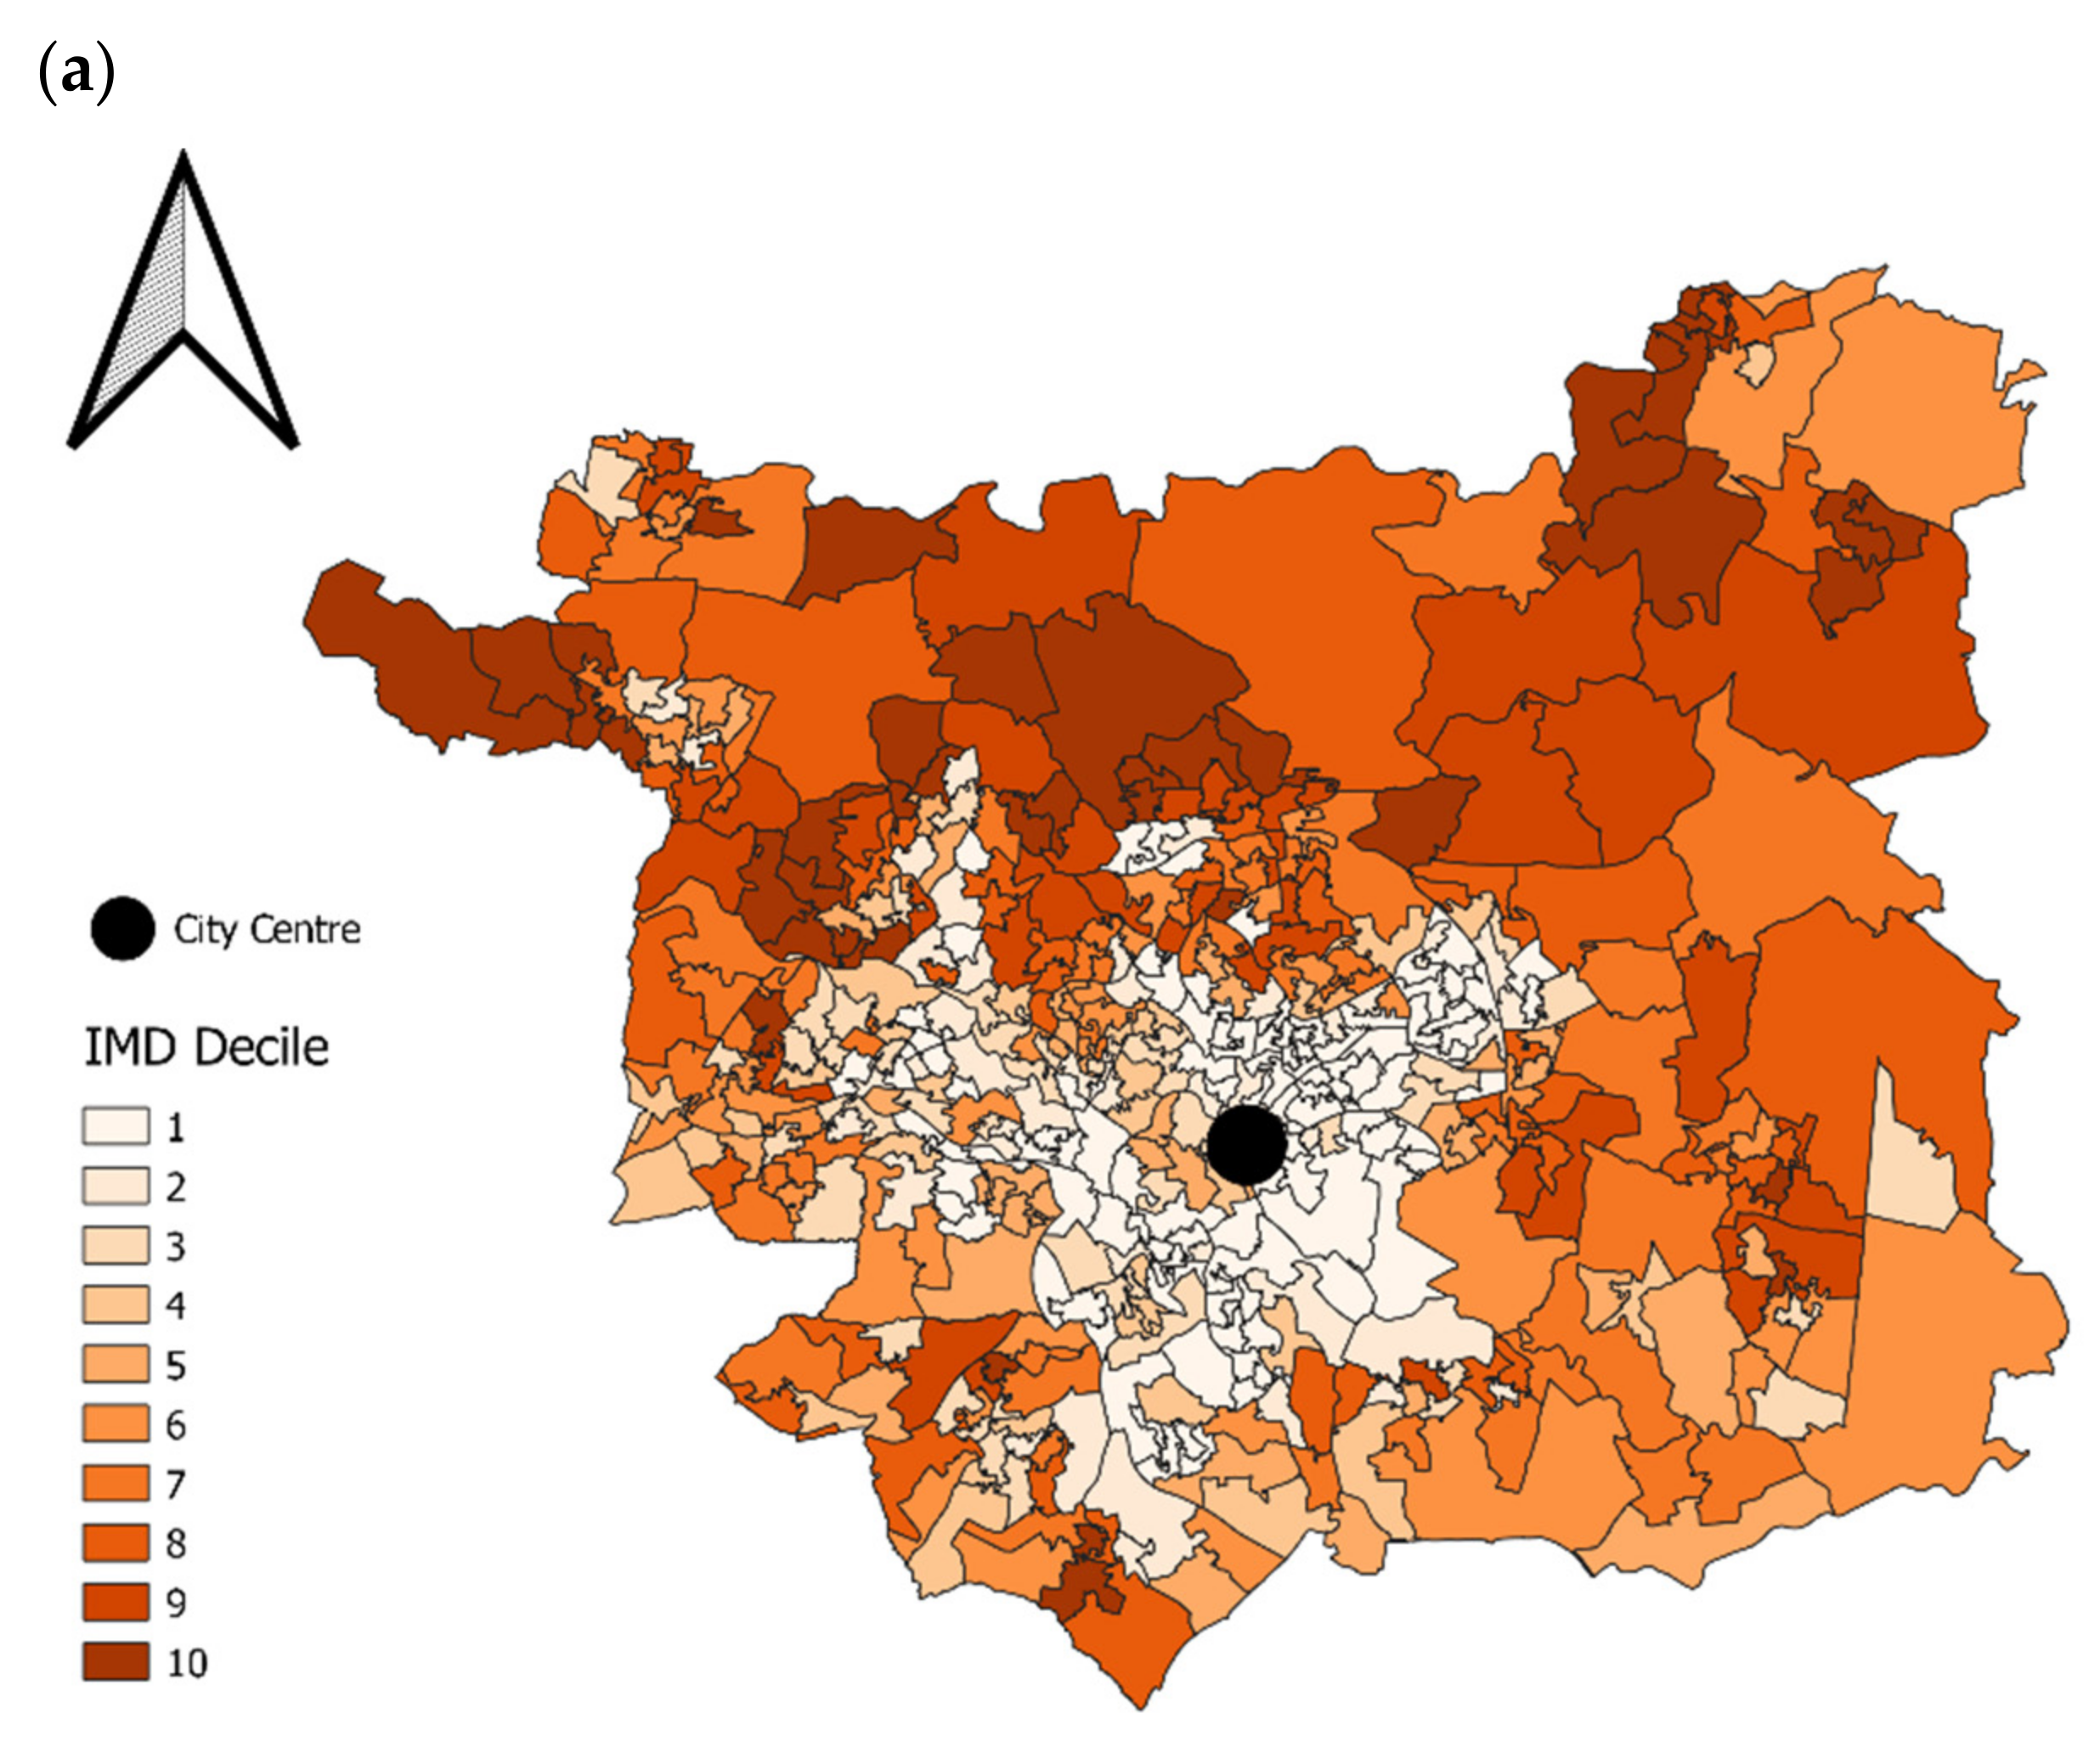
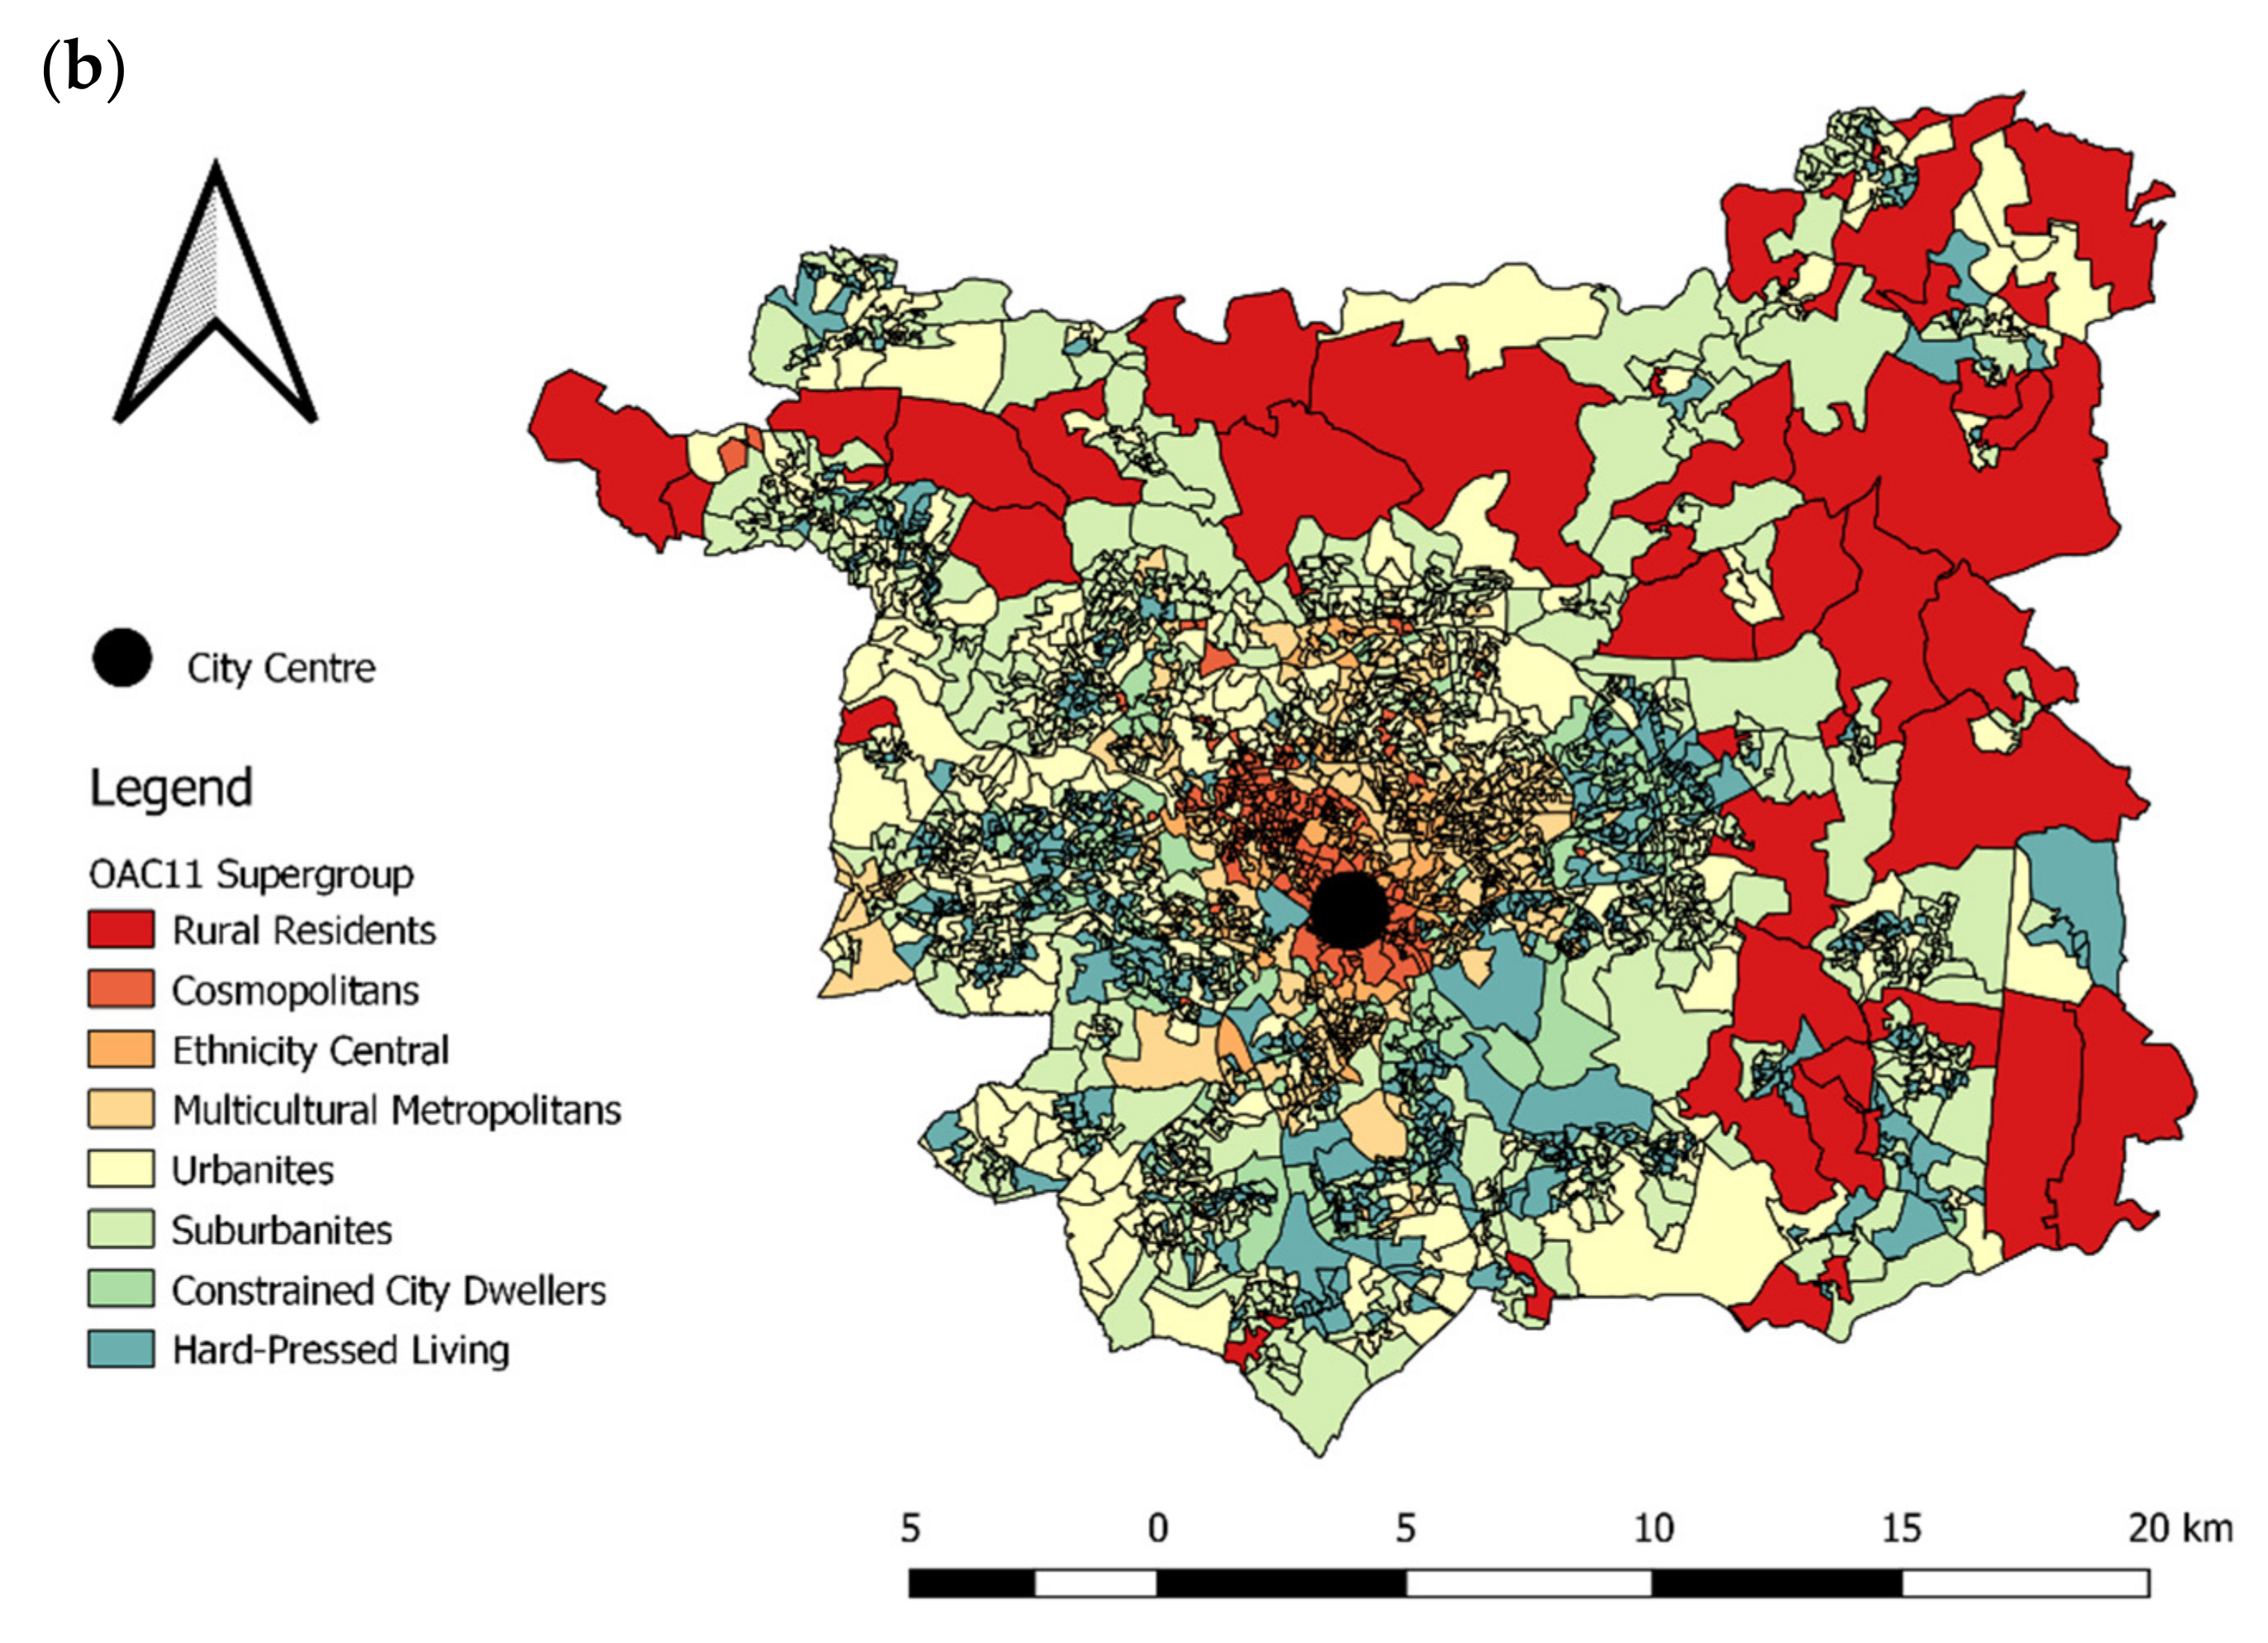
2.2. Study Region
2.3. Transaction Data
2.4. Estimating Fruit and Vegetable Purchases
2.5. Analysis
3. Results
3.1. Customer Characteristics
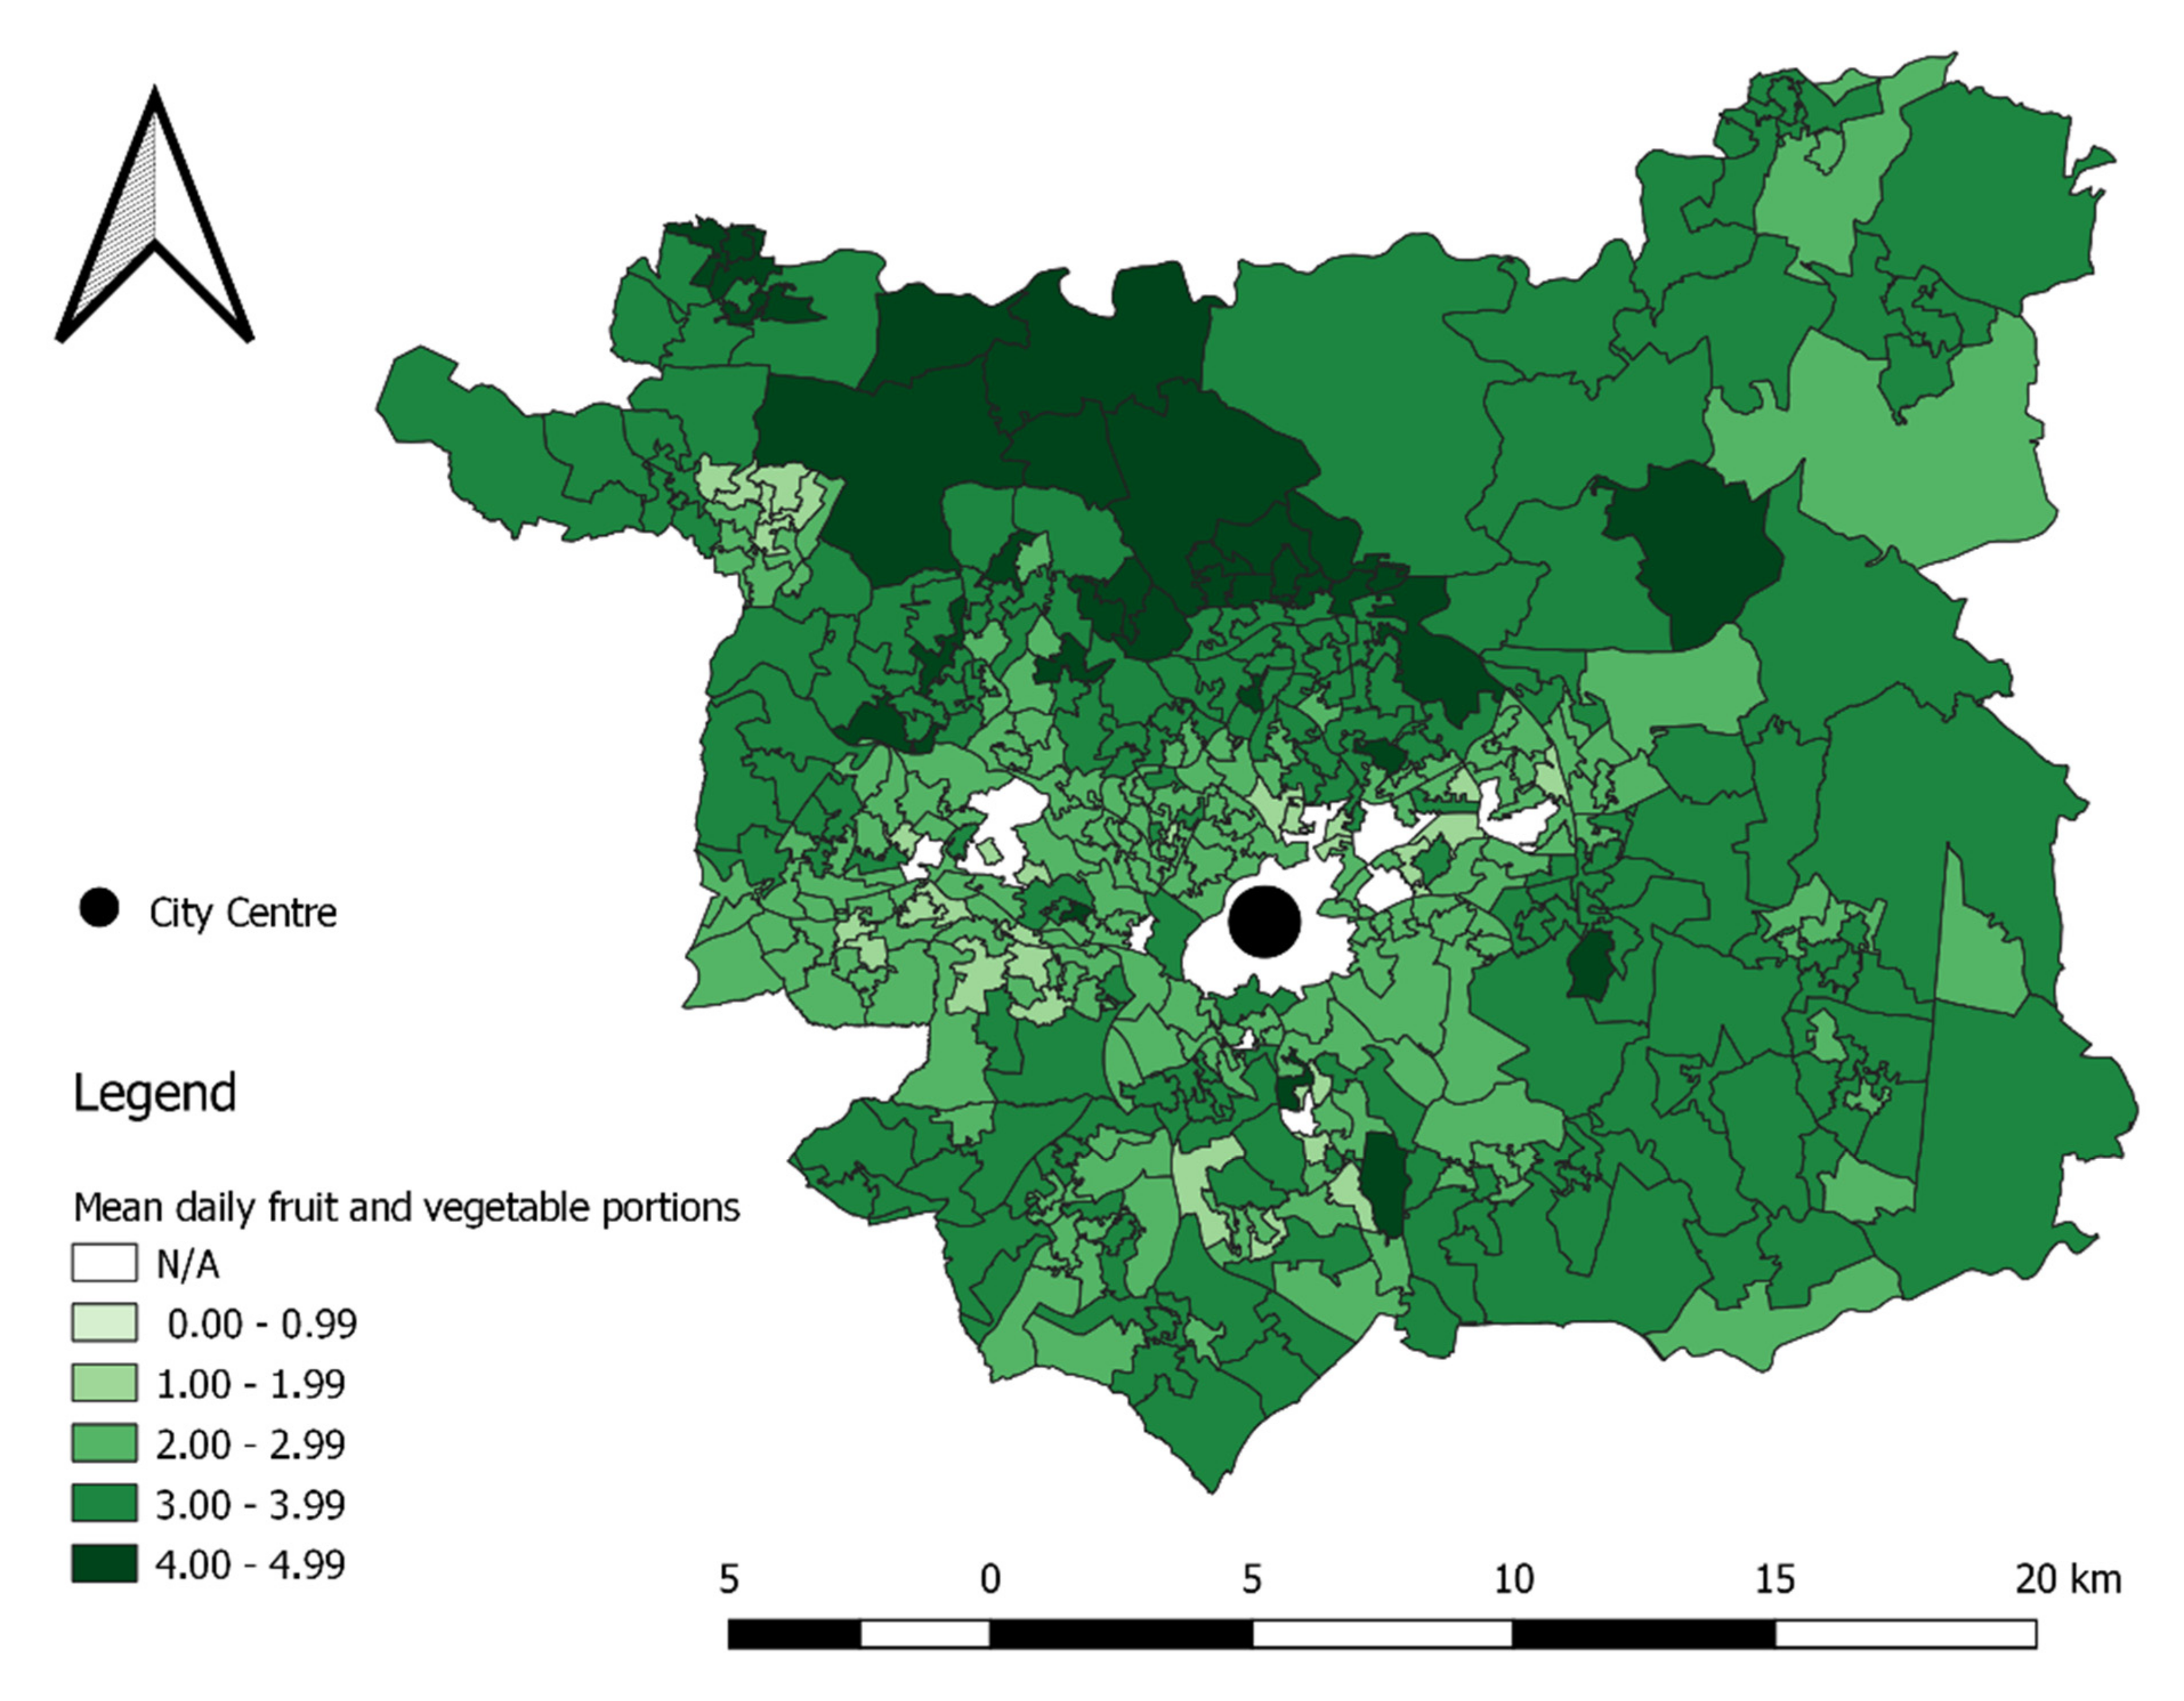
3.2. Fruit and Vegetable Purchases in Leeds
3.3. Neighbourhood Characteristics
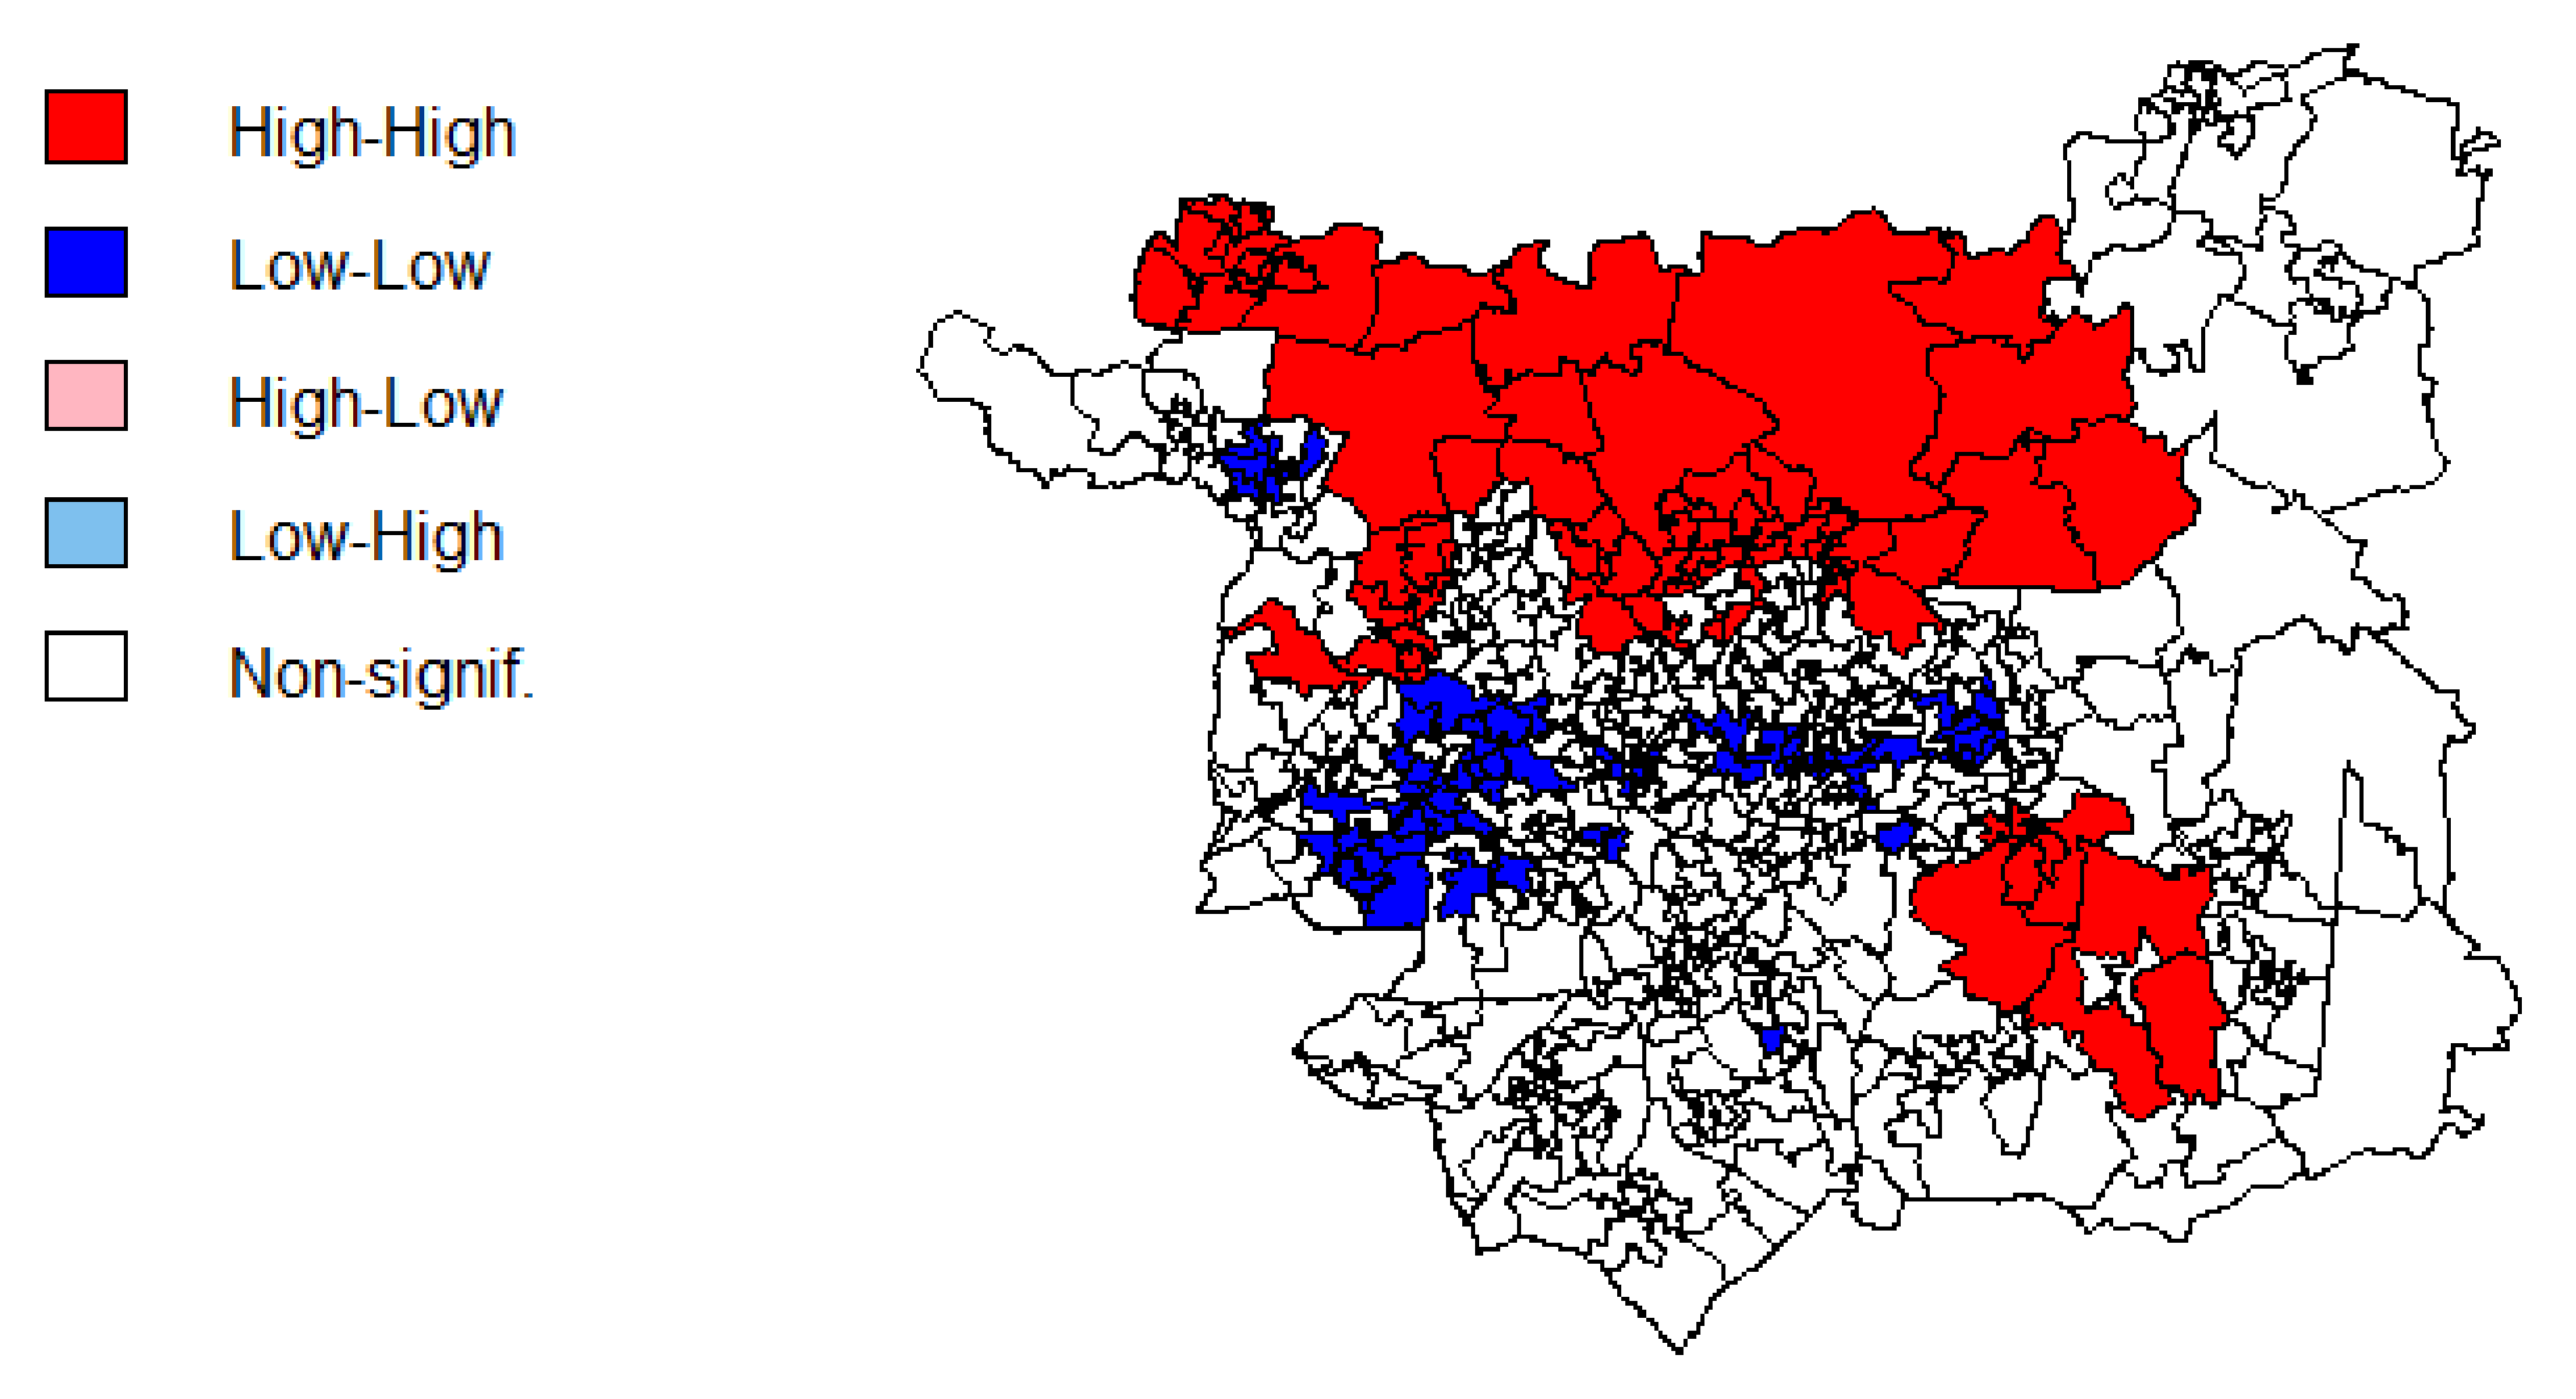
3.4. Spatial Patterns in Fruit and Vegetable Purchasing
3.5. Linear Regression
4. Discussion
4.1. Policy Relevance
4.2. Future Directions
5. Conclusions
Supplementary Materials
Author Contributions
Funding
Institutional Review Board Statement
Informed Consent Statement
Data Availability Statement
Acknowledgments
Conflicts of Interest
References
- NHS. Obesity UK. 2019. Available online: https://www.nhs.uk/conditions/obesity/ (accessed on 10 September 2021).
- NHS Digital. Health Survey for England 2018 Overweight and Obesity in Adults and Children; Health and Social Care Information Centre: London, UK, 2019. [Google Scholar]
- Theis, D.R.Z.; Whitem, M. Is obesity policy in england fit for purpose? Analysis of government strategies and policies, 1992–2020. Milbank Q. 2021, 99, 126–170. [Google Scholar] [CrossRef]
- Foresight. Obesity Systems Map 2007. Available online: https://assets.publishing.service.gov.uk/government/uploads/system/uploads/attachment_data/file/296290/obesity-map-full-hi-res.pdf (accessed on 13 June 2018).
- Nestle, M.; Jacobson, M.F. Halting the obesity epidemic: A public health policy approach. Public Health Rep. 2000, 115, 12–24. [Google Scholar] [CrossRef]
- Ogden, J.; Bandara, I.; Cohen, H.; Farmer, D.; Hardie, J.; Minas, H.; Moore, J.; Qureshi, S.; Walter, F.; Whitehead, M.A. General practitioners and patients models of obesity: Whose problem is it? Patient Educ. Couns. 2001, 44, 227–233. [Google Scholar] [CrossRef]
- DHSC. Consultation on restricting promotions of products high in fat, sugar and salt. In Department of Health and Social Care; Assets Publishing: London, UK, 2019. [Google Scholar]
- DHSC. Tackling obesity: Empowering adults and children to live healthier lives. In Department of Health and Social Care; Assets Publishing: London, UK, 2020. [Google Scholar]
- HMRC. Check If Your Drink is Liable for the Soft Drink Industry Levy: Gov.UK. 2018. Available online: https://www.gov.uk/guidance/check-if-your-drink-is-liable-for-the-soft-drinks-industry-levy (accessed on 13 August 2019).
- Food Foundation. Veg Pledges UK2021. Available online: https://foodfoundation.org.uk/what-is-a-veg-city/veg-pledges/ (accessed on 30 December 2021).
- Food Foundation. Peas Please Progress Report 2020. UK. 2020. Available online: https://foodfoundation.org.uk/publication/2020-peas-please-progress-report (accessed on 30 December 2021).
- GOV.UK. National Diet and Nutrition Survey UK. 2016. Available online: https://www.gov.uk/government/collections/national-diet-and-nutrition-survey (accessed on 30 December 2021).
- Adams, J.; Goffe, L.; Brown, T.; Lake, A.A.; Summerbell, C.; White, M.; Wrieden, W.; Adamson, A.J. Frequency and socio-demographic correlates of eating meals out and take-away meals at home: Cross-sectional analysis of the UK national diet and nutrition survey, waves 1–4 (2008–12). Int. J. Behav. Nutr. Phys. Act. 2015, 12, 51. [Google Scholar] [CrossRef]
- Gibson, S.; Neate, D. Sugar intake, soft drink consumption and body weight among British children: Further analysis of National Diet and Nutrition Survey data with adjustment for under-reporting and physical activity. Int. J. Food Sci. Nutr. 2007, 58, 445–460. [Google Scholar] [CrossRef]
- Maguire, E.R.; Monsivais, P. Socio-economic dietary inequalities in UK adults: An updated picture of key food groups and nutrients from national surveillance data. Br. J. Nutr. 2015, 113, 181–189. [Google Scholar] [CrossRef] [PubMed]
- Yau, A.; Adams, J.; Monsivais, P. Time trends in adherence to UK dietary recommendations and associated sociodemographic inequalities, 1986–2012: A repeated cross-sectional analysis. Eur. J. Clin. Nutr. 2019, 73, 997–1005. [Google Scholar] [CrossRef] [PubMed]
- Scarborough, P.; Allender, S.; Peto, V.; Rayner, M. Regional and Social Differences in Coronary Heart Disease; British Heart Foundation Health Promotion Research Group. Department of Public Health, University of Oxford: Oxford, UK, 2008. [Google Scholar]
- World Cancer Research Fund International. Diet, Nutrition, Physical Activity and Cancer: A Global Perspective; World Cancer Research Fund International: London, UK, 2018. [Google Scholar]
- Public Health England. NDNS: Time Trend and Income Analyses for Years 1 to 9; Public Health England, and the Food Standards Agency: London, UK, 2019. [Google Scholar]
- Food Foundation. Veg Facts 2020: In Brief. UK. 2020. Available online: https://foodfoundation.org.uk/publication/veg-facts-2020-in-brief/ (accessed on 30 December 2021).
- National Food Strategy. National Food Strategy: Part One; National Food Strategy: London, UK, 2020. [Google Scholar]
- McCartney, G. Illustrating health inequalities in Glasgow. J. Epidemiol. Community Health 2011, 65, 94. [Google Scholar] [CrossRef]
- Fraser, L.K.; Edwards, K.L.; Cade, J.; Clarke, G.P. The geography of fast food outlets: A review. Int. J. Environ. Res. Public Health 2010, 7, 2290–2308. [Google Scholar] [CrossRef]
- Blake, M.K. More than just food: Food insecurity and resilient place making through community self-organising. Sustainability 2019, 11, 2942. [Google Scholar] [CrossRef]
- Cavill, N.; Rutter, H. Obesity and the Environment: Regulating the Growth of Fast Food Outlets; Public Health England: London, UK, 2014. [Google Scholar]
- Fraser, L.K.; Clarke, G.P.; Cade, J.E.; Edwards, K.L. Fast food and obesity: A spatial analysis in a large united kingdom population of children aged 13–15. Am. J. Prev. Med. 2012, 42, e77–e85. [Google Scholar] [CrossRef]
- Clary, C.; Lewis, D.J.; Flint, E.; Smith, N.R.; Kestens, Y.; Cummins, S. The local food environment and fruit and vegetable intake: A geographically weighted regression approach in the ORiEL study. Am. J. Epidemiol. 2016, 184, 837–846. [Google Scholar] [CrossRef] [PubMed]
- Menezes, M.C.; Costa, B.V.; Oliveira, C.D.; Lopes, A.C. Local food environment and fruit and vegetable consumption: An ecological study. Prev. Med. Rep. 2017, 5, 13–20. [Google Scholar] [CrossRef]
- Ball, K.; Lamb, K.E.; Costa, C.; Cutumisu, N.; Ellaway, A.; Kamphuis, C.B.; Mentz, G.; Pearce, J.; Santana, P.; Santos, R.; et al. Neighbourhood socioeconomic disadvantage and fruit and vegetable consumption: A seven countries comparison. Int. J. Behav. Nutr. Phys. Act. 2015, 12, 68. [Google Scholar] [CrossRef] [PubMed]
- Drewnowski, A.; Aggarwal, A.; Cook, A.; Stewart, O.; Moudon, A.V. Geographic disparities in Healthy Eating Index scores (HEI-2005 and 2010) by residential property values: Findings from Seattle Obesity Study (SOS). Prev. Med. 2016, 83, 46–55. [Google Scholar] [CrossRef]
- Morris, M.; Clarke, G.; Edwards, K.; Hulme, C.; Cade, J. Geography of diet in the UK women’s cohort study: A cross-sectional analysis. Epidemiol.-Open J. 2016, 1, 20–32. [Google Scholar] [CrossRef]
- Green, M.A.; Watson, A.W.; Brunstrom, J.M.; Corfe, B.M.; Johnstone, A.M.; Williams, E.A.; Stevenson, E. Comparing supermarket loyalty card data with traditional diet survey data for understanding how protein is purchased and consumed in older adults for the UK, 2014–2016. Nutr. J. 2020, 19, 83. [Google Scholar] [CrossRef] [PubMed]
- Hamilton, S.; Mhurchu, C.N.; Priest, P. Food and nutrient availability in New Zealand: An analysis of supermarket sales data. Public Health Nutr. 2007, 10, 1448–1455. [Google Scholar] [CrossRef][Green Version]
- Aiello, L.M.; Quercia, D.; Schifanella, R.; Del Prete, L. Tesco Grocery 1.0, a large-scale dataset of grocery purchases in London. Sci. Data 2020, 7, 57. [Google Scholar] [CrossRef]
- Närhinen, M.; Berg, M.-A.; Nissinen, A.; Puska, P. Supermarket sales data: A tool for measuring regional differences in dietary habits. Public Health Nutr. 1999, 2, 277–282. [Google Scholar] [CrossRef]
- Clark, S.D.; Shute, B.; Jenneson, V.; Rains, T.; Birkin, M.; Morris, M.A. Dietary patterns derived from UK supermarket transaction data with nutrient and socioeconomic profiles. Nutrients 2021, 13, 1481. [Google Scholar] [CrossRef] [PubMed]
- ONS. Living costs and food survey. In User Guidance and Technical Information for the Living Costs and Food Survey; Bulman, J., Ed.; ONS: Essex, UK, 2017. [Google Scholar]
- GOV.UK. English Indices of Deprivation 2015: UK Government; 2015. Available online: https://www.gov.uk/government/statistics/english-indices-of-deprivation-2015 (accessed on 13 August 2019).
- Vickers, D.; Rees, P.; Birkin, M. Creating the National Classification of Census Output Areas: Data, Methods and Results; School of Geography Working Paper 05/; University of Leeds: Leeds, UK, 2005. [Google Scholar]
- Gale, C.; Singleton, A.; Bates, A.; Longley, P. Creating the 2011 area classification for output areas (2011 OAC). J. Spat. Inf. Sci. 2016, 12, 1–27. [Google Scholar] [CrossRef]
- ONS. Census Geography: An Overview of the Various Geographies Used in the Production of Statistics Collected Via the UK Census. 2017. Available online: https://www.ons.gov.uk/methodology/geography/ukgeographies/censusgeography (accessed on 13 August 2019).
- NHS. 5 A Day: What Counts? 2018. Available online: https://www.nhs.uk/live-well/eat-well/5-a-day-what-counts/ (accessed on 13 August 2019).
- NHS. Why 5 A Day? NHS. 2018. Available online: https://www.nhs.uk/live-well/eat-well/why-5-a-day/ (accessed on 13 August 2019).
- Leeds Observatory. Household Size and Rooms in Leeds: Gov.UK. 2021. Available online: https://observatory.leeds.gov.uk/housing/report/view/b535d8e5497342ebb3a4299f7284a6b7/E08000035/ (accessed on 30 December 2021).
- Office for National Statistics. 2011 Census: Population Estimates by Single Year of Age and Sex for Local Authorities in the United Kingdom: Unrounded Estimates of the Usually Resident Population by Age And sex, Along with Household Estimates on Census Day, 27 March 2011. 2013. Available online: https://www.ons.gov.uk/peoplepopulationandcommunity/populationandmigration/populationestimates/datasets/2011censuspopulationestimatesbysingleyearofageandsexforlocalauthoritiesintheunitedkingdom (accessed on 13 August 2019).
- Leeds Observatory. Full Results for Leeds Spreadsheet; IoD-2019-LSOA-Ward-Alt.xlsx: Esri UK; 2019 [updated 2015-16LSOA]. Available online: https://observatory.leeds.gov.uk/deprivation/ (accessed on 30 December 2021).
- Office for National Statistics. Census Output Area Population Estimates- Yorkshire and The Humber, England (Supporting Information) 2021. Available online: https://www.ons.gov.uk/peoplepopulationandcommunity/populationandmigration/populationestimates/datasets/censusoutputareaestimatesintheyorkshireandthehumberregionofengland (accessed on 30 December 2021).
- Rains, T.; Longley, P. The provenance of loyalty card data for urban and retail analytics. J. Retail. Consum. Serv. 2021, 63, 102650. [Google Scholar] [CrossRef]
- Jenneson, V.L.; Pontin, F.; Greenwood, D.C.; Clarke, G.P.; Morris, M.A. A systematic review of supermarket automated electronic sales data for population dietary surveillance. Nutr. Rev. 2021, nuab089. [Google Scholar] [CrossRef] [PubMed]
- Bonevski, B.; Randell, M.; Paul, C.; Chapman, K.; Twyman, L.; Bryant, J.; Brozek, I.; Hughes, C. Reaching the hard-to-reach: A systematic review of strategies for improving health and medical research with socially disadvantaged groups. BMC Med. Res. Methodol. 2014, 14, 42. [Google Scholar] [CrossRef]
- Rehm, J.; Kilian, C.; Rovira, P.; Shield, K.D.; Manthey, J. The elusiveness of representativeness in general population surveys for alcohol. Drug Alcohol Rev. 2021, 40, 161–165. [Google Scholar] [CrossRef]
- Public Health England. National Diet and Nutrition Survey London: GOV.UK; Public Health England: London, UK, 2016. [Google Scholar]
- Osbourne, B.; Cooper, V.; Neave, A. Health Survey for England 2017 Adult Health Related Behaviours; NHS Digital: Leeds, UK, 2018. [Google Scholar]
- Vepsäläinen, H.; Nevalainen, J.; Kinnunen, S.; Itkonen, S.T.; Meinilä, J.; Männistö, S.; Uusitalo, L.; Fogelholm, M.; Erkkola, M. Do we eat what we buy? Relative validity of grocery purchase data as an indicator of food consumption in the LoCard study. Br. J. Nutr. 2021, 18, 1–24. [Google Scholar] [CrossRef]
- Eyles, H.; Jiang, Y.; Mhurchu, C.N. Use of household supermarket sales data to estimate nutrient intakes: A comparison with repeat 24-hour dietary recalls. J. Am. Diet. Assoc. 2010, 110, 106–110. [Google Scholar] [CrossRef]
- Robards, J.; Gale, C.; Martin, D. Creating a Synthetic Spatial Microdataset for Zone Design Experiments using 2011 Census and Linked Administrative Data. GIS Research UK Conference. 2017. Available online: https://www.researchgate.net/publication/317488347_Creating_a_synthetic_spatial_microdataset_for_zone_design_experiments_using_2011_Census_and_linked_administrative_data#fullTextFileContent (accessed on 30 December 2021).
- Using census data in microsimulation modelling. In The Routledge Handbook of Census Resources, Methods and Applications; Stillwell, J., Ed.; Routledge: London, UK, 2018. [Google Scholar]
- Wrap. Household Food Waste: Restated Data for 2007–2015; 2018. Contract No.: CIT012-004. Available online: https://archive.wrap.org.uk/sites/files/wrap/Household%20food%20waste%20restated%20data%202007-2015%20FINAL.pdf (accessed on 30 December 2021).
- Morris, M.A.; Hulme, C.; Clarke, G.P.; Edwards, K.L.; Cade, J.E. What is the cost of a healthy diet? Using diet data from the UK women’s cohort study. J. Epidemiol. Community Health 2014, 68, 1043–1049. [Google Scholar] [CrossRef]
- Aggarwal, A.; Cook, A.J.; Jiao, J.; Seguin, R.A.; Vernez Moudon, A.; Hurvitz, P.M.; Drewnowski, A. Access to supermarkets and fruit and vegetable consumption. Am. J. Public Health 2014, 104, 917–923. [Google Scholar] [CrossRef]
- NDNS. National Diet and Nutrition Survey (NDNS), Years 7 and 8 (2014/15–2015/16). 2018. Available online: https://www.gov.uk/government/statistics/ndns-results-from-years-7-and-8-combined (accessed on 30 December 2021).
- Winkler, E.; Turrell, G. Confidence to cook vegetables and the buying habits of Australian households. J. Am. Diet. Assoc. 2010, 110 (Suppl. 5), S52–S61. [Google Scholar] [CrossRef]
- Mills, S.; Adams, J.; Wrieden, W.; White, M.; Brown, H. Sociodemographic characteristics and frequency of consuming home-cooked meals and meals from out-of-home sources: Cross-sectional analysis of a population-based cohort study. Public Health Nutr. 2018, 21, 2255–2266. [Google Scholar] [CrossRef] [PubMed]
- Liese, A.D.; Bell, B.A.; Barnes, T.L.; Colabianchi, N.; Hibbert, J.D.; Blake, C.E.; Freedman, D.A. Environmental influences on fruit and vegetable intake: Results from a path analytic model. Public Health Nutr. 2014, 17, 2595–2604. [Google Scholar] [CrossRef] [PubMed]
- Ransley, J.K.; Donnelly, J.K.; Khara, T.N.; Botham, H.; Arnot, H.; Greenwood, D.C.; Cade, J.E. The use of supermarket till receipts to determine the fat and energy intake in a UK population. Public Health Nutr. 2001, 4, 1279–1286. [Google Scholar] [CrossRef]
- Appelhans, B.M.; French, S.A.; Tangney, C.C.; Powell, L.M.; Wang, Y. To what extent do food purchases reflect shoppers’ diet quality and nutrient intake? Int. J. Behav. Nutr. Phys. Act. 2017, 14, 46. [Google Scholar] [CrossRef]
- Hauser, M.; Nussbeck, F.W.; Jonas, K. The impact of food-related values on food purchase behavior and the mediating role of attitudes: A Swiss study. Psychol. Mark. 2013, 30, 765–778. [Google Scholar] [CrossRef]
- Food Foundation. Food Foundation. Peas Please. In Peas Please. Reviewing the Evidence: What Can Retailers Do to Increase Sales of Fruit and Veg; Food Foundation: London, UK, 2020. [Google Scholar]


| Category Description 1 | LCFS Category (LCFS Code) |
|---|---|
| Carbohydrate products | Bread and cereals (1.1.1) |
| Cakes and biscuits | Buns, cakes, biscuits etc (1.1.3) |
| Meat and fish | Meat (1.1.5–1.1.10), Fish (1.1.11) |
| Dairy | Milk, cheese, eggs (1.1.12–1.1.15) |
| Fats | Oils and fats (1.1.16–1.1.18) |
| Fruit | Fruit (1.1.19–1.1.22) |
| Vegetables and salad | Vegetables (1.1.23–1.1.27) |
| Potato | Potatoes (1.1.26) |
| Sweets | Sugar, jam, honey, chocolate confectionary (1.1.28–1.1.32) |
| Other (e.g., spices) | Other foods (1.1.33) |
| Non-alcoholic beverages | Non-alcoholic beverages (1.2) |
| Alcoholic beverages | Alcoholic beverages (2.1) |
| Ready foods | N/A—additional category not present in the LCFS |
| Baby food | N/A—additional category not present in the LCFS |
| Crisps and nuts | N/A—additional category not present in the LCFS |
| Meat free and free from foods | N/A—additional category not present in the LCFS |
| Number (%) | ||||
|---|---|---|---|---|
| Characteristic | Study Population | Leeds Population 1 | Mean Daily Portions of FV Purchased Per Household (SD) | |
| Whole sample | 50,917 (100.0) | 751,485 (100) | 3.40 (3.06) | |
| Gender | Male | 14,539 (28.6) | 367,933 (49.0) | 3.22 (2.98) |
| Female | 32,342 (63.5) | 383,550 (51.0) | 3.45 (3.10) | |
| Unknown | 4036 (7.9) | - | 3.69 (3.07) | |
| Age band | 18–44 | 16,268 (32.0) | 269,582 (35.9) | 2.96 (2.80) |
| 45–64 | 19,614 (38.5) | 172,964 (23.0) | 3.58 (3.27) | |
| 65+ | 10,817 (21.2) | 109,598 (14.6) | 3.64(2.99) | |
| Unknown | 4218 (8.3) | - | 3.65 (3.04) | |
| IMD decile | 1 | 3621 (7.1) | 186,995 (23.8) | 2.80 (2.57) |
| 2 | 2035 (4.0) | 75,224 (9.6) | 2.70 (2.47) | |
| 3 | 2669 (5.2) | 70,571 (9.0) | 2.77 (2.56) | |
| 4 | 1903 (3.7) | 33,388 (4.3) | 2.86 (2.81) | |
| 5 | 3769 (7.4) | 83,694 (10.7) | 2.92 (2.66) | |
| 6 | 4770 (9.4) | 68,864 (8.8) | 3.20 (3.00) | |
| 7 | 7650 (15.0) | 89,670 (11.4) | 3.48 (3.11) | |
| 8 | 7573 (14.9) | 63,366 (8.1) | 3.47 (3.10) | |
| 9 | 8974 (17.6) | 62,882 (8.0) | 3.84 (3.26) | |
| 10 | 7953 (15.6) | 50,192 (6.4) | 3.92 (3.33) | |
| Output area Classification Supergroup | Rural Residents | 1428 (2.8) | 12,844 (1.6) | 3.58 (3.11) |
| Cosmopolitans | 3839 (7.5) | 80,788 (10.3) | 2.58 (2.39) | |
| Ethnicity Central | 731 (1.4) | 28,615 (3.7) | 2.88 (2.48) | |
| Multicultural Metropolitans | 4889 (9.6) | 140,250 (18.0) | 3.21 (2.98) | |
| Urbanites | 14,784 (29.0) | 161,993 (20.7) | 3.50 (3.10) | |
| Suburbanites | 18,445 (36.2) | 160,366 (20.5) | 3.77 (3.27) | |
| Constrained City Dwellers | 1949 (3.8) | 71,244 (9.1) | 2.67 (2.47) | |
| Hard-pressed Living | 4852 (9.5) | 124,987 (16.0) | 2.88 (2.72) | |
| Characteristic of Loyalty Card Holder | Mean (SD)1 Median (IQR) | Univariate Moran’s I (Clustering) | p-Value (Moran’s I) | Kendall’s Tau rank Correlation with Outcome | p-Value (Kendall’s Tau) |
|---|---|---|---|---|---|
| Outcome variable | |||||
| Mean household daily portions of FV purchased | 3.0 (0.7) | 0.5 | 0.001 | - | - |
| Predictor variable | |||||
| female (% of sample) | 63.6 (8.1) | 0.1 | 0.006 | 0.0 | 0.515 |
| aged 18–44 years (% of sample) | 34.3 (15.3) | 0.4 | 0.001 | −0.3 | <0.001 |
| % aged 45–64 years (% of sample) | 38.6 (9.8) | 0.2 | 0.001 | 0.1 | 0.002 |
| % aged 65+ years (% of sample) | 19.1 (9.8) | 0.3 | 0.001 | 0.3 | <0.001 |
| IMD decile | 5.2 (3.1) | 0.6 | 0.001 | 0.5 | <0.001 |
| Rural Residents (% of sample) | 0.0 (0.0, 0.0)1 | 0.3 | 0.001 | 0.2 | <0.001 |
| Cosmopolitans (% of sample) | 0.0 (0.0, 0.0)1 | 0.7 | 0.001 | −0.1 | 0.066 |
| Ethnicity Central (% of sample) | 0.0 (0.0, 0.0) 1 | 0.6 | 0.001 | −0.1 | <0.001 |
| Multicultural Metropolitans (% of sample) | 0.0 (0.0, 20.3) 1 | 0.6 | 0.001 | −0.1 | <0.001 |
| Urbanites (% of sample) | 0.0 (0.0, 41.6) 1 | 0.3 | 0.001 | 0.2 | <0.001 |
| Suburbanites (% of sample) | 0.0 (0.0, 45.3) 1 | 0.4 | 0.001 | 0.4 | <0.001 |
| Constrained City Dwellers (% of sample) | 0.0 (0.0, 7.1) 1 | 0.2 | 0.001 | −0.3 | <0.001 |
| Hard-pressed Living (% of sample) | 0.0 (0.0, 24.4) 1 | 0.2 | 0.001 | −0.2 | <0.001 |
| Mean distance to nearest store (km) | 1.7 (0.9, 2.8) 1 | 0.8 | 0.001 | 0.1 | <0.001 |
| Mean distance to most used store (km) | 11.2 (6.4, 17.6) 1 | 0.4 | 0.001 | −0.1 | <0.001 |
| Mean total monthly spend (£) | 104.3 (19.1) | 0.5 | 0.001 | 0.7 | <0.001 |
| Shopping frequency (mean monthly trips) | 5.0 (4.4, 6.0) 1 | 0.4 | 0.001 | −0.1 | <0.001 |
| OLS Regression, n = 439 LSOAs (Adj R2: 85.8%) | ||
|---|---|---|
| Variable 2 | Coefficient (95% CI) | p-Value |
| Intercept | −0.565 (−0.918, −0.213) | 0.003 |
| Mean monthly spend (£) | 0.031 (0.029, 0.032) | <0.001 |
| % aged 65+ years | 0.005 (0.002, 0.008) | 0.002 |
| IMD decile | 0.045 (0.028, 0.061) | <0.001 |
| Shopping frequency (mean monthly trips) | 0.026 (−0.001, 0.053) | 0.066 |
| % female | −0.003 (−0.007, −0.000) | 0.057 |
| Distance to nearest store (km) | 0.006 (−0.021, 0.033) | 0.654 |
| Distance to most-used store (km) | 0.001 (−0.001, 0.003) | 0.280 |
| % Rural Residents | −0.003 (−0.006, 0.001) | 0.126 |
| % Cosmopolitans | 0.003 (0.001, 0.005) | 0.011 |
| % Ethnicity Central | 0.004 (0.001, 0.007) | 0.005 |
| % Multicultural Metropolitans | 0.002 (0.001, 0.003) | 0.003 |
| % Urbanites | 0.002 (0.001, 0.003) | 0.008 |
| % Suburbanites | 0.001 (−0.001, 0.002) | 0.436 |
| % Constrained City Dwellers | −0.002 (−0.003, 0.000) | 0.093 |
Publisher’s Note: MDPI stays neutral with regard to jurisdictional claims in published maps and institutional affiliations. |
© 2021 by the authors. Licensee MDPI, Basel, Switzerland. This article is an open access article distributed under the terms and conditions of the Creative Commons Attribution (CC BY) license (https://creativecommons.org/licenses/by/4.0/).
Share and Cite
Jenneson, V.; Clarke, G.P.; Greenwood, D.C.; Shute, B.; Tempest, B.; Rains, T.; Morris, M.A. Exploring the Geographic Variation in Fruit and Vegetable Purchasing Behaviour Using Supermarket Transaction Data. Nutrients 2022, 14, 177. https://doi.org/10.3390/nu14010177
Jenneson V, Clarke GP, Greenwood DC, Shute B, Tempest B, Rains T, Morris MA. Exploring the Geographic Variation in Fruit and Vegetable Purchasing Behaviour Using Supermarket Transaction Data. Nutrients. 2022; 14(1):177. https://doi.org/10.3390/nu14010177
Chicago/Turabian StyleJenneson, Victoria, Graham P. Clarke, Darren C. Greenwood, Becky Shute, Bethan Tempest, Tim Rains, and Michelle A. Morris. 2022. "Exploring the Geographic Variation in Fruit and Vegetable Purchasing Behaviour Using Supermarket Transaction Data" Nutrients 14, no. 1: 177. https://doi.org/10.3390/nu14010177
APA StyleJenneson, V., Clarke, G. P., Greenwood, D. C., Shute, B., Tempest, B., Rains, T., & Morris, M. A. (2022). Exploring the Geographic Variation in Fruit and Vegetable Purchasing Behaviour Using Supermarket Transaction Data. Nutrients, 14(1), 177. https://doi.org/10.3390/nu14010177