
The Gut Microbiota during a Behavioral Weight Loss Intervention

Abstract
:1. Introduction
2. Materials and Methods
2.1. Participants and Intervention
2.2. Dietary Prescription
2.3. Physical Activity Prescription
2.4. Behavioral Support
2.5. Data Collection
2.5.1. Anthropometric Measurements
2.5.2. Dietary Intake
2.5.3. Physical Activity
2.5.4. Blood Collection
2.5.5. Stool Collection
2.5.6. 16S rRNA Gene Profiling
2.5.7. Microbiome Data Processing
2.6. Statistical Analyses
2.6.1. Change in the Gut Microbiota over Time
2.6.2. Cross-Sectional Associations between Gut Microbiota Measures and Clinical Measures
2.6.3. Association between Gut Microbiota and Change in Clinical Outcomes
2.6.4. Specific Gut Microbiota Taxa Predictive of Change Clinical Outcomes
2.6.5. Predictors of Changes in Gut Microbiota Beta-Diversity
3. Results
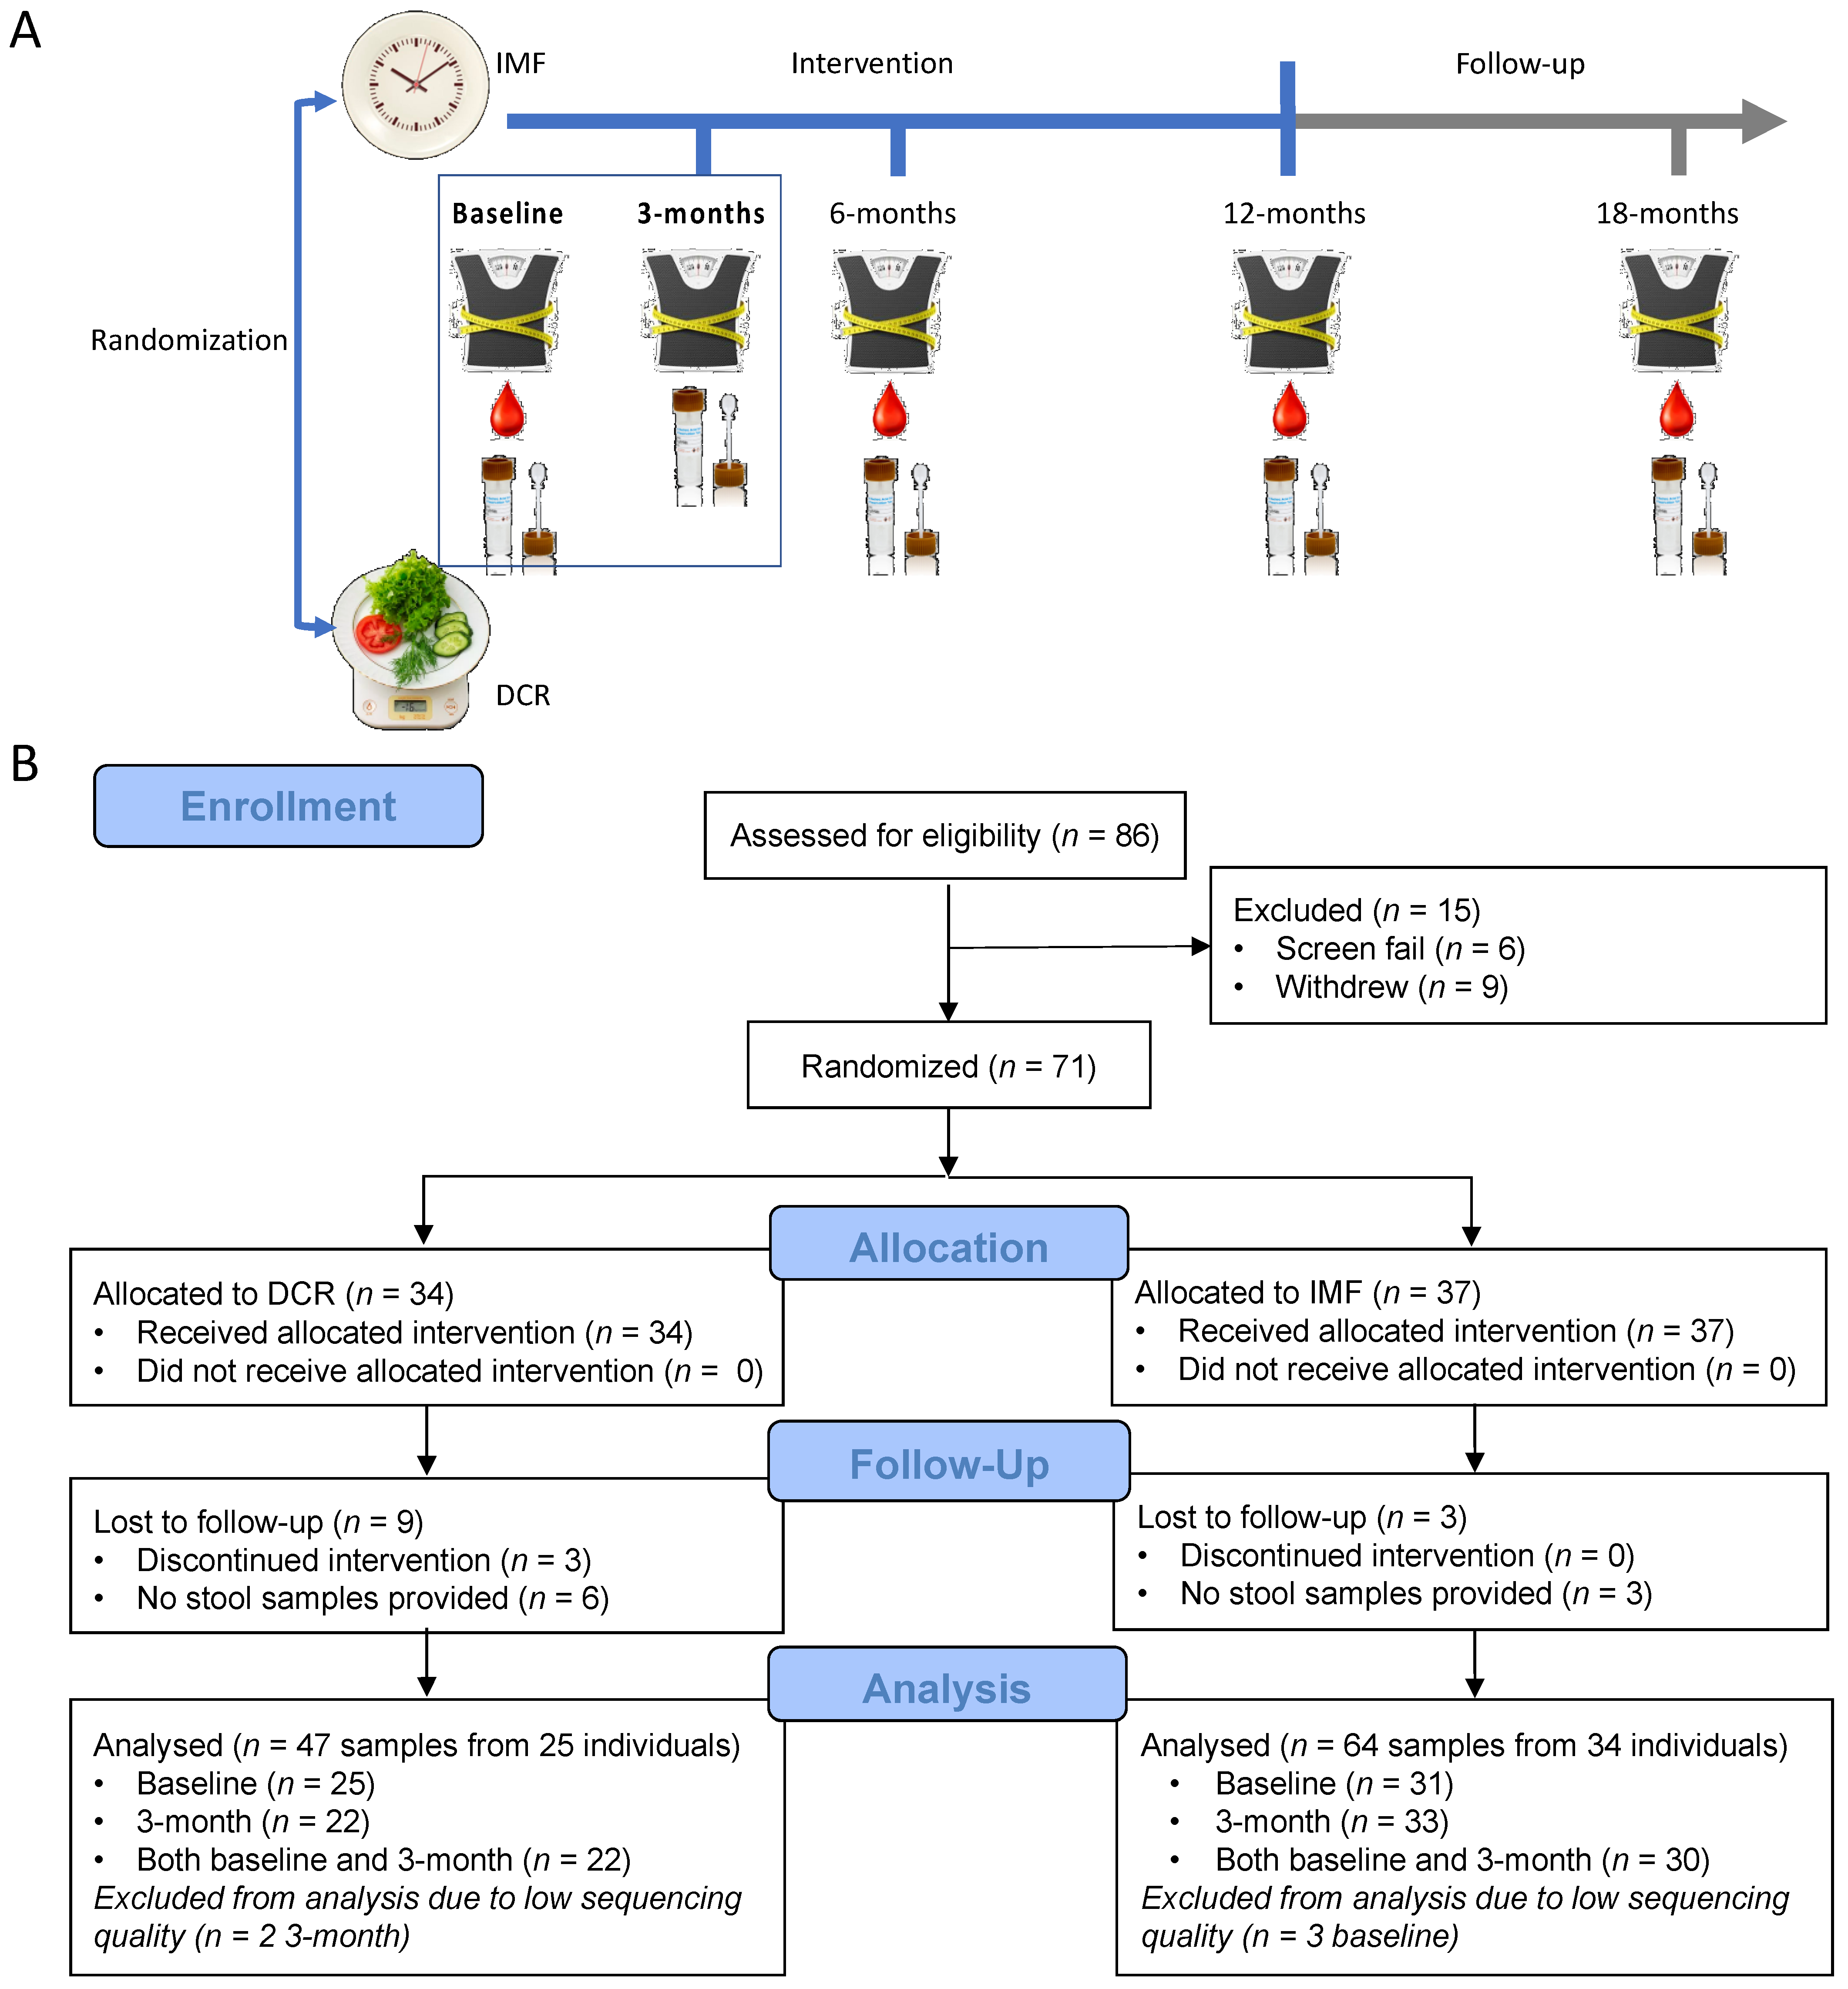
3.1. Study Overview
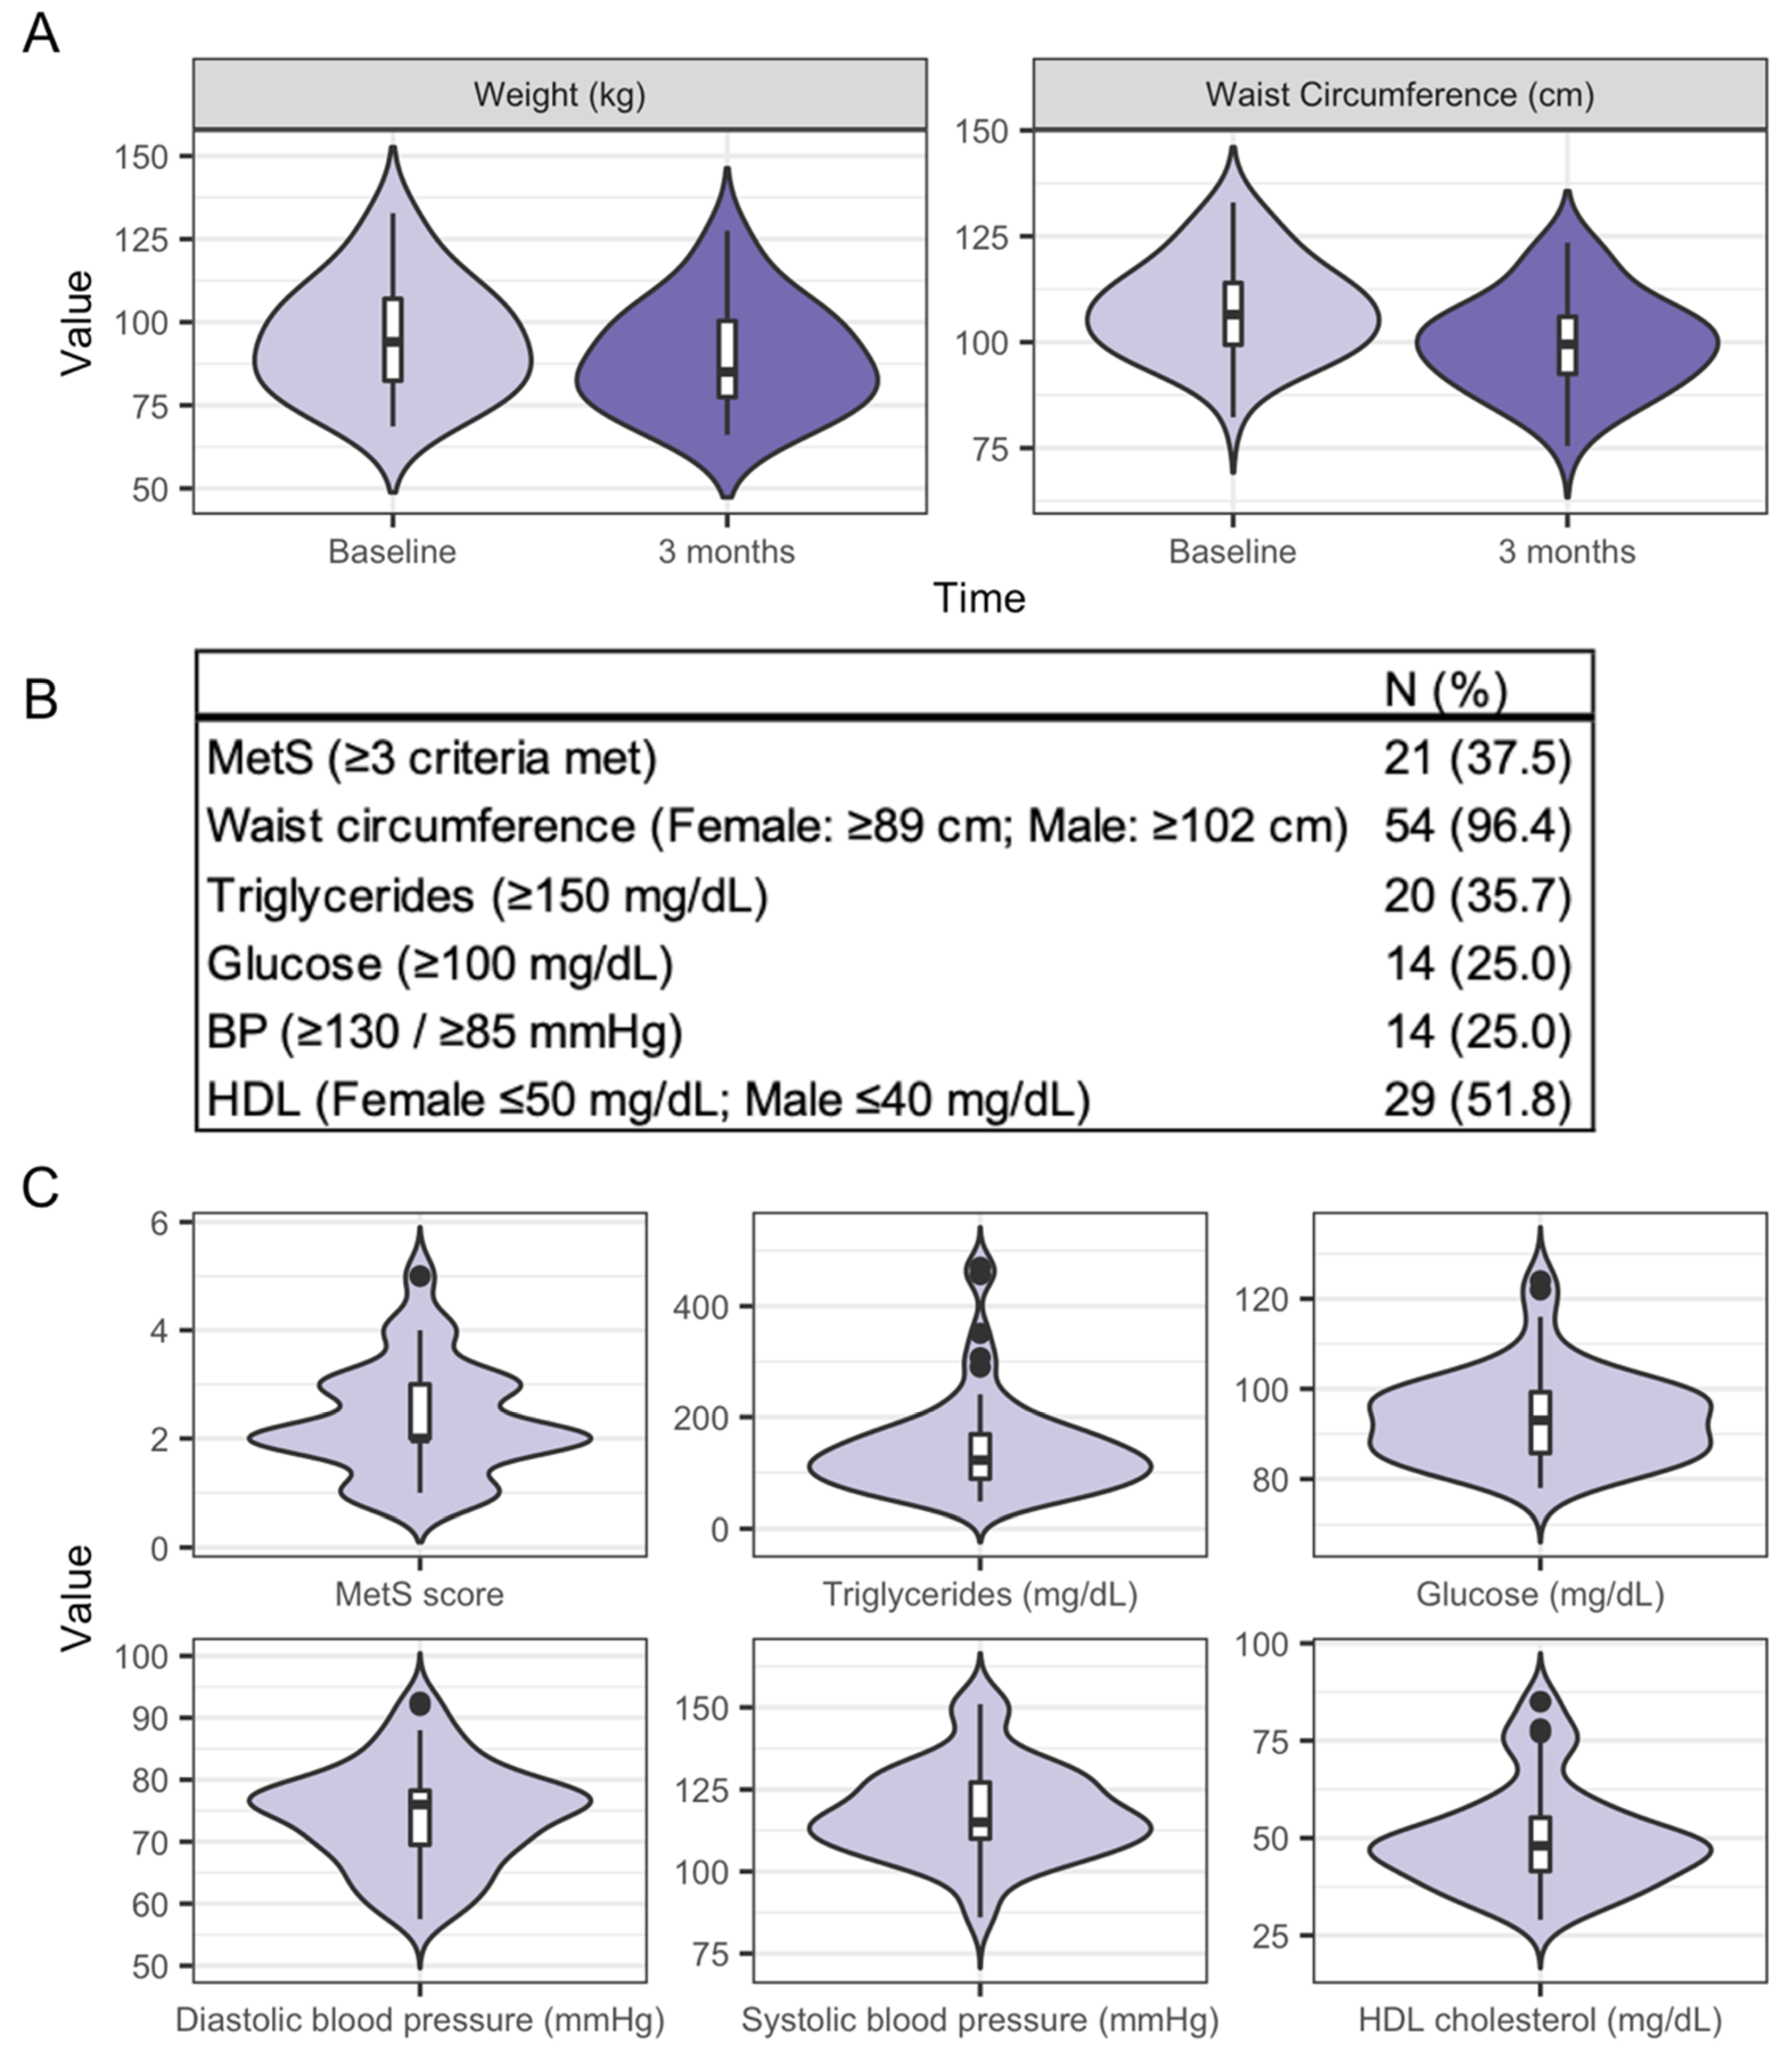
3.2. Characteristics of the Study Participants and Clinical Health Measures from Baseline to Three Months
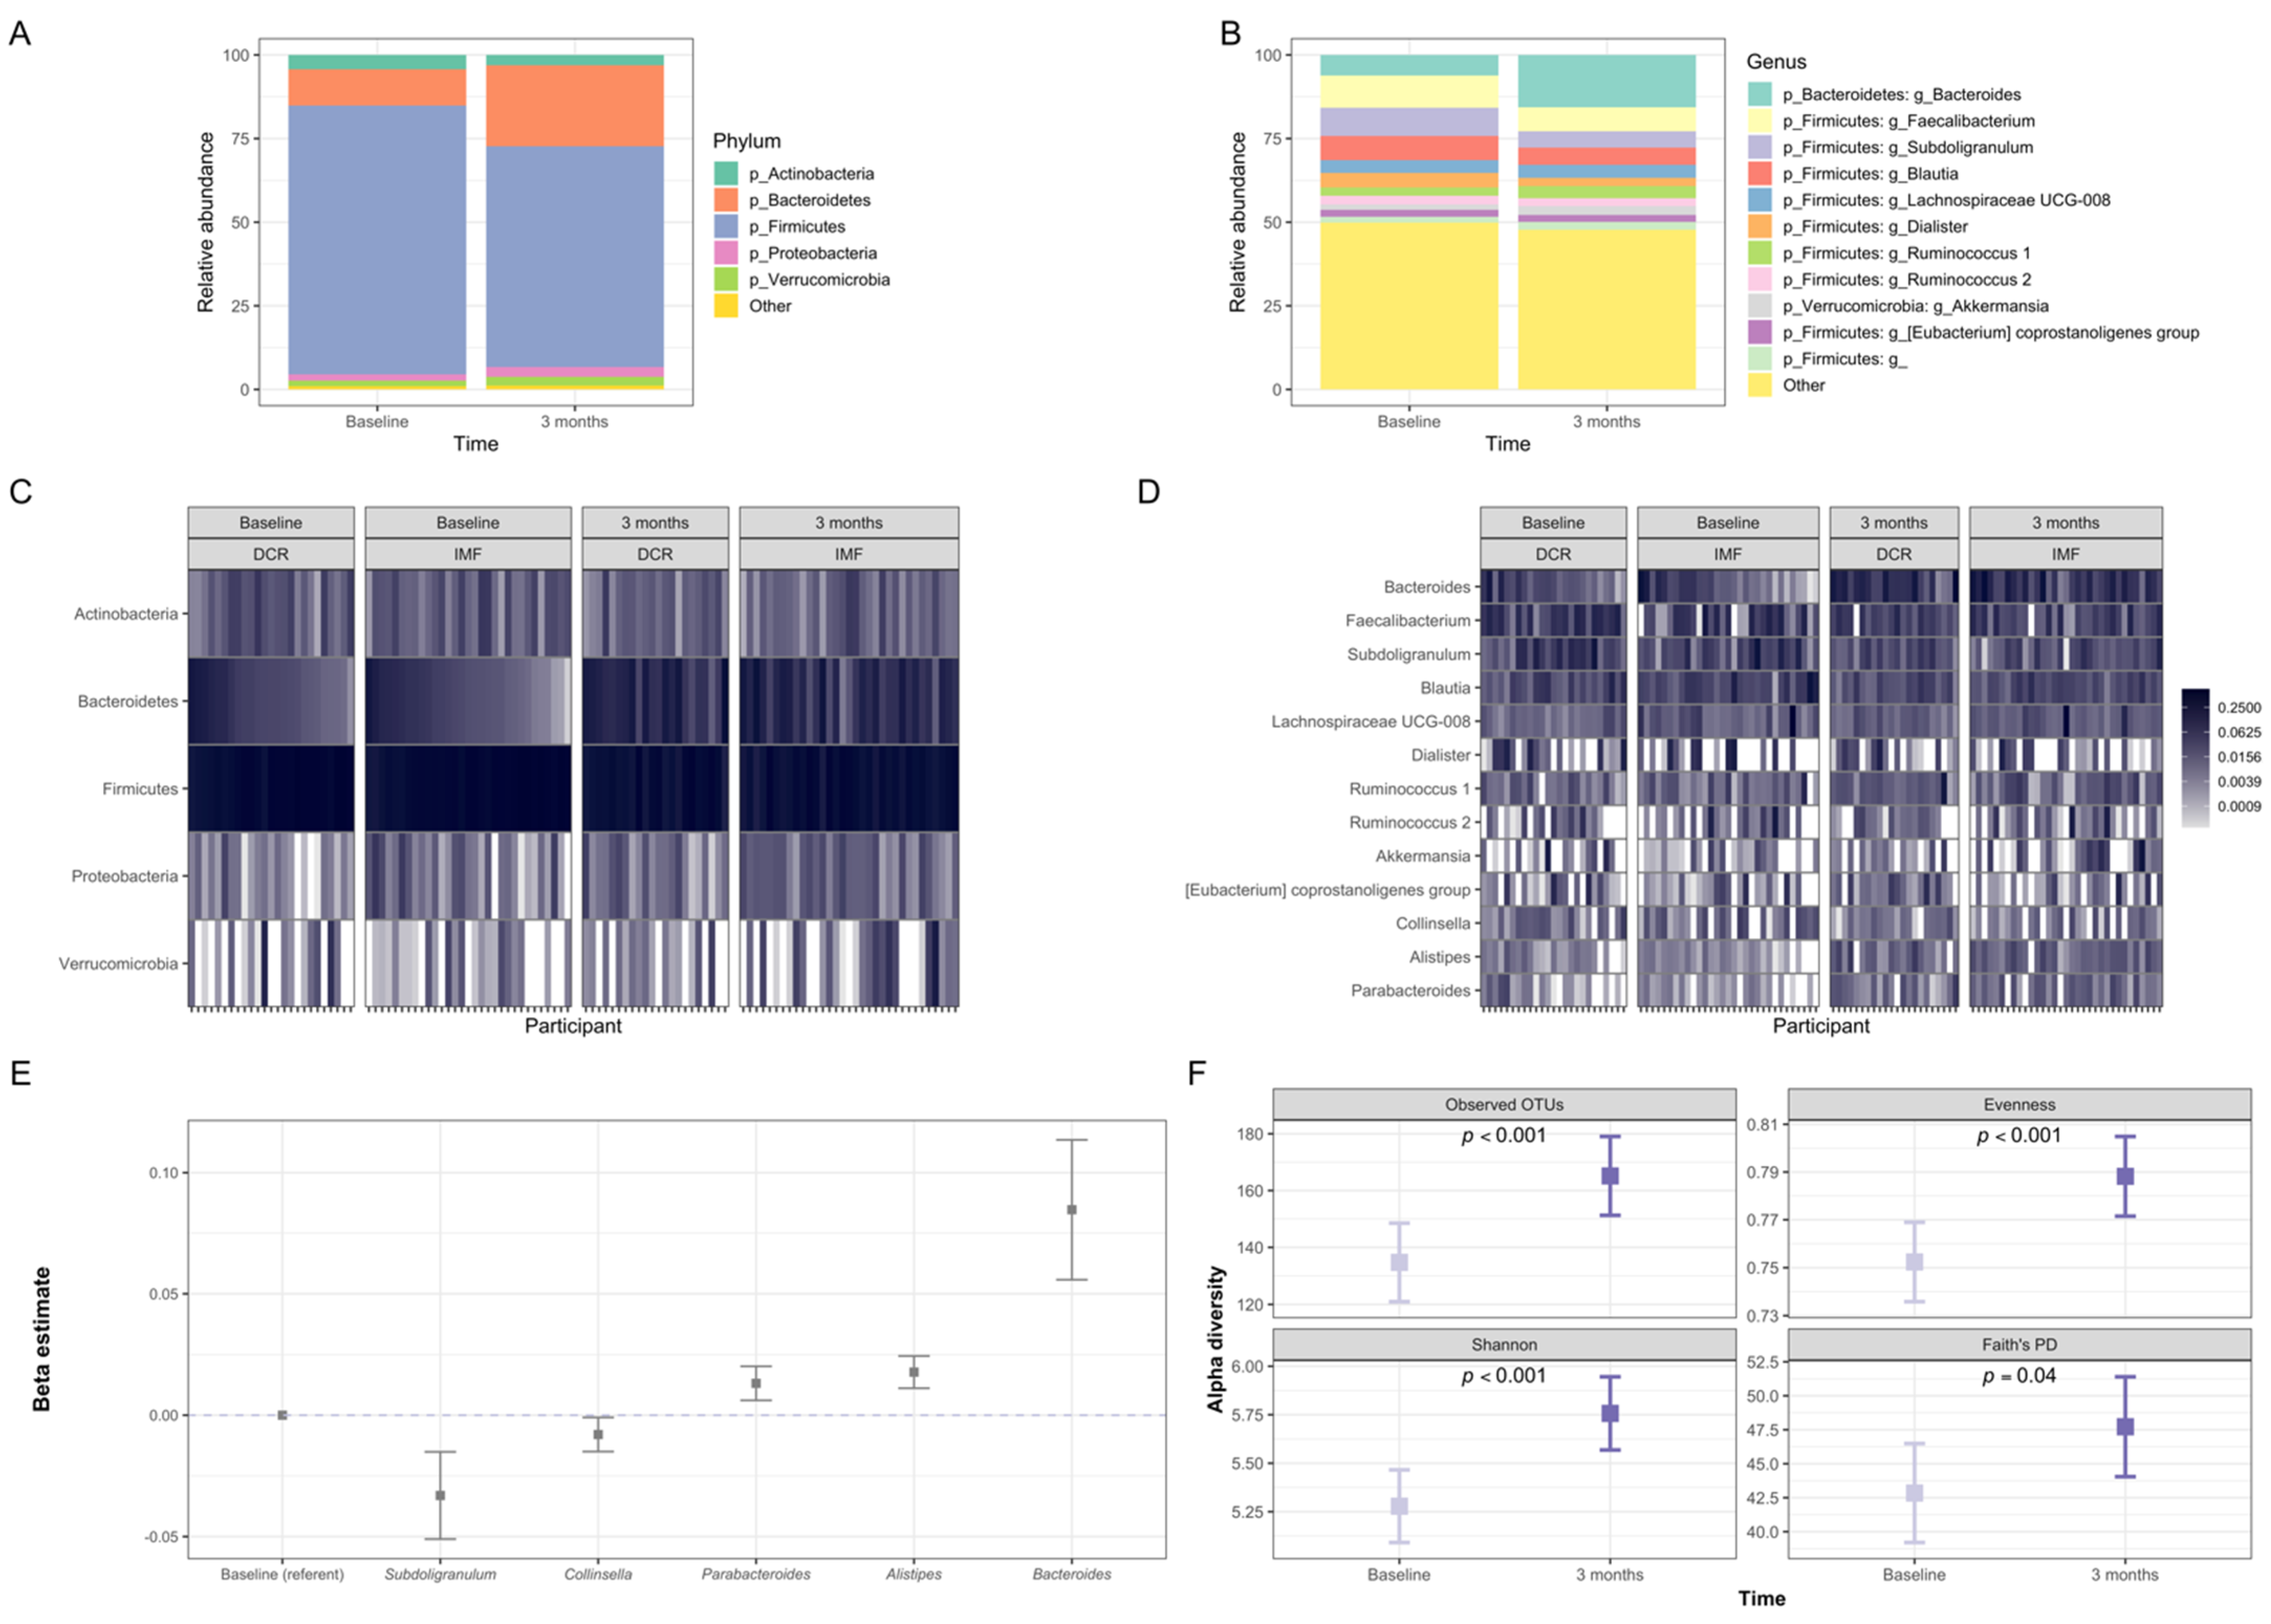
3.3. Gut Microbiota of Participants Shifted Significantly in Composition during the First Three Months of the Intervention
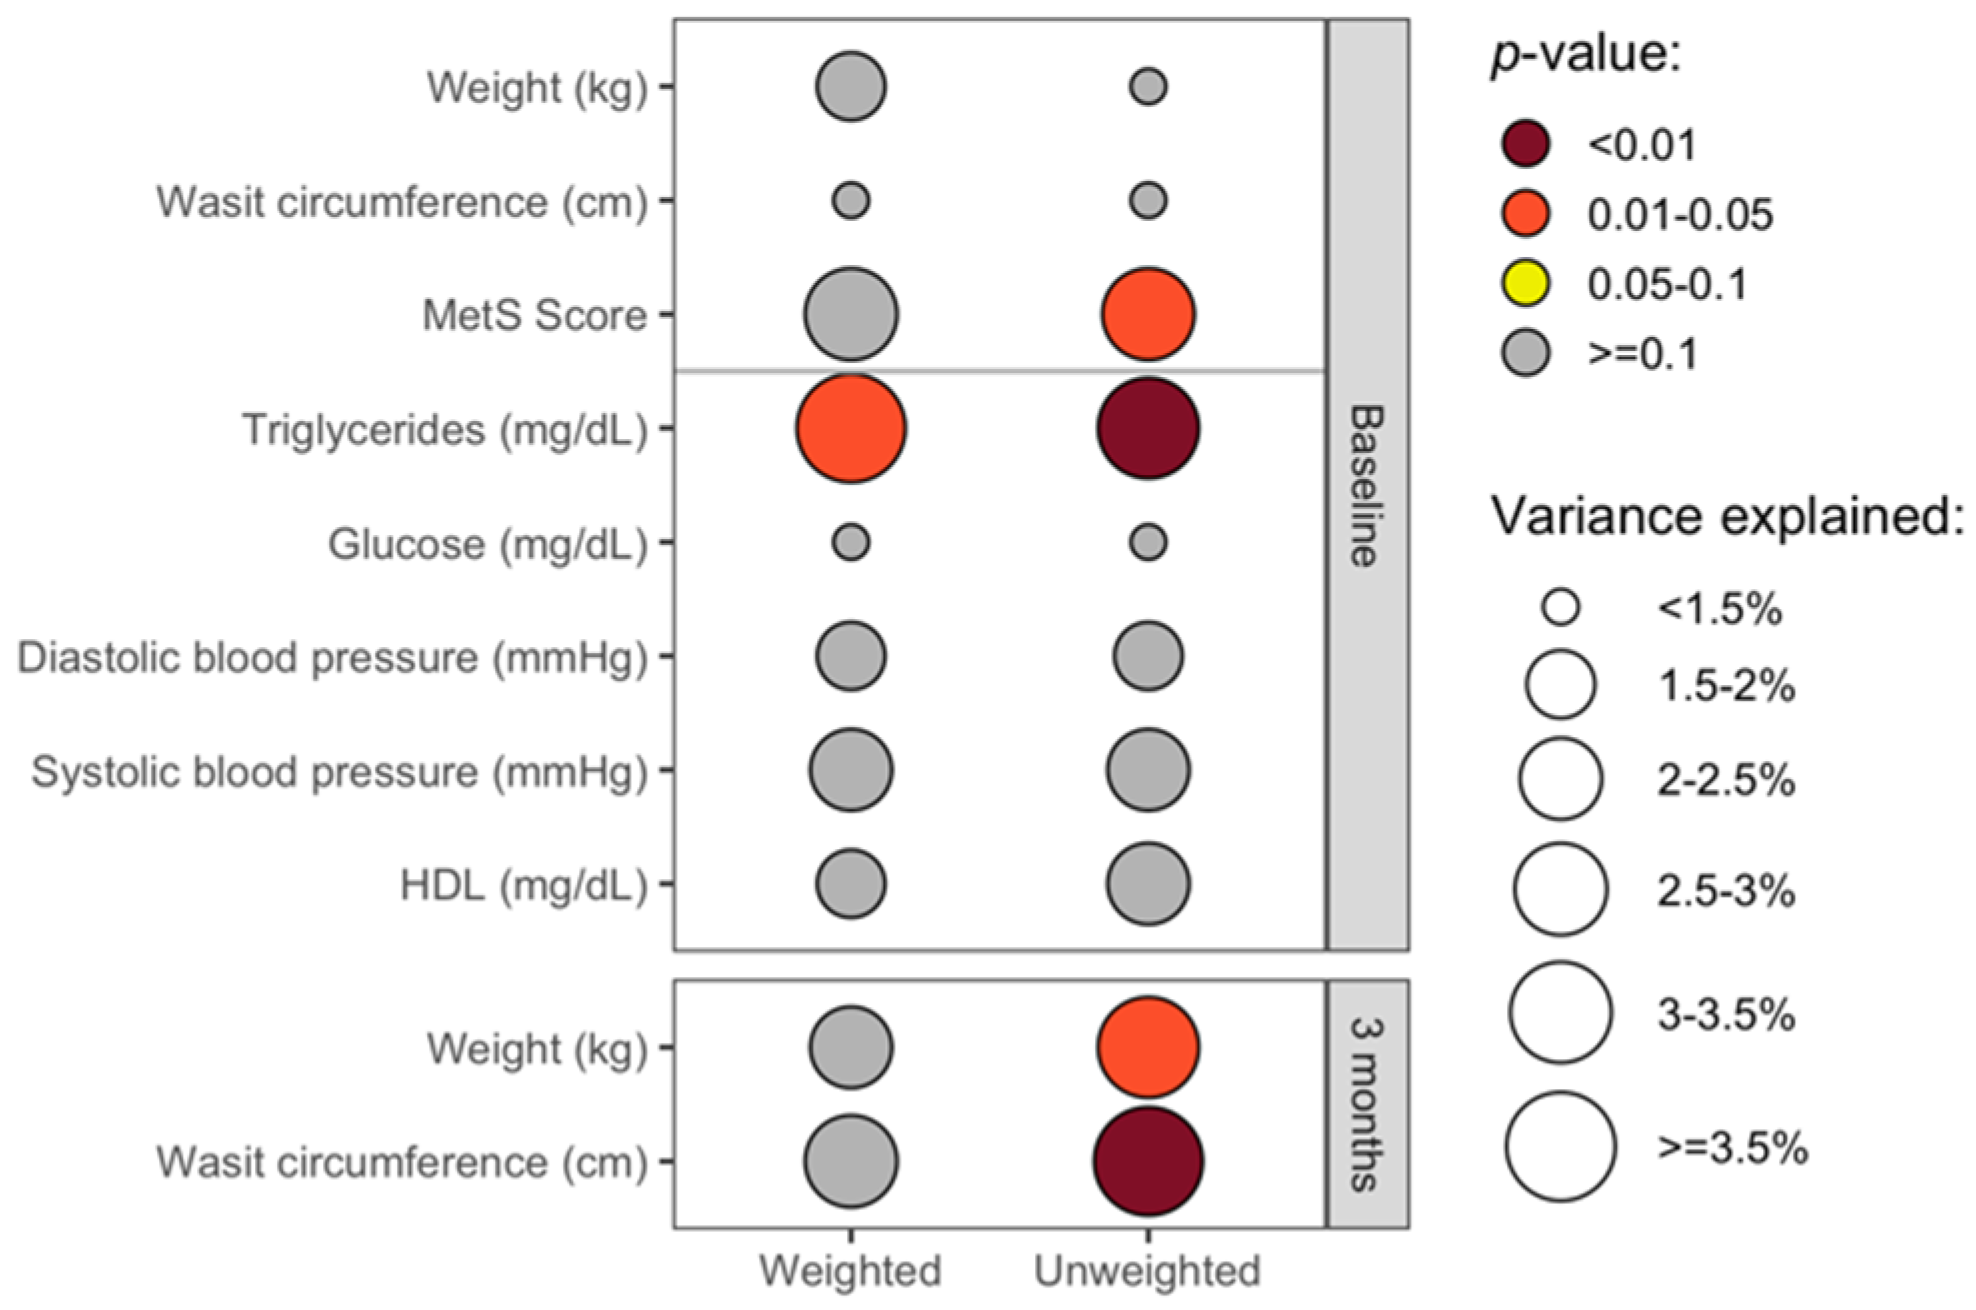
3.4. The Overall Gut Microbiota Composition Was Significantly Associated with Clinical Health Measures in Cross-Sectional Analyses
3.5. Baseline Gut Microbiota Composition Predicts Change in Waist Circumference at 3 Months
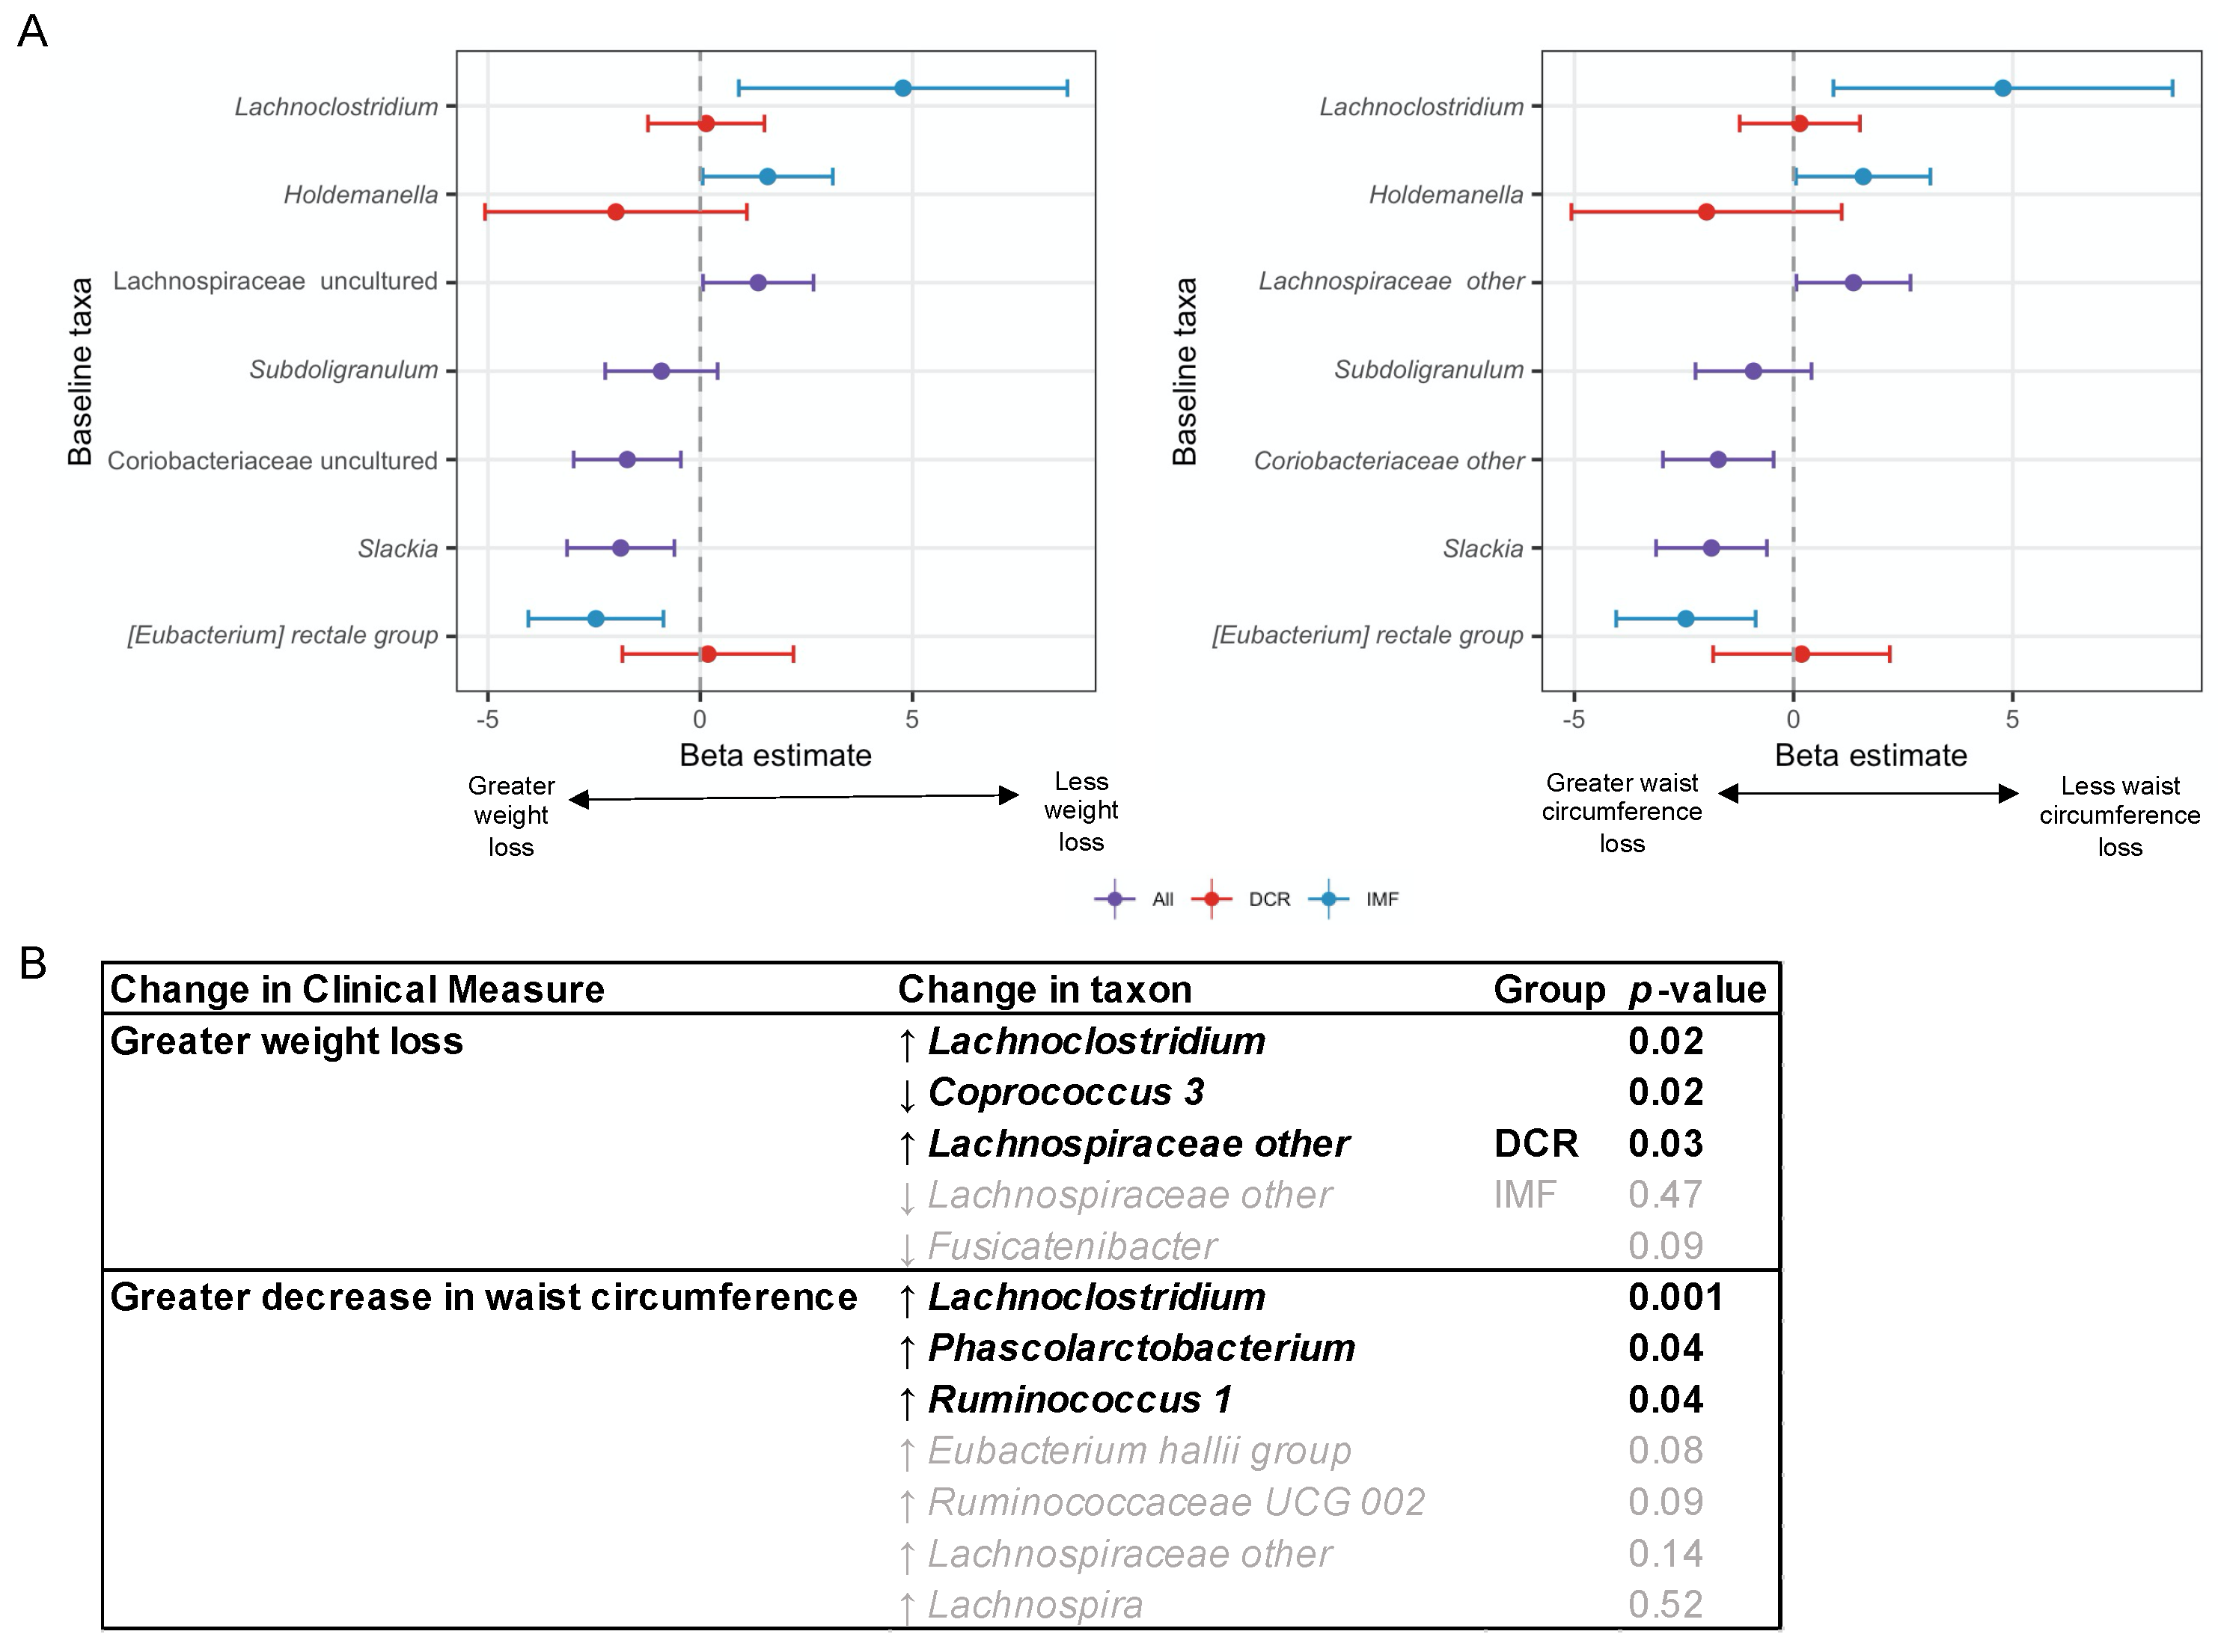
3.6. Baseline and Changes in Specific Gut Microbiota Genera Were Associated with Change in Weight and Waist Circumference at 3 Months
3.7. In Subset Analyses, Change in Energy Intake Was Predictive of Change in Gut Microbiota Beta-Diversity
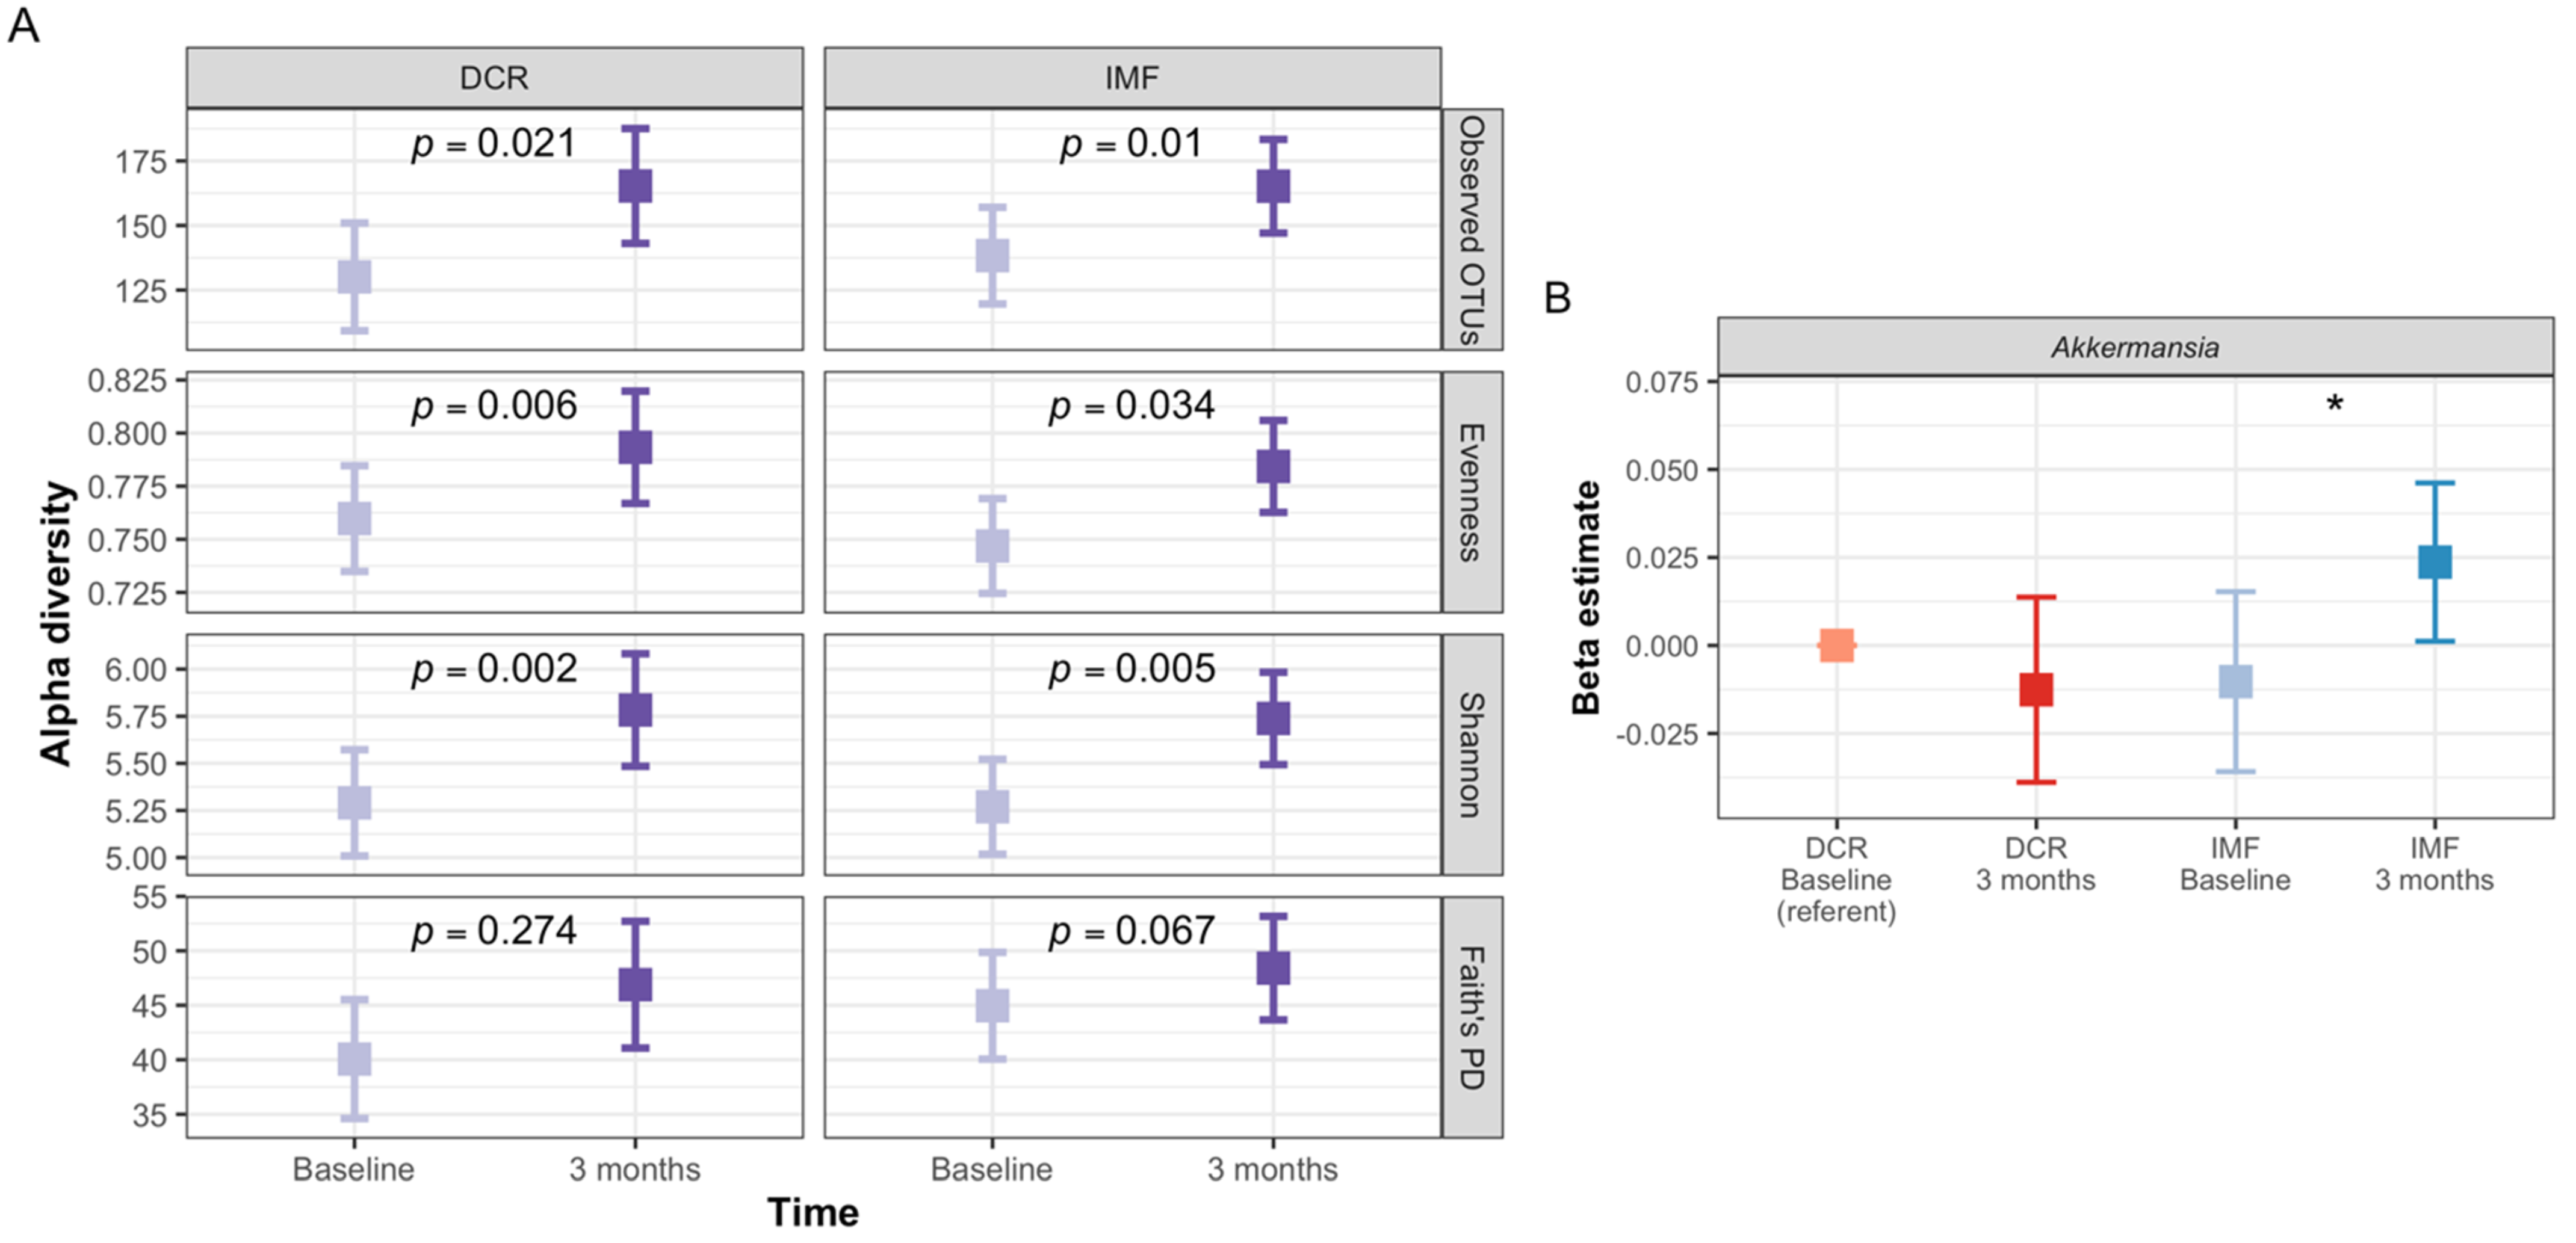
3.8. Analyses Comparing DCR to IMF Reveal Differences in the Gut Microbiota over Time and the Relationship with Clinical Measures
4. Discussion
5. Conclusions
Supplementary Materials
Author Contributions
Funding
Institutional Review Board Statement
Informed Consent Statement
Data Availability Statement
Conflicts of Interest
References
- Virani Salim, S.; Alvaro, A.; Benjamin Emelia, J.; Bittencourt Marcio, S.; Callaway Clifton, W.; Carson April, P.; Chamberlain Alanna, M.; Chang Alexander, R.; Cheng, S.; Delling Francesca, N.; et al. Heart Disease and Stroke Statistics—2020 Update: A Report From the American Heart Association. Circulation 2020, 141, e139–e596. [Google Scholar] [CrossRef] [PubMed]
- Mattson, M.P.; Wan, R. Beneficial Effects of Intermittent Fasting and Caloric Restriction on the Cardiovascular and Cerebrovascular Systems. J. Nutr. Biochem. 2005, 16, 129–137. [Google Scholar] [CrossRef] [PubMed]
- Jensen, M.D.; Ryan, D.H.; Apovian, C.M.; Ard, J.D.; Comuzzie, A.G.; Donato, K.A.; Hu, F.B.; Hubbard, V.S.; Jakicic, J.M.; Kushner, R.F.; et al. 2013 AHA/ACC/TOS Guideline for the Management of Overweight and Obesity in Adults: A Report of the American College of Cardiology/American Heart Association Task Force on Practice Guidelines and The Obesity Society. J. Am. Coll. Cardiol. 2014, 63, 2985–3023. [Google Scholar] [CrossRef] [PubMed] [Green Version]
- Marek, R.J.; Coulon, S.M.; Brown, J.D.; Lydecker, J.A.; Marek, S.; Malcolm, R.; O’Neil, P.M. Characteristics of Weight Loss Trajectories in a Comprehensive Lifestyle Intervention. Obesity 2017, 25, 2062–2067. [Google Scholar] [CrossRef] [PubMed] [Green Version]
- Greaves, C.; Poltawski, L.; Garside, R.; Briscoe, S. Understanding the Challenge of Weight Loss Maintenance: A Systematic Review and Synthesis of Qualitative Research on Weight Loss Maintenance. Health Psychol. Rev. 2017, 11, 145–163. [Google Scholar] [CrossRef] [Green Version]
- Chen, R.; Snyder, M. Promise of Personalized Omics to Precision Medicine. Wires Syst. Biol. Med. 2013, 5, 73–82. [Google Scholar] [CrossRef] [PubMed] [Green Version]
- DiBaise, J.K.; Frank, D.N.; Mathur, R. Impact of the Gut Microbiota on the Development of Obesity: Current Concepts. Am. J. Gastroenterol. Suppl. 2012, 1, 22–27. [Google Scholar] [CrossRef]
- Maruvada, P.; Leone, V.; Kaplan, L.M.; Chang, E.B. The Human Microbiome and Obesity: Moving beyond Associations. Cell Host Microbe 2017, 22, 589–599. [Google Scholar] [CrossRef]
- Sanna, S.; van Zuydam, N.R.; Mahajan, A.; Kurilshikov, A.; Vila, A.V.; Võsa, U.; Mujagic, Z.; Masclee, A.A.M.; Jonkers, D.M.A.E.; Oosting, M.; et al. Causal Relationships among the Gut Microbiome, Short-Chain Fatty Acids and Metabolic Diseases. Nat. Genet. 2019, 51, 600. [Google Scholar] [CrossRef]
- Torkamani, A.; Topol, E. Polygenic Risk Scores Expand to Obesity. Cell 2019, 177, 518–520. [Google Scholar] [CrossRef] [Green Version]
- Turnbaugh, P.J.; Hamady, M.; Yatsunenko, T.; Cantarel, B.L.; Duncan, A.; Ley, R.E.; Sogin, M.L.; Jones, W.J.; Roe, B.A.; Affourtit, J.P.; et al. A Core Gut Microbiome in Obese and Lean Twins. Nature 2009, 457, 480–484. [Google Scholar] [CrossRef] [Green Version]
- Klimentidis, Y.C.; Bea, J.W.; Lohman, T.; Hsieh, P.-S.; Going, S.; Chen, Z. High Genetic Risk Individuals Benefit Less from Resistance Exercise Intervention. Int. J. Obes. 2015, 39, 1371–1375. [Google Scholar] [CrossRef] [Green Version]
- Kunnackal, G.J.; Wang, L.; Nanavati, J.; Twose, C.; Singh, R.; Mullin, G. Dietary Alteration of the Gut Microbiome and Its Impact on Weight and Fat Mass: A Systematic Review and Meta-Analysis. Genes 2018, 9, 167. [Google Scholar] [CrossRef] [Green Version]
- Turnbaugh, P.J.; Ley, R.E.; Mahowald, M.A.; Magrini, V.; Mardis, E.R.; Gordon, J.I. An Obesity-Associated Gut Microbiome with Increased Capacity for Energy Harvest. Nature 2006, 444, 1027–1131. [Google Scholar] [CrossRef]
- Ridaura, V.K.; Faith, J.J.; Rey, F.E.; Cheng, J.; Duncan, A.E.; Kau, A.L.; Griffin, N.W.; Lombard, V.; Henrissat, B.; Bain, J.R.; et al. Gut Microbiota from Twins Discordant for Obesity Modulate Metabolism in Mice. Science 2013, 341, 1241214. [Google Scholar] [CrossRef] [PubMed] [Green Version]
- Meijnikman, A.S.; Gerdes, V.E.; Nieuwdorp, M.; Herrema, H. Evaluating Causality of Gut Microbiota in Obesity and Diabetes in Humans. Endocr. Rev. 2018, 39, 133–153. [Google Scholar] [CrossRef] [PubMed]
- Seganfredo, F.B.; Blume, C.A.; Moehlecke, M.; Giongo, A.; Casagrande, D.S.; Spolidoro, J.V.N.; Padoin, A.V.; Schaan, B.D.; Mottin, C.C. Weight-Loss Interventions and Gut Microbiota Changes in Overweight and Obese Patients: A Systematic Review: Weight-Loss Impact on Gut Microbiota. Obes. Rev. 2017, 18, 832–851. [Google Scholar] [CrossRef]
- Wang, S.; Huang, M.; You, X.; Zhao, J.; Chen, L.; Wang, L.; Luo, Y.; Chen, Y. Gut Microbiota Mediates the Anti-Obesity Effect of Calorie Restriction in Mice. Sci. Rep. 2018, 8, 13037. [Google Scholar] [CrossRef] [Green Version]
- Li, G.; Xie, C.; Lu, S.; Nichols, R.G.; Tian, Y.; Li, L.; Patel, D.; Ma, Y.; Brocker, C.N.; Yan, T.; et al. Intermittent Fasting Promotes White Adipose Browning and Decreases Obesity by Shaping the Gut Microbiota. Cell Metab. 2017, 26, 672–685.e4. [Google Scholar] [CrossRef] [PubMed] [Green Version]
- Cotillard, A.; Kennedy, S.P.; Kong, L.C.; Prifti, E.; Pons, N.; Le Chatelier, E.; Almeida, M.; Quinquis, B.; Levenez, F.; Galleron, N.; et al. Dietary Intervention Impact on Gut Microbial Gene Richness. Nature 2013, 500, 585–588. [Google Scholar] [CrossRef]
- Dansinger, M.L.; Gleason, J.A.; Griffith, J.L.; Selker, H.P.; Schaefer, E.J. Comparison of the Atkins, Ornish, Weight Watchers, and Zone Diets for Weight Loss and Heart Disease Risk Reduction—A Randomized Trial. JAMA 2005, 293, 43–53. [Google Scholar] [CrossRef] [PubMed]
- Ross, R.; Neeland, I.J.; Yamashita, S.; Shai, I.; Seidell, J.; Magni, P.; Santos, R.D.; Arsenault, B.; Cuevas, A.; Hu, F.B.; et al. Waist Circumference as a Vital Sign in Clinical Practice: A Consensus Statement from the IAS and ICCR Working Group on Visceral Obesity. Nat. Rev. Endocrinol. 2020, 16, 177–189. [Google Scholar] [CrossRef] [PubMed]
- Siebert, J.C.; Stanislawski, M.A.; Zaman, A.; Ostendorf, D.M.; Konigsberg, I.R.; Jambal, P.; Ir, D.; Bing, K.; Wayland, L.; Scorsone, J.J.; et al. Multiomic Predictors of Short-Term Weight Loss and Clinical Outcomes During a Behavioral-Based Weight Loss Intervention. Obesity 2021, 29, 859–869. [Google Scholar] [CrossRef]
- Donnelly, J.E.; Blair, S.N.; Jakicic, J.M.; Manore, M.M.; Rankin, J.W.; Smith, B.K. Appropriate Physical Activity Intervention Strategies for Weight Loss and Prevention of Weight Regain for Adults. Med. Sci. Sports Exerc. 2009, 41, 459–471. [Google Scholar] [CrossRef] [PubMed]
- Leavitt, M.O. 2008 Physical Activity Guidelines for Americans; U.S. Department of Health and Human Services: Washington, DC, USA, 2008; p. 76.
- Peters, J.C.; Wyatt, H.R.; Foster, G.D.; Pan, Z.; Wojtanowski, A.C.; Veur, S.S.V.; Herring, S.J.; Brill, C.; Hill, J.O. The Effects of Water and Non-Nutritive Sweetened Beverages on Weight Loss during a 12-Week Weight Loss Treatment Program. Obesity 2014, 22, 1415–1421. [Google Scholar] [CrossRef] [PubMed]
- Wyatt, H.R.; Jortberg, B.T.; Babbel, C.; Garner, S.; Dong, F.; Grunwald, G.K.; Hill, J.O. Weight Loss in a Community Initiative That Promotes Decreased Energy Intake and Increased Physical Activity and Dairy Consumption: Calcium Weighs-In. J. Phys. Act. Health 2008, 5, 28–44. [Google Scholar] [CrossRef] [PubMed]
- Atkin, A.J.; Gorely, T.; Clemes, S.A.; Yates, T.; Edwardson, C.; Brage, S.; Salmon, J.; Marshall, S.J.; Biddle, S.J. Methods of Measurement in Epidemiology: Sedentary Behaviour. Int. J. Epidemiol. 2012, 41, 1460–1471. [Google Scholar] [CrossRef] [Green Version]
- Lyden, K.; Keadle, S.K.; Staudenmayer, J.; Freedson, P.S. The ActivPALTM Accurately Classifies Activity Intensity Categories in Healthy Adults. Med. Sci. Sports Exerc. 2017, 49, 1022–1028. [Google Scholar] [CrossRef] [Green Version]
- Jobira, B.; Frank, D.N.; Pyle, L.; Silveira, L.J.; Kelsey, M.M.; Garcia-Reyes, Y.; Robertson, C.E.; Ir, D.; Nadeau, K.J.; Cree-Green, M. Obese Adolescents with PCOS Have Altered Biodiversity and Relative Abundance in Gastrointestinal Microbiota. J. Clin. Endocrinol. Metab. 2020, 105, e2134–e2144. [Google Scholar] [CrossRef]
- Soderborg, T.K.; Clark, S.E.; Mulligan, C.E.; Janssen, R.C.; Babcock, L.; Ir, D.; Young, B.; Krebs, N.; Lemas, D.J.; Johnson, L.K.; et al. The Gut Microbiota in Infants of Obese Mothers Increases Inflammation and Susceptibility to NAFLD. Nat. Commun. 2018, 9, 4462. [Google Scholar] [CrossRef] [Green Version]
- Bolyen, E.; Rideout, J.R.; Dillon, M.R.; Bokulich, N.A.; Abnet, C.C.; Al-Ghalith, G.A.; Alexander, H.; Alm, E.J.; Arumugam, M.; Asnicar, F.; et al. Reproducible, Interactive, Scalable and Extensible Microbiome Data Science Using QIIME 2. Nat. Biotechnol. 2019, 37, 852–857. [Google Scholar] [CrossRef]
- Quast, C.; Pruesse, E.; Yilmaz, P.; Gerken, J.; Schweer, T.; Yarza, P.; Peplies, J.; Glöckner, F.O. The SILVA Ribosomal RNA Gene Database Project: Improved Data Processing and Web-Based Tools. Nucleic Acids Res. 2013, 41, D590–D596. [Google Scholar] [CrossRef] [PubMed]
- Janssen, S.; McDonald, D.; Gonzalez, A.; Navas-Molina, J.A.; Jiang, L.; Xu, Z.Z.; Winker, K.; Kado, D.M.; Orwoll, E.; Manary, M.; et al. Phylogenetic Placement of Exact Amplicon Sequences Improves Associations with Clinical Information. mSystems 2018, 3, e00021-18. [Google Scholar] [CrossRef] [PubMed] [Green Version]
- Lozupone, C.; Lladser, M.E.; Knights, D.; Stombaugh, J.; Knight, R. UniFrac: An Effective Distance Metric for Microbial Community Comparison. ISME J. 2011, 5, 169. [Google Scholar] [CrossRef] [PubMed] [Green Version]
- Hu, Y.-J.; Satten, G.A. Testing Hypotheses about the Microbiome Using the Linear Decomposition Model (LDM). Bioinformatics 2020, 36, 4106–4115. [Google Scholar] [CrossRef] [PubMed]
- Mandal, S.; Van Treuren, W.; White, R.A.; Eggesbø, M.; Knight, R.; Peddada, S.D. Analysis of Composition of Microbiomes: A Novel Method for Studying Microbial Composition. Microb. Ecol. Health Dis. 2015, 26, 27663. [Google Scholar] [CrossRef] [Green Version]
- Benjamini, Y.; Hochberg, Y.J.R. Controlling the False Discovery Rate: A Practical and Powerful Approach to Multiple Testing. J. R. Stat. Soc. Ser. B 1995, 57, 289–300. [Google Scholar] [CrossRef]
- Oksanen, J.; Blanchet, F.G.; Friendly, M.; Kindt, R.; Legendre, P.; McGlinn, D.; Minchin, P.R.; O’Hara, R.B.; Simpson, G.L.; Solymos, P.; et al. Vegan: Community Ecology Package. 2018. Available online: https://CRAN.R-project.org/package=vegan (accessed on 16 September 2021).
- Zhao, N.; Chen, J.; Carroll, I.M.; Ringel-Kulka, T.; Epstein, M.P.; Zhou, H.; Zhou, J.J.; Ringel, Y.; Li, H.; Wu, M.C. Testing in Microbiome-Profiling Studies with MiRKAT, the Microbiome Regression-Based Kernel Association Test. Am. J. Hum. Genet. 2015, 96, 797–807. [Google Scholar] [CrossRef] [Green Version]
- Plantinga, A.M.; Chen, J.; Jenq, R.R.; Wu, M.C. Pldist: Ecological Dissimilarities for Paired and Longitudinal Microbiome Association Analysis. Bioinformatics 2019, 35, 3567–3575. [Google Scholar] [CrossRef]
- Genuer, R.; Poggi, J.-M.; Tuleau-Malot, C. VSURF: An R Package for Variable Selection Using Random Forests. R J. 2015, 7, 19–33. [Google Scholar] [CrossRef] [Green Version]
- Williams, C.K.; Engelhardt, A.; Cooper, T.; Mayer, Z.; Ziem, A.; Scrucca, L.; Tang, Y.; Candan, C.; Kuhn, M.M. Package ‘Caret’. 2016. Available online: https://CRAN.R-project.org/package=caret (accessed on 16 September 2021).
- Grundy, M.S.; Cleeman, I.J.; Daniels, R.S.; Donato, A.K.; Eckel, H.R.; Franklin, A.B.; Gordon, J.D.; Krauss, M.R.; Savage, J.P.; Smith, C.S.; et al. Diagnosis and Management of the Metabolic Syndrome. Circulation 2005, 112, 2735–2752. [Google Scholar] [CrossRef] [PubMed] [Green Version]
- Human Microbiome Project Consortium. Structure, Function and Diversity of the Healthy Human Microbiome. Nature 2012, 486, 207–214. [Google Scholar] [CrossRef] [PubMed] [Green Version]
- Lozupone, C.A.; Hamady, M.; Kelley, S.T.; Knight, R. Quantitative and Qualitative β Diversity Measures Lead to Different Insights into Factors That Structure Microbial Communities. Appl. Environ. Microbiol. 2007, 73, 1576–1585. [Google Scholar] [CrossRef] [PubMed] [Green Version]
- Nadal, I.; Santacruz, A.; Marcos, A.; Warnberg, J.; Garagorri, M.; Moreno, L.A.; Martin-Matillas, M.; Campoy, C.; Martí, A.; Moleres, A.; et al. Shifts in Clostridia, Bacteroides and Immunoglobulin-Coating Fecal Bacteria Associated with Weight Loss in Obese Adolescents. Int. J. Obes. 2008, 33, 758–767. [Google Scholar] [CrossRef] [Green Version]
- Santacruz, A.; Marcos, A.; Wärnberg, J.; Martí, A.; Martin-Matillas, M.; Campoy, C.; Moreno, L.A.; Veiga, O.; Redondo-Figuero, C.; Garagorri, J.M.; et al. Interplay Between Weight Loss and Gut Microbiota Composition in Overweight Adolescents. Obesity 2009, 17, 1906–1915. [Google Scholar] [CrossRef] [Green Version]
- Simões, C.D.; Maukonen, J.; Scott, K.P.; Virtanen, K.A.; Pietiläinen, K.H.; Saarela, M. Impact of a Very Low-Energy Diet on the Fecal Microbiota of Obese Individuals. Eur. J. Nutr. 2014, 53, 1421–1429. [Google Scholar] [CrossRef]
- Louis, S.; Tappu, R.-M.; Damms-Machado, A.; Huson, D.H.; Bischoff, S.C. Characterization of the Gut Microbial Community of Obese Patients Following a Weight-Loss Intervention Using Whole Metagenome Shotgun Sequencing. PLoS ONE 2016, 11, e0149564. [Google Scholar] [CrossRef]
- Frost, F.; Storck, L.J.; Kacprowski, T.; Gärtner, S.; Rühlemann, M.; Bang, C.; Franke, A.; Völker, U.; Aghdassi, A.A.; Steveling, A.; et al. A Structured Weight Loss Program Increases Gut Microbiota Phylogenetic Diversity and Reduces Levels of Collinsella in Obese Type 2 Diabetics: A Pilot Study. PLoS ONE 2019, 14, e0219489. [Google Scholar] [CrossRef] [Green Version]
- Walker, A.W.; Ince, J.; Duncan, S.H.; Webster, L.M.; Holtrop, G.; Ze, X.; Brown, D.; Stares, M.D.; Scott, P.; Bergerat, A.; et al. Dominant and Diet-Responsive Groups of Bacteria within the Human Colonic Microbiota. ISME J. 2011, 5, 220–230. [Google Scholar] [CrossRef]
- Kootte, R.S.; Levin, E.; Salojärvi, J.; Smits, L.P.; Hartstra, A.V.; Udayappan, S.D.; Hermes, G.; Bouter, K.E.; Koopen, A.M.; Holst, J.J.; et al. Improvement of Insulin Sensitivity after Lean Donor Feces in Metabolic Syndrome Is Driven by Baseline Intestinal Microbiota Composition. Cell Metab. 2017, 26, 611–619.e6. [Google Scholar] [CrossRef] [PubMed] [Green Version]
- Nirmalkar, K.; Murugesan, S.; Pizano-Zárate, M.L.; Villalobos-Flores, L.E.; García-González, C.; Morales-Hernández, R.M.; Nuñez-Hernández, J.A.; Hernández-Quiroz, F.; Del Socorro Romero-Figueroa, M.; Hernández-Guerrero, C.; et al. Gut Microbiota and Endothelial Dysfunction Markers in Obese Mexican Children and Adolescents. Nutrients 2018, 10, 2009. [Google Scholar] [CrossRef] [Green Version]
- Liu, H.; Zhang, H.; Wang, X.; Yu, X.; Hu, C.; Zhang, X. The Family Coriobacteriaceae Is a Potential Contributor to the Beneficial Effects of Roux-En-Y Gastric Bypass on Type 2 Diabetes. Surg. Obes. Relat. Dis. 2018, 14, 584–593. [Google Scholar] [CrossRef]
- Corrêa, T.A.F.; Rogero, M.M.; Hassimotto, N.M.A.; Lajolo, F.M. The Two-Way Polyphenols-Microbiota Interactions and Their Effects on Obesity and Related Metabolic Diseases. Front. Nutr. 2019, 6, 188. [Google Scholar] [CrossRef] [Green Version]
- Chávez-Carbajal, A.; Nirmalkar, K.; Pérez-Lizaur, A.; Hernández-Quiroz, F.; Ramírez-del-Alto, S.; García-Mena, J.; Hernández-Guerrero, C. Gut Microbiota and Predicted Metabolic Pathways in a Sample of Mexican Women Affected by Obesity and Obesity Plus Metabolic Syndrome. Int. J. Mol. Sci. 2019, 20, 438. [Google Scholar] [CrossRef] [Green Version]
- Kasai, C.; Sugimoto, K.; Moritani, I.; Tanaka, J.; Oya, Y.; Inoue, H.; Tameda, M.; Shiraki, K.; Ito, M.; Takei, Y.; et al. Comparison of the Gut Microbiota Composition between Obese and Non-Obese Individuals in a Japanese Population, as Analyzed by Terminal Restriction Fragment Length Polymorphism and next-Generation Sequencing. BMC Gastroenterol. 2015, 15, 100. [Google Scholar] [CrossRef] [PubMed] [Green Version]
- Liu, R.; Hong, J.; Xu, X.; Feng, Q.; Zhang, D.; Gu, Y.; Shi, J.; Zhao, S.; Liu, W.; Wang, X.; et al. Gut Microbiome and Serum Metabolome Alterations in Obesity and after Weight-Loss Intervention. Nat. Med. 2017, 23, 859–868. [Google Scholar] [CrossRef]
- Damms-Machado, A.; Mitra, S.; Schollenberger, A.E.; Kramer, K.M.; Meile, T.; Königsrainer, A.; Huson, D.H.; Bischoff, S.C. Effects of Surgical and Dietary Weight Loss Therapy for Obesity on Gut Microbiota Composition and Nutrient Absorption. BioMed Research International 2015, 2015, 806248. [Google Scholar] [CrossRef]
- Naderpoor, N.; Mousa, A.; Gomez-Arango, L.F.; Barrett, H.L.; Dekker Nitert, M.; de Courten, B. Faecal Microbiota Are Related to Insulin Sensitivity and Secretion in Overweight or Obese Adults. J. Clin. Med. 2019, 8, 452. [Google Scholar] [CrossRef] [Green Version]
- Menni, C.; Zhu, J.; Le Roy, C.I.; Mompeo, O.; Young, K.; Rebholz, C.M.; Selvin, E.; North, K.E.; Mohney, R.P.; Bell, J.T.; et al. Serum Metabolites Reflecting Gut Microbiome Alpha Diversity Predict Type 2 Diabetes. Gut Microbes 2020, 11, 1632–1642. [Google Scholar] [CrossRef]
- Monga Kravetz, A.; Testerman, T.; Galuppo, B.; Graf, J.; Pierpont, B.; Siebel, S.; Feinn, R.; Santoro, N. Effect of Gut Microbiota and PNPLA3 Rs738409 Variant on Nonalcoholic Fatty Liver Disease (NAFLD) in Obese Youth. J. Clin. Endocrinol. Metab. 2020, 105, e3575–e3585. [Google Scholar] [CrossRef]
- Sze, M.A.; Schloss, P.D. Looking for a Signal in the Noise: Revisiting Obesity and the Microbiome. mBio 2016, 7, e01018-16. [Google Scholar] [CrossRef] [Green Version]
- Le Chatelier, E.; Nielsen, T.; Qin, J.; Prifti, E.; Hildebrand, F.; Falony, G.; Almeida, M.; Arumugam, M.; Batto, J.-M.; Kennedy, S.; et al. Richness of Human Gut Microbiome Correlates with Metabolic Markers. Nature 2013, 500, 541–546. [Google Scholar] [CrossRef] [PubMed]
- Stanislawski, M.A.; Dabelea, D.; Lange, L.A.; Wagner, B.D.; Lozupone, C.A. Gut Microbiota Phenotypes of Obesity. NPJ Biofilms Microbiomes 2019, 5, 18. [Google Scholar] [CrossRef]
- Yu, E.W.; Gao, L.; Stastka, P.; Cheney, M.C.; Mahabamunuge, J.; Soto, M.T.; Ford, C.B.; Bryant, J.A.; Henn, M.R.; Hohmann, E.L. Fecal Microbiota Transplantation for the Improvement of Metabolism in Obesity: The FMT-TRIM Double-Blind Placebo-Controlled Pilot Trial. PLoS Med. 2020, 17, e1003051. [Google Scholar] [CrossRef] [PubMed]
- De Cabo, R.; Mattson, M.P. Effects of Intermittent Fasting on Health, Aging, and Disease. N. Engl. J. Med. 2019, 381, 2541–2551. [Google Scholar] [CrossRef]
- Francesco, A.D.; Germanio, C.D.; Bernier, M.; de Cabo, R. A Time to Fast. Science 2018, 362, 770–775. [Google Scholar] [CrossRef] [Green Version]
- Catenacci, V.A.; Pan, Z.; Ostendorf, D.; Brannon, S.; Gozansky, W.S.; Mattson, M.P.; Martin, B.; MacLean, P.S.; Melanson, E.L.; Troy Donahoo, W. A Randomized Pilot Study Comparing Zero-Calorie Alternate-Day Fasting to Daily Caloric Restriction in Adults with Obesity. Obesity 2016, 24, 1874–1883. [Google Scholar] [CrossRef]
- Mattson, M.P.; Longo, V.D.; Harvie, M. Impact of Intermittent Fasting on Health and Disease Processes. Ageing Res. Rev. 2017, 39, 46–58. [Google Scholar] [CrossRef]
- Razavi, R.; Parvaresh, A.; Abbasi, B.; Yaghoobloo, K.; Hassanzadeh, A.; Mohammadifard, N.; Clark, C.C.T.; Morteza Safavi, S. The Alternate-Day Fasting Diet Is a More Effective Approach than a Calorie Restriction Diet on Weight Loss and Hs-CRP Levels. Int. J. Vitam. Nutr. Res. 2020, 1–9. [Google Scholar] [CrossRef]
- Dao, M.C.; Everard, A.; Aron-Wisnewsky, J.; Sokolovska, N.; Prifti, E.; Verger, E.O.; Kayser, B.D.; Levenez, F.; Chilloux, J.; Hoyles, L.; et al. Akkermansia Muciniphila and Improved Metabolic Health during a Dietary Intervention in Obesity: Relationship with Gut Microbiome Richness and Ecology. Gut 2016, 65, 426–436. [Google Scholar] [CrossRef] [Green Version]
- Everard, A.; Belzer, C.; Geurts, L.; Ouwerkerk, J.P.; Druart, C.; Bindels, L.B.; Guiot, Y.; Derrien, M.; Muccioli, G.G.; Delzenne, N.M.; et al. Cross-Talk between Akkermansia Muciniphila and Intestinal Epithelium Controls Diet-Induced Obesity. Proc. Natl. Acad. Sci. USA 2013, 110, 9066–9071. [Google Scholar] [CrossRef] [PubMed] [Green Version]
- Shin, N.-R.; Lee, J.-C.; Lee, H.-Y.; Kim, M.-S.; Whon, T.W.; Lee, M.-S.; Bae, J.-W. An Increase in the Akkermansia Spp. Population Induced by Metformin Treatment Improves Glucose Homeostasis in Diet-Induced Obese Mice. Gut 2014, 63, 727–735. [Google Scholar] [CrossRef] [Green Version]
- Peres Valgas da Silva, C.; Hernández-Saavedra, D.; White, J.D.; Stanford, K.I. Cold and Exercise: Therapeutic Tools to Activate Brown Adipose Tissue and Combat Obesity. Biology 2019, 8, 9. [Google Scholar] [CrossRef] [PubMed] [Green Version]
- Gao, X.; Xie, Q.; Kong, P.; Liu, L.; Sun, S.; Xiong, B.; Huang, B.; Yan, L.; Sheng, J.; Xiang, H. Polyphenol- and Caffeine-Rich Postfermented Pu-Erh Tea Improves Diet-Induced Metabolic Syndrome by Remodeling Intestinal Homeostasis in Mice. Infect. Immun. 2017, 86, e00601-17. [Google Scholar] [CrossRef] [PubMed] [Green Version]
- Burcelin, R. Gut Microbiota and Immune Crosstalk in Metabolic Disease. Mol. Metab. 2016, 5, 771–781. [Google Scholar] [CrossRef]
- Frank, D.N.; Zhu, W.; Sartor, R.B.; Li, E. Investigating the Biological and Clinical Significance of Human Dysbioses. Trends Microbiol. 2011, 19, 427–434. [Google Scholar] [CrossRef] [Green Version]
- Sonnenburg, J.L.; Bäckhed, F. Diet–Microbiota Interactions as Moderators of Human Metabolism. Nature 2016, 535, 56–64. [Google Scholar] [CrossRef]
- Fabbiano, S.; Suárez-Zamorano, N.; Chevalier, C.; Lazarević, V.; Kieser, S.; Rigo, D.; Leo, S.; Veyrat-Durebex, C.; Gaïa, N.; Maresca, M.; et al. Functional Gut Microbiota Remodeling Contributes to the Caloric Restriction-Induced Metabolic Improvements. Cell Metab. 2018, 28, 907–921.e7. [Google Scholar] [CrossRef] [Green Version]
- Shahar, R.T.; Koren, O.; Matarasso, S.; Shochat, T.; Magzal, F.; Agmon, M. Attributes of Physical Activity and Gut Microbiome in Adults: A Systematic Review. Int. J. Sports Med. 2020, 41, 801–814. [Google Scholar] [CrossRef]
- Mahmud, R.; Shehreen, S.; Shahriar, S.; Rahman, M.S.; Akhteruzzaman, S.; Sajib, A.A. Non-Caloric Artificial Sweeteners Modulate the Expression of Key Metabolic Genes in the Omnipresent Gut Microbe Escherichia Coli. J. Mol. Microbiol. Biotechnol. 2019, 1–14. [Google Scholar] [CrossRef]
- Voigt, R.M.; Forsyth, C.B.; Green, S.J.; Engen, P.A.; Keshavarzian, A. Circadian Rhythm and the Gut Microbiome. In International Review of Neurobiology; Cryan, J.F., Clarke, G., Eds.; Gut Microbiome and Behavior; Academic Press: Cambridge, MA, USA, 2016; Volume 131, pp. 193–205. [Google Scholar]
- Dhurandhar, N.V.; Schoeller, D.; Brown, A.W.; Heymsfield, S.B.; Thomas, D.; Sørensen, T.I.A.; Speakman, J.R.; Jeansonne, M.; Allison, D.B. Energy Balance Measurement: When Something Is Not Better than Nothing. Int. J. Obes. 2015, 39, 1109–1113. [Google Scholar] [CrossRef] [PubMed] [Green Version]
- Zeevi, D.; Korem, T.; Zmora, N.; Israeli, D.; Rothschild, D.; Weinberger, A.; Ben-Yacov, O.; Lador, D.; Avnit-Sagi, T.; Lotan-Pompan, M.; et al. Personalized Nutrition by Prediction of Glycemic Responses. Cell 2015, 163, 1079–1094. [Google Scholar] [CrossRef] [PubMed] [Green Version]
- Joyce, S.A.; Gahan, C.G.M. Bile Acid Modifications at the Microbe-Host Interface: Potential for Nutraceutical and Pharmaceutical Interventions in Host Health. Annu. Rev. Food Sci. Technol. 2016, 7, 313–333. [Google Scholar] [CrossRef] [PubMed]


| Overall | DCR | IMF | p-Value | |
|---|---|---|---|---|
| n | 59 | 25 | 34 | |
| Age (mean (SD)) | 40.7 (9.8) | 42.0 (10.4) | 39.8 (9.3) | 0.384 |
| Female sex | 45 (76.3) | 18 (72.0) | 27 (79.4) | 0.725 |
| Race | >0.99 | |||
| White | 53 (89.8) | 22 (88.0) | 31 (91.2) | |
| Black or African American | 4 (6.8) | 2 (8.0) | 2 (5.9) | |
| Asian | 2 (3.4) | 1 (4.0) | 1 (2.9) | |
| Hispanic ethnicity | 10 (16.9) | 6 (24.0) | 4 (11.8) | 0.297 |
| Education | 0.642 | |||
| 1 year College | 1 (1.7) | 1 (4.0) | 0 (0.0) | |
| 2 year College | 2 (3.4) | 0 (0.0) | 2 (5.9) | |
| 3 year College | 3 (5.1) | 1 (4.0) | 2 (5.9) | |
| 4 year College | 25 (42.4) | 9 (36.0) | 16 (47.1) | |
| Master’s Degree | 22 (37.3) | 11 (44.0) | 11 (32.4) | |
| Doctorate Degree | 6 (10.2) | 3 (12.0) | 3 (8.8) | |
| Income | 0.237 | |||
| <25,000 | 5 (8.5) | 2 (8.0) | 3 (8.8) | |
| 25,000–40,000 | 5 (8.5) | 1 (4.0) | 4 (11.8) | |
| 45,000–70,000 | 12 (20.3) | 5 (20.0) | 7 (20.6) | |
| 70,000–110,000 | 15 (25.4) | 10 (40.0) | 5 (14.7) | |
| >110,000 | 22 (37.3) | 7 (28.0) | 15 (44.1) | |
| Marital status | 0.113 | |||
| Single | 10 (16.9) | 2 (8.0) | 8 (23.5) | |
| Committed Relationship | 8 (13.6) | 2 (8.0) | 6 (17.6) | |
| Married | 35 (59.3) | 17 (68.0) | 18 (52.9) | |
| Divorced | 5 (8.5) | 4 (16.0) | 1 (2.9) | |
| Widowed | 1 (1.7) | 0 (0.0) | 1 (2.9) | |
| Body mass index (kg/m2) | 33.1 (4.4) | 32.9 (4.7) | 33.2 (4.1) | 0.803 |
| Stool collection | ||||
| Stool at baseline | 56 (94.9) | 25 (100.0) | 31 (91.2) | 0.355 |
| Stool at 3 months | 55 (93.2) | 22 (88.0) | 33 (97.1) | 0.399 |
| Stool at both times | 52 (88.1) | 22 (88.0) | 30 (88.2) | >0.99 |
| Metric | Covariate | F | p-Value |
|---|---|---|---|
| Weighted UniFrac | Time | 8.3 | <0.001 |
| Group | 1.7 | 0.970 | |
| Group*Time | 0.6 | 0.474 | |
| Unweighted UniFrac | Time | 1.7 | 0.001 |
| Group | 2.0 | 0.650 | |
| Group*Time | 0.8 | 0.118 |
Publisher’s Note: MDPI stays neutral with regard to jurisdictional claims in published maps and institutional affiliations. |
© 2021 by the authors. Licensee MDPI, Basel, Switzerland. This article is an open access article distributed under the terms and conditions of the Creative Commons Attribution (CC BY) license (https://creativecommons.org/licenses/by/4.0/).
Share and Cite
Stanislawski, M.A.; Frank, D.N.; Borengasser, S.J.; Ostendorf, D.M.; Ir, D.; Jambal, P.; Bing, K.; Wayland, L.; Siebert, J.C.; Bessesen, D.H.; et al. The Gut Microbiota during a Behavioral Weight Loss Intervention. Nutrients 2021, 13, 3248. https://doi.org/10.3390/nu13093248
Stanislawski MA, Frank DN, Borengasser SJ, Ostendorf DM, Ir D, Jambal P, Bing K, Wayland L, Siebert JC, Bessesen DH, et al. The Gut Microbiota during a Behavioral Weight Loss Intervention. Nutrients. 2021; 13(9):3248. https://doi.org/10.3390/nu13093248
Chicago/Turabian StyleStanislawski, Maggie A., Daniel N. Frank, Sarah J. Borengasser, Danielle M. Ostendorf, Diana Ir, Purevsuren Jambal, Kristen Bing, Liza Wayland, Janet C. Siebert, Daniel H. Bessesen, and et al. 2021. "The Gut Microbiota during a Behavioral Weight Loss Intervention" Nutrients 13, no. 9: 3248. https://doi.org/10.3390/nu13093248
APA StyleStanislawski, M. A., Frank, D. N., Borengasser, S. J., Ostendorf, D. M., Ir, D., Jambal, P., Bing, K., Wayland, L., Siebert, J. C., Bessesen, D. H., MacLean, P. S., Melanson, E. L., & Catenacci, V. A. (2021). The Gut Microbiota during a Behavioral Weight Loss Intervention. Nutrients, 13(9), 3248. https://doi.org/10.3390/nu13093248