
Dietary Supplement Enriched in Antioxidants and Omega-3 Promotes Glutamine Synthesis in Müller Cells: A Key Process against Oxidative Stress in Retina

 , , and
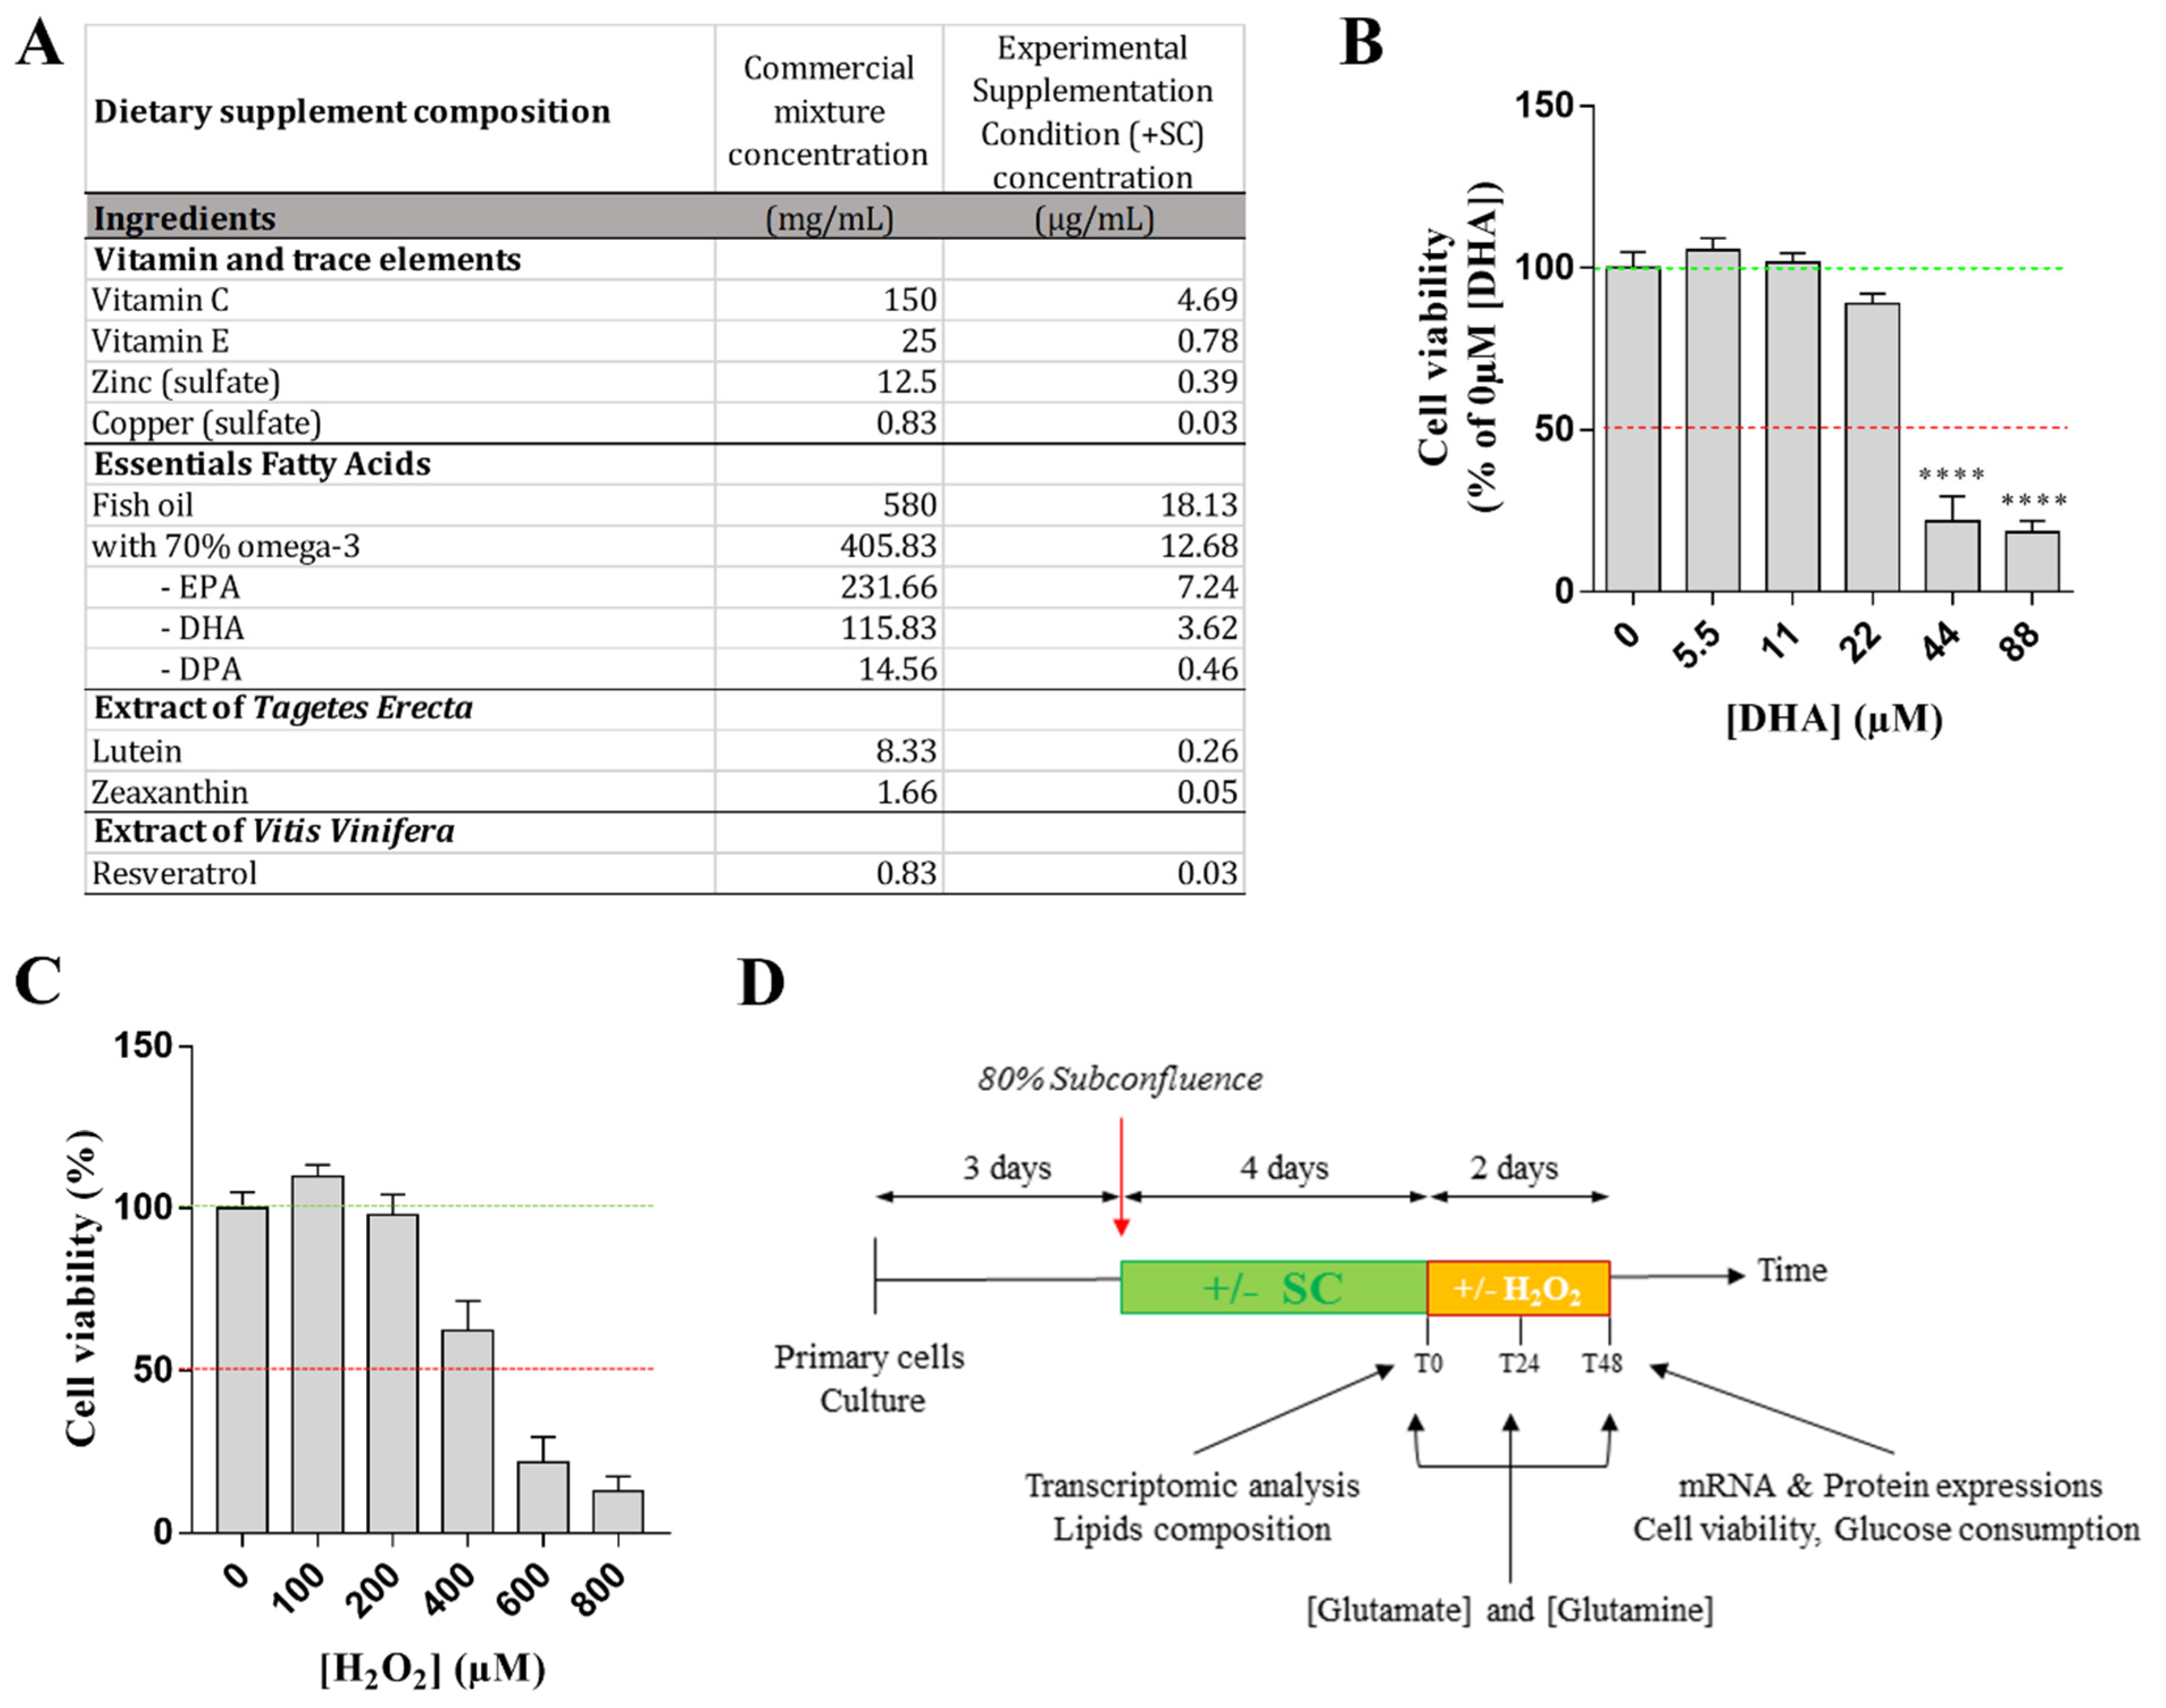
Abstract
1. Introduction
2. Materials and Methods
2.1. Animals
2.2. Müller Cells Culture
2.3. Treatment and Experimental Conditions
2.4. Experimental Design
2.5. Glutamate and Glutamine Dosages
2.6. Cell Viability Test
2.7. Glucose Consumption
2.8. Western Blotting
2.9. Quantitative RT-PCR
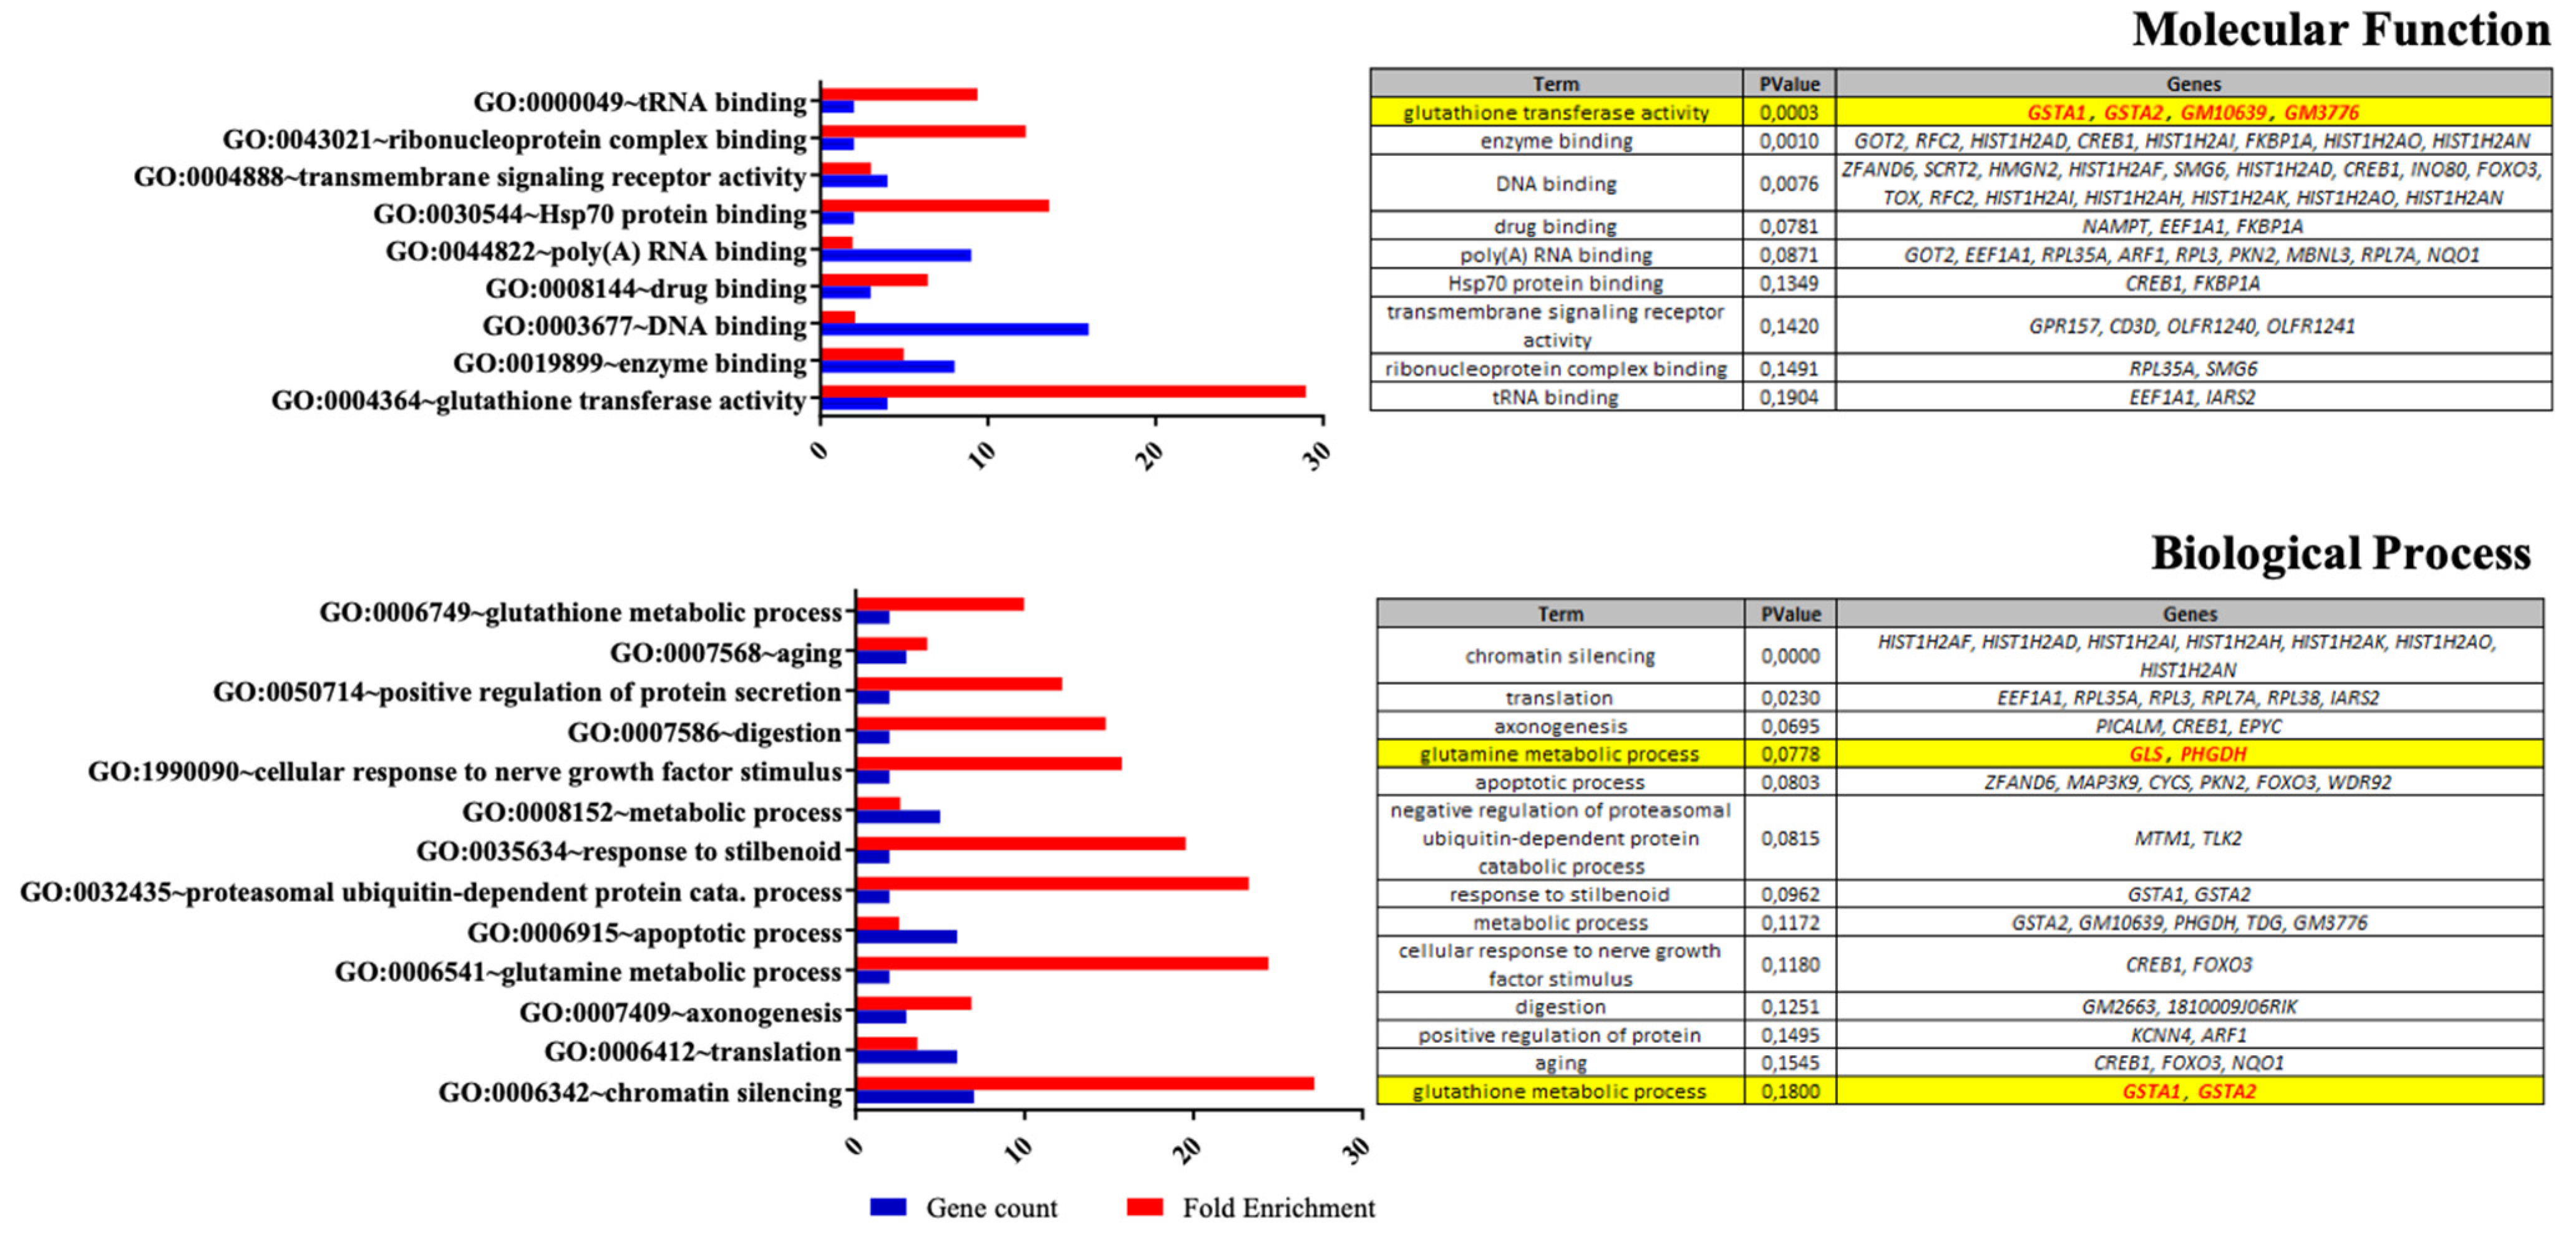
2.10. Expression Arrays
2.11. Fatty Acid Composition
2.12. Statistical Analysis
3. Results
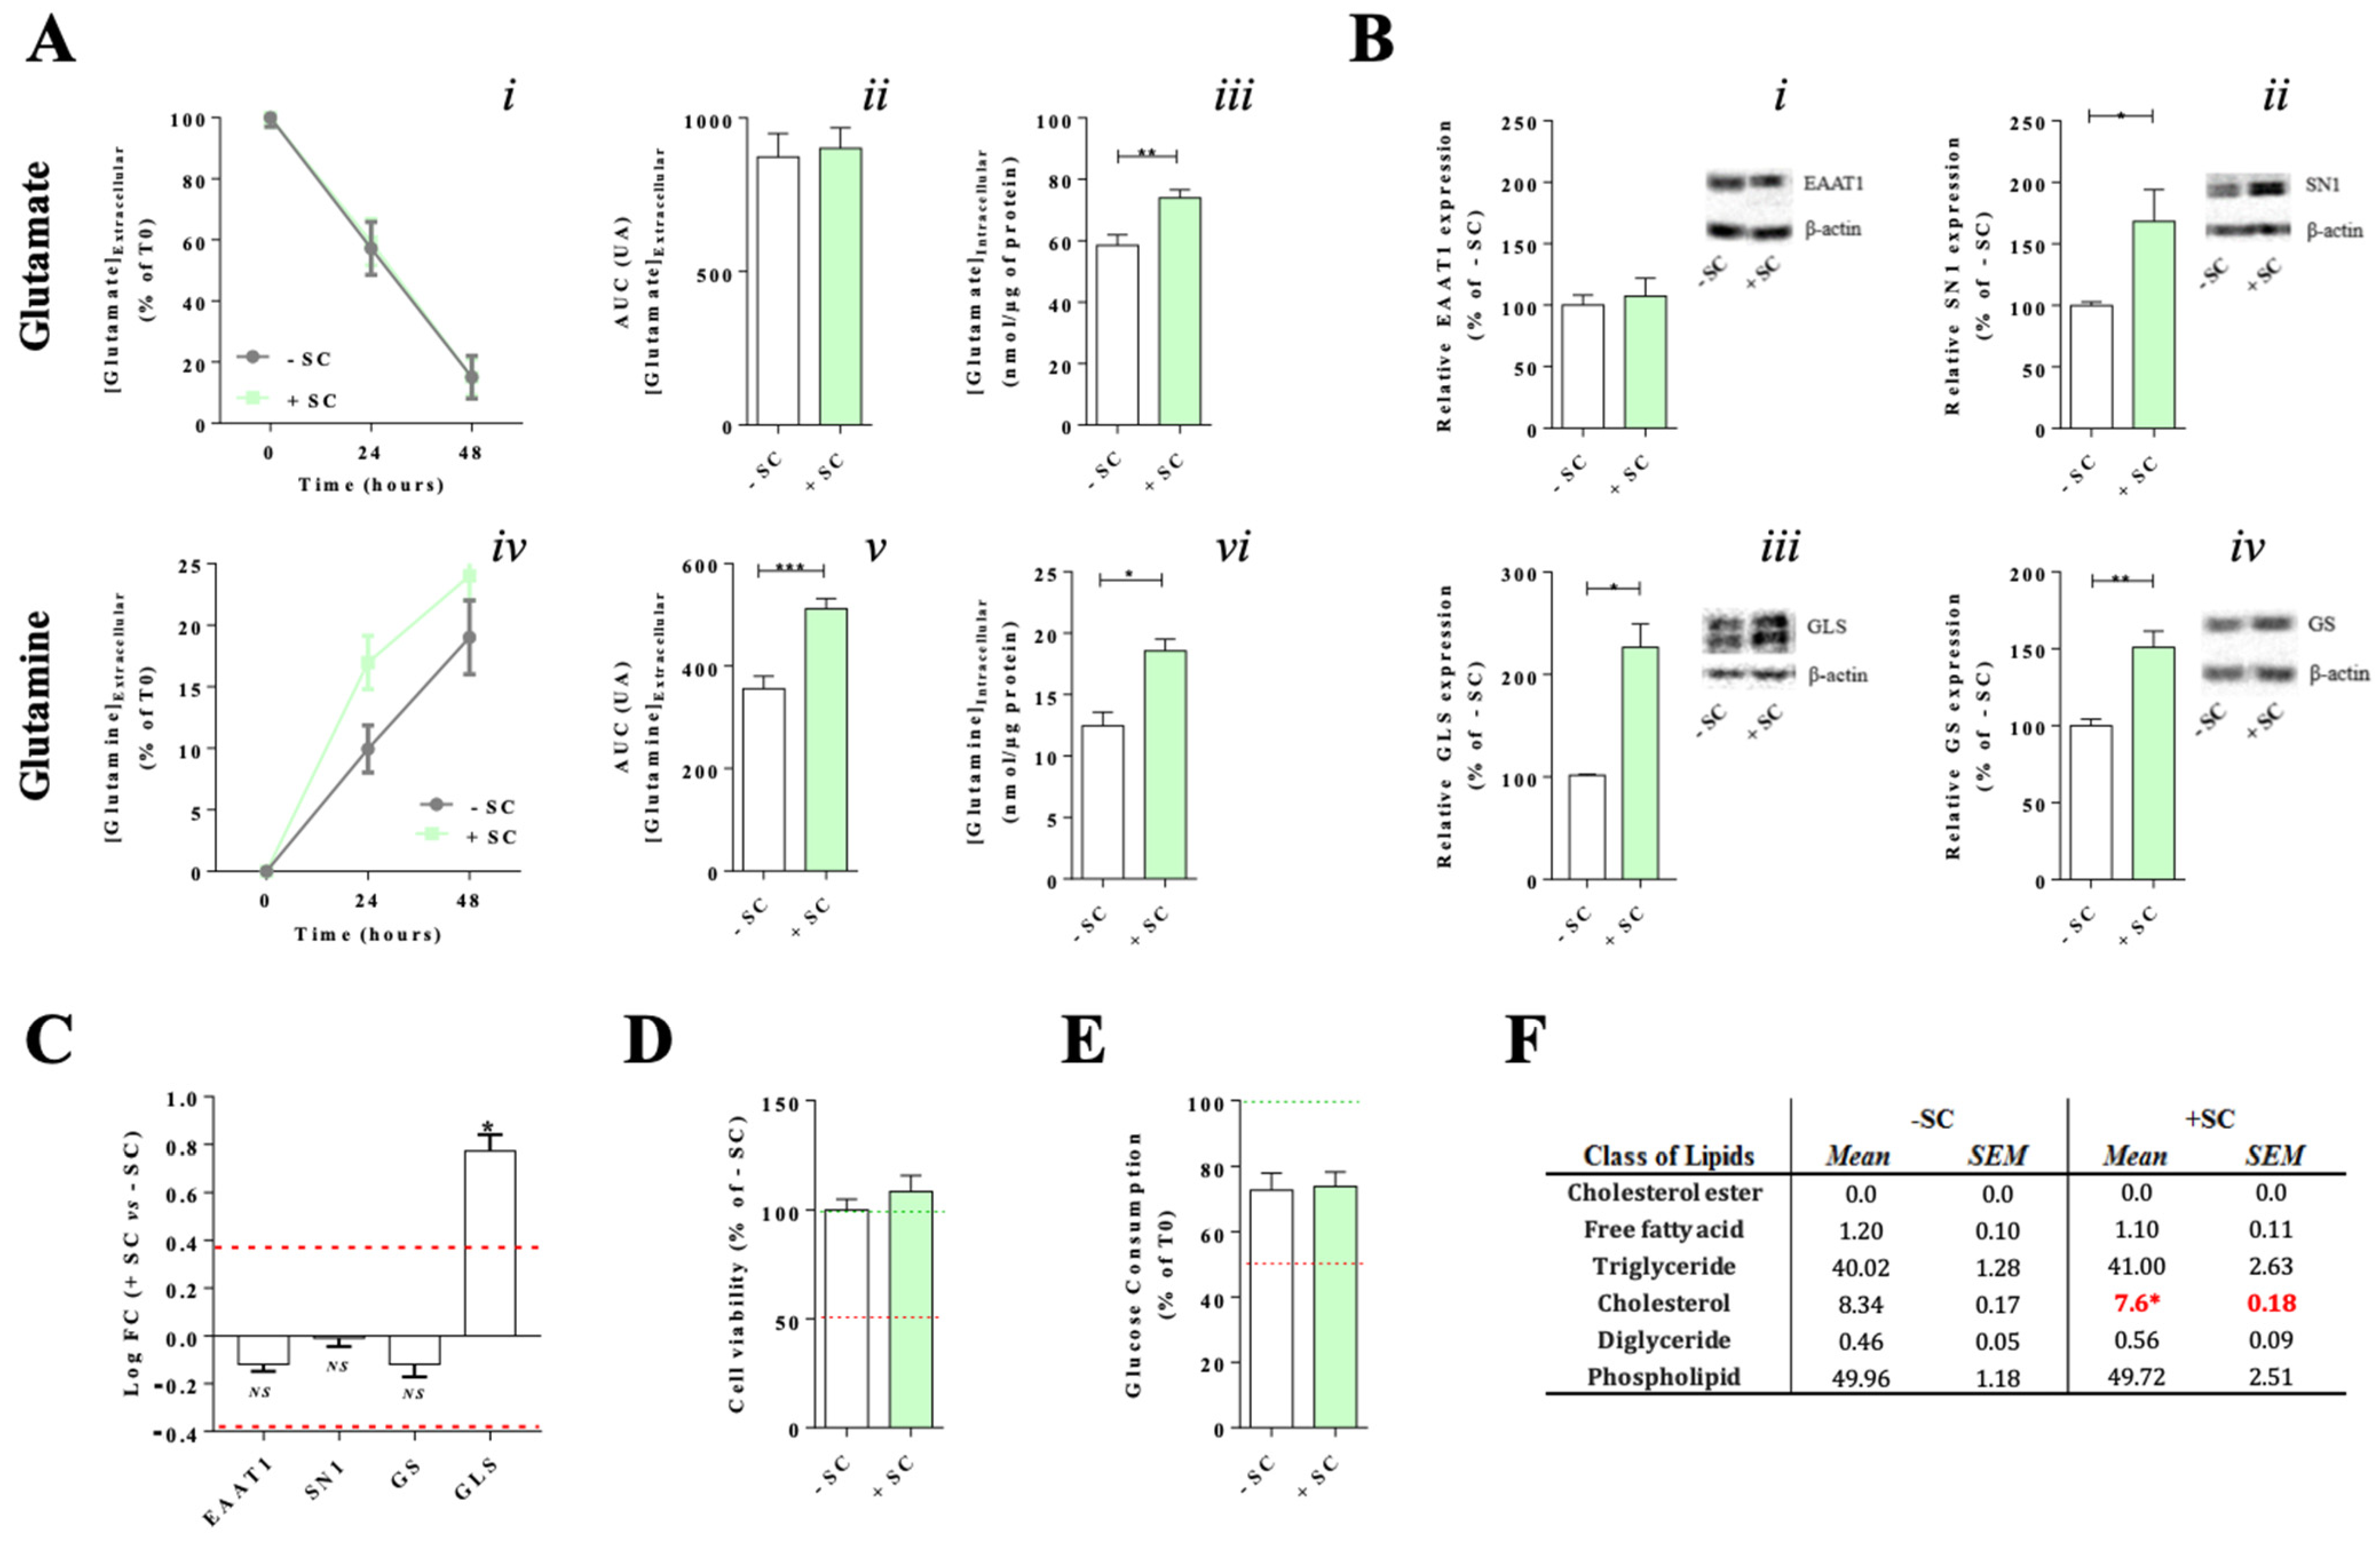
3.1. Effects of Nutritional Supplementation on Müller Cells Basal Conditions
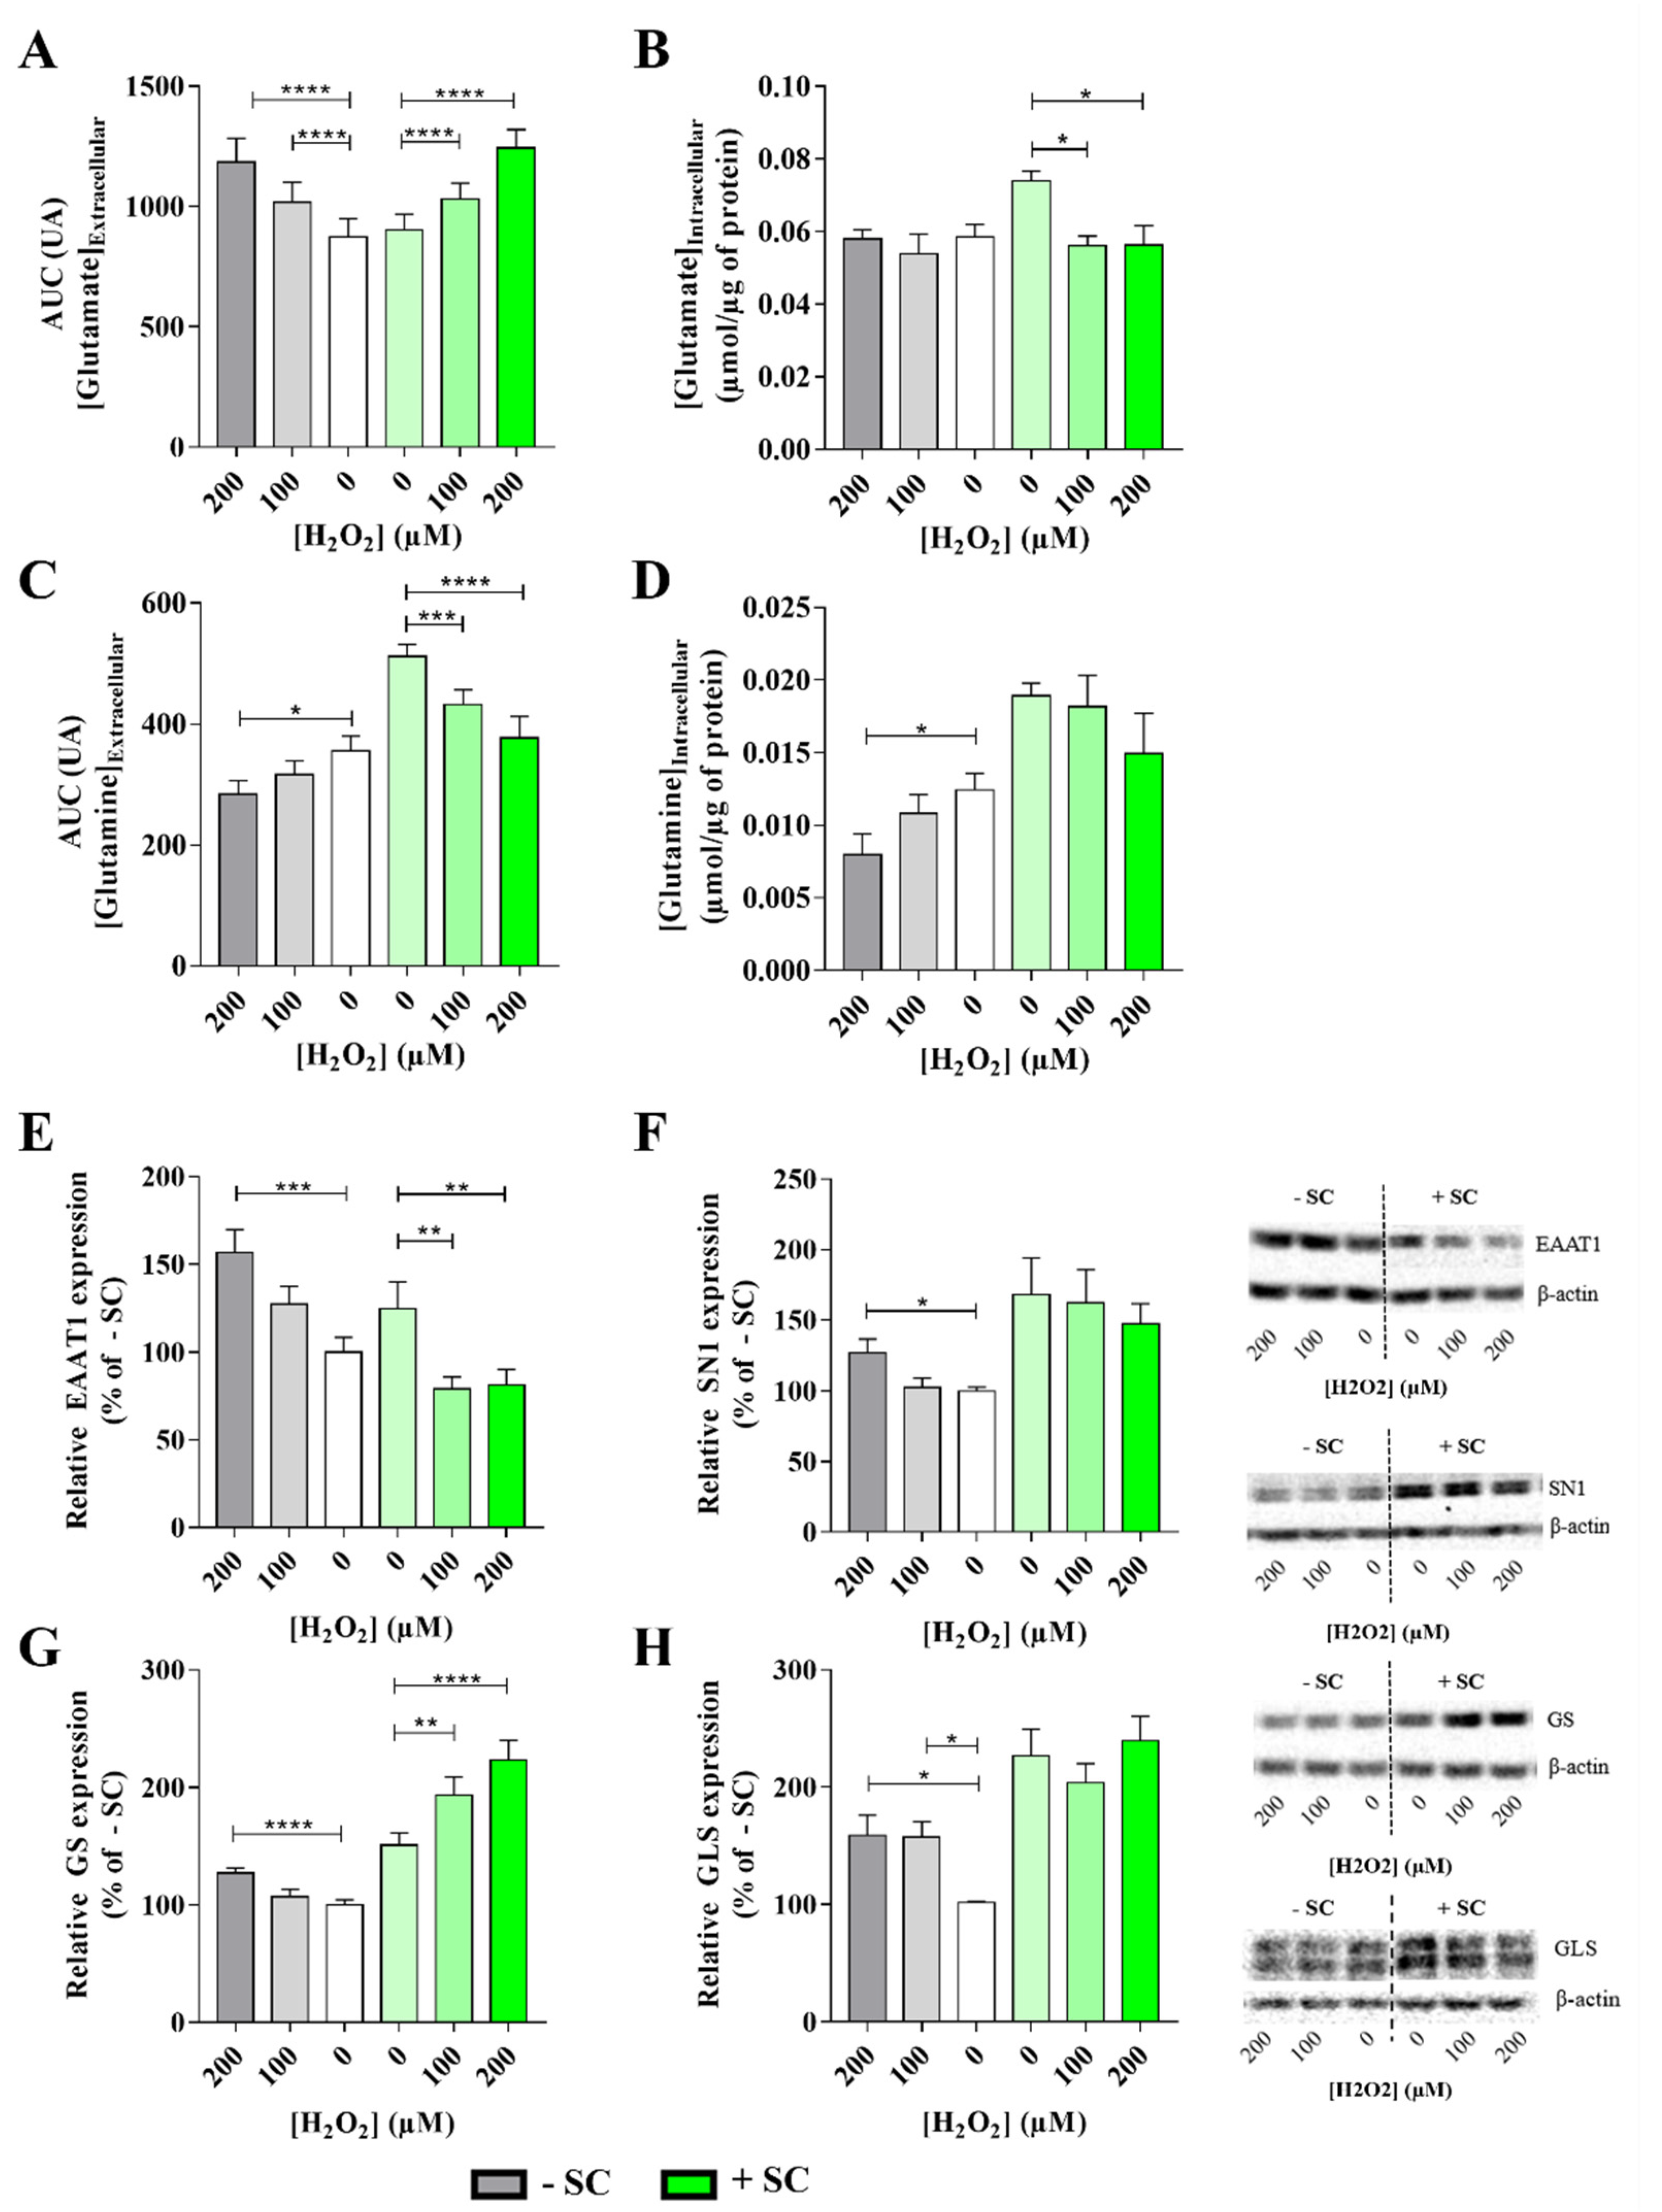
3.2. Effects of Sub-Lethal Oxidative Stress on Müller Cells Glutamate/Glutamate Metabolic Cycle with or without Nutritional Supplementation
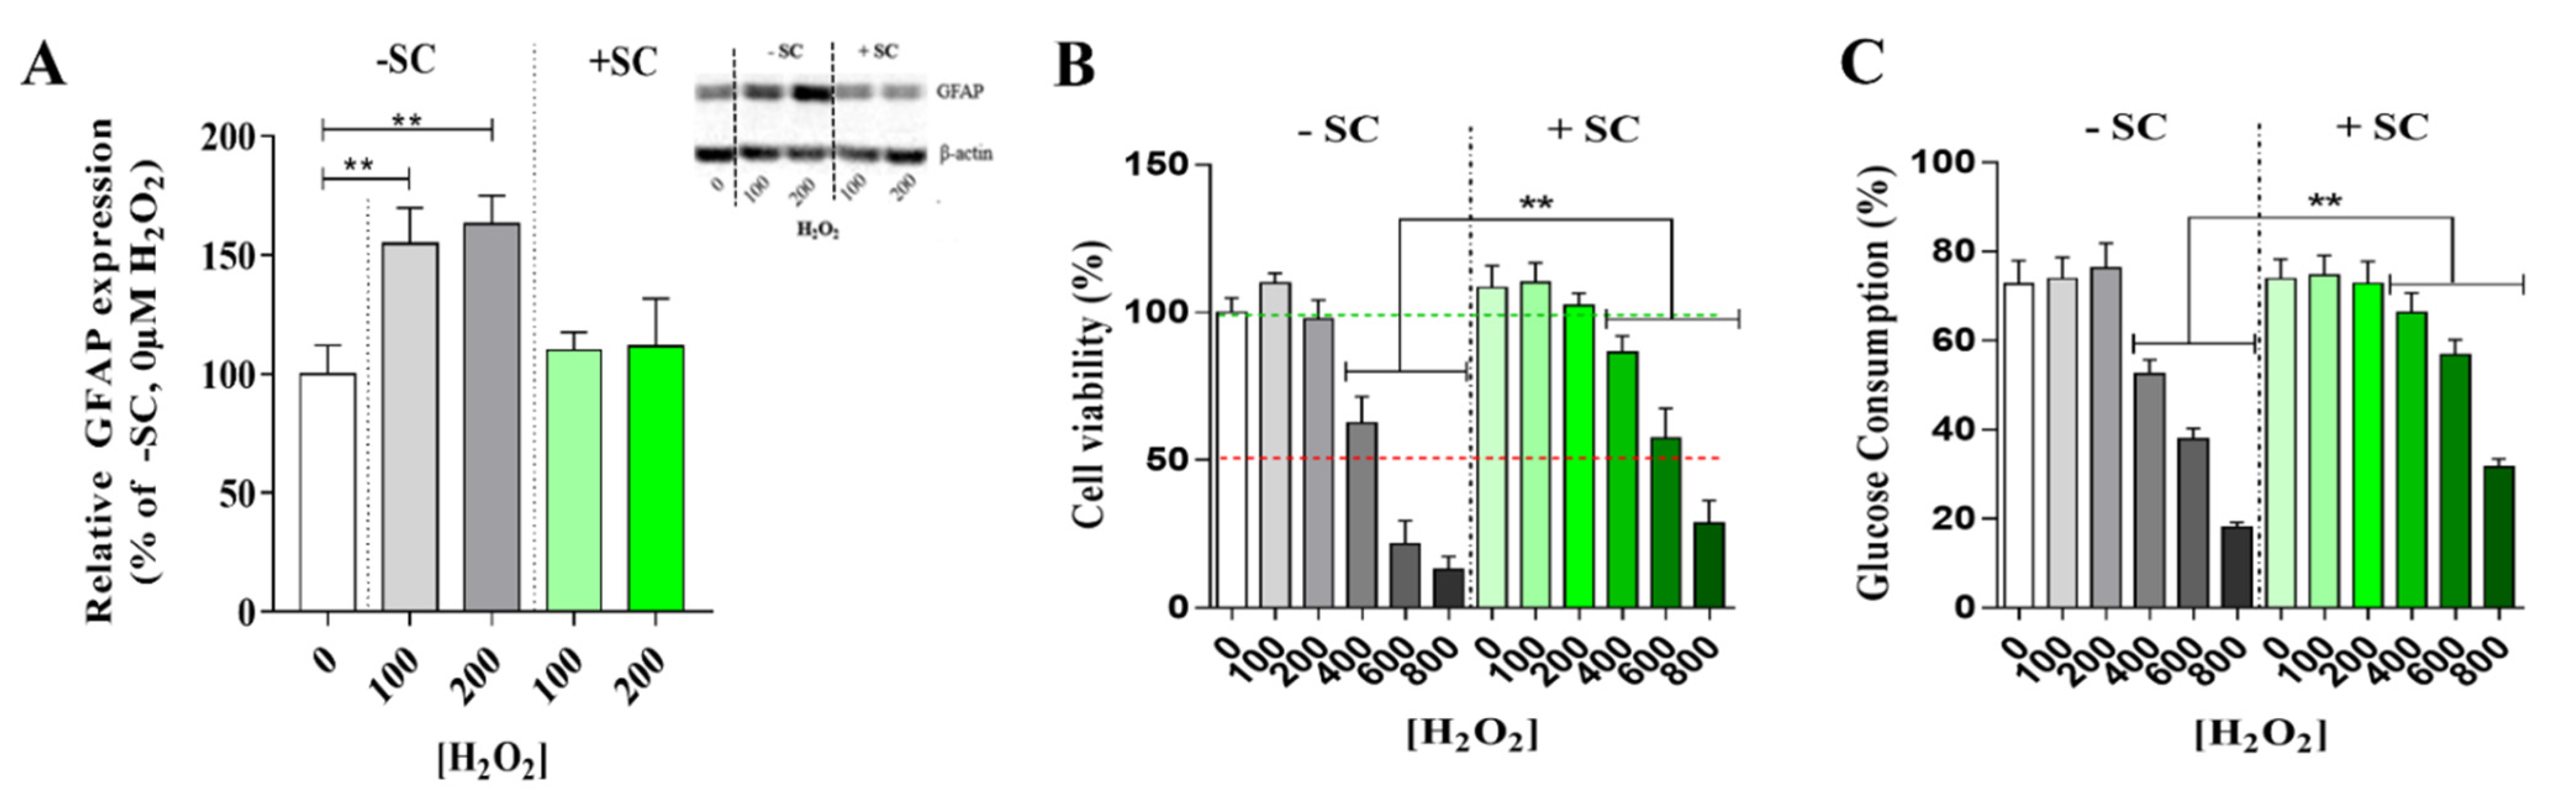
3.3. Effects of Nutritional Supplementation on Müller Cells Stress Markers
4. Discussion
4.1. Dietary Supplementation Modifies Glutamate/Glutamine Metabolic Cycle in Far of Glutamine Synthesis
4.2. Synergic Effect of the Nutritional Supplementation Compounds on Glutamine Enhancement
4.3. Dietary Supplementation Induced a Glutamine Buffering to Delay Oxidative Stress Impact: High Glutamine Level as a Key Target for Retinal Neuroprotection
Supplementary Materials
Author Contributions
Funding
Institutional Review Board Statement
Informed Consent Statement
Data Availability Statement
Acknowledgments
Conflicts of Interest
References
- Newman:, E.; Reichenbach, A. The Muller cell: A functional element of the retina. Trends Neurosci. 1996, 19, 307–312. [Google Scholar] [CrossRef]
- Bringmann, A.; Pannicke, T.; Grosche, J.; Francke, M.; Wiedemann, P.; Skatchkov, S.N.; Osborne, N.N.; Reichenbach, A. Muller cells in the healthy and diseased retina. Prog. Retin. Eye Res. 2006, 25, 397–424. [Google Scholar] [CrossRef] [PubMed]
- Chong, R.S.; Martin, K.R. Glial cell interactions and glaucoma. Curr. Opin. Ophthalmol. 2015, 26, 73–77. [Google Scholar] [CrossRef]
- Reichenbach, A.; Bringmann, A. New functions of Muller cells. Glia 2013, 61, 651–678. [Google Scholar] [CrossRef] [PubMed]
- Toft-Kehler, A.K.; Skytt, D.M.; Kolko, M. A Perspective on the Muller Cell-Neuron Metabolic Partnership in the Inner Retina. Mol. Neurobiol. 2018, 55, 5353–5361. [Google Scholar] [CrossRef]
- Bringmann, A.; Grosche, A.; Pannicke, T.; Reichenbach, A. GABA and Glutamate Uptake and Metabolism in Retinal Glial (Muller) Cells. Front. Endocrinol. 2013, 4, 48. [Google Scholar] [CrossRef] [PubMed]
- Sandhu, M.R.S.; Gruenbaum, B.F.; Gruenbaum, S.E.; Dhaher, R.; Deshpande, K.; Funaro, M.C.; Lee, T.W.; Zaveri, H.P.; Eid, T. Astroglial Glutamine Synthetase and the Pathogenesis of Mesial Temporal Lobe Epilepsy. Front. Neurol. 2021, 12, 665334. [Google Scholar] [CrossRef] [PubMed]
- Pow, D.V.; Robinson, S.R. Glutamate in some retinal neurons is derived solely from glia. Neuroscience 1994, 60, 355–366. [Google Scholar] [CrossRef]
- Riepe, R.E.; Norenburg, M.D. Muller cell localisation of glutamine synthetase in rat retina. Nature 1977, 268, 654–655. [Google Scholar] [CrossRef]
- Pow, D.V.; Crook, D.K. Immunocytochemical evidence for the presence of high levels of reduced glutathione in radial glial cells and horizontal cells in the rabbit retina. Neurosci. Lett. 1995, 193, 25–28. [Google Scholar] [CrossRef]
- Reichelt, W.; Stabel-Burow, J.; Pannicke, T.; Weichert, H.; Heinemann, U. The glutathione level of retinal Muller glial cells is dependent on the high-affinity sodium-dependent uptake of glutamate. Neuroscience 1997, 77, 1213–1224. [Google Scholar] [CrossRef]
- George, A.K.; Singh, M.; Homme, R.P.; Majumder, A.; Sandhu, H.S.; Tyagi, S.C. A hypothesis for treating inflammation and oxidative stress with hydrogen sulfide during age-related macular degeneration. Int. J. Ophthalmol. 2018, 11, 881–887. [Google Scholar] [CrossRef]
- Salt, T.E.; Cordeiro, M.F. Glutamate excitotoxicity in glaucoma: Throwing the baby out with the bathwater? Eye 2006, 20, 730–732. [Google Scholar] [CrossRef]
- Devoldere, J.; Peynshaert, K.; De Smedt, S.C.; Remaut, K. Muller cells as a target for retinal therapy. Drug Discov. Today 2019, 24, 1483–1498. [Google Scholar] [CrossRef] [PubMed]
- Age-Related Eye Disease Study Research, G. A randomized, placebo-controlled, clinical trial of high-dose supplementation with vitamins C and E and beta carotene for age-related cataract and vision loss: AREDS report no. 9. Arch. Ophthalmol. 2001, 119, 1439–1452. [Google Scholar]
- Ramchani-Ben Othman, K.; Cercy, C.; Amri, M.; Doly, M.; Ranchon-Cole, I. Dietary supplement enriched in antioxidants and omega-3 protects from progressive light-induced retinal degeneration. PLoS ONE 2015, 10, e0128395. [Google Scholar] [CrossRef]
- Hicks, D.; Courtois, Y. The growth and behaviour of rat retinal Muller cells in vitro. 1. An improved method for isolation and culture. Exp. Eye Res. 1990, 51, 119–129. [Google Scholar] [CrossRef]
- Schitine, C.S.; de Mello, F.G.; Reis, R.A. Neurochemical plasticity of Muller cells after retinal injury: Overexpression of GAT-3 may potentiate excitotoxicity. Neural Regen. Res. 2015, 10, 1376–1378. [Google Scholar] [CrossRef]
- Schitine, C.S.; Mendez-Flores, O.G.; Santos, L.E.; Ornelas, I.; Calaza, K.C.; Perez-Toledo, K.; Lopez-Bayghen, E.; Ortega, A.; Gardino, P.F.; de Mello, F.G.; et al. Functional plasticity of GAT-3 in avian Muller cells is regulated by neurons via a glutamatergic input. Neurochem. Int. 2015, 82, 42–51. [Google Scholar] [CrossRef]
- Delyfer, M.N.; Forster, V.; Neveux, N.; Picaud, S.; Leveillard, T.; Sahel, J.A. Evidence for glutamate-mediated excitotoxic mechanisms during photoreceptor degeneration in the rd1 mouse retina. Molecular Vis. 2005, 11, 688–696. [Google Scholar]
- Schur, R.M.; Gao, S.; Yu, G.; Chen, Y.; Maeda, A.; Palczewski, K.; Lu, Z.R. New GABA modulators protect photoreceptor cells from light-induced degeneration in mouse models. FASEB J. 2018, 32, 3289–3300. [Google Scholar] [CrossRef]
- Holze, C.; Michaudel, C.; Mackowiak, C.; Haas, D.A.; Benda, C.; Hubel, P.; Pennemann, F.L.; Schnepf, D.; Wettmarshausen, J.; Braun, M.; et al. Oxeiptosis, a ROS-induced caspase-independent apoptosis-like cell-death pathway. Nat. Immunol. 2018, 19, 130–140. [Google Scholar] [CrossRef] [PubMed]
- Perche, O.; Felgerolle, C.; Ardourel, M.; Bazinet, A.; Paris, A.; Rossignol, R.; Meyer-Dilhet, G.; Mausset-Bonnefont, A.L.; Hebert, B.; Laurenceau, D.; et al. Early Retinal Defects in Fmr1(-/y) Mice: Toward a Critical Role of Visual Dys-Sensitivity in the Fragile X Syndrome Phenotype? Front. Cell. Neurosci. 2018, 12, 96. [Google Scholar] [CrossRef] [PubMed]
- Herzine, A.; Laugeray, A.; Feat, J.; Menuet, A.; Quesniaux, V.; Richard, O.; Pichon, J.; Montecot-Dubourg, C.; Perche, O.; Mortaud, S. Perinatal Exposure to Glufosinate Ammonium Herbicide Impairs Neurogenesis and Neuroblast Migration through Cytoskeleton Destabilization. Front. Cell. Neurosci. 2016, 10, 191. [Google Scholar] [CrossRef] [PubMed]
- Perche, O.; Haddad, G.; Menuet, A.; Callier, P.; Marcos, M.; Briault, S.; Laudier, B. Dysregulation of FOXG1 pathway in a 14q12 microdeletion case. Am. J. Med. Genet. Part A 2013, 161A, 3072–3077. [Google Scholar] [CrossRef] [PubMed]
- Folch, J.; Lees, M.; Sloane Stanley, G.H. A simple method for the isolation and purification of total lipides from animal tissues. J. Biol. Chem. 1957, 226, 497–509. [Google Scholar] [CrossRef]
- Ackman, R.G. Flame ionization detection applied to thin-layer chromatography on coated quartz rods. Methods Enzym. 1981, 72, 205–252. [Google Scholar] [CrossRef]
- Sébédio, J.L.; Juanéda, P. Quantitative lipid analyses using the new Iatroscan TLC-FID system. J. Planar Chromatogr. 1991, 4, 35–41. [Google Scholar]
- Morrison, W.R.; Smith, L.M. Preparation of Fatty Acid Methyl Esters and Dimethylacetals from Lipids with Boron Fluoride--Methanol. J. Lipid Res. 1964, 5, 600–608. [Google Scholar] [CrossRef]
- Cerdan, S.; Rodrigues, T.B.; Sierra, A.; Benito, M.; Fonseca, L.L.; Fonseca, C.P.; Garcia-Martin, M.L. The redox switch/redox coupling hypothesis. Neurochem. Int. 2006, 48, 523–530. [Google Scholar] [CrossRef]
- Erecinska, M.; Silver, I.A. Metabolism and role of glutamate in mammalian brain. Prog. Neurobiol. 1990, 35, 245–296. [Google Scholar] [CrossRef]
- Bringmann, A.; Iandiev, I.; Pannicke, T.; Wurm, A.; Hollborn, M.; Wiedemann, P.; Osborne, N.N.; Reichenbach, A. Cellular signaling and factors involved in Muller cell gliosis: Neuroprotective and detrimental effects. Prog. Retin. Eye Res. 2009, 28, 423–451. [Google Scholar] [CrossRef] [PubMed]
- Rauen, T.; Taylor, W.R.; Kuhlbrodt, K.; Wiessner, M. High-affinity glutamate transporters in the rat retina: A major role of the glial glutamate transporter GLAST-1 in transmitter clearance. Cell Tissue Res. 1998, 291, 19–31. [Google Scholar] [CrossRef] [PubMed]
- Shaked, I.; Ben-Dror, I.; Vardimon, L. Glutamine synthetase enhances the clearance of extracellular glutamate by the neural retina. J. Neurochem. 2002, 83, 574–580. [Google Scholar] [CrossRef] [PubMed]
- Martinez-Hernandez, A.; Bell, K.P.; Norenberg, M.D. Glutamine synthetase: Glial localization in brain. Science 1977, 195, 1356–1358. [Google Scholar] [CrossRef] [PubMed]
- Zou, J.; Wang, Y.X.; Dou, F.F.; Lu, H.Z.; Ma, Z.W.; Lu, P.H.; Xu, X.M. Glutamine synthetase down-regulation reduces astrocyte protection against glutamate excitotoxicity to neurons. Neurochem. Int. 2010, 56, 577–584. [Google Scholar] [CrossRef] [PubMed]
- Derouiche, A.; Rauen, T. Coincidence of L-glutamate/L-aspartate transporter (GLAST) and glutamine synthetase (GS) immunoreactions in retinal glia: Evidence for coupling of GLAST and GS in transmitter clearance. J. Neurosci. Res. 1995, 42, 131–143. [Google Scholar] [CrossRef] [PubMed]
- Rauen, T. Diversity of glutamate transporter expression and function in the mammalian retina. Amino Acids 2000, 19, 53–62. [Google Scholar] [CrossRef]
- Pow, D.V.; Crook, D.K. Direct immunocytochemical evidence for the transfer of glutamine from glial cells to neurons: Use of specific antibodies directed against the d-stereoisomers of glutamate and glutamine. Neuroscience 1996, 70, 295–302. [Google Scholar] [CrossRef]
- Bak, L.K.; Schousboe, A.; Waagepetersen, H.S. The glutamate/GABA-glutamine cycle: Aspects of transport, neurotransmitter homeostasis and ammonia transfer. J. Neurochem. 2006, 98, 641–653. [Google Scholar] [CrossRef]
- Olsen, G.M.; Sonnewald, U. Glutamate: Where does it come from and where does it go? Neurochem. Int. 2015, 88, 47–52. [Google Scholar] [CrossRef]
- Liu, K.; Sutter, B.M.; Tu, B.P. Autophagy sustains glutamate and aspartate synthesis in Saccharomyces cerevisiae during nitrogen starvation. Nat. Commun. 2021, 12, 57. [Google Scholar] [CrossRef] [PubMed]
- Marquez, J.; de la Oliva, A.R.; Mates, J.M.; Segura, J.A.; Alonso, F.J. Glutaminase: A multifaceted protein not only involved in generating glutamate. Neurochem. Int. 2006, 48, 465–471. [Google Scholar] [CrossRef]
- Fonseca, L.L.; Monteiro, M.A.; Alves, P.M.; Carrondo, M.J.; Santos, H. Cultures of rat astrocytes challenged with a steady supply of glutamate: New model to study flux distribution in the glutamate-glutamine cycle. Glia 2005, 51, 286–296. [Google Scholar] [CrossRef]
- Cardona, C.; Sanchez-Mejias, E.; Davila, J.C.; Martin-Rufian, M.; Campos-Sandoval, J.A.; Vitorica, J.; Alonso, F.J.; Mates, J.M.; Segura, J.A.; Norenberg, M.D.; et al. Expression of Gls and Gls2 glutaminase isoforms in astrocytes. Glia 2015, 63, 365–382. [Google Scholar] [CrossRef]
- Champeil-Potokar, G.; Chaumontet, C.; Guesnet, P.; Lavialle, M.; Denis, I. Docosahexaenoic acid (22:6n-3) enrichment of membrane phospholipids increases gap junction coupling capacity in cultured astrocytes. Eur. J. Neurosci. 2006, 24, 3084–3090. [Google Scholar] [CrossRef]
- Champeil-Potokar, G.; Denis, I.; Goustard-Langelier, B.; Alessandri, J.M.; Guesnet, P.; Lavialle, M. Astrocytes in culture require docosahexaenoic acid to restore the n-3/n-6 polyunsaturated fatty acid balance in their membrane phospholipids. J. Neurosci. Res. 2004, 75, 96–106. [Google Scholar] [CrossRef] [PubMed]
- Champeil-Potokar, G.; Hennebelle, M.; Latour, A.; Vancassel, S.; Denis, I. Docosahexaenoic acid (DHA) prevents corticosterone-induced changes in astrocyte morphology and function. J. Neurochem. 2016, 136, 1155–1167. [Google Scholar] [CrossRef]
- Grintal, B.; Champeil-Potokar, G.; Lavialle, M.; Vancassel, S.; Breton, S.; Denis, I. Inhibition of astroglial glutamate transport by polyunsaturated fatty acids: Evidence for a signalling role of docosahexaenoic acid. Neurochem. Int. 2009, 54, 535–543. [Google Scholar] [CrossRef] [PubMed]
- dos Santos, A.Q.; Nardin, P.; Funchal, C.; de Almeida, L.M.; Jacques-Silva, M.C.; Wofchuk, S.T.; Goncalves, C.A.; Gottfried, C. Resveratrol increases glutamate uptake and glutamine synthetase activity in C6 glioma cells. Arch Biochem. Biophys. 2006, 453, 161–167. [Google Scholar] [CrossRef]
- Zeng, K.; Yang, N.; Wang, D.; Li, S.; Ming, J.; Wang, J.; Yu, X.; Song, Y.; Zhou, X.; Yang, Y. Resveratrol Prevents Retinal Dysfunction by Regulating Glutamate Transporters, Glutamine Synthetase Expression and Activity in Diabetic Retina. Neurochem. Res. 2016, 41, 1050–1064. [Google Scholar] [CrossRef]
- Corpas, R.; Grinan-Ferre, C.; Rodriguez-Farre, E.; Pallas, M.; Sanfeliu, C. Resveratrol Induces Brain Resilience Against Alzheimer Neurodegeneration Through Proteostasis Enhancement. Mol. Neurobiol. 2019, 56, 1502–1516. [Google Scholar] [CrossRef]
- Lee, C.S.; Choi, E.Y.; Lee, S.C.; Koh, H.J.; Lee, J.H.; Chung, J.H. Resveratrol Inhibits Hypoxia-Induced Vascular Endothelial Growth Factor Expression and Pathological Neovascularization. Yonsei Med. J. 2015, 56, 1678–1685. [Google Scholar] [CrossRef]
- Garcia, T.B.; Oliveira, K.R.; do Nascimento, J.L.; Crespo-Lopez, M.E.; Picanco-Diniz, D.L.; Mota, T.C.; Herculano, A.M. Glutamate induces glutathione efflux mediated by glutamate/aspartate transporter in retinal cell cultures. Neurochem. Res. 2011, 36, 412–418. [Google Scholar] [CrossRef] [PubMed]
- Begni, B.; Brighina, L.; Sirtori, E.; Fumagalli, L.; Andreoni, S.; Beretta, S.; Oster, T.; Malaplate-Armand, C.; Isella, V.; Appollonio, I.; et al. Oxidative stress impairs glutamate uptake in fibroblasts from patients with Alzheimer’s disease. Free Radic. Biol. Med. 2004, 37, 892–901. [Google Scholar] [CrossRef] [PubMed]
- Castegna, A.; Palmieri, L.; Spera, I.; Porcelli, V.; Palmieri, F.; Fabis-Pedrini, M.J.; Kean, R.B.; Barkhouse, D.A.; Curtis, M.T.; Hooper, D.C. Oxidative stress and reduced glutamine synthetase activity in the absence of inflammation in the cortex of mice with experimental allergic encephalomyelitis. Neuroscience 2011, 185, 97–105. [Google Scholar] [CrossRef]
- Neves, M.F.; Cunha, M.R.; de Paula, T. Effects of Nutrients and Exercises to Attenuate Oxidative Stress and Prevent Cardiovascular Disease. Curr. Pharm. Des. 2018, 24, 4800–4806. [Google Scholar] [CrossRef]
- Toft-Kehler, A.K.; Gurubaran, I.S.; Desler, C.; Rasmussen, L.J.; Skytt, D.M.; Kolko, M. Oxidative Stress-Induced Dysfunction of Muller Cells During Starvation. Invest. Ophthalmol. Vis. Sci. 2016, 57, 2721–2728. [Google Scholar] [CrossRef] [PubMed]
- Gionfriddo, J.R.; Freeman, K.S.; Groth, A.; Scofield, V.L.; Alyahya, K.; Madl, J.E. alpha-Luminol prevents decreases in glutamate, glutathione, and glutamine synthetase in the retinas of glaucomatous DBA/2J mice. Vet. Ophthalmol. 2009, 12, 325–332. [Google Scholar] [CrossRef] [PubMed]
- Grosche, J.; Hartig, W.; Reichenbach, A. Expression of glial fibrillary acidic protein (GFAP), glutamine synthetase (GS), and Bcl-2 protooncogene protein by Muller (glial) cells in retinal light damage of rats. Neurosci. Lett. 1995, 185, 119–122. [Google Scholar] [CrossRef]
- Hartig, W.; Grosche, J.; Distler, C.; Grimm, D.; el-Hifnawi, E.; Reichenbach, A. Alterations of Muller (glial) cells in dystrophic retinae of RCS rats. J. Neurocytol. 1995, 24, 507–517. [Google Scholar] [CrossRef]
- Lewis, G.P.; Erickson, P.A.; Guerin, C.J.; Anderson, D.H.; Fisher, S.K. Changes in the expression of specific Muller cell proteins during long-term retinal detachment. Exp. Eye Res. 1989, 49, 93–111. [Google Scholar] [CrossRef]
- Kruchkova, Y.; Ben-Dror, I.; Herschkovitz, A.; David, M.; Yayon, A.; Vardimon, L. Basic fibroblast growth factor: A potential inhibitor of glutamine synthetase expression in injured neural tissue. J. Neurochem. 2001, 77, 1641–1649. [Google Scholar] [CrossRef]
- Moreno, M.C.; Sande, P.; Marcos, H.A.; de Zavalia, N.; Keller Sarmiento, M.I.; Rosenstein, R.E. Effect of glaucoma on the retinal glutamate/glutamine cycle activity. FASEB J. 2005, 19, 1161–1162. [Google Scholar] [CrossRef] [PubMed]
- Nishiyama, T.; Nishukawa, S.; Tomita, H.; Tamai, M. Muller cells in the preconditioned retinal ischemic injury rat. Tohoku J. Exp. Med. 2000, 191, 221–232. [Google Scholar] [CrossRef][Green Version]
- Barnett, N.L.; Pow, D.V.; Robinson, S.R. Inhibition of Muller cell glutamine synthetase rapidly impairs the retinal response to light. Glia 2000, 30, 64–73. [Google Scholar] [CrossRef]
- Shen, W.; Li, S.; Chung, S.H.; Gillies, M.C. Retinal vascular changes after glial disruption in rats. J. Neurosci. Res. 2010, 88, 1485–1499. [Google Scholar] [CrossRef] [PubMed]
- Hernandez, M.; Recalde, S.; Gonzalez-Zamora, J.; Bilbao-Malave, V.; Saenz de Viteri, M.; Bezunartea, J.; Moreno-Orduna, M.; Belza, I.; Barrio-Barrio, J.; Fernandez-Robredo, P.; et al. Anti-Inflammatory and Anti-Oxidative Synergistic Effect of Vitamin D and Nutritional Complex on Retinal Pigment Epithelial and Endothelial Cell Lines against Age-Related Macular Degeneration. Nutrients 2021, 13, 1423. [Google Scholar] [CrossRef]


Publisher’s Note: MDPI stays neutral with regard to jurisdictional claims in published maps and institutional affiliations. |
© 2021 by the authors. Licensee MDPI, Basel, Switzerland. This article is an open access article distributed under the terms and conditions of the Creative Commons Attribution (CC BY) license (https://creativecommons.org/licenses/by/4.0/).
Share and Cite
Ardourel, M.; Felgerolle, C.; Pâris, A.; Acar, N.; Ramchani Ben Othman, K.; Ueda, N.; Rossignol, R.; Bazinet, A.; Hébert, B.; Briault, S.; et al. Dietary Supplement Enriched in Antioxidants and Omega-3 Promotes Glutamine Synthesis in Müller Cells: A Key Process against Oxidative Stress in Retina. Nutrients 2021, 13, 3216. https://doi.org/10.3390/nu13093216
Ardourel M, Felgerolle C, Pâris A, Acar N, Ramchani Ben Othman K, Ueda N, Rossignol R, Bazinet A, Hébert B, Briault S, et al. Dietary Supplement Enriched in Antioxidants and Omega-3 Promotes Glutamine Synthesis in Müller Cells: A Key Process against Oxidative Stress in Retina. Nutrients. 2021; 13(9):3216. https://doi.org/10.3390/nu13093216
Chicago/Turabian StyleArdourel, Maryvonne, Chloé Felgerolle, Arnaud Pâris, Niyazi Acar, Khaoula Ramchani Ben Othman, Natsuko Ueda, Rafaelle Rossignol, Audrey Bazinet, Betty Hébert, Sylvain Briault, and et al. 2021. "Dietary Supplement Enriched in Antioxidants and Omega-3 Promotes Glutamine Synthesis in Müller Cells: A Key Process against Oxidative Stress in Retina" Nutrients 13, no. 9: 3216. https://doi.org/10.3390/nu13093216
APA StyleArdourel, M., Felgerolle, C., Pâris, A., Acar, N., Ramchani Ben Othman, K., Ueda, N., Rossignol, R., Bazinet, A., Hébert, B., Briault, S., Ranchon-Cole, I., & Perche, O. (2021). Dietary Supplement Enriched in Antioxidants and Omega-3 Promotes Glutamine Synthesis in Müller Cells: A Key Process against Oxidative Stress in Retina. Nutrients, 13(9), 3216. https://doi.org/10.3390/nu13093216