Article

Coeliac Disease in Elderly Patients: Value of Coeliac Lymphogram for Diagnosis

by
Fernando Fernández-Bañares
1,2,*,
Sergio Farrais
3,
Montserrat Planella
4,
Josefa Melero
5,
Natalia López-Palacios
6,
Santiago Vivas
7,
Luis Fernández-Salazar
8,
Ana Pilar Lanzarote
3,
Pablo Ruiz-Ramírez
1,2,
Marta Aguilar-Criado
5,
Judith Vidal
9,
Aureli Esquerda
10,
Cristina Serrano
11 and
Concepción Núñez
12
1
Department of Gastroenterology, Hospital Universitari Mutua Terrassa, 08221 Terrassa, Spain
2
Centro de Investigación Biomédica en Red de Enfermedades Hepáticas y Digestivas (CIBERehd), Instituto de Salud Carlos III, 28029 Madrid, Spain
3
Department of Gastroenterology, Hospital Fundación Jiménez Díaz, 28040 Madrid, Spain
4
Department of Gastroenterology, Hospital Universitari Arnau de Vilanova, 25198 Lleida, Spain
5
Department Immunology and Genetics, Hospital Universitario de Badajoz, 06080 Badajoz, Spain
6
Department of Gastroenterology, Hospital Clínico San Carlos, IdISSC, 28040 Madrid, Spain
7
Department of Gastroenterology, Complejo Asistencial Universitario de León, 24071 León, Spain
8
Department of Gastroenterology, Hospital Clínico Universitario de Valladolid, Gerencia Regional de Salud (SACYL), Facultad de Medicina, Universidad de Valladolid, 47002 Valladolid, Spain
9
Department of Flow Cytometry, CATLAB, 08232 Viladecavalls, Spain
10
Department of Clinical Laboratory, Hospital Universitari Arnau de Vilanova, 25198 Lleida, Spain
11
Department of Clinical Immunology, Hospital Fundación Jiménez Díaz, 28040 Madrid, Spain
12
Laboratorio de Investigación en Genética de Enfermedades Complejas, Hospital Clínico San Carlos, Instituto de Investigación Sanitaria Hospital Clínico San Carlos (IdISSC), 28040 Madrid, Spain
*
Author to whom correspondence should be addressed.
Nutrients 2021, 13(9), 2984; https://doi.org/10.3390/nu13092984
Submission received: 9 July 2021 / Revised: 12 August 2021 / Accepted: 25 August 2021 / Published: 27 August 2021
(This article belongs to the Section Prebiotics and Probiotics)

Abstract

:
(1) Background: Although a meta-analysis reported that the sensitivity of CD3+ TCRγδ+ cells for coeliac disease diagnosis was >93%, a recent study has suggested that sensitivity decreased to 65% in elderly patients. (2) Aim: To evaluate whether the sensitivity of intraepithelial lymphocyte cytometric patterns for coeliac disease diagnosis changes with advanced age. (3) Methods: We performed a multicentre study including 127 coeliac disease patients ≥ 50 years: 87 with baseline cytometry (45 aged 50–59 years; 23 aged 60–69 years; 19 aged ≥ 70 years), 16 also with a follow-up cytometry (on a gluten-free diet); and 40 with only follow-up cytometry. (4) Results: In Marsh 3 patients, a sensitivity of 94.7%, 88.9% and 86.7% was observed for each age group using a cut-off value of TCRγδ+ >10% (p = 0.27); and a sensitivity of 84.2%, 83.4% and 53.3% for a cut-off value >14% (p = 0.02; 50–69 vs. ≥70 years), with difference between applying a cut-off of 10% or 14% (p = 0.008). The TCRγδ+ count in the ≥70 years group was lower than in the other groups (p = 0.014). (5) Conclusion: In coeliac patients ≥ 70 years, the TCRγδ+ count decreases and the cut-off point of >10% is more accurate than >14%.

1. Introduction

Coeliac disease (CD) is a common disorder affecting more than 1% of the population in the world [1]. Serologic screening allows the detection of individuals with atypical or subtle symptoms, and even asymptomatic cases [1]. The condition is often assumed to principally affect children and young adults, but it also occurs in elderly people [2,3,4,5,6]. Approximately a quarter of all diagnoses are now made at the age of 60 years or more, and a fifth at 65 years or over [5]. There is some evidence that elderly people with newly detected CD are more often seronegative than younger people [7,8] and that they have greater heterogeneity in clinical presentation, often being misdiagnosed with IBS several years prior to CD diagnosis [6]. Likewise, symptoms of anaemia or weight loss may prompt a malignancy diagnostic work-up prior to considering CD. A low index of suspicion by a physician may lead to diagnostic delay, mainly in seronegative cases [6,8]. However, studies support a rise in the number of CD diagnoses made in advanced aged individuals despite the large aged-based variations in prevalence [3,5], probably due to an increased awareness that this condition may occur in elderly people.
Immunological studies assessing intraepithelial lymphocyte (IEL) subpopulations by flow cytometry in fresh mucosal duodenal samples have described a coeliac intraepithelial lymphogram, defined as an increase in CD3+ T-cell receptor gamma-delta+ (TCRγδ+) IELs plus a concomitant decrease in CD3− IELs, which is highly accurate for CD diagnosis [9,10]. A 2019 meta-analysis showed that the sensitivity of either an increase in TCRγδ+ cells or the presence of the coeliac lymphogram for CD diagnosis was >93% [11]. We have demonstrated the usefulness of this tool for the diagnosis of CD in seronegative villous atrophy [12]. Accordingly, TCRγδ+ IEL count assessed by flow cytometry has been advocated as a new and accurate diagnostic tool for doubtful CD cases, irrespective of the degree of mucosal damage, sex and age [13]. However, in the aforementioned study, the number of CD patients older than 61 was very small, which precluded drawing conclusions regarding elderly people. In fact, a recent study has suggested that the sensitivity of this assay decreased to 65% in a series of patients with a median age of 53 [14]. Using a cut-off of ≥14% for TCRγδ+ cells, these authors showed that CD patients with normal TCRγδ+ IEL percentages were significantly older compared with those with increased TCRγδ+ IEL counts. Specificity, in contrast, was very high regardless of age [11,14].
The recent European Society for the Study of Coeliac Disease (ESsCD) guidelines for CD stated, in the areas of uncertainty and future research, that further studies are needed to validate T cell flow cytometry and make it widely available for clinical use [1]. Thus, the aim of this study was to confirm whether the sensitivity of the flow cytometry IELs pattern for CD diagnosis changes with advanced age and to assess the best diagnostic cut-off for TCRγδ+ cells in elderly people. In addition, we aimed to assess whether the long-term persistence of CD IEL cytometric patterns after a gluten-free diet (GFD) depends on age at onset.

2. Materials and Methods

2.1. Study Design

This was a retrospective multicentre study searching the CD registries of the seven participating tertiary centres for patients diagnosed with CD who met the following inclusion criteria: (1) age at diagnosis ≥ 50 years, and (2) IELs pattern determined by flow cytometry at baseline (while on a normal gluten-containing diet).
CD diagnosis was based on the presence of positive serology (either IgA anti-tissue transglutaminase -tTG- or IgA anti-endomysium antibodies -EmA-; IgG anti-tTG antibodies were used in case of selective IgA deficiency), Marsh 1 or Marsh 3 histological damage, and a clinical and serological remission after a GFD [1]. Seronegative Marsh 3 patients were diagnosed with CD based on the presence of both a coeliac pattern on IEL flow cytometry and a clinical and histological response to GFD [12,15]. Demographic data, clinical presentation, concomitant diseases, coeliac genetics (HLA-DQ2.5/DQ2.2/DQ8), duodenal histology, TCRγδ+ and CD3− IEL percentage, and clinical and histological response to GFD were recorded for all included patients. All study data were collected and managed using REDCap electronic data capture tools hosted at the Instituto de Investigación Sanitaria Hospital Clínico San Carlos (IdISSC), Madrid, Spain. When flow cytometry and histology data were available after a follow-up biopsy, they were also recorded.

2.2. Ethical Issues

The protocol study was approved by the Ethical and Research Committees of the participating centres and the study was conducted in accordance with the Declaration of Helsinki. Retrospective data were coded, and the centres’ corresponding Ethical Committees confirmed that, given the retrospective nature of the non-interventional medical record review, the need to request consent from patients was exempted. Researchers guaranteed strict measures for preserving patient confidentiality.

2.3. Flow Cytometry Analysis

For IEL flow cytometry, one single duodenal biopsy from the second portion of the duodenum was obtained and processed immediately as previously described [13]. The results of the flow cytometry were obtained in the four hours following sample collection, which was always before pathology diagnosis. All centres used similar gating strategies to select both CD3− and TCRγδ+ cells, which were measured as CD45 + CD103 + CD3− and CD45 + CD103 + TCRγδ+, respectively, over the total of CD45 + CD103+ cells. We performed comparative studies in parallel on samples from different hospitals and concordance for both CD3− and TCRγδ+ cells was almost 100% in terms of absolute percentages (see Appendix A).
Different cut-offs were used in the different participating centres, ranging from >8.5 to 12%, in most of them >10%, for TCRγδ+ and <10% for CD3− cells, which entails slight variations in sensitivity and specificity between them, i.e., the lower the cut-off the higher the sensitivity, and vice versa. Some centres consider specificity, and others sensitivity, to be more important. The meta-analysis of the published studies using these cut-offs showed a pooled sensitivity and specificity of 95% [11]. Recently, using TCRγδ+ > 10% and CD3− < 10%, we showed 87% of sensitivity and 97% of specificity for seronegative CD [12]. Therefore, we preferred to use the quantitative individual values and interpret them with a single cut-off value that allows for high specificity, thereby maintaining good sensitivity. In the present study, we compare the sensitivity of a cut-off for TCRγδ+ cells of either >10% or >14% (used in the study by Nijeboer et al. [14]) for CD diagnosis. Coeliac lymphogram was then defined as an increase in TCRγδ+ cells according to each cut-off plus a concomitant decrease in CD3− cells <10%. There were four IEL patterns: a normal pattern, an isolated decrease in CD3−, an isolated increase in TCRγδ+ and the coeliac lymphogram (an increase in TCRγδ+ plus a decrease in CD3−) [13]. The last two patterns are associated with CD.

2.4. Coeliac Serology

Serum IgA tTG (or IgG tTG in IgA deficient patients) was analysed using homologated commercial quantitative automated ELISAs while the patients were on a gluten-containing diet. Depending on the centre, EliA Celikey IgA (Thermo Fisher, Phadia AB, Uppsala, Sweden), Aeskulisa tTg-A (Aesku.Diagnostics, Wendelsheim, Germany) or Bioplex 2200 Celiac IgA (BioRad, Hercules, CA, USA) were used. Serum EmA was tested by an IF assay at dilution 1:5 in commercial sections of primate distal oesophagus as the antigen substrate (Immco Diagnostics, Buffalo, NY, USA) to confirm a positive result in all samples analysed with the Aeskulisa tTg-A kit. In the remaining centres, EmA was tested in patients with either borderline anti-tTG titres or detectable anti-tTG titres, but below the cut-off suggested by the manufacturer.

2.5. Histological Studies

Two endoscopic biopsies from the bulb and four from the second portion of the duodenum were obtained in separate vials for standard histological studies. Duodenal samples were processed using haematoxylin/eosin staining and CD3 immunophenotyping and were evaluated blind to the results of flow cytometry. Marsh 1 was considered as an IEL count of >25 IELs per 100 epithelial nuclei and normal villous architecture [13].

2.6. Statistical Analysis

Results are expressed as mean ± SD, median and the interquartile range (IQR) or as percentages. Chi-square statistics were used to compare qualitative variables and the Kruskal–Wallis test was used to compare quantitative variables. McNemar’s test was used to compare the CD diagnosis sensitivity of the two TCRγδ+ cut-offs. Statistical analysis was conducted using the SPSS for Windows statistical package (SPSS Inc., Chicago, IL, USA) and MedCalc statistical software, version 18.2.1 (MedCalc Software bvba, Ostend, Belgium).

3. Results

3.1. Patients

A total of 127 patients were included (age, 60.7 ± 9.3 years; 79.5% women), 83.3% of whom were HLA-DQ2.5+ and 95.2% had positive coeliac serology. A total of six patients had seronegative CD with villous atrophy.
A total of 87 patients had a baseline flow cytometry assay (16 showing Marsh 1 and 71 Marsh 3) and were divided into three age groups: 45 patients of 50–59 years (mean age, 54.1 ± 2.8 years); 23 of 60–69 years (mean age, 64.6 ± 3.0 years); and 19 ≥70 years (mean age, 75.8 ± 4.7 years). A total of 16 of these patients also had a follow-up cytometry (on a GFD). A total of 40 additional patients only had a follow-up flow cytometry assay on a GFD (with four showing Marsh 1 and thirty-six Marsh 3 at diagnosis). Median follow-up time for these 56 patients with a follow-up biopsy was of 2 years (IQR, 1.25 to 6). Of patients, 26.5% had persistent villous atrophy despite being in clinical and serological remission after a GFD.

3.2. Clinical Phenotype

We compared the clinical phenotype at presentation between the different age groups in 123 patients (four patients were excluded from this analysis due to lack of data). We categorised the clinical presentation of CD as either malabsorption or non-malabsorption features, regardless of “classical” or “non-classical” nomenclature as previously suggested [3] (Table 1). The proportion of patients presenting with at least one malabsorption feature was 70%. Diarrhoea and iron deficiency anaemia were the most commonly presented malabsorption features. There was a trend to a higher prevalence of IBS-type and dyspepsia symptoms in the youngest age group (p = 0.054, 50–59 vs. ≥70 years). There were no significant differences in the remaining features between age groups. In addition, there were no differences in the clinical presentation that guide CD suspicion and diagnosis (Supplementary Figure S1).

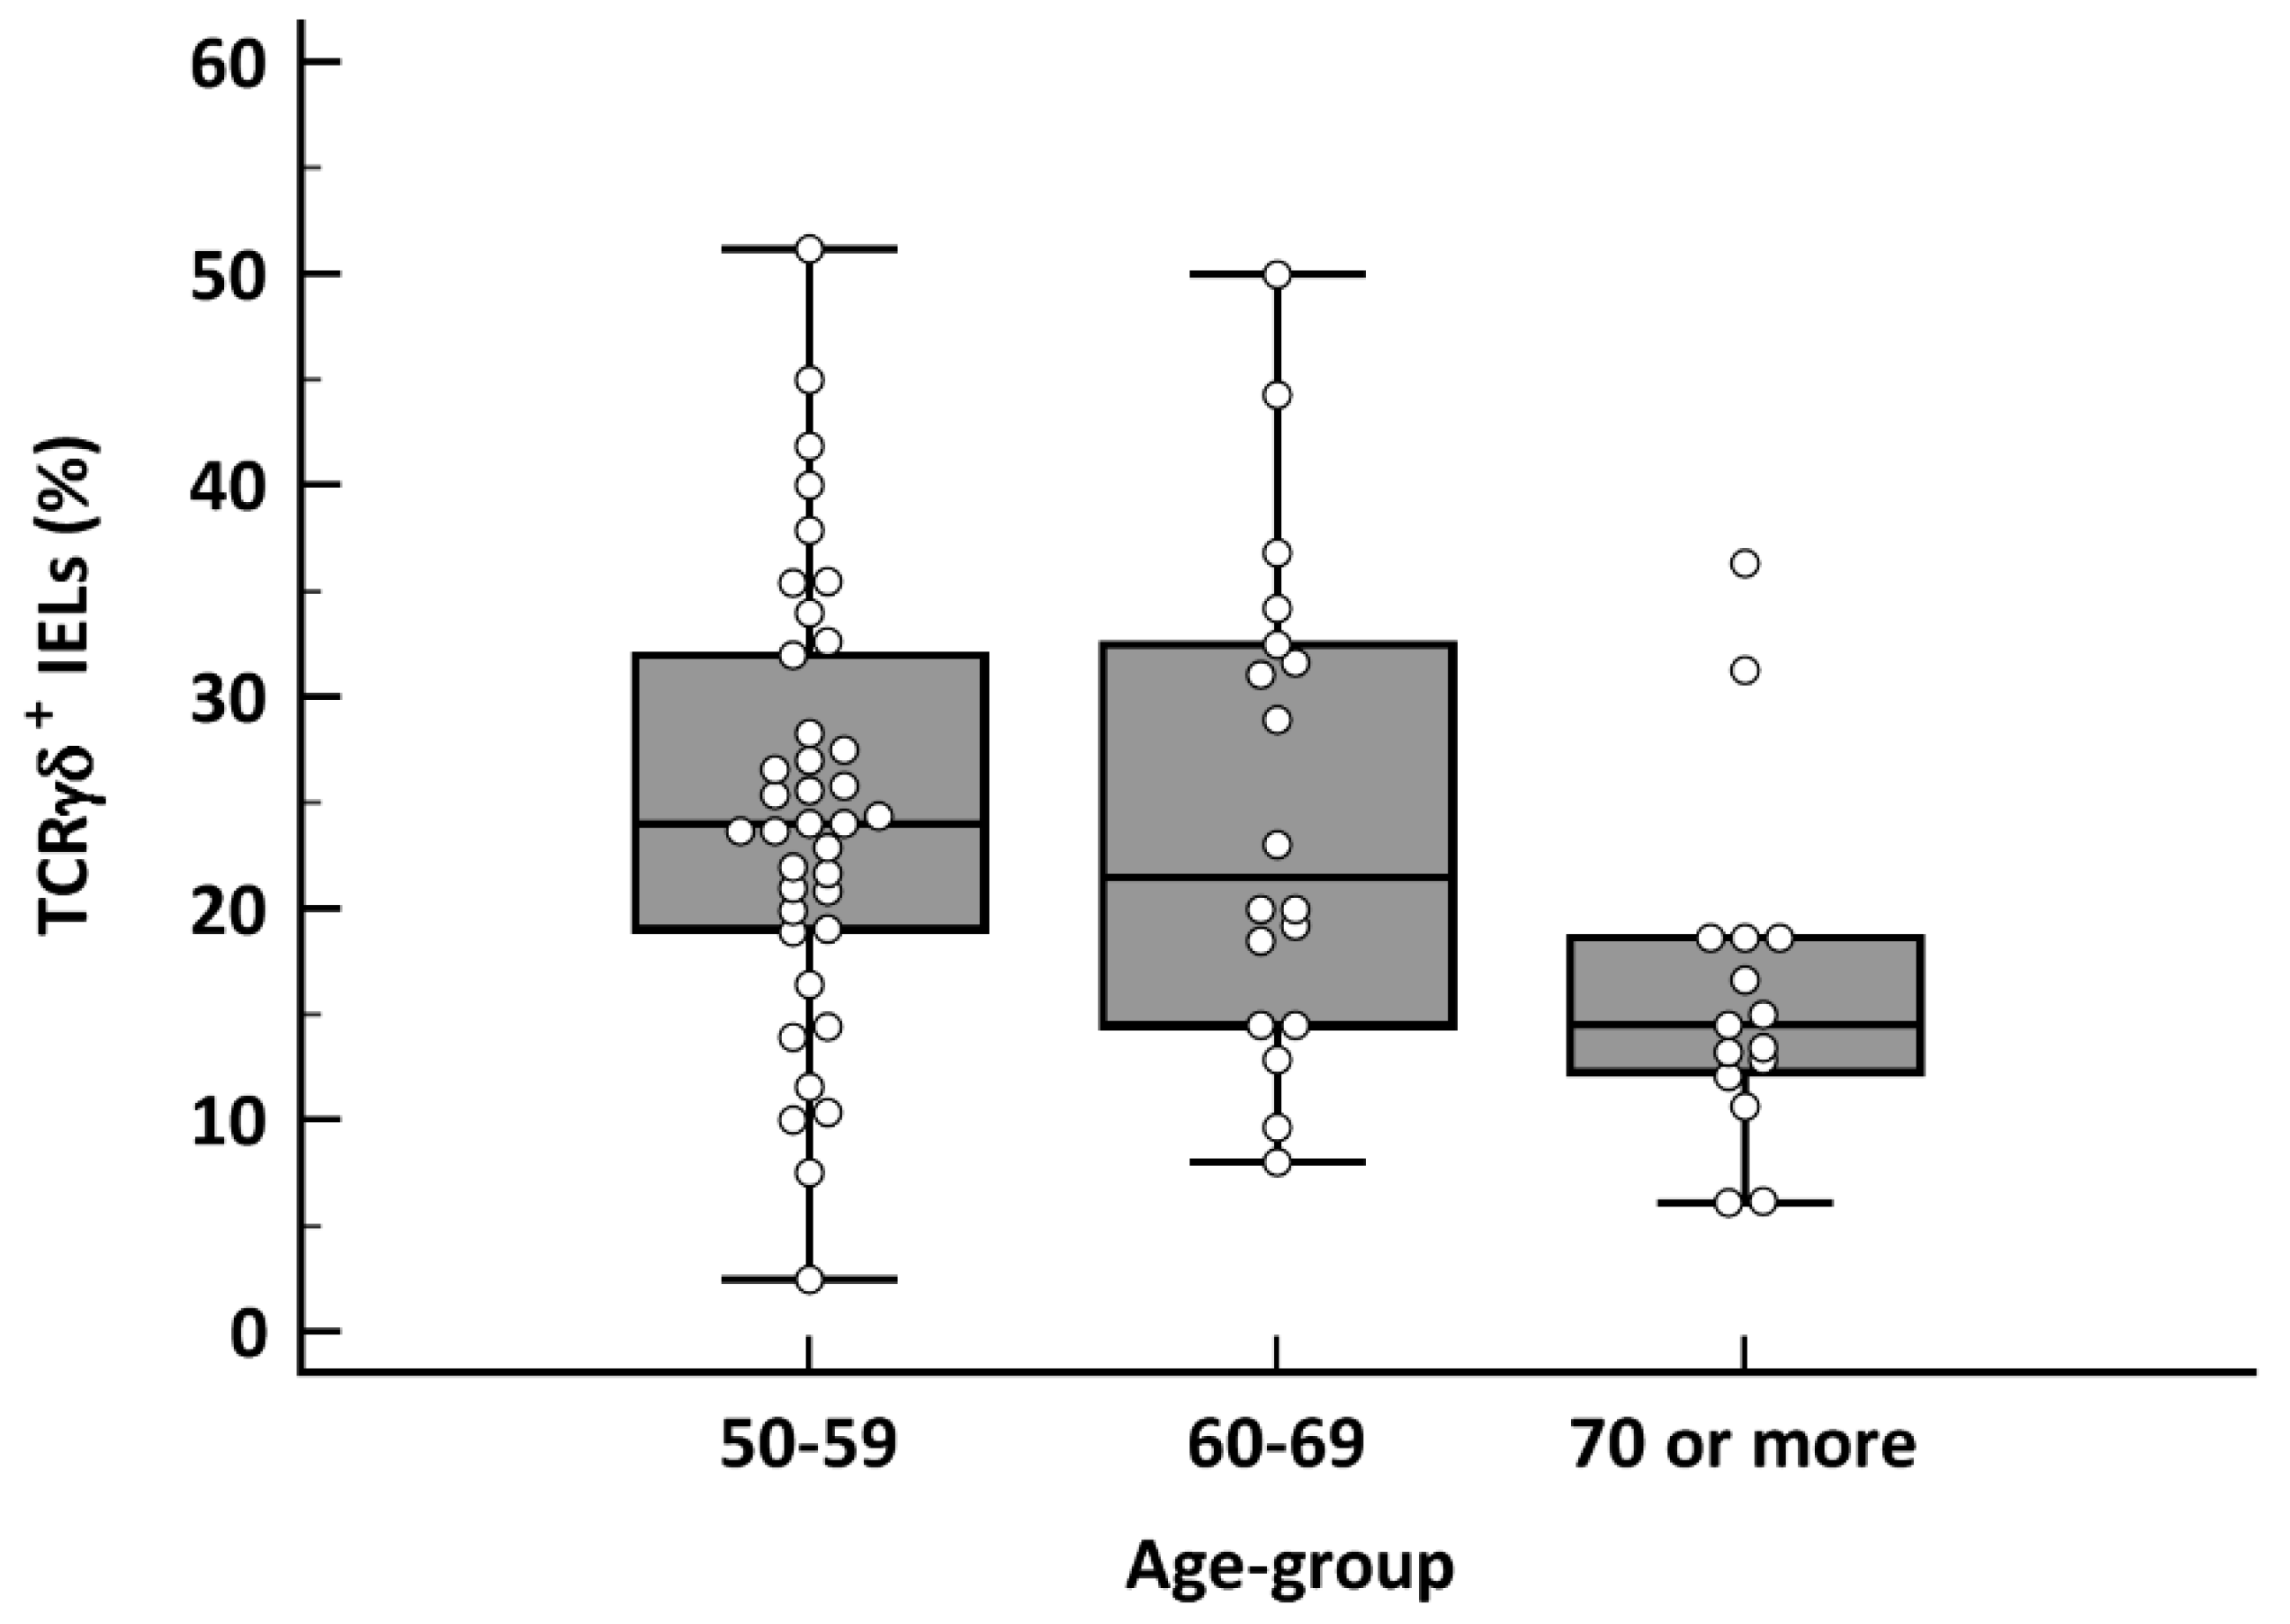
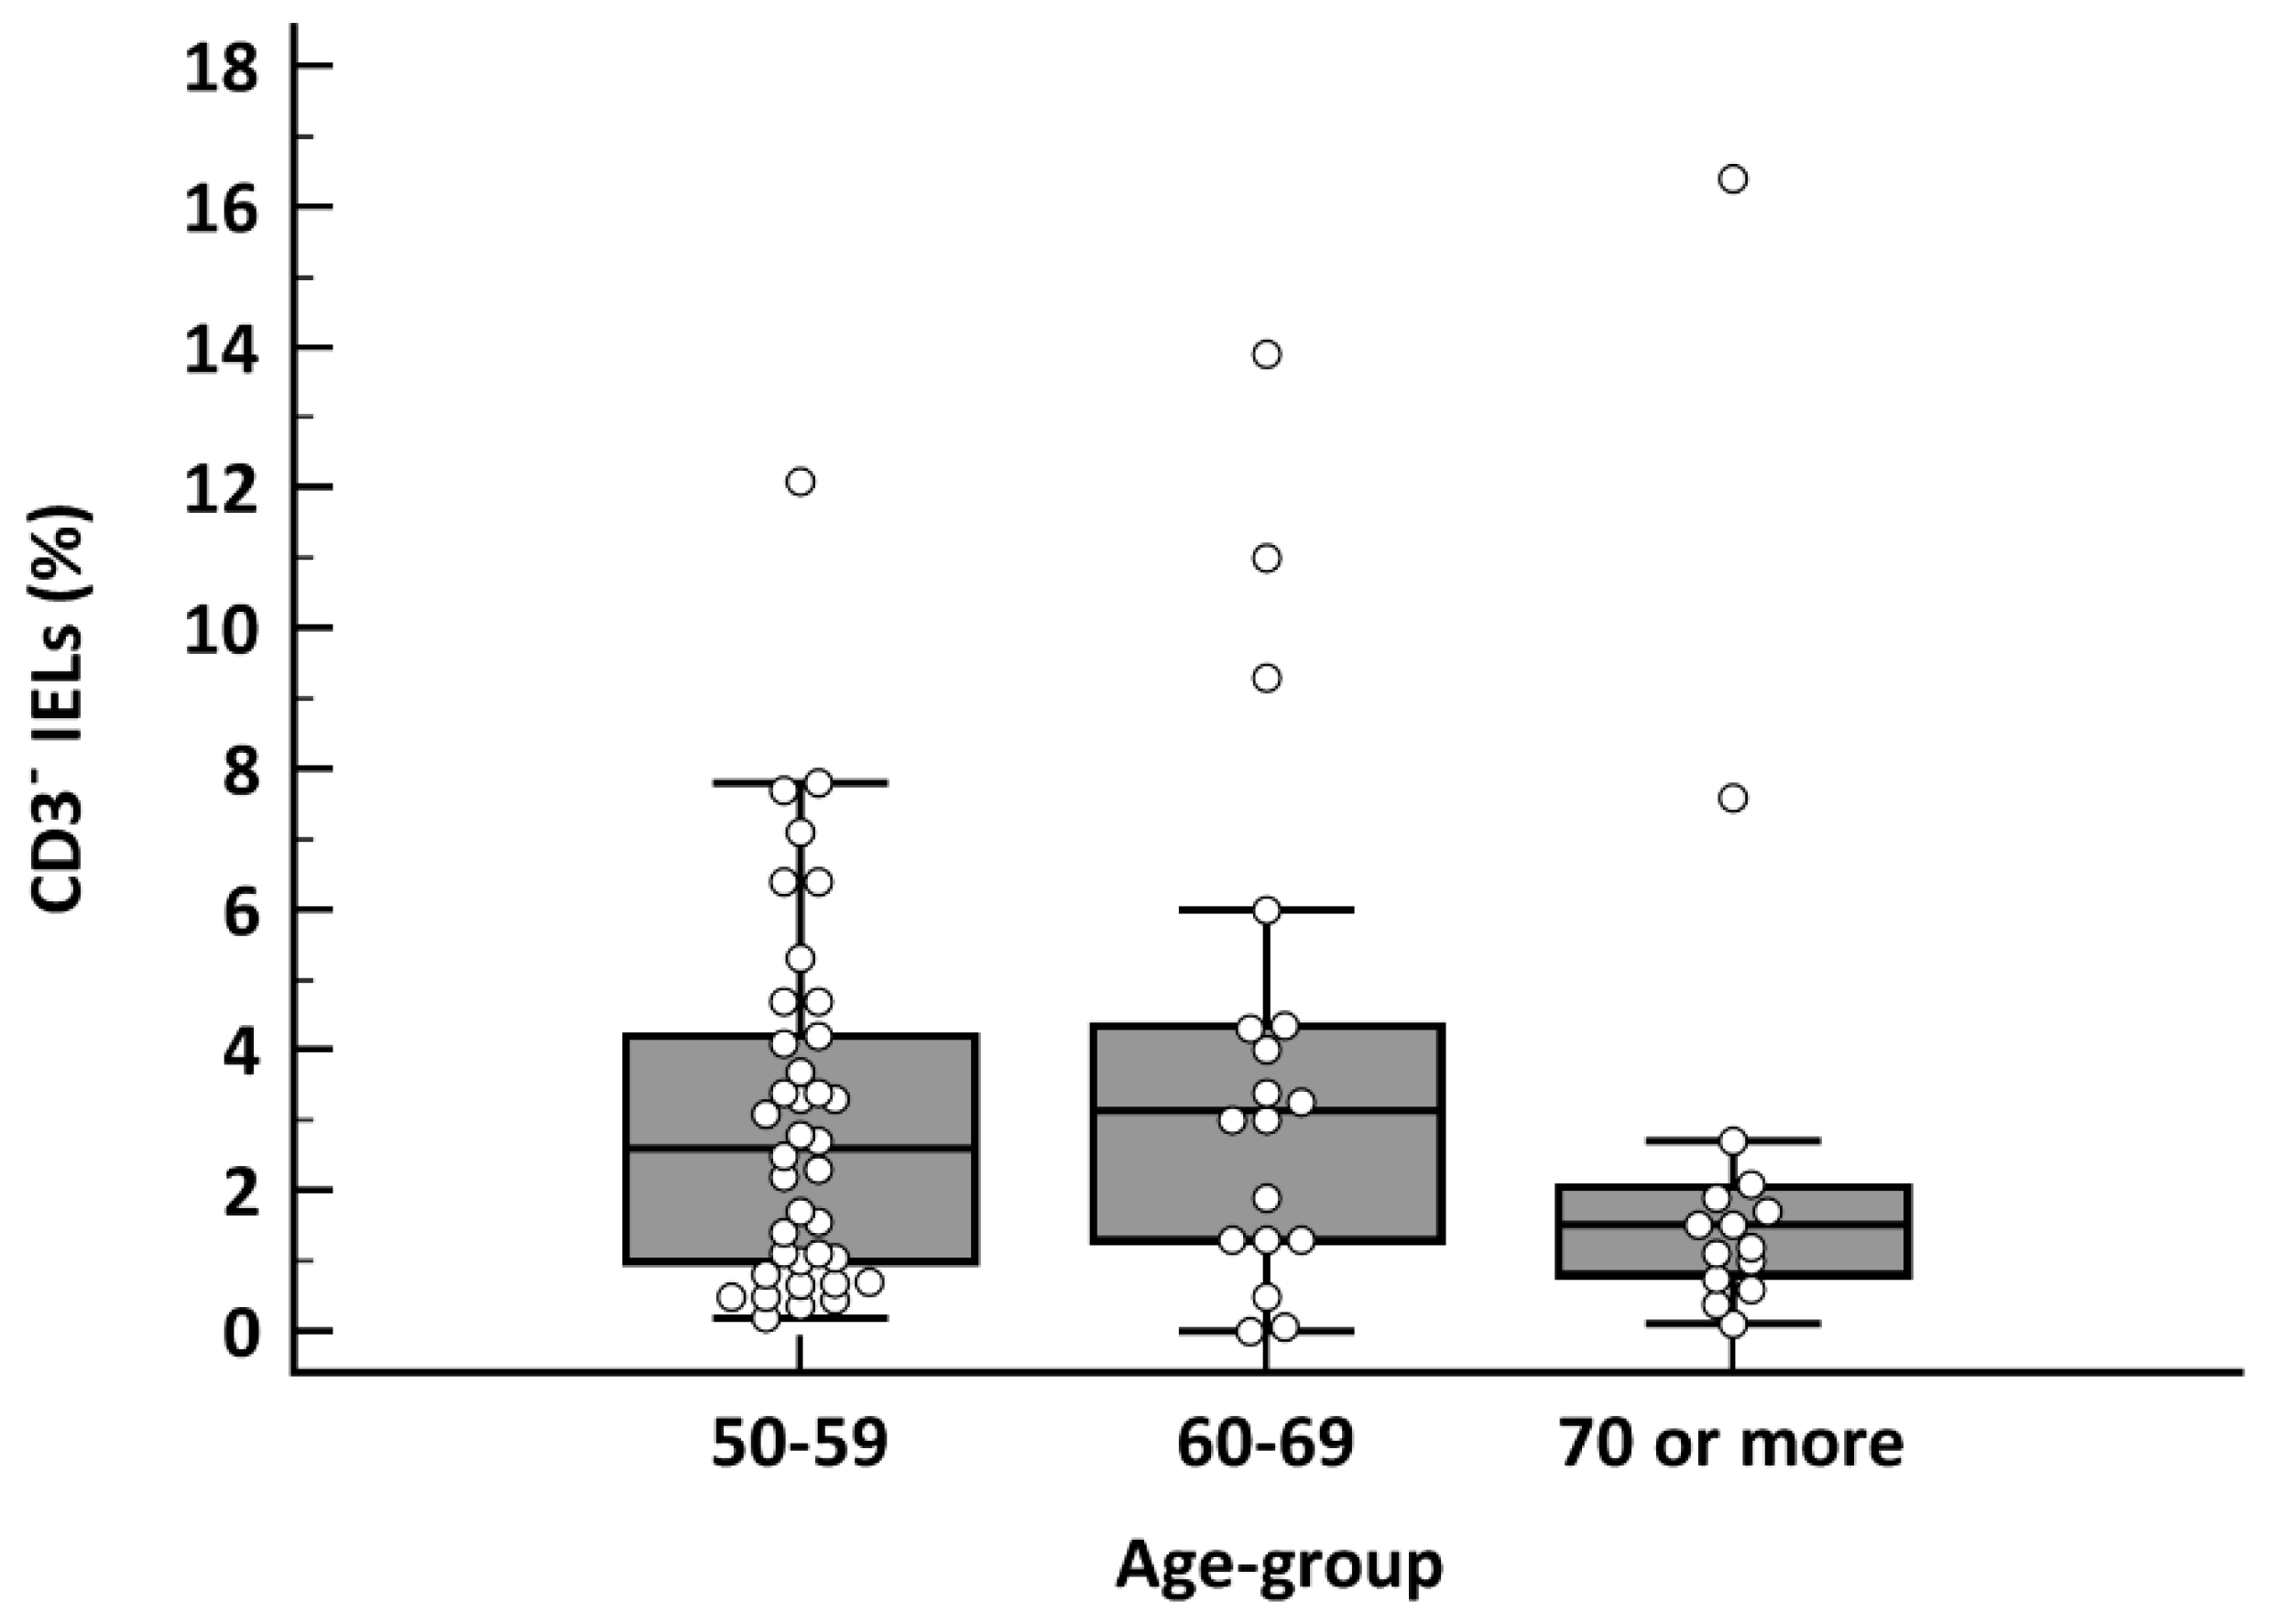
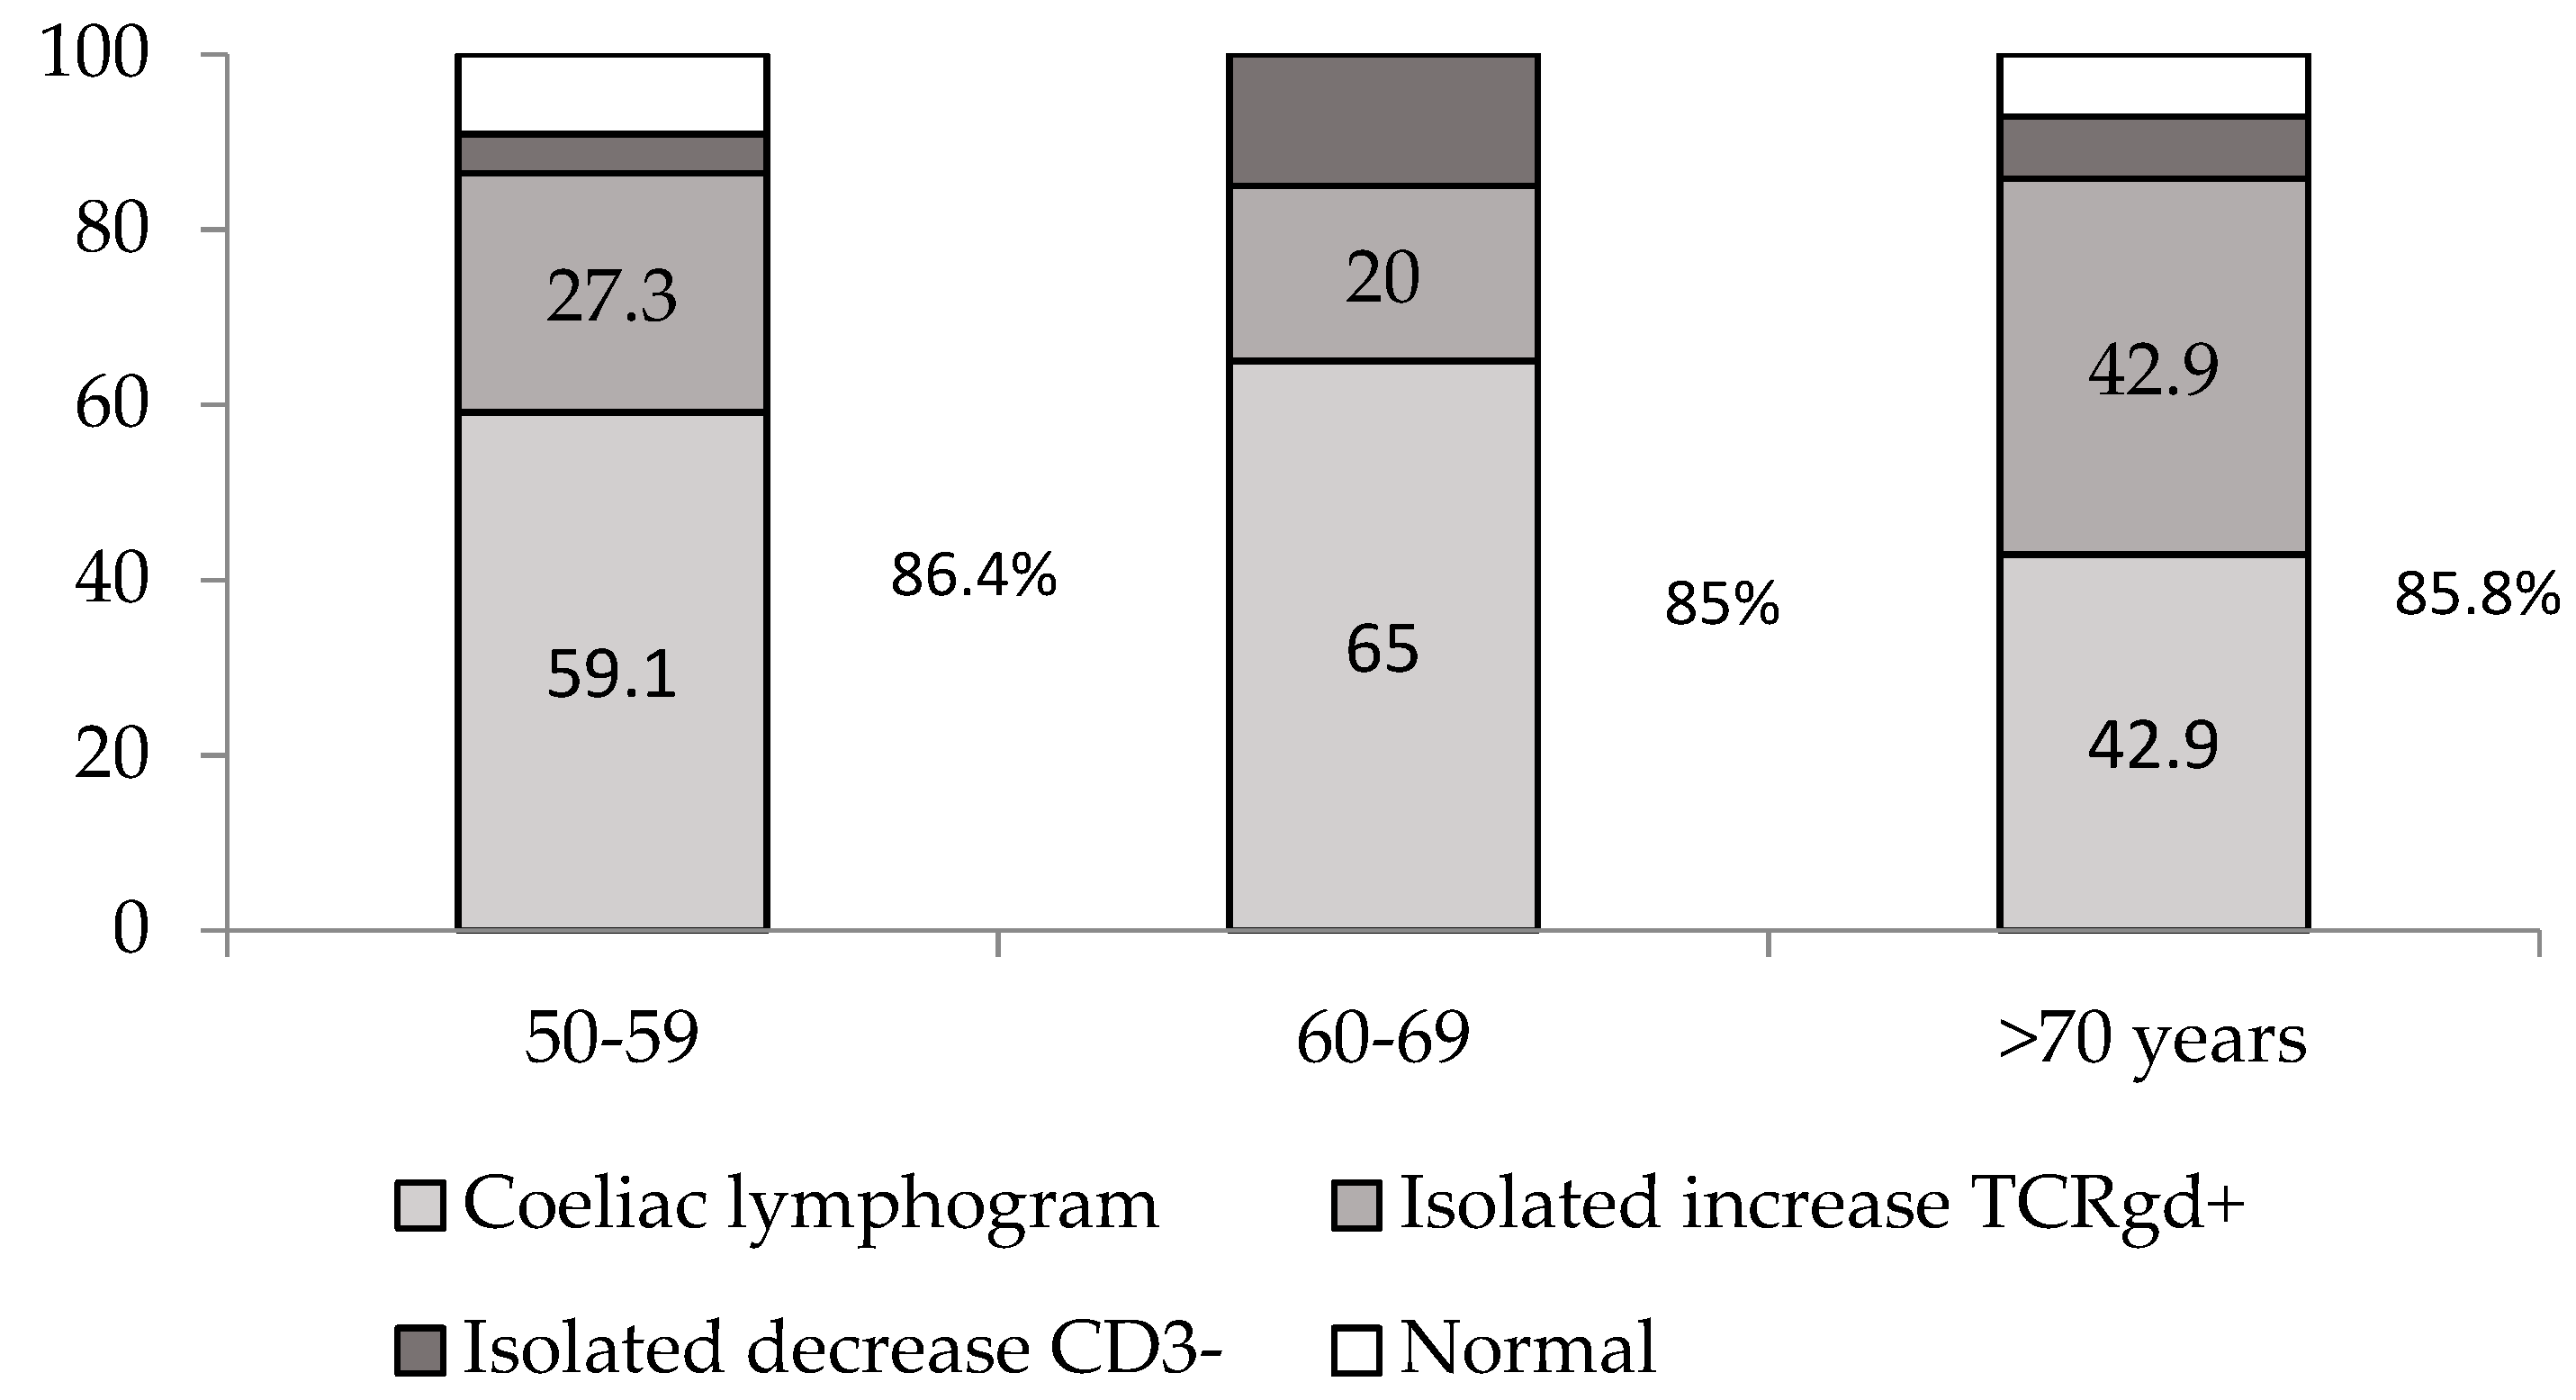
3.3. Flow Cytometry Pattern at Diagnosis

In patients with villous atrophy (n = 71), a cut-off of TCRγδ+ >10% in the baseline flow cytometry had a sensitivity for CD diagnosis of 94.7%, 88.9% and 86.7% for each age group (p = 0.27) (Table 2). In the case of TCRγδ+ >14%, sensitivity was 84.2%, 83.4% and 53.3% (50–69 vs. ≥70 years: p = 0.02) (Table 2). These results were similar when considering the coeliac lymphogram. Statistically significant differences were found when comparing the sensitivities observed with the two cut-offs (p = 0.008). The TCRγδ+ IEL count in the ≥70 years group was significantly lower than in the other age groups (p = 0.009) (Figure 1). There were no differences in the CD3− cell count (p = 0.25) (Figure 2).
In patients with Marsh 1 type damage (n = 16), a cut-off of TCRγδ+ >10% showed a sensitivity of 85.7%, 100% and 75% for each age group (p = 0.16), whereas for a >14% cut-off sensitivity was 71.4%, 80% and 75%, respectively (p = 0.44). Overall, a TCRγδ+ >10% cut-off had a sensitivity of 86.9%, and a TCRγδ+ >14% cut-off had a sensitivity of 75.5% (p = 0.13) (Table 3).

3.4. Flow Cytometry Pattern at Follow-Up

As mentioned, 56 patients were included in this analysis. In total, 86% of them maintained an increase in TCRγδ+ >10% after a median of two years on a GFD, with no differences between the age groups (86.4%, 85% and 85.8%) (Figure 3). There were no significant differences between patients with villous atrophy persistence and those with mucosal recovery.

4. Discussion

The results of the present study confirm that the increase in TCRγδ+ cells count at diagnosis is lower in CD patients aged 70 years and over than in younger patients. This was observed clearly in patients with a Marsh 3 lesion at diagnosis; for Marsh 1 patients, the small number of patients in each age group precludes the possibility of drawing robust conclusions. Therefore, the diagnostic cut-off for TCRγδ+ >10% is more appropriate for this age group than >14%, which was the cut-off used in the Nijeboer et al. study [14]. In that study, a >14% cut-off was associated with a sensitivity of 65%, which is lower than that previously described [11]. As mentioned above, the cut-off used for TCRγδ+ cells count may vary between different laboratories, depending on whether specificity or sensitivity is considered to be more important. In general, this produces slight variations but does not change the non-coeliac/coeliac classification of the IEL pattern in young people. However, as is shown in the present study, that is not the case in patients aged 70 years and over. Notwithstanding, CD diagnosis sensitivity when using a >10% cut-off remains very high, being 87% in the ≥70 years group and 90% in the overall group. We have not evaluated the test specificity in the present study since it was very high regardless of age in previous studies [11,13,14]. We have also shown the high diagnosis accuracy of this test for CD in seronegative villous atrophy of different aetiologies [12].
Over the past years, it has been shown that CD may start at any age and that it may present with subtle and variable clinical expressions. The pattern of clinical presentation in our study was not different in patients ≥70 years to that of adults aged 50 to 69 years. The development of gastrointestinal symptoms such as diarrhoea, abdominal pain and distension was the most common presentation that led to the diagnosis. Often, these symptoms were compatible with a functional bowel disease such as IBS or functional dyspepsia. Likewise, iron-deficient anaemia was frequently the guide manifestation for CD diagnosis. In studies comparing the clinical presentation in elderly patients and young adults, elderly patients presented with significantly fewer symptoms in some studies [3], though others have described a similar clinical presentation [16,17]. In our study, the frequency of a GI clinical presentation in the form of diarrhoea, IBS-like symptoms, dyspepsia and/or bloating was similar to the frequency reported in the aforementioned studies [16,17].
Although the analysis of coeliac lymphogram is not needed for CD diagnosis in seropositive patients, it may have high diagnostic value in doubtful cases that involve differentiating between CD and non-CD atrophy, those in which the mucosal lesion is equivocal or when serum tTG levels are negative or with low titres [13]. In addition, it has been shown that TCRγδ+ IELs remain elevated in CD patients despite a GFD [11]. The persistence of increased TCRγδ+ cell values after a long-term GFD opens the possibility of using this biomarker to confirm CD in patients who have started on a GFD, and for whom serology and histology yield misleading results. In addition, it may prove useful for distinguishing between CD and non-coeliac gluten sensitivity in patients who are symptom-free after a GFD and reluctant to undergo a gluten challenge. The results of the present study show that the long-term persistence of CD IEL cytometric patterns after a GFD is independent of age at onset. In fact, 86% of patients maintained an increase in TCRγδ+ IELs >10% after a median of two years of follow-up, which is in line with previous studies [11]. This is the only existing test capable of reliably diagnosing CD in the presence of gluten withdrawal, non-atrophic enteropathy and negative serology.
Remarkably, although their presence has been described for a number of years, the role of intestinal TCRγδ+ subsets in the pathogenesis of CD is not completely understood. It has been suggested that these cells play roles in regulation and repair within the small intestine [18,19,20,21]. They also have a number of properties that distinguish them from conventional T cells. These include the ability to secrete epithelial growth factors and to produce innate cytokines and chemokines that recruit inflammatory cells [18,20]. Furthermore, they may play an essential role in promoting epithelial restitution following mucosal injury. In this sense, it has been suggested that intestinal TCRγδ+ IELs play a multifaceted role in maintaining mucosal homeostasis following injury, and that there is a dynamic and reciprocal crosstalk between the intestinal microbiota and TCRγδ+ T cells [21], thus acting as the front-line defence system against some antigens [22]. It has also been suggested that distinct subsets of TCRγδ+ IELs can accumulate during the various stages of CD [23]. In the gut of active CD patients, effector TCRγδ+ IELs may predominate, in conjunction with an increased production of IL-15 and IL-21. In contrast, when gluten is withdrawn from the diet and IL-15 and IL-21 levels diminish, TCRγδ+ IELs may become regulatory via the production of the immunosuppressive cytokine TGF-β1 and may therefore contribute to recovery from gluten-driven epithelial damage [24,25]. This could explain why TCRγδ+ IELs remain elevated in the coeliac gut long after the removal of gluten from the diet and the resolution of intestinal damage [19,25].

5. Conclusions

In conclusion, the TCRγδ+ IELs count decreases in CD patients ≥70 years, with a TCRγδ+ cut-off >10% being more accurate than >14% for CD diagnosis (sensitivity, 87% vs. 53%). TCRγδ+ IELs remain elevated in the long term despite a GFD. Therefore, the TCRγδ+ IELs count may be of diagnostic use in those cases where diagnosis is not straightforward, regardless of age.

Supplementary Materials

The following are available online at https://www.mdpi.com/article/10.3390/nu13092984/s1, Supplementary Figure S1: Clinical presentations that guide CD suspicion and diagnosis. IDA: iron-deficiency anaemia.

Author Contributions

Conceptualization, F.F.-B. and C.N.; methodology, F.F.-B. and C.N.; acquisition and interpretation of data, F.F.-B., S.F., M.P., J.M., N.L.-P., S.V., L.F.-S., A.P.L., P.R.-R., M.A.-C., J.V., A.E., C.S. and C.N.; formal analysis, F.F.-B.; writing—original draft preparation, F.F.-B. and C.N.; writing—review and editing, all authors. All authors have read and agreed to the published version of the manuscript.

Funding

C.N. has received a grant from Instituto de Salud Carlos III (ISCIII), Madrid, Spain (PI18/0089)-Fondo Europeo de Desarrollo Regional (FEDER).

Institutional Review Board Statement

The study was conducted according to the guidelines of the Declaration of Helsinki and approved by the Ethics Committee of Hospital Clínico San Carlos, Madrid, Spain (C.P-C.I. 18/146-E-BS, approved on the 10 April 2018).

Informed Consent Statement

Retrospective data were coded, and the centres’ corresponding Ethical Committees confirmed that, given the retrospective nature of the non-interventional medical record review, the need to request consent from patients was exempted. Researchers guaranteed strict measures for preserving patient confidentiality.

Data Availability Statement

The datasets generated and/or analysed during the current study are available from the corresponding author on reasonable request.

Acknowledgments

The ‘Centro de Investigación Biomédica en Red de Enfermedades Hepáticas y Digestivas’ (CIBERehd) is an initiative of the Instituto de Salud Carlos III, Madrid, Spain. This institution played no role in study design, acquisition or analysis, nor in the interpretation of the data or the report writing. We appreciate the technical support of the Unidad de Citometría de Flujo (UCIF) of the IdISSC.

Conflicts of Interest

The authors declare no conflict of interest.

Appendix A. Concordance in Intraepithelial Lymphocyte Analysis between Different Cytometres and Centres

In all the participating centres, development and fine-tuning of the methodology to analyse intraepithelial lymphocytes (IELs) by flow cytometry was performed following the indications of the pioneer lab of this methodology in Spain (Dr Garbiñe Roy, Immunology Department of the Hospital Ramón y Cajal, Madrid, Spain; reference centre). In all cases, several samples were analysed in parallel to confirm proper performance.
Here we describe the comparison of the data obtained in parallel using two different flow cytometers and by one of the participating centres and the reference centre (raw data described in Table A1). A good grade of concordance between cytometers and centres was obtained, especially for TCRγδ+ and CD3− IELs, which are the two parameters with direct implication in CD diagnosis (Table A2, Table A3 and Table A4).
Table A1. Intraepithelial lymphocyte subpopulation data obtained using two different flow cytometers by one participating centre (CATLAB) and by the reference centre (Hospital Ramón y Cajal). Percentages are shown (over the total of CD45+ CD103+ cells).
SubjectBD FACSCalibur CATLABBD FACSCanto CATLABBD FACSCanto Hospital Ramón y Cajal
TCRγδ+CD3−TCRγδ+CD3−TCRγδ+CD3−
10.9415.881.415.3116.8
25.722.524.34.15.54.3
335.575.0332.16.2406.3
435.776.233.16.136.83.4
54.054.754.35.26.15.5
617.349.6414.61024.68.7
712.590.9812.61.0816.90.7
81.1740.441.240.41.249.5
95.2717.75.217.58.226.6
105.8623.035.824.66.831.4
116.5411.72711.29.313.3
1235.674.4935.56.738.85.4
131.9233.451.332.57.531.4
1416.947.416.58.127.50.7
1516.332.4516.32.228.71.5
Table A2. Comparison of the different lymphocyte subpopulation data obtained using BD FACSCalibur and BD FACSCanto in the same centre (CATLAB) (n = 15). Variable X shows data obtained with the BD FACSCanto cytometer and variable Y shows data obtained with the BD FACSCalibur cytometer.
CD3−TCRγδ+
Variable XVariable YVariable XVariable Y
Passing and Bablok regression
Lowest value1.080.981.20.94
Highest value40.440.4435.535.77
Arithmetic mean12.7412.3712.7413.445
Median8.17.476.54
SD11.5211.8211.9812.75
SE of the mean2.97513.05233.09433.2937
Regression Equationy = −0.617424 + 1.032197xy = −0.145981 + 1.035514x
Systematic differences
Intercept A−0.6174−0.146
95% CI−1.5254 to −0.07676−0.6255 to 0.08486
Proportional differences
Slope B1.03221.0355
95% CI0.9785 to 1.10190.9971 to 1.1182
Random differences
RSD0.64550.8313
±1.96 RSD Interval−1.2652 to 1.2652−1.6293 to 1.6293
Linear model validity
Cusum test for linearityp = 0.92p = 0.99
Spearman rank correlation coefficient
Correlation coefficient0.9750.969
Significance levelp < 0.0001p < 0.0001
95% CI0.924 to 0.9920.906 to 0.990
SD = standard deviation; SE = standard error; RSD = residual standard deviation; CI = confidence interval.
Table A3. Comparison of the different lymphocyte subpopulation data obtained in two different centres with different flow cytometers (n = 15). Variable X shows data obtained in the reference centre (Hospital Ramón y Cajal) with the BD FACSCanto cytometer and variable Y shows data obtained in CATLAB with the BD FACSCalibur cytometer.
CD3−TCRγδ+
Variable XVariable YVariable XVariable Y
Passing and Bablok regression
Lowest value0.70.9810.94
Highest value49.540.444035.77
Arithmetic mean13.712.3717.2613.44
Median6.37.49.36.54
SD14.5911.8214.1112.75
SE of the mean3.7683.05233.64363.2937
Regression Equationy = 1.271610 + 0.785593xy = −0.805921 + 0.796053x
Systematic differences
Intercept A1.2716−0.8059
95% CI−0.9053 to 3.4190−2.6434 to 0.9249
Proportional differences
Slope B0.78560.7961
95% CI0.6241 to 0.99910.6038 to 0.9875
Random differences
RSD2.52372.8749
±1.96 RSD Interval−4.9465 to 4.9465−5.6348 to 5.6348
Linear model validity
Cusum test for linearityp = 0.69p = 0.49
Spearman rank correlation coefficient
Correlation coefficient0.8770.925
Significance levelp < 0.0001p < 0.0001
95% CI0.661 to 0.9580.784 to 0.975
SD = standard deviation; SE = standard error; RSD = residual standard deviation; CI = confidence interval.
Table A4. Comparison of the different lymphocyte subpopulation data obtained in two different centres with the BD FACSCanto cytometer (n = 15). Variable X shows data obtained in the reference centre (Hospital Ramón y Cajal) and variable Y shows data obtained in CATLAB.
CD3−TCRγδ+
Variable XVariable YVariable XVariable Y
Passing and Bablok regression
Lowest value0.71.0811,2
Highest value49.540.44035.5
Arithmetic mean13.712.7417.2612.74
Median6.38.19.37
SD14.593511.522314.111511.9843
SE of the mean3.7682.97513.64363.0943
Regression Equationy = 1.212500 + 0.791667xy = −0.107611 + 0.764259x
Systematic differences
Intercept A1.2125−0.1076
95% CI−0.04449 to 3.0357−1.7135 to 0.8299
Proportional differences
Slope B0.79170.7643
95% CI0.6786 to 0.99120.5701 to 0.9369
Random differences
RSD2.36312.7141
±1.96 RSD Interval−4.6318 to 4.6318−5.3196 to 5.3196
Linear model validity
Cusum test for linearityp = 0.92p = 0.49
Spearman rank correlation coefficient
Correlation coefficient0.8870.935
Significance levelp < 0.0001p < 0.0001
95% CI0.688 to 0.9620.811 to 0.978
SD = standard deviation; SE = standard error; RSD = residual standard deviation; CI = confidence interval.

References

  1. Al-Toma, A.; Volta, U.; Auricchio, R.; Castillejo, G.; Sanders, D.S.; Cellier, C.; Mulder, C.J.; Lundin, K. European Society for the Study of Coeliac Disease (ESsCD) guideline for coeliac disease and other gluten-related disorders. United Eur. Gastroenterol. J. 2019, 7, 583–613. [Google Scholar] [CrossRef]
  2. Freeman, H.J. Adult celiac disease in the elderly. World J. Gastroenterol. 2008, 14, 6911–6914. [Google Scholar] [CrossRef] [Green Version]
  3. Shiha, M.G.; Marks, L.J.; Sanders, D.S. Diagnosing coeliac disease in the elderly: A United Kingdom cohort study. Gastroenterol. Hepatol. Bed. Bench 2020, 13, 37–43. [Google Scholar] [PubMed]
  4. Lerner, A.; Matthias, T. Increased Knowledge and Awareness of Celiac Disease will Benefit the Elderly. Int. J. Celiac Dis. 2015, 3, 112–114. [Google Scholar] [CrossRef] [Green Version]
  5. Collin, P.; Vilppula, A.; Luostarinen, L.; Holmes, G.K.T.; Kaukinen, K. Review article: Coeliac disease in later life must not be missed. Aliment. Pharmacol. Ther. 2018, 47, 563–572. [Google Scholar] [CrossRef] [PubMed] [Green Version]
  6. Gasbarrini, G.; Ciccocioppo, R.; De Vitis, I.; Corazza, G.R.; Club del Tenue Study Group. Coeliac Disease in the Elderly. A multicentre Italian study. Gerontology 2001, 47, 306–310. [Google Scholar] [CrossRef]
  7. Salmi, T.T.; Collin, P.; Korponay-Szabó, I.R.; Laurila, K.; Partanen, J.; Huhtala, H. Endomysial antibody-negative coeliac disease: Clinical characteristics and intestinal autoantibody deposits. Gut 2006, 55, 1746–1753. [Google Scholar] [CrossRef] [Green Version]
  8. Dahle, C.; Hagman, A.; Ignatova, S.; Ström, M. Antibodies against deamidated gliadin peptides identify adult coeliac disease patients negative for antibodies against endomysium and tissue transglutaminase. Aliment. Pharmacol. Ther. 2010, 32, 254–260. [Google Scholar] [CrossRef]
  9. Leon, F.; Eiras, P.; Roy, G.; Camarero, C. Intestinal intraepithelial lymphocytes and anti-transglutaminase in a screening algorithm for coeliac disease. Gut 2002, 50, 740–741. [Google Scholar] [CrossRef] [PubMed]
  10. Fernandez-Bañares, F.; Carrasco, A.; Garcia-Puig, R.; Rosinach, M.; González, C.; Alsina, M.; Loras, C.; Salas, A.; Viver, J.M.; Esteve, M. Intestinal Intraepithelial Lymphocyte Cytometric Pattern Is More Accurate than Subepithelial Deposits of Anti-Tissue Transglutaminase IgA for the Diagnosis of Celiac Disease in Lymphocytic Enteritis. PLoS ONE 2014, 9, e101249. [Google Scholar] [CrossRef] [Green Version]
  11. Fernández-Bañares, F.; Carrasco, A.; Martín, A.; Esteve, M. Systematic Review and Meta-Analysis: Accuracy of Both Gamma Delta+ Intraepithelial Lymphocytes and Coeliac Lymphogram Evaluated by Flow Cytometry for Coeliac Disease Diagnosis. Nutrients 2019, 11, 1992. [Google Scholar] [CrossRef] [PubMed] [Green Version]
  12. Fernández-Bañares, F.; Crespo, L.; Núñez, C.; López-Palacios, N.; Tristán, E.; Vivas, S.; Farrais, S.; Arau, B.; Vidal, J.; Roy, G.; et al. Gamma delta+ intraepithelial lymphocytes and coeliac lymphogram in a diagnostic approach to coeliac disease in patients with seronegative villous atrophy. Aliment. Pharmacol. Ther. 2020, 51, 699–705. [Google Scholar] [CrossRef] [Green Version]
  13. Ruiz-Ramírez, P.; Carreras, G.; Fajardo, I.; Tristán, E.; Carrasco, A.; Salvador, I.; Zabana, Y.; Andújar, X.; Ferrer, C.; Horta, D.; et al. Intraepithelial Lymphocyte Cytometric Pattern Is a Useful Diagnostic Tool for Coeliac Disease Diagnosis Irrespective of Degree of Mucosal Damage and Age—A Validation Cohort. Nutrients 2021, 13, 1684. [Google Scholar] [CrossRef]
  14. Nijeboer, P.; van Gils, T.; Reijm, M. Gamma-delta T lymphocytes in the diagnostic approach of coeliac disease. J. Clin. Gastroenterol. 2019, 53, e208–e213. [Google Scholar] [CrossRef]
  15. Fernández-Bañares, F.; Núñez, C.; Montoro, M.; Roy, G.; Esteve, M. Management of Small Bowel Villous Atrophy in Patients Seronegative for Celiac Disease: High Diagnostic Accuracy of Celiac Lymphogram. Am. J. Gastroenterol. 2020, 115, 2110. [Google Scholar] [CrossRef]
  16. Mukherjee, R.; Egbuna, I.; Brar, P.; Hernandez, L.; McMahon, D.J.; Shane, E.J.; Bhagat, G.; Green, H.R. Celiac disease: Similar presentations in the elderly and young adults. Dig. Dis. Sci. 2010, 55, 3147–3153. [Google Scholar] [CrossRef]
  17. Casella, S.; Zanini, B.; Lanzarotto, F.; Villanacci, V.; Ricci, C.; Lanzini, A. Celiac Disease in Elderly Adults: Clinical, Serological, and Histological Characteristics and the Effect of a Gluten-Free Diet. J. Am. Geriatr. Soc. 2012, 60, 1064–1069. [Google Scholar] [CrossRef]
  18. Chen, Y.; Chou, K.; Fuchs, E.; Havran, W.L.; Boismenu, R. Protection of the intestinal mucosa by intraepithelial γδ T cells. Proc. Natl. Acad. Sci. USA 2002, 99, 14338–14343. [Google Scholar] [CrossRef] [PubMed] [Green Version]
  19. Dunne, M.R.; Elliott, L.; Hussey, S.; Mahmud, N.; Kelly, J.; Doherty, D.; Feighery, C.F. Persistent Changes in Circulating and Intestinal γδ T Cell Subsets, Invariant Natural Killer T Cells and Mucosal-Associated Invariant T Cells in Children and Adults with Coeliac Disease. PLoS ONE 2013, 8, e76008. [Google Scholar] [CrossRef] [PubMed] [Green Version]
  20. Jameson, J.; Ugarte, K.; Chen, N.; Yachi, P.; Fuchs, E.; Boismenu, R.; Havran, W.L. A role for skin γδ T cells in wound repair. Science 2002, 296, 747–749. [Google Scholar] [CrossRef] [PubMed]
  21. Ismail, A.S.; Behrendt, C.L.; Hooper, L.V. Reciprocal interactions between commensal bacteria and gamma delta intraepithelial lymphocytes during mucosal injury. J. Immunol. 2009, 182, 3047–3054. [Google Scholar] [CrossRef] [PubMed]
  22. Ogata, M.; Itoh, T. Gamma/delta intraepithelial lymphocytes in the mouse small intestine. Anat. Sci. Int. 2016, 91, 301–312. [Google Scholar] [CrossRef] [PubMed]
  23. Sarra, M.; Cupi, M.L.; Monteleone, G.; Franzè, E.; Ronchetti, G.; Di Sabatino, A.; Gentileschi, P.; Franceschilli, L.; Sileri, P.; Sica, G.; et al. IL-15 positively regulates IL-21 production in celiac disease mucosa. Mucosal Immunol. 2013, 6, 244–255. [Google Scholar] [CrossRef]
  24. Bhagat, G.; Naiyer, A.J.; Shah, J.G.; Harper, J.; Jabri, B.; Wang, T.C.; Green, P.H.R.; Manavalan, J.S. Small intestinal CD8+TCRgammadelta+NKG2A+ intraepithelial lymphocytes have attributes of regulatory cells in patients with celiac disease. J. Clin. Investig. 2008, 118, 281–293. [Google Scholar] [CrossRef]
  25. Dunne, M.; Byrne, G.; Chirdo, F.G.; Feighery, C. Coeliac Disease Pathogenesis: The Uncertainties of a Well-Known Immune Mediated Disorder. Front. Immunol. 2020, 11, 1374. [Google Scholar] [CrossRef] [PubMed]
Figure 1. Box-plot chart of TCRγδ+ cells in CD patients with villous atrophy (n = 71), depending on the different age groups (p = 0.009; Kruskal–Wallis test).
Nutrients 13 02984 g001
Figure 2. Box-plot chart of CD3− cells in CD patients with villous atrophy (n = 71), depending on the different age groups (p = 0.25; Kruskal–Wallis test).
Nutrients 13 02984 g002
Figure 3. Flow cytometry patterns after a median of two years on a gluten-free diet, depending on the different age groups (n = 56).
Nutrients 13 02984 g003
Table 1. Association between malabsorption features at presentation and age at CD diagnosis.
Malabsorption FeatureAge 50–59 Years (n = 62)Age 60–69 Years (n = 37)Age ≥70 Years (n = 24)p-Value
At least one feature42 (67.7%)27 (73%)17 (70.8%)0.85
Diarrhoea16 (25.8%)14 (37.8%)7 (29.2%)0.46
Iron-deficiency anaemia18 (29%)13 (35.1%)10 (41.7%)0.51
B12 deficiency3 (4.8%)2 (5.4%)1 (4.2%)1
Folate deficiency1 (1.6%)1 (2.7%)1 (4.2%)0.76
Non-Malabsorption Feature
IBS-dyspepsia-bloating32 (51.6%)13 (35.1%)8 (33.3%)0.17
Osteopenia/osteoporosis9 (14.5%)4 (10.8%)1 (4.2%)0.48
Dermatitis herpetiformis4 (6.5%)4 (10.8%)00.26
Hypertransaminasemia3 (4.8%)3 (8.1%)2 (8.3%)0.70
Other6 (9.7%)4 (10.8%)6 (25%)0.17
p-values were obtained with the Chi-square test.
Table 2. CD diagnosis sensitivity of the two coeliac cytometric patterns in patients with villous atrophy in function of the age group.
Flow Cytometry CD Pattern **Age 50–59 Years (n = 38)Age 60–69 Years (n = 18)Age ≥70 Years (n = 15)Overall Cohort
(n = 71)
TCRγδ+ >10%
Increase in TCRγδ+94.7%88.9%86.7%90.1%
Coeliac lymphogram *92.1%77.8%86.7%85.5%
TCRγδ+ >14%
Increase in TCRγδ+84.2%83.4%53.3%73.6%
Coeliac lymphogram *84.2%77.8%53.3%71.7%
* Coeliac lymphogram was defined as an increase in TCRγδ+ cells according to each cut-off, plus a concomitant decrease in CD3− cells <10%; ** Comparison using the McNemar’s test between the two TCRγδ+ cut-offs (>10% vs. >14%): p = 0.008; comparison using Chi-square test between 50–69 vs. ≥70 years groups for the TCRγδ+ >14% cut-off: p = 0.02.
Table 3. CD diagnosis sensitivity of the two coeliac cytometric patterns in patients with Marsh 1 in function of the age group.
Flow Cytometry CD PatternAge 50–59 Years (n = 7)Age 60–69 Years (n = 5)Age ≥70 Years (n = 4)Overall Cohort
(n = 16)
TCRγδ+ >10%
Increase in TCRγδ+85.7%100%75%86.9%
Coeliac lymphogram *85.7%80%25%63.5%
TCRγδ+ >14%
Increase in TCRγδ+71.4%80%75%75.5%
Coeliac lymphogram *71.4%60%25%52.1%
* Coeliac lymphogram was defined as an increase in TCRγδ+ cells according to each cut-off plus a concomitant decrease in CD3− cells <10%.
Publisher’s Note: MDPI stays neutral with regard to jurisdictional claims in published maps and institutional affiliations.

